Magnetostrictive Microcantilever as an Advanced Transducer for Biosensors
by
Liling Fu
1,
Suiqiong Li
1,
Kewei Zhang
1,
I-Hsuan Chen
2,
Valery. A. Petrenko
2 and
Zhongyang Cheng
1,* 
1
Materials Research and Education Center, Auburn University, Auburn, AL 36849, USA
2
Department of Pathobiology, Auburn University, Auburn, AL 36849, USA
*
Author to whom correspondence should be addressed.
Sensors 2007, 7(11), 2929-2941; https://doi.org/10.3390/S7112929
Submission received: 18 October 2007
/
Accepted: 21 November 2007
/
Published: 22 November 2007
(This article belongs to the Special Issue Cantilever, Microcantilevers and Nanocantilever Sensors and Biosensors)
Abstract
:The magnetostrictive microcantilever (MSMC) as a high-performance transducer was introduced for the development of biosensors. The principle and characterization of MSMC are presented. The MSMC is wireless and can be easily actuated and sensed using magnetic field/signal. More importantly, the MSMC exhibits a high Q value and works well in liquid. The resonance behavior of MSMC is characterized in air at different pressures and in different liquids, respectively. It is found that the Q value of the MSMC in water reaches about 40. Although the density and viscosity of the surrounding media affect the resonance frequency and the Q value of MSMC, the density has a stronger influence on the resonance frequency and the viscosity has a stronger influence on the Q value, which result in that, for MSMC in air at pressure of less than 100 Pa, the resonance frequency of MSMC is almost independent of the pressure, while the Q value increases with decreasing pressure. MSMC array was developed and characterized. It is experimentally demonstrated that the characterization of an MSMC array is as simple as the characterization of a single MSMC. A filamentous phage against Salmonella typhimurium was utilized as bio-recognition unit to develop an MSMC based biosensor. The detection of S. typhimurium in water demonstrated that the MSMC works well in liquid.
1. Introduction
Each biosensor has two primary components: bio-recognition element and transducer. The bio-recognition element, such as antibody and phage, is highly specific to the target species [1-4]. The reaction between the target species and the bio-recognition unit would result in some changes in the physical/chemical properties of the recognition unit. These changes are measured using a transducer. Different types of transducers have been developed and extensively investigated in recent years. One important type of the transducer is the acoustic wave (AW) device [5-14], which is an acoustic resonator and works as a mass sensor. That is, the reaction between the bio-recognition component and the target species results in a change in the mass load of the transducer/resonator, which shifts the resonance frequency. Thus, by monitoring the resonance frequency of the AW device, the reaction between the bio-recognition unit and the target species, such as captured bacterium cells by antibody/phage, can be determined. An AW device as a transducer used in biosensors is characterized using two critical parameters: mass sensitivity (Sm) and quality merit factor (or Q value) [9, 12, 14-16]. The mass sensitivity is defined as the shift in resonance frequency due to the attachment of a unit mass, while the Q value reflects the mechanical loss of the devices and characterizes the sharpness of the resonance peak in the amplitude/phase versus frequency plot. A higher Sm means a more sensitive device, while a higher Q value represents a capability to determine a smaller change in resonance frequency (i.e. a higher resolution in determining resonance frequency). Therefore, it is highly desirable for an AW device to have a higher Sm and a larger Q value. Among all AW devices, micro/nano-cantilever exhibits extremely high sensitivity primarily due to its small mass [17-20]. For example, the detection of a mass as small as 10-18 g using cantilever has been demonstrated. Therefore, a great deal of efforts has been spent on the development of micro/nano-cantilever based biosensors. However, the current cantilever used in liquid exhibits a small Q value, which makes the cantilevers work poorly in liquid. For example, the Q value of these cantilevers in liquid is barely more than 10 [12, 14]. This is really a challenge for cantilever-based biosensors since most of the samples to be tested are liquid.
Different types of cantilevers made of different materials have been developed as transducers used in biosensors [12, 14, 17, 19-21]. In terms of actuating and sensing technologies, all the cantilevers can be classified into two types: passive and active. The passive cantilevers, such as silicon-based cantilevers, require a separated system to actuate the device and usually use a separated optic system to measure/monitor the vibration of the device. On the other hand, the active cantilevers, such as piezoelectric-based cantilevers, can be easily actuated by simply applying a driving field, such as an electric field in the piezoelectric case, and the vibration behavior of the active cantilever can be easily sensed/monitored, such as by measuring impedance in the piezoelectric case. Due to the easiness and availability of the micro/nano-fabrication technology, silicon-based cantilevers are much more widely investigated than others. Additionally, silicon-based cantilevers exhibit a higher Q value than piezoelectric-based cantilevers.
Recently, we introduced a novel type of active cantilever – magnetostrictive microcantilever (MSMC) as a high-performance transducer for biosensor development [9]. The MSMC is wireless, works well in liquid, and exhibits a much higher Q value than other cantilevers [9]. In this article, the principle of the MSMC and technology used to characterize the MSMC are discussed and the recent development of the MSMC array is reported. The performance of the MSMC in different media is also reported. Additionally, the detection of Salmonella typhimurim in water was conducted to demonstrate the advantages of an MSMC as a transducer for biosensors.
2. Experimental Details
2.1 Cantilever fabrication
The MSMCs used in the experiments are unimorph type cantilevers. A cantilever beam consists of two layers: one active layer and one inactive layer. The active layer is an amorphous magnetostrictive alloy, the Metglas™ 2826 MB ribbon (Honeywell, Morristown, NJ) in thickness of 20 μm. The inactive layer is copper sputtered on the Metglas using magnetron DC sputtering. Prior to the deposition of copper layer (10∼15 μm in thickness) onto the polished Metglas, a chromium thin film of 100 nm in thickness was deposited on the Metglas to enhance the bonding between Metglas layer and copper layer. The copper/Metglas bilayer was then cut into rectangles (strips) in different sizes. To fabricate the cantilevers, the bilayer strip was clamped at one end using a PMMA plastic holder to form the cantilever or MSMC. The cantilever was then coated with a gold layer (∼ 130 nm in thickness) by magnetron sputtering. The gold layer is employed to prevent the corrosion of the cantilever and to promote the immobilization of the bio-recognition element. Prior to the gold deposition, a thin layer of chromium with a thickness about 100 nm was sputtered on the cantilever as the adhesion layer.
2.2 Operation principle
It is known that the nth-mode bending resonance frequency of an undamped cantilever with one end rigidly clamped can be expressed as [23]:
where the
(λ0=1.875) is the dimensionless nth-mode eigenvalue, t and L are the thickness and length of the cantilever, while E, ρ, and ν are the effective Young's modulus, density, and the Poisson's ratio of the beam material.
If a mass load (Δm), which is much smaller than the mass (m) of the cantilever, is uniformly distributed on the surface of the cantilever, the change in the fundamental resonance frequency (f0) is
[15].
Therefore, the corresponding Sm of the cantilever is
where W is the width of the cantilever beam. If the Δm is at the tip of the cantilever, the Sm would be [15]
That is, the Sm of a cantilever depends on three factors: 1) the geometry of the cantilever (L and W), 2) the beam material
, and 3) the location of the mass load.
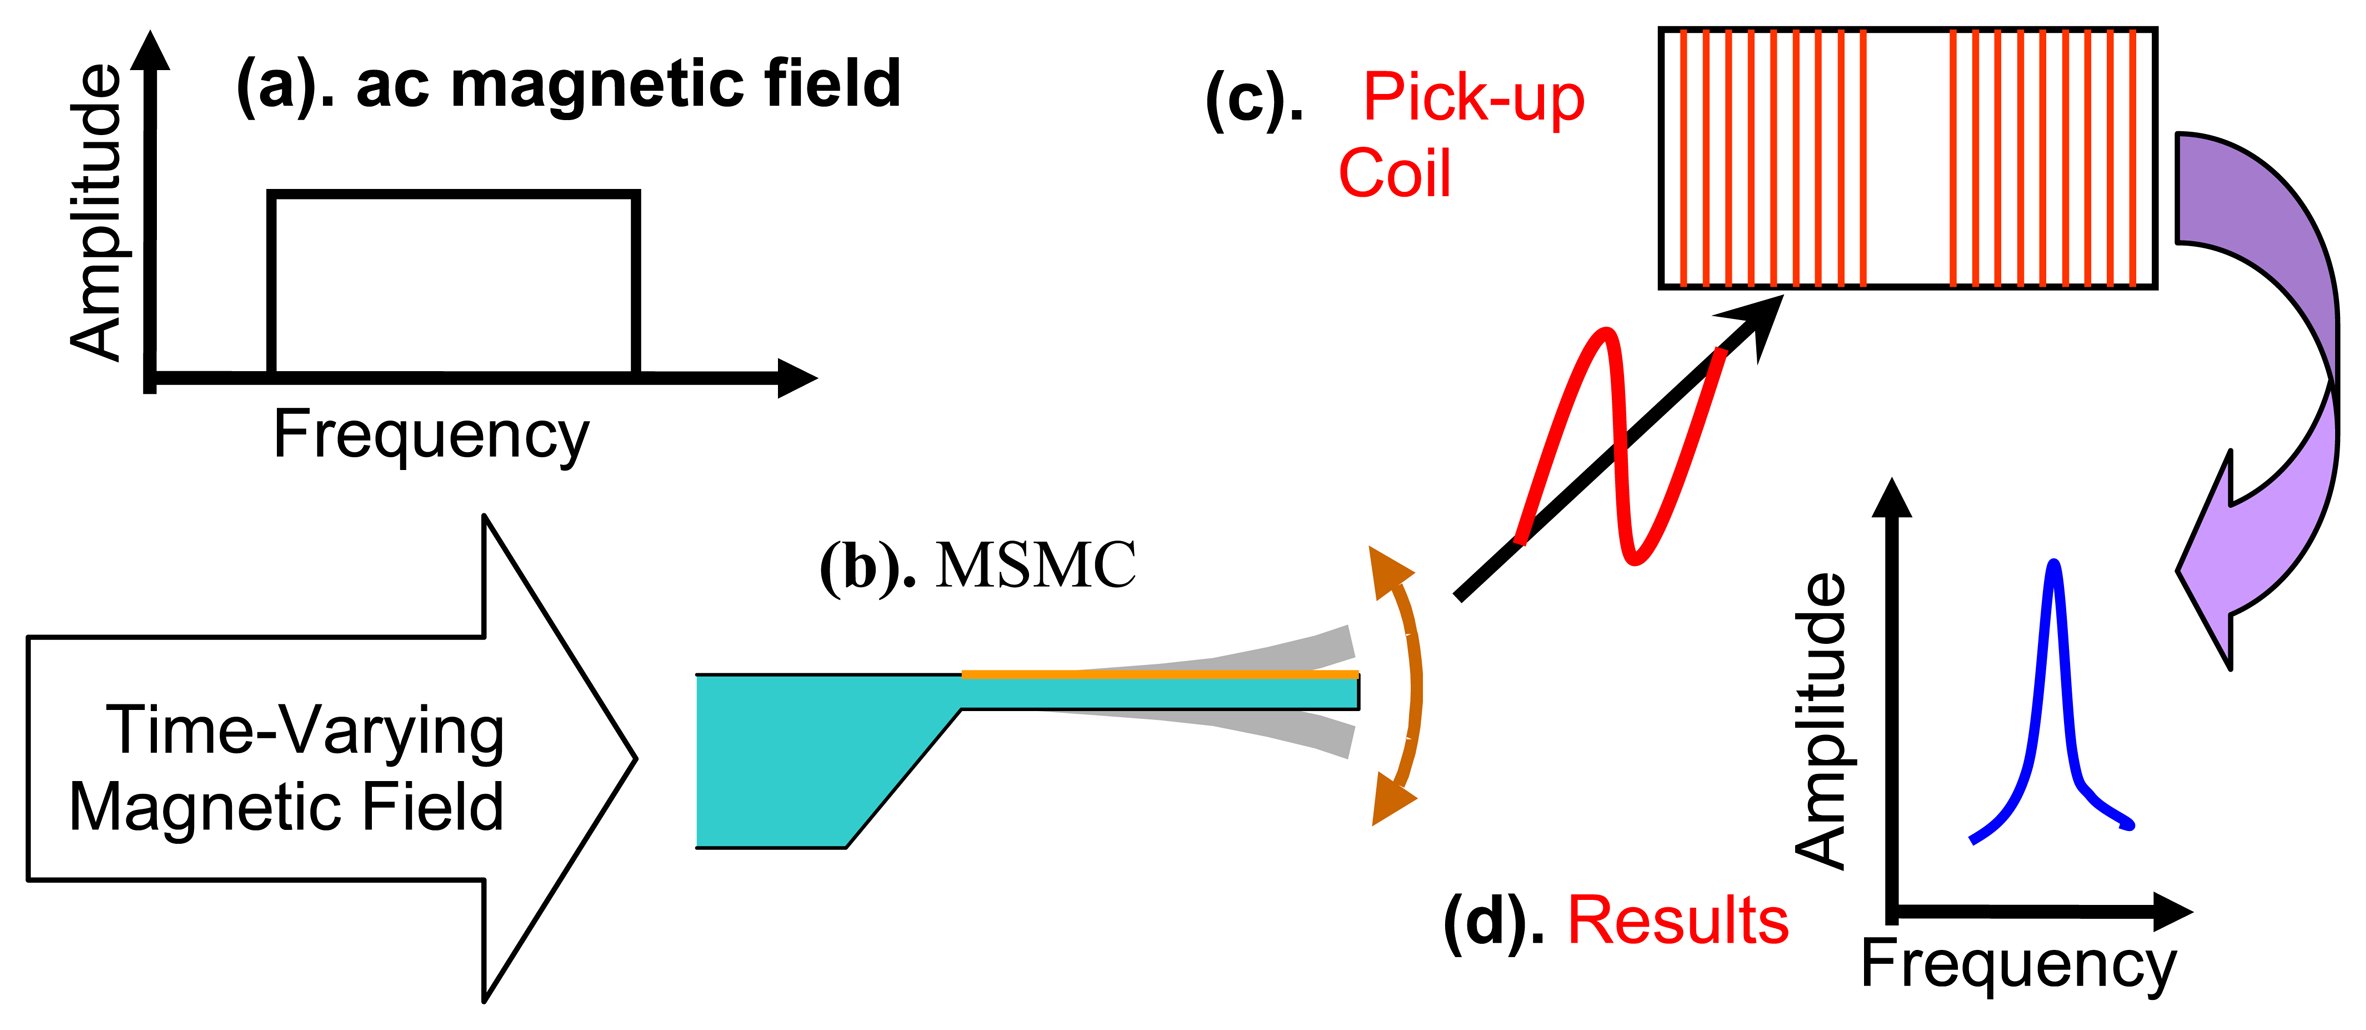
The length of the active layer in an MSMC would be changed with a magnetic field due to the magnetostrictive effect. Therefore, an applied magnetic field on an MSMC would lead to a length difference between the active and inactive layers, which would bend the MSMC since the active and inactive layers are bonded together. Therefore, a time-varying magnetic field would make an MSMC bending vibration as shown in Figure 1(b). Due to the magnetic nature of the magnetostrictive alloy, the bending vibration of an MSMC would emit a magnetic signal, which can be measured using a pick-up coil (see Figure 1(c)).
If the time-varying magnetic field is a sine wave, the bending vibration of an MSMC would also be a sine function of time. The amplitude of the bending vibration of an MSMC changes with the amplitude and frequency of the magnetic field. Additionally, there would be a phase difference between the driving magnetic field and the bending vibration. If an ac magnetic field is swept over a frequency range with a constant amplitude, as shown in Figure 1(a), the amplitude of the bending vibration of the MSMC would change with the frequency as shown in Figure 1(d). The phase difference between the magnetic field and the MSMC's bending vibration also changes with resonant frequency as shown in Figure 2 and discussed below.
2.3 Set-up for measurement
The set-up used in experiments to characterize the resonance behavior of the MSMC consists of a custom-designed Helmholtz coil and a pair of homemade pick-up coils. The Helmholtz coil consists of two pairs of coils: one pair can generate an ac magnetic field at frequency up to 500 kHz and the other pair can create a strong dc magnetic field. The MSMC was put into a chamber that was sited in the middle of the Helmholtz coil. Two pick-up coils were wound in opposite directions and connected in a series so that the output signal is zero if there was no bending vibration of the MSMC. Therefore, the output of the pick-up coils only represents the magnetic signal generated by the bending vibration of the MSMC.
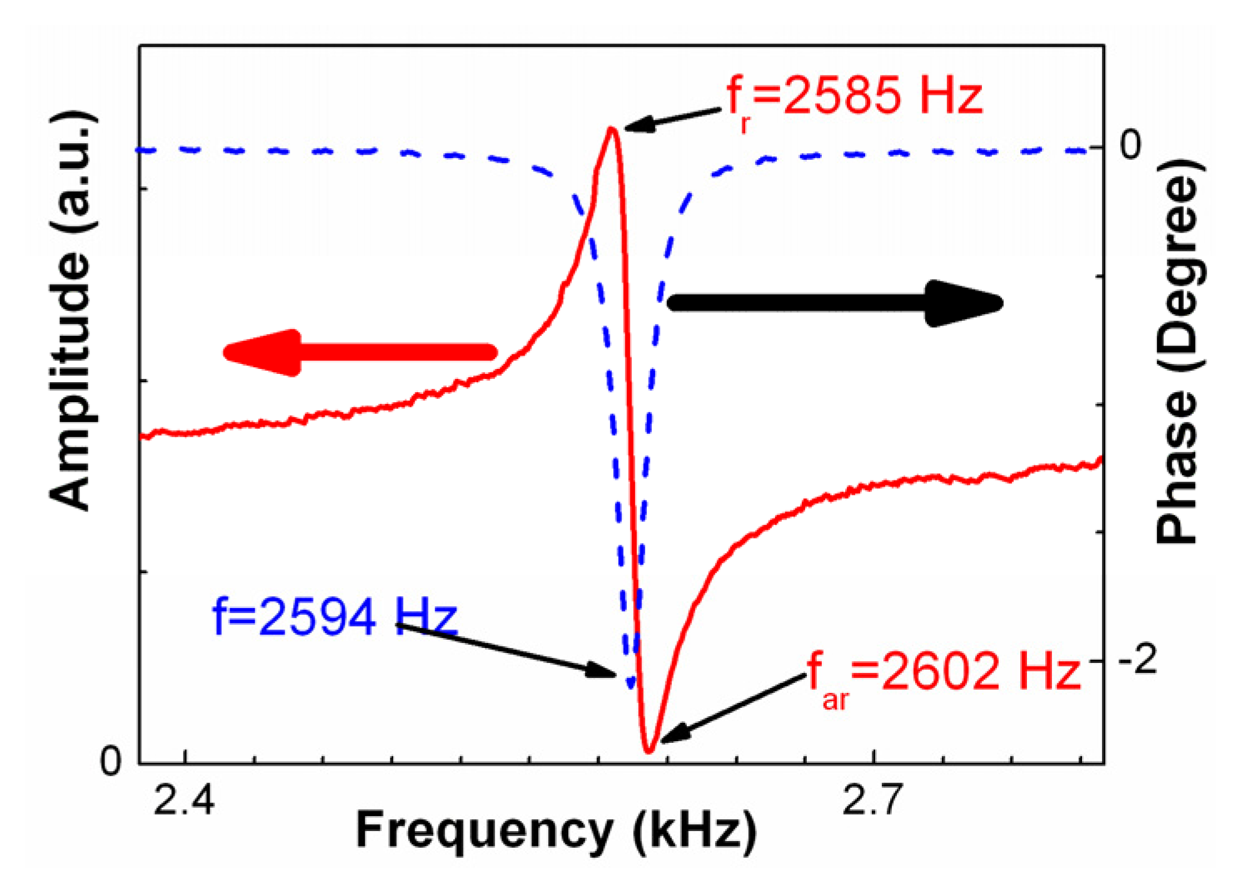
In the experiments, the amplitude of the ac magnetic field was 3.2 Oe, while the dc field was 20 Oe. The homemade pick-up coil pair, which consists of two coils, was wound outside the sample chamber to measure the magnetic signal generated by the bending vibration of the MSMC. The pick-up coil pair was connected to a lock-in amplifier (SRS830, Standford Research Systems, Sunnyvale, CA) to measure the electric potential generated in the coils, which has two outputs – the amplitude and phase of the electric potential. The amplitude of the output signal from the lock-in amplifier is proportional to the amplitude of the MSMC's bending vibration, while the phase signal represents the phase difference between the MSMC's bending vibration and the driving magnetic field. A set of typical results is given in Figure 2, where an MSMC in size of 2.8 mm (L) × 1.0 mm (W) × 35 μm (t) was operated in air. In this case, the resonance frequency (fr) and anti-resonance frequency (far) of the device are 2585 Hz and 2602 Hz, respectively.
In this study, the phase signal is used to determine the resonance behavior, the resonance frequency and the Q value, similar to the methodology used in the characterization of the other active cantilevers [15]. That is, the resonance frequency (f0) is defined as the frequency at which the phase angle reaches its minimum, while the Q value of the MSMC is defined as f0/Δf, where Δf is the width of the phase peak at its half height. For the device shown in Figure 2, the f0 determined by the phase is 2594 Hz. Clearly, the f0 determined is higher than the real resonance frequency and smaller than the anti-resonance frequency of the device.
2.4 MSMC operated in different media
The resonant behavior of MSMCs in air at different pressures was investigated at room temperature. In the experiments, the pressure of the test chamber was obtained by a Varian SD-300 mechanical pump and monitored using a Varian multi-Gauge. A three-way control valve, which connected the mechanical pump, thermal couple sensor, and the test chamber containing the MSMC, was employed to maintain a given pressure. After the pressure reached the designated pressure and was maintained for about 10 minutes, the resonance behavior of the MSMC was measured and recorded.
To determine the influence of the liquid media, the resonance behavior of an MSMC in water and ethanol, respectively, was measured. In the experiments, the MSMC was completely immersed in liquid.
2.5 Phage and its immobilization
In the experiments, filamentous phage against Salmonella typhimurium was employed as the bio-recognition element to capture the target S. typhimurium cells. The phage E2 displaying foreign peptide VTPPTQHQ used here is a specific and selective probe for detecting S. typhimurium [24-26]. The phage was immobilized onto the surface of an MSMC by direct physical absorption. That is, an MSMC with a freshly sputtered gold layer was immersed in 1.0 ml of phage E2 culture with the concentration of 1.06 × 10¹² virions/ml for 80 minutes with rotating. Then, the MSMC was rinsed three times using sterile distilled water. The MSMC thus made is a biosensor and is ready for detection of S. typhimurium.
2.6 Real time detection of S. typhimurium cells in water
The performance of the biosensors, MSMCs coated with phage against S. typhimurium, was evaluated by completely immersing the biosensors in 2 ml of the suspension of S. typhimurium (ATCC 13311) in water, which was obtained from the American Type Culture Collection (Manassas, VA) and confirmed for identity. The bacterium suspension was prepared and maintained at 4 °C. The concentration of the bacterium suspension was 5 × 10⁸ cells/ml. After the MSMC-biosensor was immersed into the bacterium suspension, the resonance frequency of the sensor was monitored and recorded continuously for two hours. After that, the MSMC-sensor was rinsed three times using DI water and then dried. In order to observe the bacterium cells captured on the sensor surface using scanning electron microscopy (SEM), the dried sensor was exposed to OsO4 for one hour. Then, the sensor surface was coated with a very thin gold layer (about 50nm) using PELCO SC-6 Sputter Coater. The SEM observation of S. typhimurium cells on the sensor surface was performed using a JEOL-7000F SEM operated at 20 keV.
3. Results and Discussion
3.1 Resonance behavior of MSMCs operated in different media
It is well known that the resonance behavior of all AW devices changes with different media due to the damping effect. The damping effect results in a lower resonance frequency and a smaller Q value. That is, the influence of the damping effect on the resonance behavior has some similarity with the mass influence on the resonance behavior. The damping effect of a medium on an AW device depends on the medium (density and viscosity) and the AW device (structure, dimension, and vibration mode).
For cantilevers in air, it is known that the Q value changes with the geometry of the cantilever and the viscosity of the media as [27, 28]
where L, W, t, and μ are the length, width, thickness of the cantilever beam, and the viscosity of the media, respectively. Equation (4) shows that the Q value is linearly dependent on the reciprocal of the viscosity. It is also indicated that the Q value is strongly dependent on the geometry of the cantilever. That is, the Q value increases with decreasing length, while it increases with increasing thickness and width. Therefore, if an MSMC with smaller length is used, the Q value would be higher than what is reported here. For a damped cantilever, the oscillation reaches a maximum at a frequency (fr), apparent resonance frequency, lower than the real resonance frequency (fn) as [29]
To determine the damping effect of air and liquid on the MSMC experimentally, the resonance behavior of MSMCs was characterized in air at different pressures and in different liquid media.
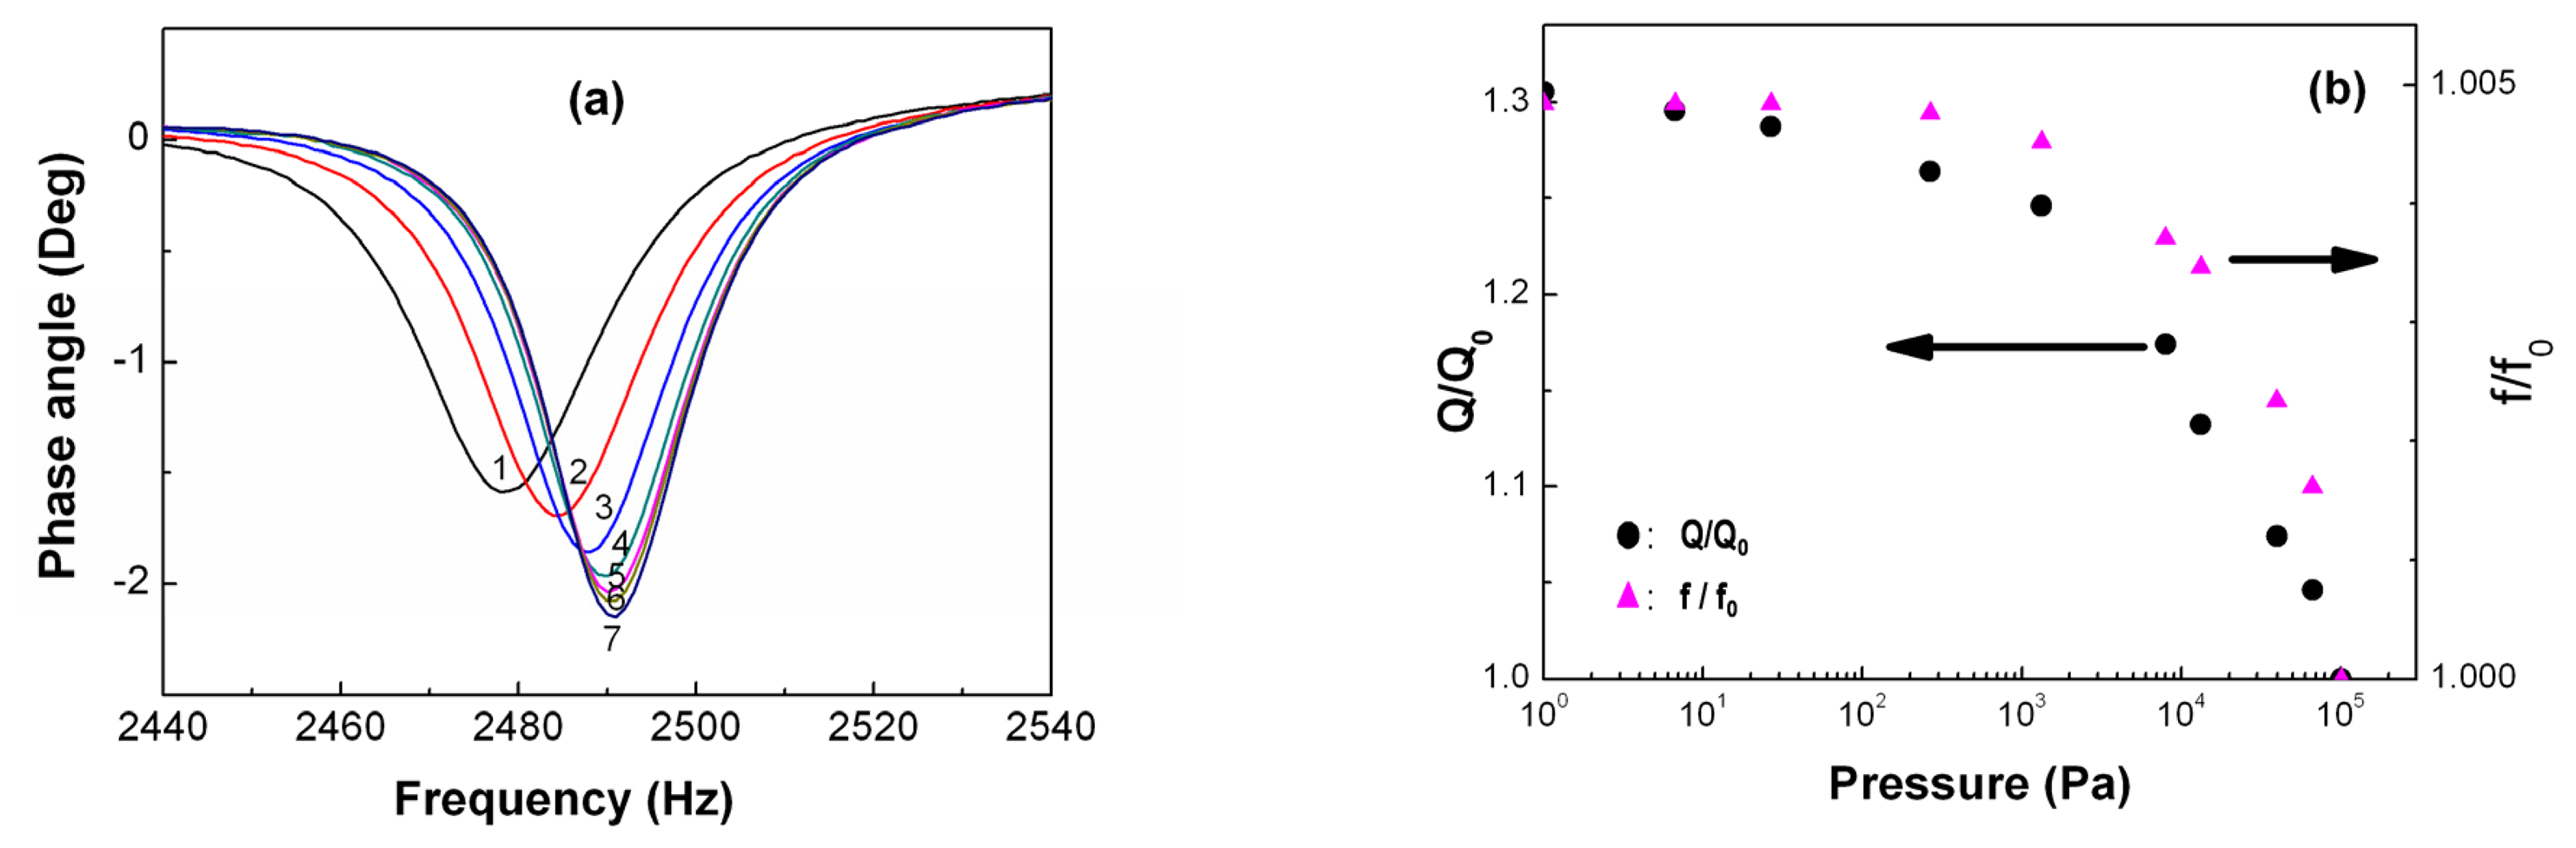
A set of experimental results about the pressure dependence of the resonance behavior is shown in Figure 3(a), in which an MSMC in the size of 3.0 mm (L) × 1.0 mm (W) × 35 μm (t) was used. The corresponding resonance frequency and Q value of the MSMC at each pressure are plotted in Figure 3(b), in which the normalized resonance frequency and the normalized Q value are used. The normalized resonance frequency is the resonance frequency of the MSMC at a given pressure divided by the resonance frequency (f0) of the MSMC at one atmosphere pressure, while the normalized Q value is the Q value of the MSMC at the pressure divided by the Q value of the MSMC at one atmosphere pressure.
As shown in Figure 3(a), the resonance frequency increases as the pressure decreases. The resonance frequency of the MSMC is 2478 Hz at one atmosphere pressure (1.0 × 10⁵ Pa) and 2491 Hz at 1 Pa. As expected from Equations (4) and (5), both the resonance frequency and the Q value of the MSMC change with pressure. For the pressure above 103 Pa, the resonance frequency and the Q value are strongly dependent on the pressure. When the pressure is lower than 100 Pa, the resonance frequency is almost independent on the pressure, but the Q value continuously increases with lowering pressure. This is easy to understand based on equations (4) and (5). Based on equation (4), the Q value is directly related to the viscosity, which is related to the pressure. However, when the pressure is very small at which the MSMC exhibits a high Q value, equation (5) indicates that the frequency is very weakly dependent on the Q value. For MSMCs at low pressures, the Q value is mainly determined by the anchor effect due to the fact that the PMMA used as a holder has a much smaller Young's modulus than the cantilever beam [9].
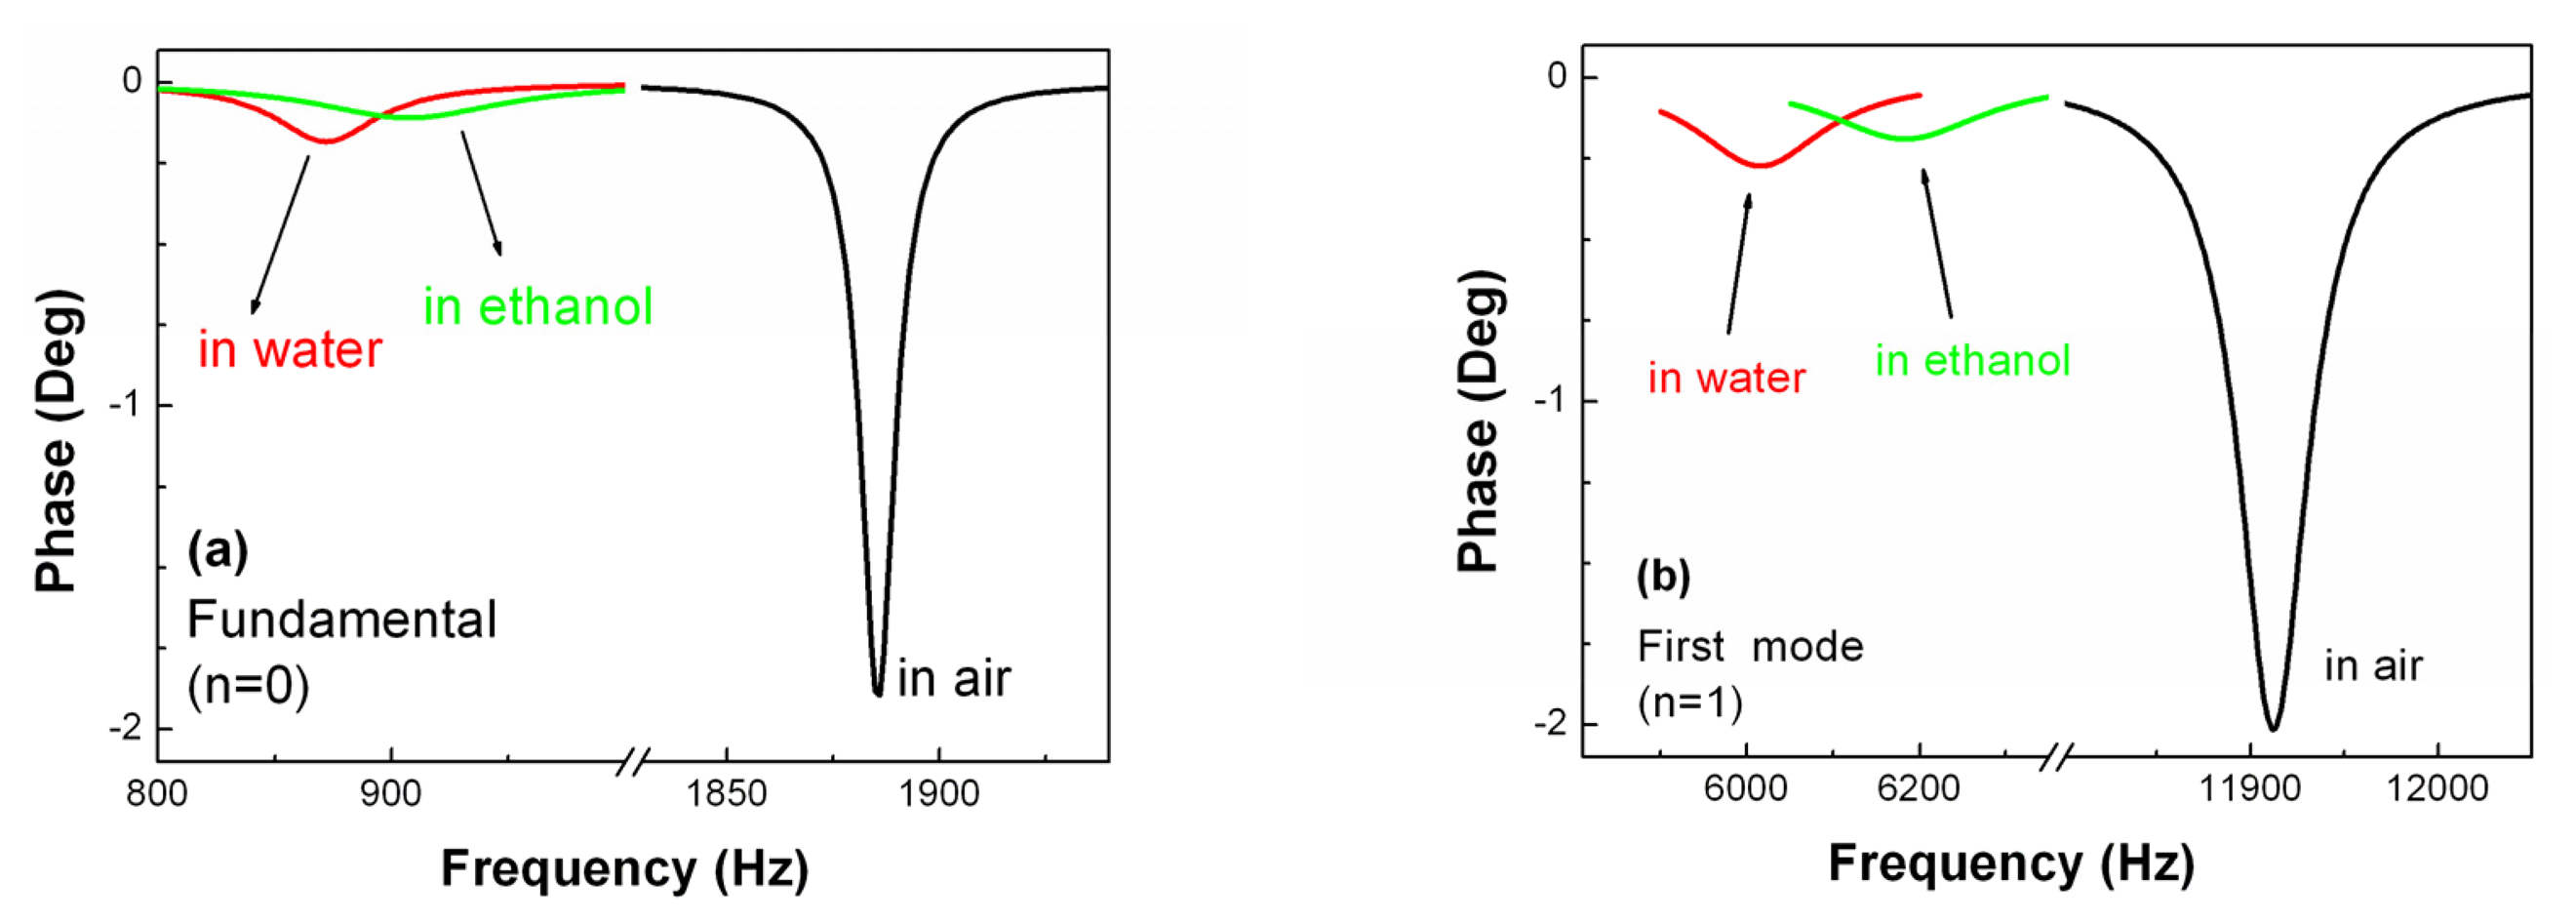
The results shown in Figure 4 were obtained from an MSMC in size of 3.3 mm (L) × 1.0 mm (w) × 30 μm (t) when it was immersed in water and ethanol, respectively. The resonance behaviors of the fundamental mode (n=0) and the first mode (n=1) are presented. Clearly, the device in liquid exhibits a lower resonance frequency and a smaller Q value than the device in air due to the damping effect of the liquid. However, the reductions in the resonance frequency and the Q value in two liquids are different, as summarized in Table 1.
It is found that the first mode exhibits a higher Q value than the fundamental mode. As discussed in Ref. 9, this is a result of anchor loss (support loss) due to the fact that PMMA was used to clamp the cantilever and has a much smaller Young's modulus than Metglas and copper. That is, the anchor loss has a stronger influence on a lower harmonic mode than a higher mode. For the MSMC in water, the Q value reaches about 40. Considering that other cantilevers in aqueous solutions rarely have a Q value above 10 [12, 14], the MSMC in water exhibits a significantly higher Q value. Therefore, the MSMC would have a better performance in liquid, which is critical for the development of high-performance biosensors since most of the samples to be tested are liquid or water suspensions.
It is known that at 20°C the viscosity of water and ethanol is 1.0 × 10⁻³ kg/m•s and 1.2 × 10⁻³ kg/m•s, respectively, and the density of water and ethanol is 1.0 × 10³ kg/m3 and 0.789 × 10³ kg/m3, respectively [30]. This is similar to the results obtained in other cantilevers [30, 31], although both the density and viscosity of the liquid have a strong influence on the resonance behavior – resonance frequency and the Q value – their influence on the resonance frequency and the Q value is different. Comparing the results shown in Table 1 with the density and viscosity data of the liquid media, we can conclude that the resonance frequency of an MSMC in liquid is mainly determined by the density of the liquid, while the Q value of an MSMC in liquid is mainly determined by the viscosity of the liquid.
3.2 MSMC Array
As indicated by Eq. (1), the resonance frequency of a cantilever is directly dependent on the properties (Young's modulus and density) of the cantilever materials and the geometry (length and thickness) of the cantilever, all of which are dependent on the temperature. Therefore, the resonance frequency of a cantilever would change with the environmental temperature. Additionally, as shown above, the resonance frequency of a cantilever changes with the surrounding medium, such as the density and viscosity of the medium. For a practical detection, it is highly desirable to monitor the influence of environment on the resonance behavior of cantilevers. One way to do it is by using cantilever array, in which some of the cantilevers would not react with the target so that they can be used as references to monitor the change in the environment. More importantly, a cantilever array would provide the capability for a biosensor to detect/monitor different targets at the same time. It is easy to fabricate the cantilever array for current cantilevers. However, the characterization of a cantilever array requires special efforts. Due to the wireless nature, an MSMC array would be easily actuated using one magnetic field, and the bending vibrations of MSMCs in the array can be easily sensed using one pair of pick-up coil. Therefore, the characterization of an MSMC array would be as simple as that of a single MSMC.
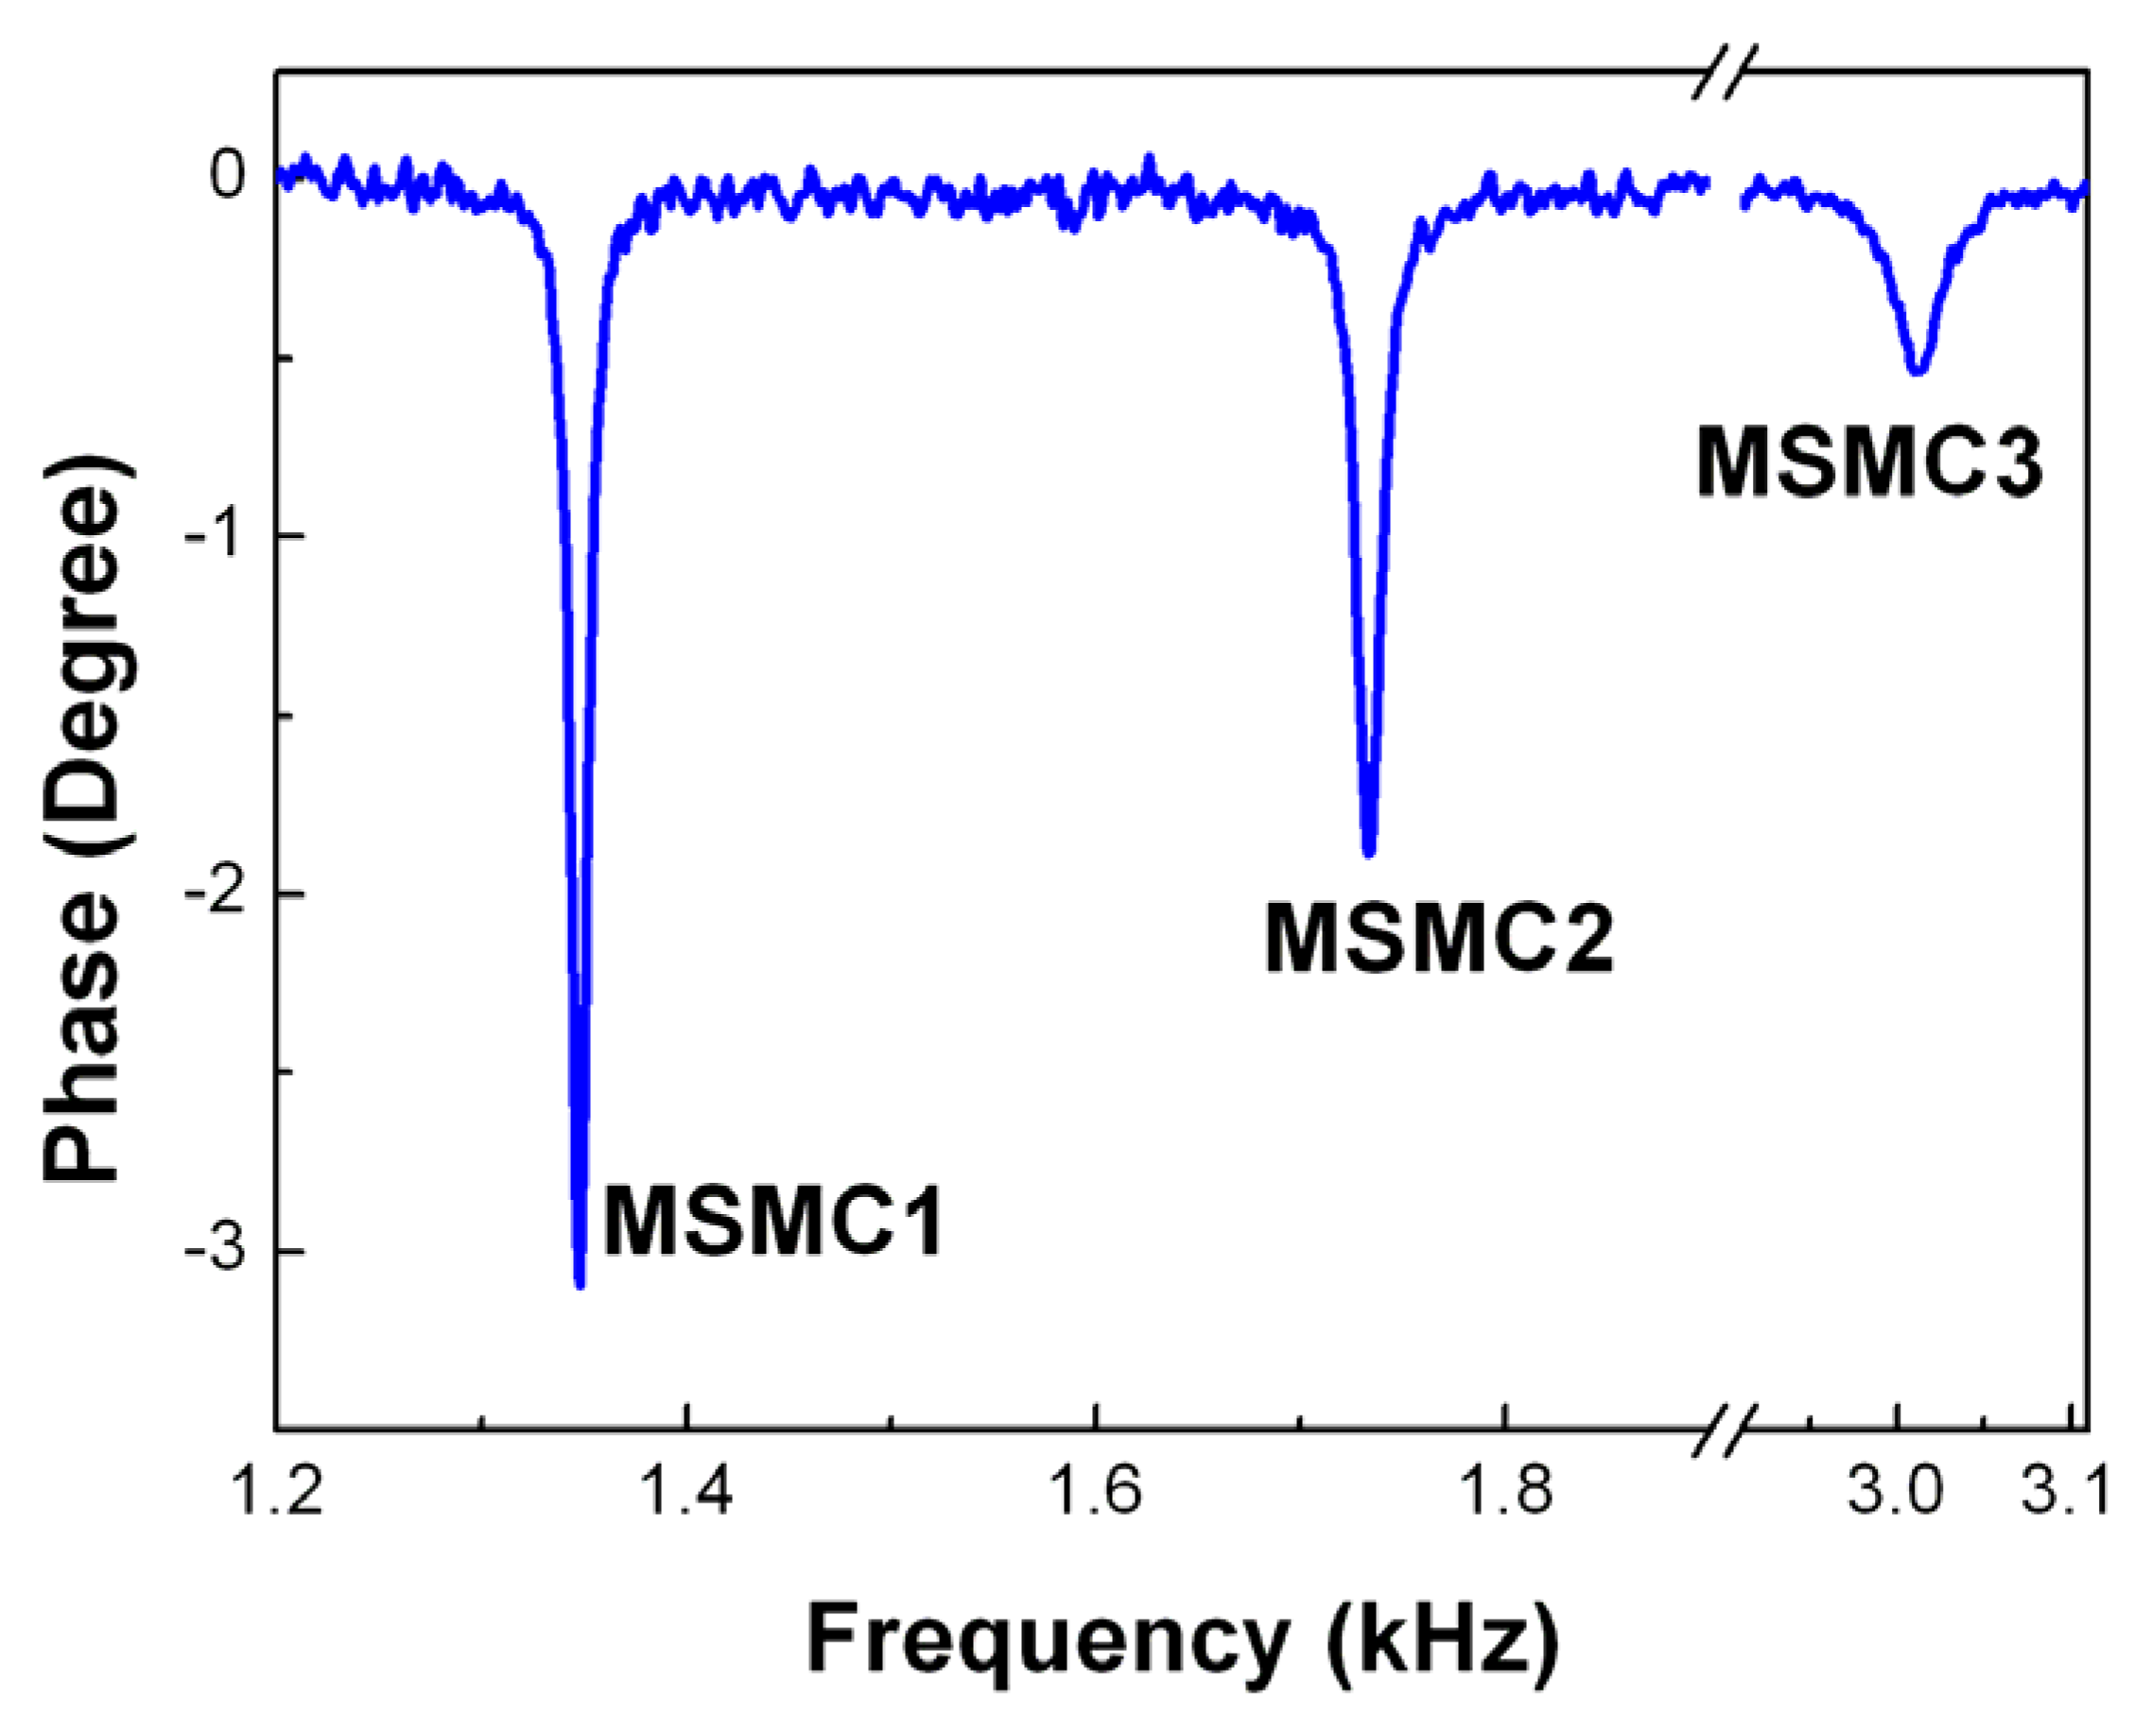
To demonstrate the advantage of the MSMC in the development of a cantilever array, an MSMC array of three MSMCs was employed. The three MSMCs were: MSMC1 (3.5 mm(L) × 1.3 mm(W) × 30 μm(t)), MSMC2 (3.3 mm(L) × 1.3 mm(W) × 30 μm(t)), and MSMC3 (2.5 mm(L) × 1.2 mm(W) × 30 μm(t)). Here, the MSMC3 had a different width than other two in order to keep the ratio of width to length smaller than half. In this experiment, the MSMC array was characterized by using the same measurement set-up and procedure as for a single MSMC. The experimental results obtained from the MSMC array are shown in Figure 5. Clearly, three resonance peaks are observed in one measurement. These three resonance peaks correspond to the fundamental resonance peaks of the three MSMCs. The results show the easiness in characterizing an MSMC array. It should be mentioned that the signal intensity of each MSMC is related to the size and the oscillation amplitude of the MSMC. As the size reduces, the intensity of the signal reduces.
3.3 Detection of S. typhimurium in water
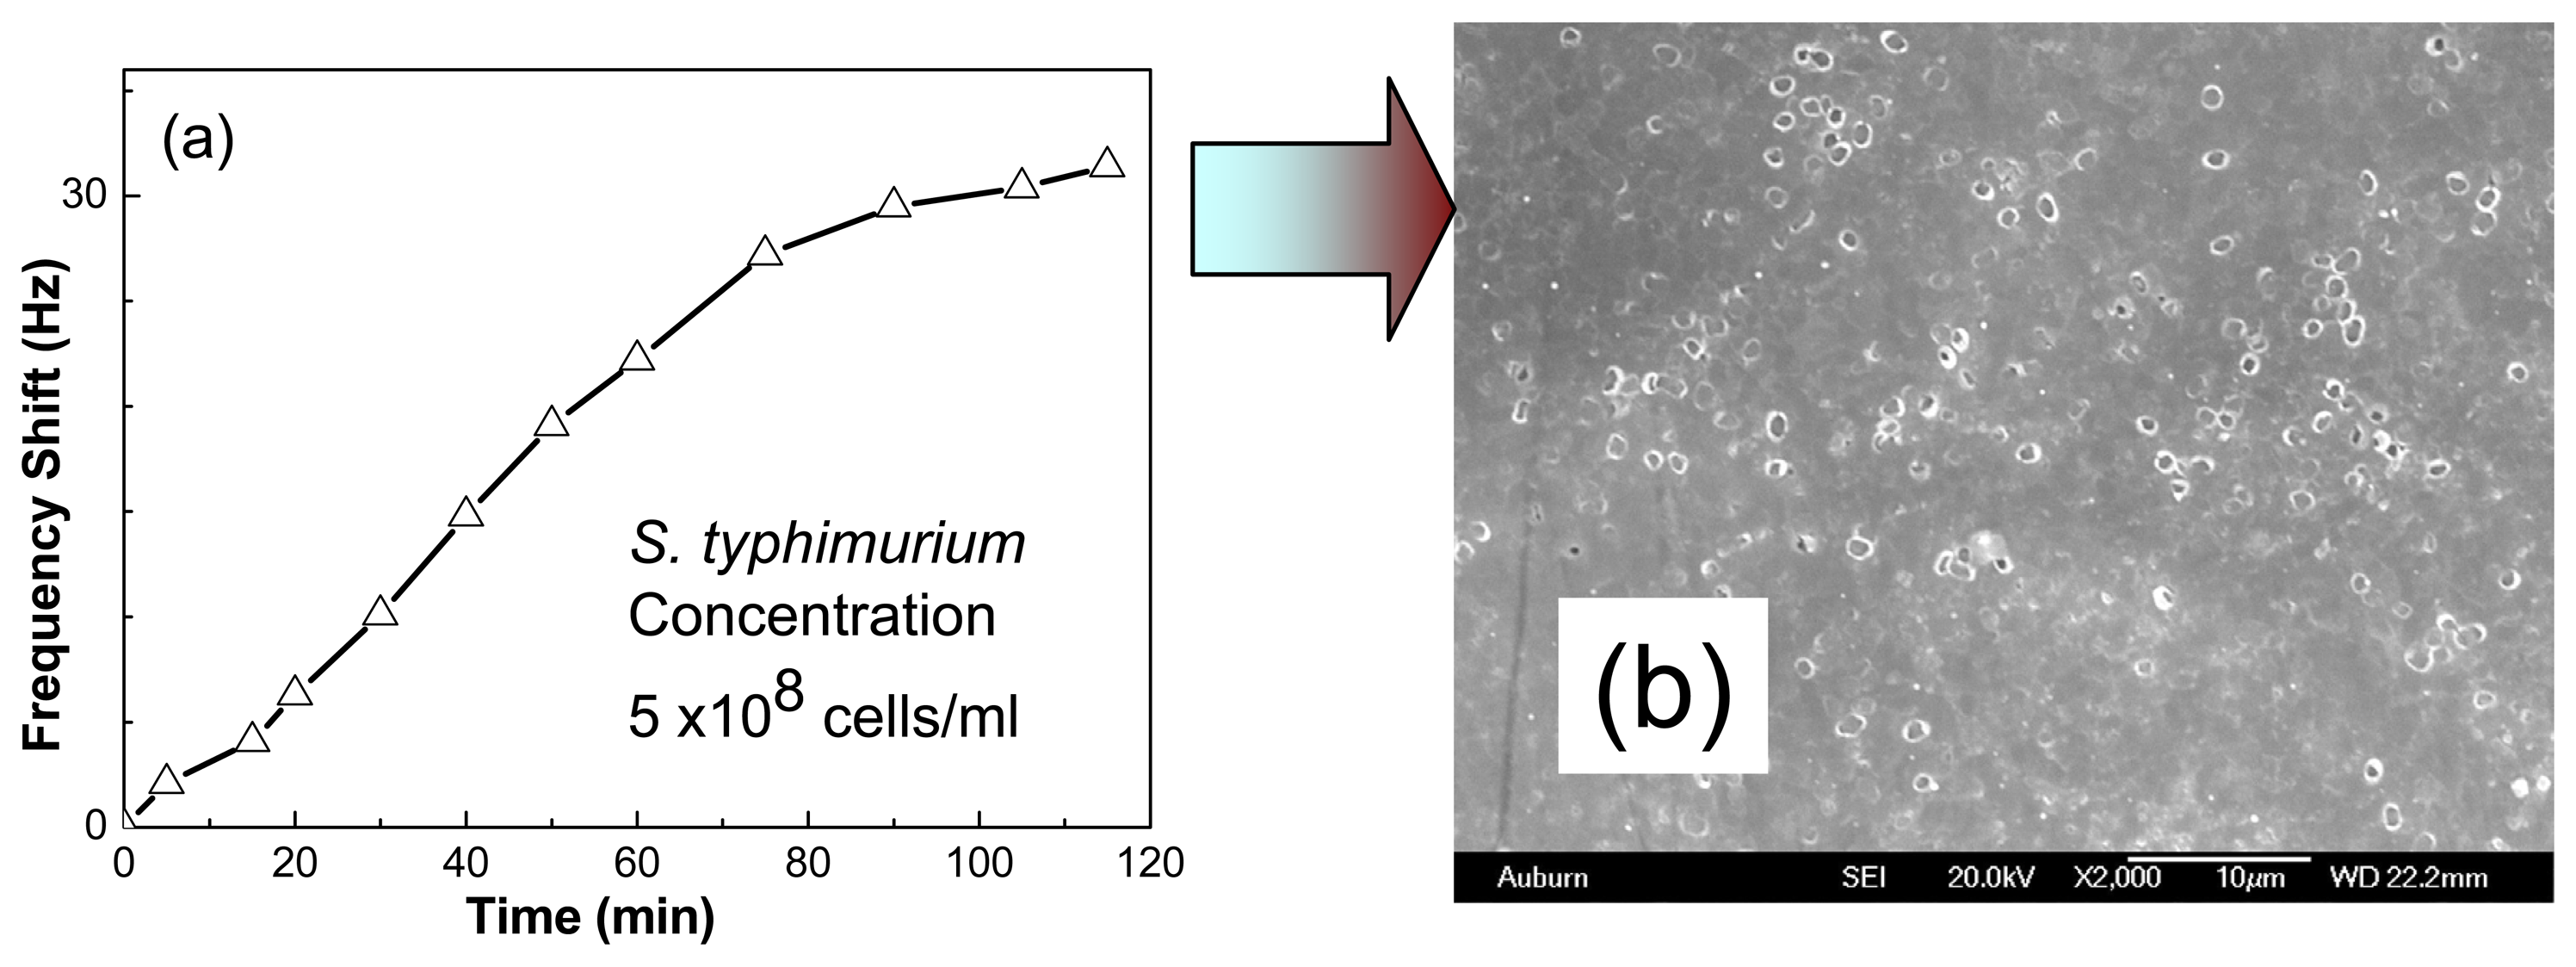
Figure 6(a) shows the real-time shift in the resonance frequency of an MSMC in size of 2.8 mm (L) × 1.0 mm (W) × 35 μm (t) after it was immersed in a S. typhimurium suspension with a concentration of 5 × 10⁸ cells/ml. The resonance frequency shifts with time as the target bacterium cells bind on the sensor surface. After about two hours, the resonance frequency shift apparently reaches its saturated value of about 35 Hz. The results demonstrate that the MSMC sensor works well in the liquid sample.
In order to determine whether the observed shift in resonance frequency is due to the binding of target bacterium cells, the SEM observation was employed. Figure 6(b) shows a typical SEM picture of S. typhimurium cells binding on the surface of the MSMC-sensor. The results confirm that the shift in resonance frequency of the MSMC-sensor is due to the binding of target cells. It is also interesting to note that the density of binding cells in the area close to the tip is higher than that in other areas. As indicated by Eq. (2) and (3), a mass load at the tip would result in a larger shift in resonance frequency than if the mass load was uniformly distributed.
Conclusions
MSMC as a new type of active cantilever was introduced as a high-performance transducer to be used in biosensors. The fundamental features and resonance behavior of the MSMC in air at different pressures and in different liquid media were studied in this work. For the MSMC in different media, it is experimentally demonstrated that both the density and viscosity of the media affect the resonance frequency and the Q value due to the damping effect, but the density has a stronger influence on the resonance frequency and the viscosity has a stronger influence than the density on the Q value. It is experimentally found that the MSMC works well in liquid with a high Q value. For example, the Q value of the MSMC in water reaches about 40. It is also experimentally demonstrated that the MSMC array can be easily actuated and sensed as a single MSMC. Finally, to demonstrate the advantage of the MSMC sensor for detecting pathogenic cells in water, the real-time detection of S. typhimurium in water was performed. The SEM observation confirmed that the shift in resonance frequency of MSMC in S. typhimurium suspension is due to the binding of target cells on the sensor surface.
Acknowledgments
The work described in this paper is partially supported by a USDA grant and a USGS grant as well as an AU Biogrant. This work is also partially supported by the FAA's Office of Aerospace Medicine, as part of the Air Transportation Center of Excellence for Airliner Cabin Environment Research. Although the FAA has sponsored this project, it neither endorses nor rejects the findings of this research.
References
- He, F. J.; Geng, Q.; Zhu, W.; Nie, L. H.; Yao, S. Z.; Meifeng, C. Rapid detection for E. coli using a separated electrode piezoelectric crystal sensor. Anal. Chim. Acta 1994, 289, 313–319. [Google Scholar]
- Dhayal, B.; Henne, W. A.; Doorneweerd, D. D.; Reifenberger, R. G.; Low, P. S. Detection of Bacillus subtilis spores using peptide-functionalized cantilever arrays. Journal of the American Chemical Society 2006, 128(11), 3716–3721. [Google Scholar]
- Kim, R.; Mulchandani, A. Affinity biosensors: techniques and protocols; Humana Press: Totowa, NJ, 1998. [Google Scholar]
- Petrenko, V.A.; Vodyanoy, V.J. Phage display for detection of biological threat agents. The Journal of Microbiological Methods 2003, 53(2), 243–252. [Google Scholar]
- Ballantine, D. S.; White, R. M.; Martin, S. J.; Ricco, A. J.; Frye, G. C.; Zellers, E. T.; Wohltjen, H. Acoustic wave sensors: theory, design and physico-chemical applications; Academic Press: Boston, 1997. [Google Scholar]
- Yang, X.; Li, Z. M.; Odum, L.; Cheng, Z.-Y.; Xu, Z. Piezoelectric diaphragm as a high performance biosensor platform. Applied Physics Letters 2006, 89(22), 223508. [Google Scholar]
- Grate, J. W.; Martin, S. J.; White, R. M. Acoustic wave microsensors. Analytical Chemistry 1993, 65(21), 940A–948A. [Google Scholar]
- Ali, Z. Acoustic wave mass sensors. Journal of Thermal Analysis and Calorimetry 1999, 55(2), 397–412. [Google Scholar]
- Li, S. Q.; Orona, L.; Li, Z. M.; Cheng, Z.-Y. Biosensor based on magnetostrictive microcantilever. Applied Physics Letters 2006, 88(7), 073507. [Google Scholar]
- Tamarin, O.; Dejous, C.; Rebiere, D.; Pistre, J.; Comeau, S.; Moynet, D.; Bezian, J. Study of acoustic Love wave devices for real time bacteriophage detection. Sensors and Actuators B-Chemical 2003, 91, 275–284. [Google Scholar]
- Su, X. D.; Low, S.; Kwang, J.; Chew, V. H. T.; Li, S. F. Y. Piezoelectric quartz crystal based veterinary diagnosis for Salmonella enteritidis infection in chicken and egg. Sensors and Actuators B-Chemical 2001, 75, 29–35. [Google Scholar]
- Lavrik, N. V.; Sepaniak, M. J.; Datskos, P. G. Cantilever transducers as a platform for chemical and biological sensors. Review of Scientific Instruments 2004, 75(7), 2229–2253. [Google Scholar]
- Hierlemann, A.; Baltes, H. CMOS-based chemical microsensors. Analyst 2003, 128, 15–28. [Google Scholar]
- Ziegler, C. Cantilever-based biosensors. Analytical and Bioanalytical Chemistry 2004, 379(7-8), 946–959. [Google Scholar]
- Yi, J. W.; Shih, W. Y.; Shih, W. H. Effect of length, width, and mode on the mass detection sensitivity of piezoelectric unimorph cantilevers. Journal of Applied Physics 2002, 91, 1680–1686. [Google Scholar]
- Lavrik, N. V.; Datskos, P. G. Femtogram mass detection using photothermally actuated nanomechanical resonator. Applied Physics Letters 2003, 82(16), 2697–2699. [Google Scholar]
- Ilic, B.; Czaplewski, D.; Zalalutdinov, M.; Craighead, H. G.; Neuzil, P.; Campagnolo, C.; Batt, C. Single cell detection with micromechanical oscillators. Journal of Vacuum Science and Technology B: Microelectronics and Nanometer Structures 2001, 19(6), 2825–2828. [Google Scholar]
- Carrascosa, L. G.; Moreno, M.; Alvarez, M.; Lechaga, L. M. Nanomechanical biosensors: A new sensing tool. TrAC - Trends in Analytical Chemistry 2006, 25(3), 196–206. [Google Scholar]
- Raiteri, R.; Grattarola, M.; Butt, H. J.; Skladal, P. Micromechanical cantilever-based biosensors. Sensors and Actuators, B: Chemical 2001, 79(2-3), 115–126. [Google Scholar]
- Burg, T. P.; Godin, M.; Knudsen, S. M.; Shen, W.; Carlson, G.; Foster, J. S.; Babcock, K.; Manalis, S. R. Weighing of biomolecules, single cells and single nanoparticles in fluid. Nature 2007, 446(7139), 1066–1069. [Google Scholar]
- Moulin, A. M.; O'Shea, S. J.; Welland, M. E. Microcantilever-based biosensors. Ultramicroscopy 2000, 82(1), 23–31. [Google Scholar]
- Bunde, R. L.; Jarvi, E. J.; Rosentreter, J. J. Piezoelectric quartz-crystal biosensors. Talanta 1998, 46(6), 1223–1236. [Google Scholar]
- Merhaut, J. Theory of Electroacoustics; Gerber, R., Ed.; McGRaw-Hill Inc.: New York, 1981. [Google Scholar]
- Petrenko, V. A.; Smith, G. P.; Gong, X.; Quinn, T. A library of organic landscapes on filamentous phage. Protein Eng. 1996, 9, 797–801. [Google Scholar]
- Sorokulova, I.B.; Olsen, E.V.; Chen, I-H.; Fiebor, B.; Barbaree, J.M.; Vodyanoy, V.J.; Chin, B.A.; Petrenko, V.A. Landscape Phage Probes for Salmonella typhimurium. The Journal of Microbiological Methods 2005, 63(1), 55–72. [Google Scholar]
- Olsen, E.V.; Sorokulova, I.B.; Petrenko, V.A.; Chen, I-H.; Barbaree, J.M.; Vodyanoy, V.J. Affinity-selected filamentous bacteriophage as a probe for acoustic wave biodetectors of. Salmonella typhimurium. Biosensors and Bioelectronics 2006, 21, 1434–1442. [Google Scholar]
- Newwell, W.E. Miniaturization of tuning forks. Science 1968, 161, 1320–1326. [Google Scholar]
- Lee, J. H.; Lee, S. T.; Yao, C. M.; Fan, W. L. Comments on the size effect on the microcantilever quality factor in free air space. J. Micromech. Microeng 2007, 17, 139–146. [Google Scholar]
- Benenson, W.; Harris, J.W.; Stocker, H.; Lutz, H. Handbook of Physics; Springer-Verlag: New York, 2002; p. 274. [Google Scholar]
- Chen, G. Y.; Warmack, R. J.; Thundat, T.; Allison, D. P.; Huang, A. Resonance response of scanning force microscopy cantilevers. Review of Scientific Instruments 1994, 65(8), 2532–2537. [Google Scholar]
- Weigert, S.; Dreire, M.; Hegner, M. Frequency shifts of cantilevers vibrating in various media. Applied Physics Letters 1996, 69(19), 2834–2837. [Google Scholar]
Figure 1.
Schematic illustration of the principle of MSMC as a transducer for biosensors.

Figure 2.
The frequency dependence of the phase and amplitude signals from the lock-in amplifier for an MSMC in size of 2.8 mm (L) × 1.0 mm (W) × 35 μm (t) in air.
Figure 2.
The frequency dependence of the phase and amplitude signals from the lock-in amplifier for an MSMC in size of 2.8 mm (L) × 1.0 mm (W) × 35 μm (t) in air.

Figure 3.
(a) The resonance behaviors of an MSMC in size of 3.0mm × 1.0mm × 35μm at room temperature in air at different pressures: 1). 1.0 × 10⁵ Pa; 2). 8.0 × 10⁴ Pa; 3). 4.0 × 10⁴ Pa; 4). 1.0 × 10³ Pa; 5). 1.0 × 10² Pa; 6). 1.0 × 101 Pa; 7). 1.0 × 100 Pa. (b) The normalized Q value (Q/Q0) (Solid Circle) and normalized resonant frequency (f/f0) (Solid Triangle) as a function of air pressure. The Q0 and f0 represent the Q value and resonance frequency of the MSMC at one atmosphere pressure.

Figure 4.
Phase versus frequency for an MSMC in air, water, and ethanol, respectively. (a) The fundamental bending mode (n=0) resonance spectra. (b) The first bending mode (n=1) resonance spectra.
Figure 4.
Phase versus frequency for an MSMC in air, water, and ethanol, respectively. (a) The fundamental bending mode (n=0) resonance spectra. (b) The first bending mode (n=1) resonance spectra.

Figure 5.
Spectrum of an MSMC array consisting of three MSMCs.

Figure 6.
(a). The resonance frequency shifts with time for an MSMC in S. typhimurium suspension with a concentration of 5 × 10⁸ cells/ml. (b). SEM images of the MSMC surface after the sensor was exposed to S. typhimurium suspension (5×10⁸ cells/ml) for about two hours.
Figure 6.
(a). The resonance frequency shifts with time for an MSMC in S. typhimurium suspension with a concentration of 5 × 10⁸ cells/ml. (b). SEM images of the MSMC surface after the sensor was exposed to S. typhimurium suspension (5×10⁸ cells/ml) for about two hours.


| Fundamental Mode (n=0) | First Mode (n=1) | |||||
|---|---|---|---|---|---|---|
| Air | Water | Ethanol | Air | Water | Ethanol | |
| Resonance frequency (Hz) | 1885 | 871 | 907 | 11912 | 6915 | 6182 |
| Q value | 191 | 19 | 9 | 265 | 38 | 27 |
© 2007 by MDPI ( http://www.mdpi.org). Reproduction is permitted for noncommercial purposes.
Share and Cite
MDPI and ACS Style
Fu, L.; Li, S.; Zhang, K.; Chen, I.-H.; Petrenko, V.A.; Cheng, Z. Magnetostrictive Microcantilever as an Advanced Transducer for Biosensors. Sensors 2007, 7, 2929-2941. https://doi.org/10.3390/S7112929
AMA Style
Fu L, Li S, Zhang K, Chen I-H, Petrenko VA, Cheng Z. Magnetostrictive Microcantilever as an Advanced Transducer for Biosensors. Sensors. 2007; 7(11):2929-2941. https://doi.org/10.3390/S7112929
Chicago/Turabian StyleFu, Liling, Suiqiong Li, Kewei Zhang, I-Hsuan Chen, Valery. A. Petrenko, and Zhongyang Cheng. 2007. "Magnetostrictive Microcantilever as an Advanced Transducer for Biosensors" Sensors 7, no. 11: 2929-2941. https://doi.org/10.3390/S7112929