Tactile Fabric Panel in an Eight Zones Structure
by
Maria Alsina
1, 
Francesc Escudero
1,
Jordi Margalef
2 and
Sonia Luengo
1 1
TT- Area Electrònica, Enginyeria i Arquitectura La Salle, Quatre Camins 30 08022 Barcelona – Spain
2
Department d’Electrònica, Enginyeria i Arquitectura La Salle, Quatre Camins 30 08022 Barcelona – Spain
Sensors 2007, 7(11), 2953-2969; https://doi.org/10.3390/s7112953
Submission received: 30 October 2007
/
Accepted: 21 November 2007
/
Published: 23 November 2007
(This article belongs to the Special Issue Intelligent Sensors)
Abstract
:By introducing a percentage of conductive material during the manufacture of sewing thread, it is possible to obtain a fabric which is able to detect variations in pressure in certain areas. In previous experiments the existence of resistance variations has been demonstrated, although some constrains of cause and effect were found in the fabric. The research has been concentrated in obtaining a fabric that allows electronic detection of its shape changes. Additionally, and because a causal behavior is needed, it is necessary that the fabric recovers its original shape when the external forces cease. The structure of the fabric varies with the type of deformation applied. Two kinds of deformation are described: those caused by stretching and those caused by pressure. This last type of deformation gives different responses depending on the conductivity of the object used to cause the pressure. This effect is related to the type of thread used to manufacture the fabric. So, if the pressure is caused by a finger the response is different compared to the response caused by a conductive object. Another fact that has to be mentioned is that a pressure in a specific point of the fabric can affect other detection points depending on the force applied. This effect is related to the fabric structure. The goals of this article are validating the structure of the fabric used, as well as the study of the two types of deformation mentioned before.
1. Introduction
Intelligent textiles, also known as smart fabrics, electronic textiles, or e-textiles, have attracted considerable attentions worldwide due to their potential to bring revolutionary impacts on human life.
Nowadays the major part of the research efforts in this topic is centered in finding the way to integrate textile and electronics. The goal is finding how to achieve natural interaction with people wearing the textile. This interaction could be achieved, for example, using the wave as interface for controlling the most common gadgets [1-4]. From this point of view, it could be possible to integrate touch pads onto jackets to control MP3 players. One way to achieve this objective is to improve the wave and the electronic system to integrate them. This means developing electronic systems on flexible supports that have to be resistant enough to allow washing and being attached to the wave without malfunctioning. While integrated in the fabric, these electronic devices act as sensors and/or data loggers.
The previous approach is not used in our research. The objective is having a wave that acts as a sensor itself, without any additional electronics. So, the basis of this study is determining the structure of the fabric and its characterization [5].
To decide the textile design, two parameters have to be considered: the type of thread and the waving pattern. These two factors determine the kind of wave, so they define the kind of sensor obtained. The fabric (and so, the sensor), admits different deformation styles. Two types of deformations are considered in our research: stretching and pressure. This article is strictly focused on pressure deformation.
2. The Structure of the Different Experiments
2.1 The test bank
First of all, it was necessary to find a controlled way of deforming the fabric without damaging the type of weave. At the same time, measuring points had to be introduced without perforating the material or it could unravel. This completely changes the characteristics of the variations in resistance and the recovery of the fabric [6-7].To meet these requirements, a test bank with the following characteristics was developed:
- To be able to change the shape of the fabric easily
- To be able to change the measuring points
- To be able to change the supply points
- To be able to change the fastening points
- To be able to change the structure and composition
To facilitate assembly, parts were developed to enable different connections. All of them have standard metric holes (3 mm diameter) which enable them to be connected to the other parts. The materials used were glass-fiber for the support and copper for the connectors. The test bank consists of 5 types of parts:
- A lateral strip: this serves as the initial support and to hold the sides of the fabric. It contains a conductive band which enables all the side of the fabric to be measured by short circuit or for the power supply to be connected to the whole side.
- Single block: this is the main part for holding the fabric. It measures 32 × 32mm. It also contains a conductive strip.
- Single connected block: this is the same as the one above but the hole is connected to the conductive strip so that it may be used as a measuring point.
- Double block: this is a part like the single block but measuring 61 × 31mm. Like the single block, the support hole is not connected to the copper base of the equipment.
- Double connected block: This part is like the double block but with its support points connected to the copper base so that it can be used as a measuring point.
The whole set of parts is as shown in Figure 1:
In Figure 2 it can be seen the set of parts photograph.
This set of parts enables us to set up the basic structure and support the fabric without needing to perforate it as it is showed in Figure 3. It can be adapted to various sizes of fabric so that experiments can be carried out on different areas. The sizes presented later were set up in the following way:
2.2 Composition of the fabric
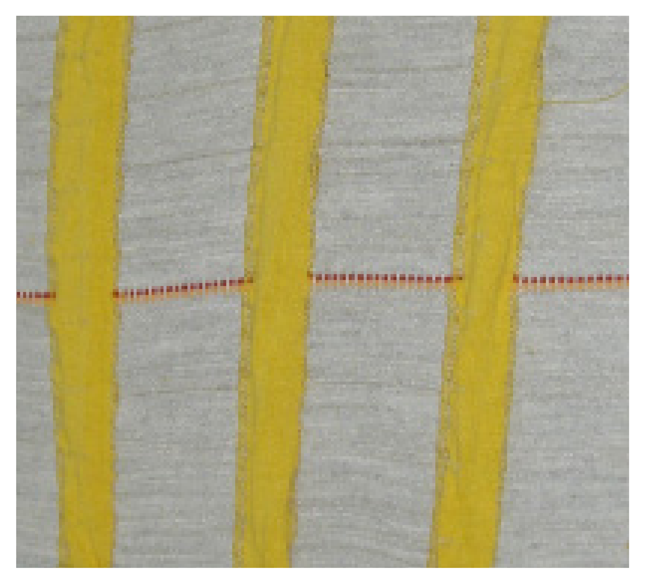
The fabric used in the tests had the following structure:
In Figure 4 it is possible to see two different strips, some yellow and some grey. The yellow colored strips are non-conductive while the grey-colored strips contain a percentage of a conductor. The direction of the weave (using Figure 4 as the reference) is horizontal. The two sections of fabric also contain a percentage of Lycra to improve their ability to recover the original shape after being deformed. The fabric was obtained without cutting the threads when they were passed from one strip to another. That is, at the back of the fabric the conductive thread passes behind the non-conductive thread until it reaches the point where the next conductive strip starts [8].
The same idea was followed with the non-conductive thread. Thus, if the resistance the fabric registers between two points along the same horizontal line is measured, it is very close to zero [2]. To enable the isolating (non-conducting) strips to function, the pass of the thread must be cut. This creates a problem because if the fabric is pulled or pressed too much the whole fabric could undo. The thread in the non-conductive strips does not need to be cut because they do not affect the measurements.
2.3 The structure of the tests
In order to determine the behavior of the fabric in different situations, various measurements were taken with the same fabric structure. To maintain the same scenario it was decided use the same numbers of conductive and non-conductive strips (4 conductive and 5 non-conductive) as can be seen in Figure 3. Due to the fabric manufacturing it was possible to get different structures cutting threads that were connecting different strips. In function of what threads were cut different scenarios were obtained, so measurements were taken in different situations:
- The response of the fabric without cutting the conductive strips
- The response of the fabric with the pass of the conductive thread cut and using soft foam to support the fabric
- The response of the fabric with the conductive thread cut and using hard foam to support the fabric
The support change is important because it changes how affect the pressure at the fabric. This change is reflected in the electronic measure and affects the result. In order to deform the different test zones, weights of 100 grams were used. Others weights were tested the results are commented in the following parts. The measurements presented in this article are taken directly from the test point on the fabric. So, the measurement device is directly connected to the threads, without any signal conditioning, neither signal processing.
3. Experiments
3.1 Results of the test in the first situation
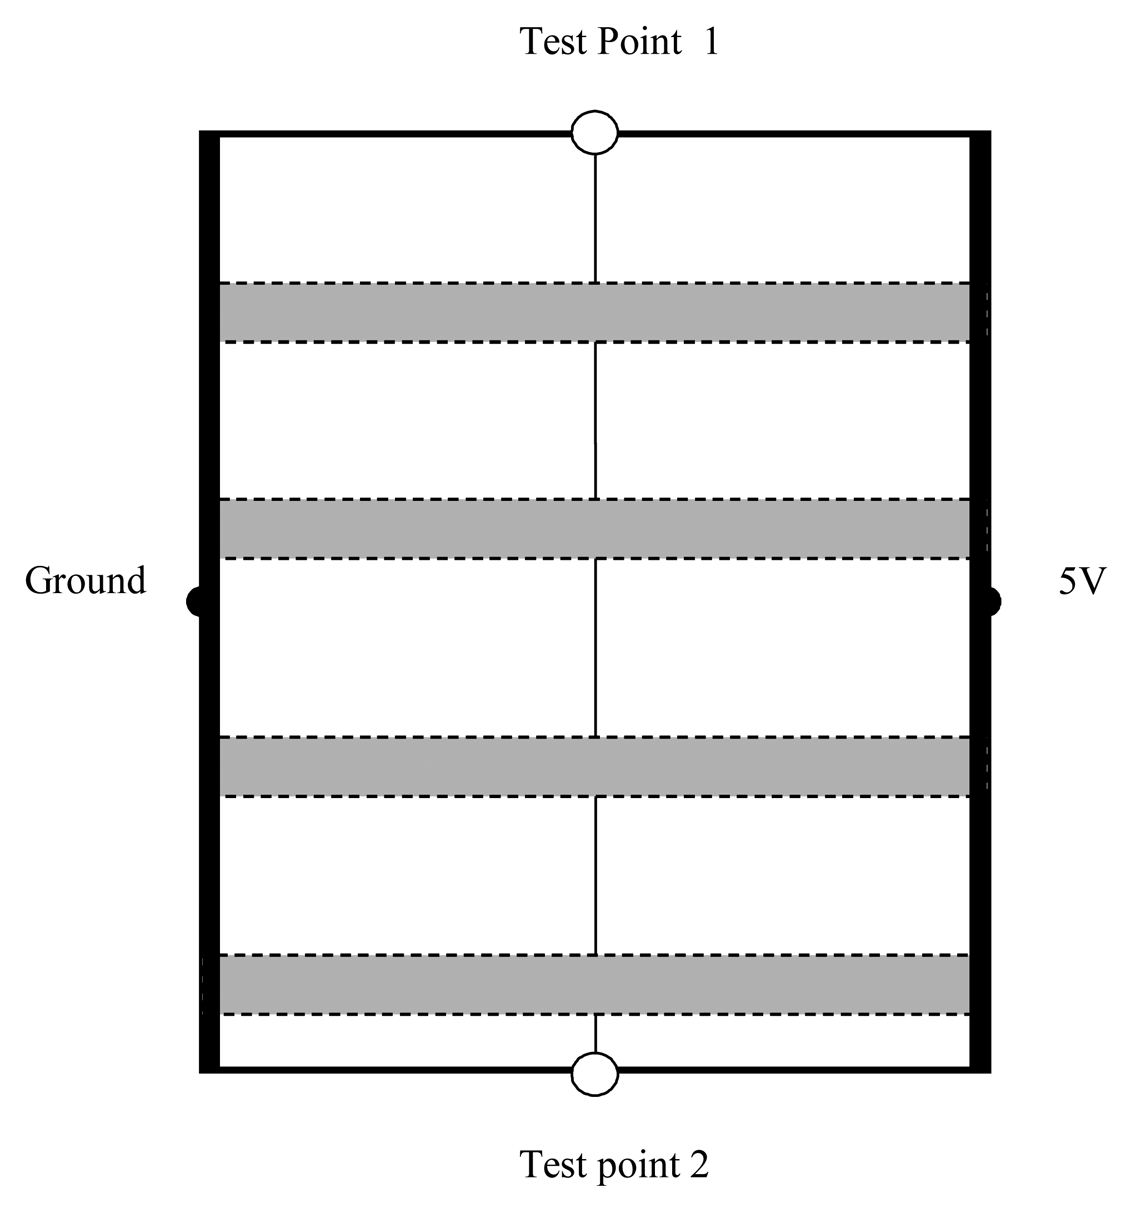
In the first scenario the conductive thread between the strips was not cut. As explained earlier, if the resistance between test points 1 and 2 in the following figure is measured, the value is practically the same because they are connected by a conductive thread. Based on this reasoning, the measurements taken were only in respect of one of the test points in Figure 5 and earth.
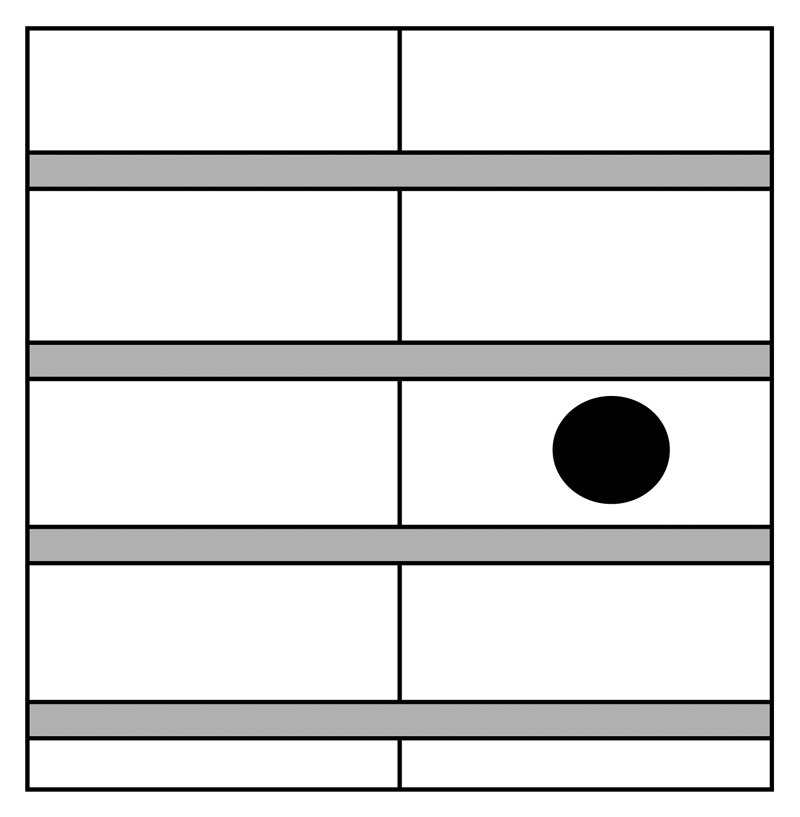
3.1.1 Weight on the right-hand side
In Figure 5 it can be seen how a 5 volt change was applied to the fabric, parallel to the direction of the weave at a distance of 26 cm. A measurement was taken in the middle of the fabric.
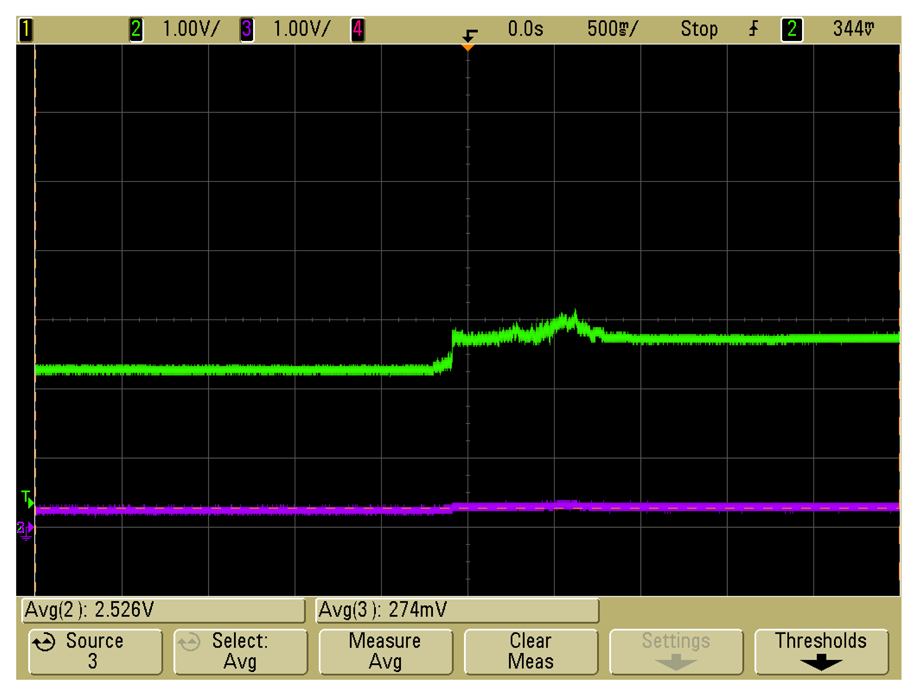
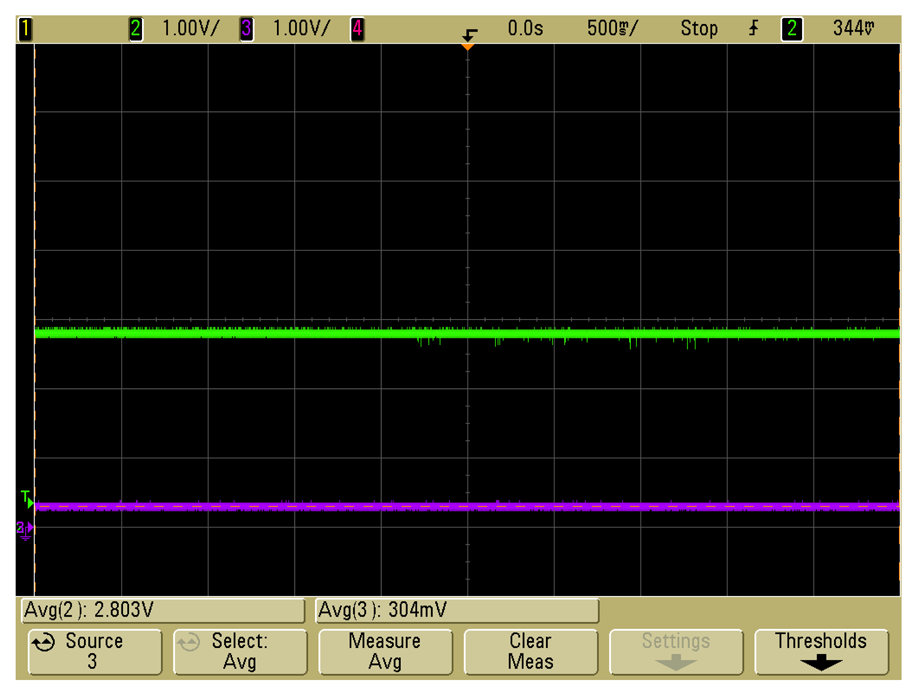
The following response was observed when the power was connected (Figure 6):
In Figure 6, the signal corresponding to the measurement point is the green one. It can be seen that the level is 2.6v, which is approximately half the voltage applied to the fabric, and following that, how the signal changes when a weight of 100 grams is applied to the right-hand side of the test piece (Figure 7). It should be noted that the starting voltage is not the same as in the previous figure because the graphs have been obtained in repeated tests in the same scenario and clearly the values obtained vary slightly due to the recovery of the fabric.
In Figure 8, it can be seen how the tension increases by 60mV, and almost 100mV at the peak. The resistance in the area where the weight is applied is reduced and so the tension at the measuring point increases. The more the resistance goes down, the more the tension increases.
When the weight is removed it can be seen that the tension does not change (Figure 9).
It is necessary to cause a greater deformation in the fabric to obtain, on the one hand, a greater variation in the tension when the weight is applied and, on the other hand, rapid recovery when the weight is removed. When a weight of only 100 grams is used, because it only causes a small deformation, the recovery is so slow that it does not register a signal.
3.1.2 Two weights on the right-hand side
Because of the previous finding, 2 weights were applied, as shown in Figure 10, and the signal measured:
An increase of approximately 1.3v was obtained in 250 ms (Figure 11) and the voltage remained stable at that value. This variation was easily detected with an analogue-digital converter. Thus, the response can be seen when the weight is removed. Figure 12 shows how that, when the weight is removed, the fabric reacts with a reduction in the tension of 1.2v in 10 ms to 3v at the measuring point. The removal of the weight causes the fabric to recover its original shape, thereby increasing its resistance because the weight is no longer squeezing the fabric's structure and short-circuiting rows of thread. This increase in resistance is detected through the reduction in voltage in the measuring point because the area of fabric on the right-hand side now shares a greater difference in voltage.
It can also be seen that the final value of 3v is far from half the tension originally applied (5v). This phenomenon is because the fabric did not completely recover its original shape.
3.1.3 Two weights on the left-hand side
The previous experiment was repeated but with the weights being placed on the other side of the fabric. The response obtained was exactly the opposite to that obtained in the first experiment.
Two weights were applied on the left-hand side of the fabric as is shown in Figure 13.
A decrease of 875mV is observed in 250ms (Figure 14). This was due to the reduction in resistance on the left-hand side which caused a reduction in the difference in the voltage measured.
In Figure 15 can be seen the increase in tension was 875mV in 250ms when the weights were removed.
3.1.4 Conclusions from the first scenario
It can be seen that the variations are the same as were expected and, furthermore, do not require amplification in order to be detected. In addition, the time taken for the fabric to stabilize itself to the new tension level is a maximum of 250ms which enables the rapid detection of the pressure.
The behavior is easily detected by looking at the gradient of the tension and, depending on whether the tension goes up or down, it is possible to know where the weight is.
Because in this scenario the strips are not independent, detection can only take place in two areas.
3.2 Response to the second scenario
Unlike in the previous scenario, this time the pass of the conductive thread was cut so that the conductive strips were independent. The connections are shown below (Figure 16):
The fabric used was the same as in the first scenario, so that the size was exactly the same. On each side of the fabric, in the same direction as the weave, 5 volts were connected. Half-way along each conductive strip, a single block was connected to read the value of the signal. In this way 4 measuring points were obtained, one for each conductive strip, with the objectives of observing the readings at the measuring point and how the deformation of one strip affected the ones next to it.
The behavior of the fabric when the voltage is connected is shown in Figure 17:
In the connections diagram can be found the key to the color codes in relation to the measuring point. It can be seen that all the measuring points fall within the range of 1.5v to 2v.
3.2.1 Two weights on the right-hand side
The response of each strip to the application of two weights to the right-hand side is shown below. Response of Strip 1:
Figure 18 shows the variation in strip 1 when the two weights are placed on the right-hand side and Figure 19 shows what happened when they were removed. There was an increase of 0.2v in almost 750ms which stabilized at almost 2.5v when the weights were positioned, due to the lower resistance offered by the fabric and a reduction of 1v in 500ms, stabilizing at 1.5v, when the weights were removed, due to the recovery of the original resistance before the deformation took place.
The interference in the rest of the strips caused by the deformation of strip 1 can be observed. When there was a change in pressure in that strip, the threads were stretched and caused deformations in the rest of the strips with strip 2 being most affected, as can be seen in Figures 18. Response in Strip 2:
In strip 2, an increase of 1v in less than 500ms was observed (Figure 19) when the weights were applied and a reduction of 1v in 500ms when they were removed (Figure 19). The interference in measuring points 1 and 3 can be seen even though the variation in the point being analyzed is much greater so that detection is not affected. Response in strip 3:
When the weights were placed there was a variation of 1.2v in less than 500ms (Figure 20) and, when they were removed (Figure 20), a change of almost 2v in 500ms which stabilized at 1v. In this case the interference only affected strip 2. Response in strip 4:
When the weights were placed on the fabric there was an increase of 1.5v in 500ms (Figure 21) and, when the weights were removed (Figure 21), a decrease of almost 2v, with strong interference in the measuring point of strip 3; even so, with a micro-controller, it is possible to determine which strip was deformed most.
3.2.2 Calculation of the force applied
The pieces of weight used were two of 100 grams each. Since the deformation was only caused by the placing of the weight on the fabric, the force applied to the fabric only came from the weight, so that:
Each weight is round with a diameter of 1.5cm:
Summarizing, with 2 weights a force of 1.109N/cm2 was applied.
The piece of weight is made of metal. As it is conductive, it implies that the change in the resistance of the fabric is caused by two things:
- The conductive material of the weight short-circuits the thread of the weave
- The force applied by the weights short-circuits the thread of the weave by crushing or stretching it
3.2.3 Four weights on the left-hand side
Starting from the same scenario two changes were made:
- The weight was increased from 200 to 400 grams to apply more force and deform the fabric more
- The weights were covered with a non-conductive material
In each of the following Figures (22 and 23), the responses of the strips at the measuring points, to the application and removal of the weights can be seen.
In Figure 22 (strip 1), because of the decrease in resistance caused by deformation, there was a reduction in the tension of almost 1V and the recovery of the resistance when the weight was removed- the original resistance value was recovered once the deformation stopped. The adjacent conductive strip suffered a change because of the deformation of the strip being analyzed. In Figure 22 (strip 2), the variation obtained was not very marked and was small but still detectable with a micro-controller.
In Figure 23 (strip 3), the variation was very clear and with little interference in the rest of the conductive strips. In Figure 23 (strip 4), the variation in strip 4 can be seen even though the deformation can also be seen in strip 3. In this case this interference would cause confusion in the detection of changes.
3.2.4 Conclusions regarding the second scenario
The fabric analyzed enables the detection of deformation in the different conductive strips. Such deformation can be caused by the following combinations
- By applying force with a non-conductive material
- By applying force using a non-conductive material
- By not applying force but using a conductive material
In the previous tests the first two formulae were used. Conductive material has also been tested without applying force but the results were not satisfactory and are not been described in this paper.
From the results presented it is possible to say that the best combination is to apply pressure using conductive material. In this way the deformation is reduced as is the possible interference with adjacent strips.
To reduce adjacent interference, two improvements are possible:
- Increase the size of the non-conductive strips
- Place a harder foam beneath the fabric in the tests so as to absorb the deformation and not drag the fabric
3.3 Response to the third scenario
In the third scenario, harder foam was developed (Figure 24). For measuring in this scenario, the weights covered with non-conductive material were used and only the area where the pressure was applied was measured.
3.3.1 Two weights on the right-hand side
Responses of tests made with the scenario described in this section can be seen in Figures 25 and 26. In this test, the weight was applied in the right-hand side of the fabric.
In previous tests it was possible to see the responses (Figure 31, 32, 33 and 34) in each measuring point when the weights were applied (increase in the voltage because of the reduction in resistance) and the response when they were removed (recovery of the resistance level at rest). In this scenario, acceptable responses were obtained as far as the size of variations and the level of interference in neighboring strips were concerned – this latter fact being due to the better support beneath the fabric.
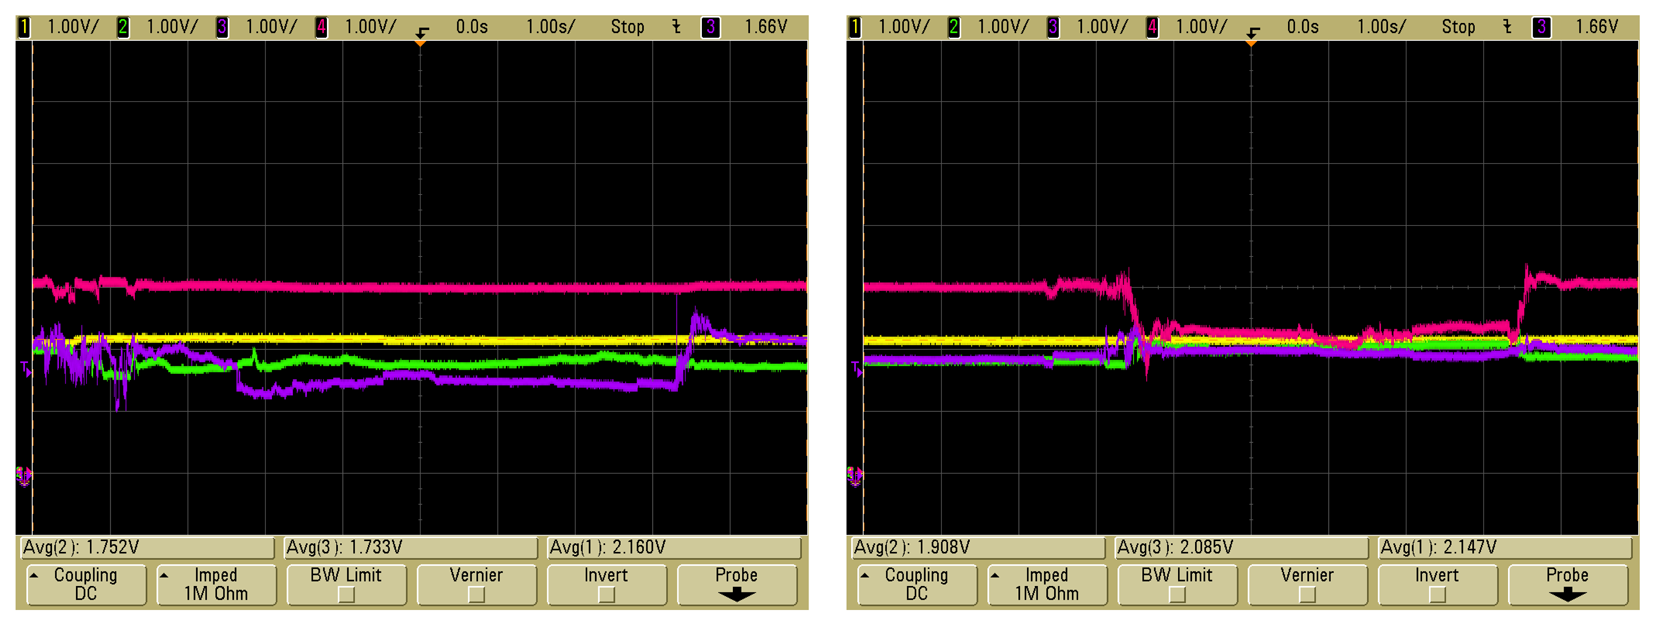
3.3.2 Two weights on the left-hand side
Now, in the following Figures (27 and 28), it can be seen the response appling the weight in the left-hand side of the fabric.
On the left-hand side (Figure 27 and 28), the results were worse in terms of the clarity of the signal and the interference with the adjacent strip in strips 1 and 2. Even so detection remained viable using a micro-controller to detect the slope of the variation of the signal.
It needs to be emphasized that in this case the deformation was caused without using conductive material and, thus, the test was carried out with the worst combination.
In this scenario the signals improved when pressure was applied and removed, allowing the fabric to recover its original form.
4. Final Considerations
This experiment has produced very positive results for the detection of deformation in fabrics. In respect of the fabric, it is possible to affirm that the proportion of conductive material used in the manufacture of the thread is sufficient to make the necessary contacts in the different rows of thread in the weave. The structure, based on conductive and non-conductive zones, is good for the separation of the different areas prepared for the detection of deformation, even though, in the case of the fabric analyzed, improvements would be achieved if the distance between conductive zones were increased so as to reduce deformation caused in adjacent areas.
As far as the test bank designed for these experiments is concerned, it successfully enabled the various scenarios for judging the responses of the fabric to be analyzed. It was discovered that a support beneath the fabric was needed to prevent deformation spreading to areas adjacent to where pressure was being applied.
The recovery of the fabric remains one of the principle areas in this line of research. In the fabric used and analyzed, an important improvement was achieved by introducing a percentage of Lycra.
Another line of current research is to identify the amount of force applied or deformation achieved compared to the resistance level and not just to detect the deformation.
Acknowledgments
This work was supported by the Department of Electronics in the ETSEEI of Enginyeria i Arquitectura La Salle at the Universitat Ramon Llull de Barcelona, Spain.
References and Notes
- Hernandez, W. Improving the response of a load cell by using optimal filtering. Sensors 2006, 6, 697–711. [Google Scholar]
- Hernandez, W. Optimal estimation of the relevant information coming from a variable reluctance proximity sensor placed in a car undergoing performance test. Mechanical Systems and Signal Processing 2007, 21, 2732–2739. [Google Scholar]
- Hernandez, W. Magnetic-field sensor based on a relaxation oscillator. Sensors and Actuators A 1996, 55, 163–166. [Google Scholar]
- Hernandez, W. Optimal estimation of the acceleration of a car under performance test. IEEE Sensors Journal 2007, 7, 392–400. [Google Scholar]
- Alsina, M.; Escudero, F.; Margalef, J.; Cambra, V.; Gisbert, J. Detection of the Deformation of an Intelligent Textile in a Specific Point. Sensors 2007, 7, 921–931. [Google Scholar]
- Millman, J. Microelectronics: Digital & Analogs Circuits & Systems; McGraw-Hill: New York, 1979. [Google Scholar]
- Malvino, A.P. Electronic Principles, 4th Ed. ed; McGraw-Hill: New York, 1997. [Google Scholar]
- Chou, T.W.; Ko, F.K. Textile Structural Composites; Elsevier: Amsterdam, 1989. [Google Scholar]
Figure 1.
Plan of the test bank.

Figure 2.
Photograph of the test bank parts.
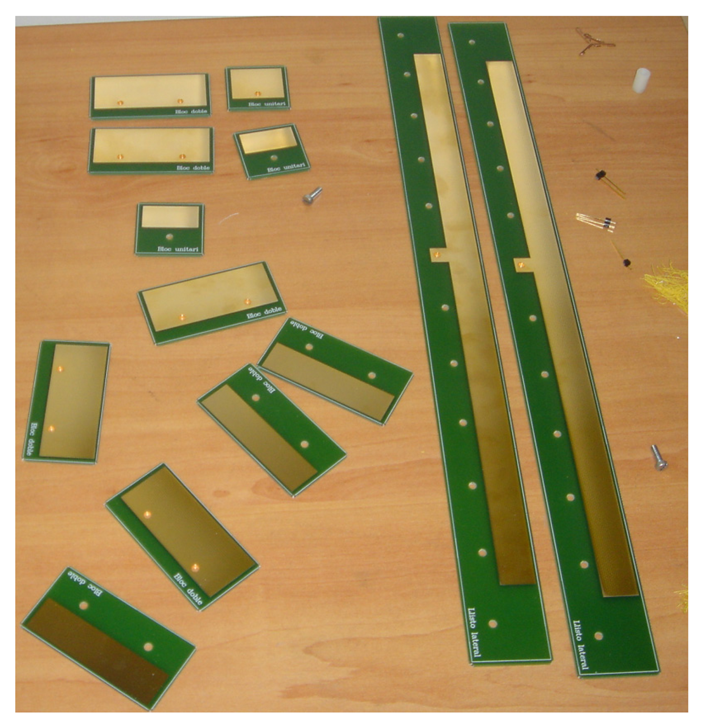
Figure 3.
Photograph of fabric on the test bank.
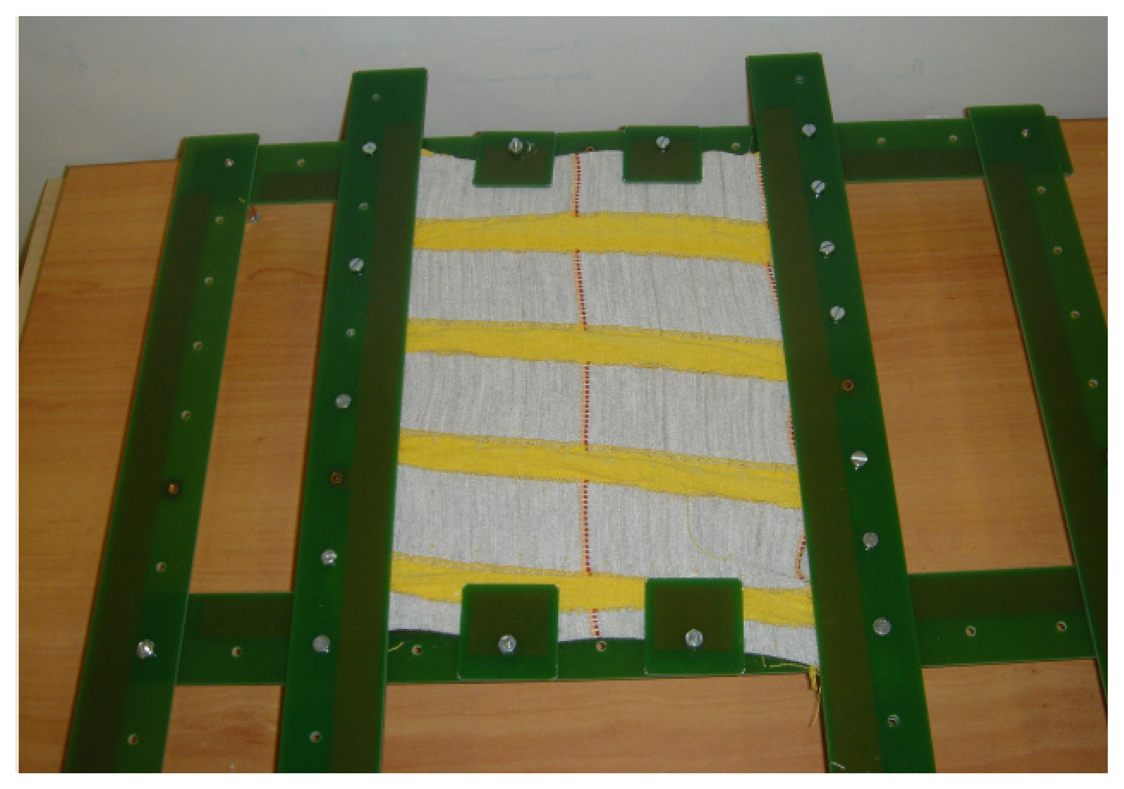
Figure 4.
Structure of the fabric used.

Figure 5.
Connections in the first scenario.

Figure 6.
Response at rest.
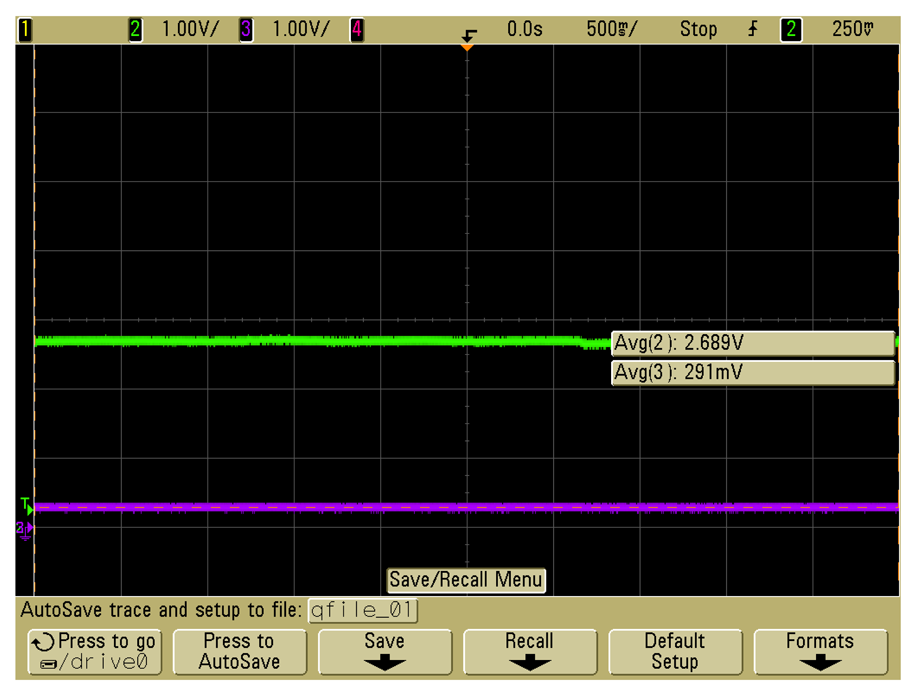
Figure 7.
Application of the weight.

Figure 8.
Response to the weight.

Figure 9.
Response when the weight is removed.

Figure 10.
Application of weights.
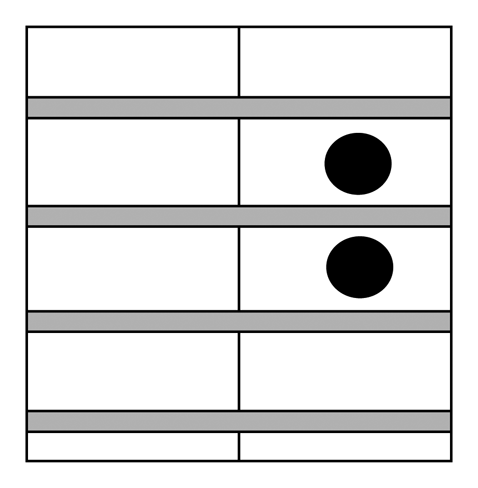
Figure 11.
Response to the weights.
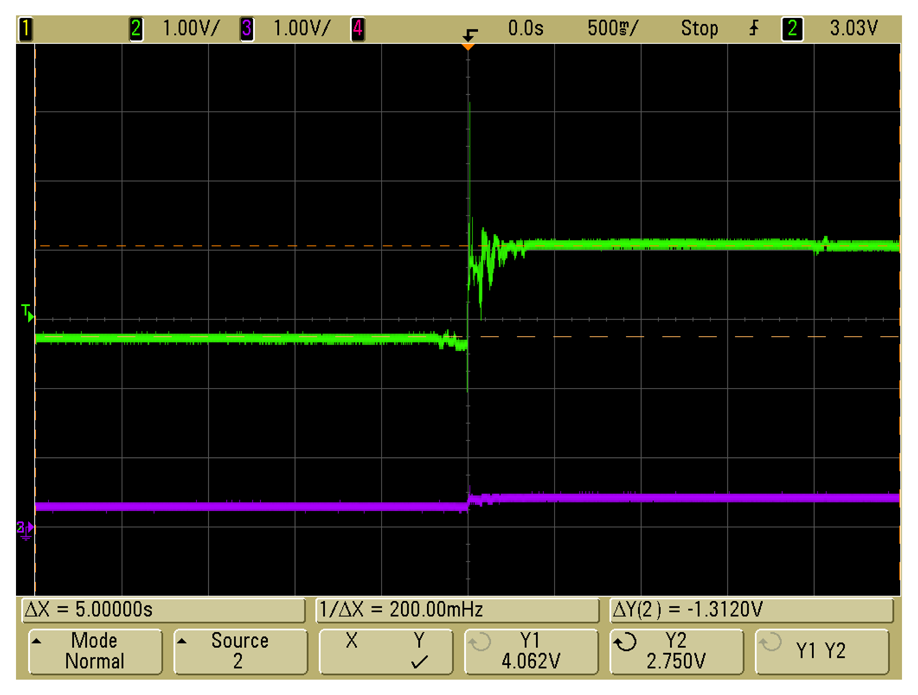
Figure 12.
Response when the weight is removed.

Figure 13.
Application of the weights.
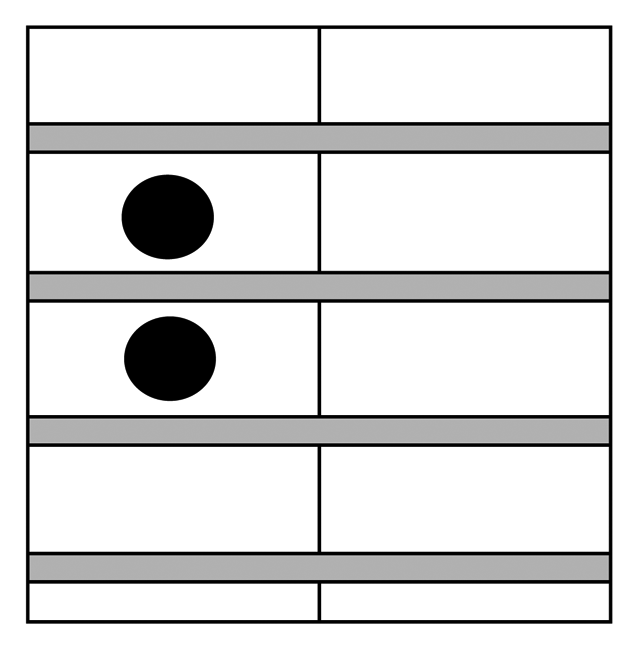
Figure 14.
Response to the weights.
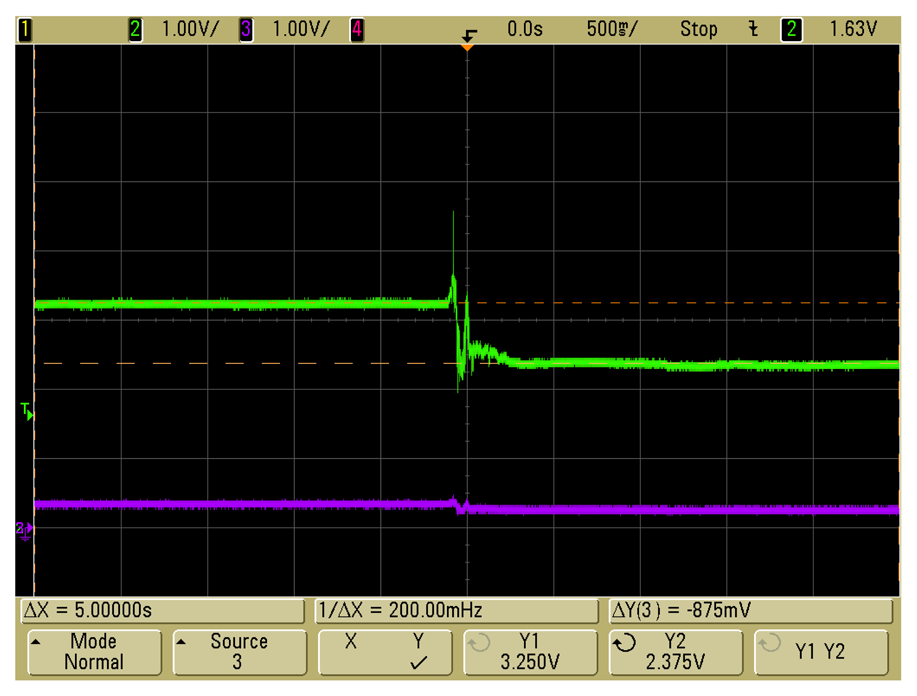
Figure 15.
Response when the weights were removed.
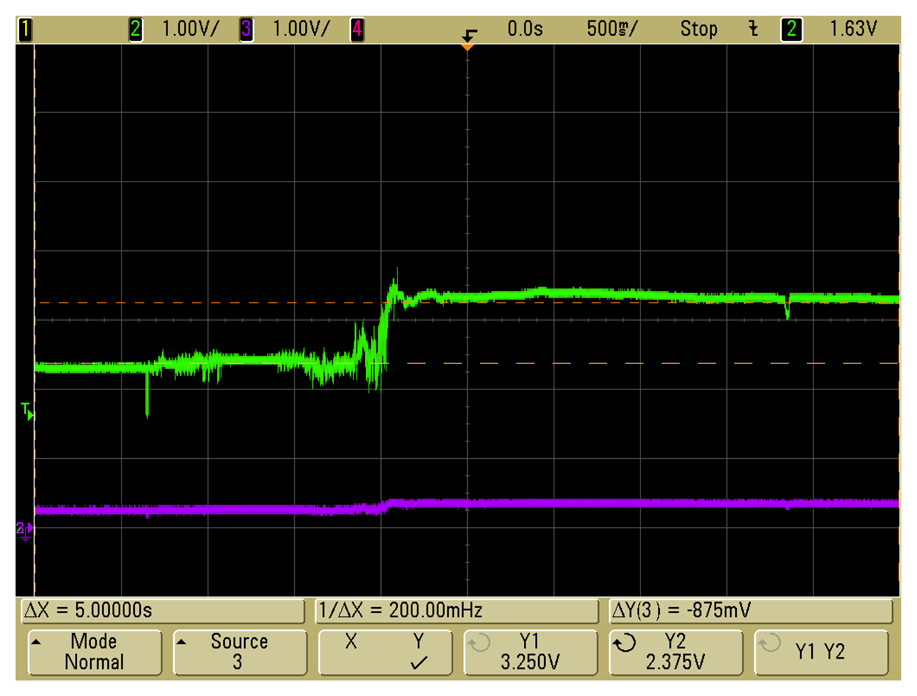
Figure 16.
The second scenario connections.
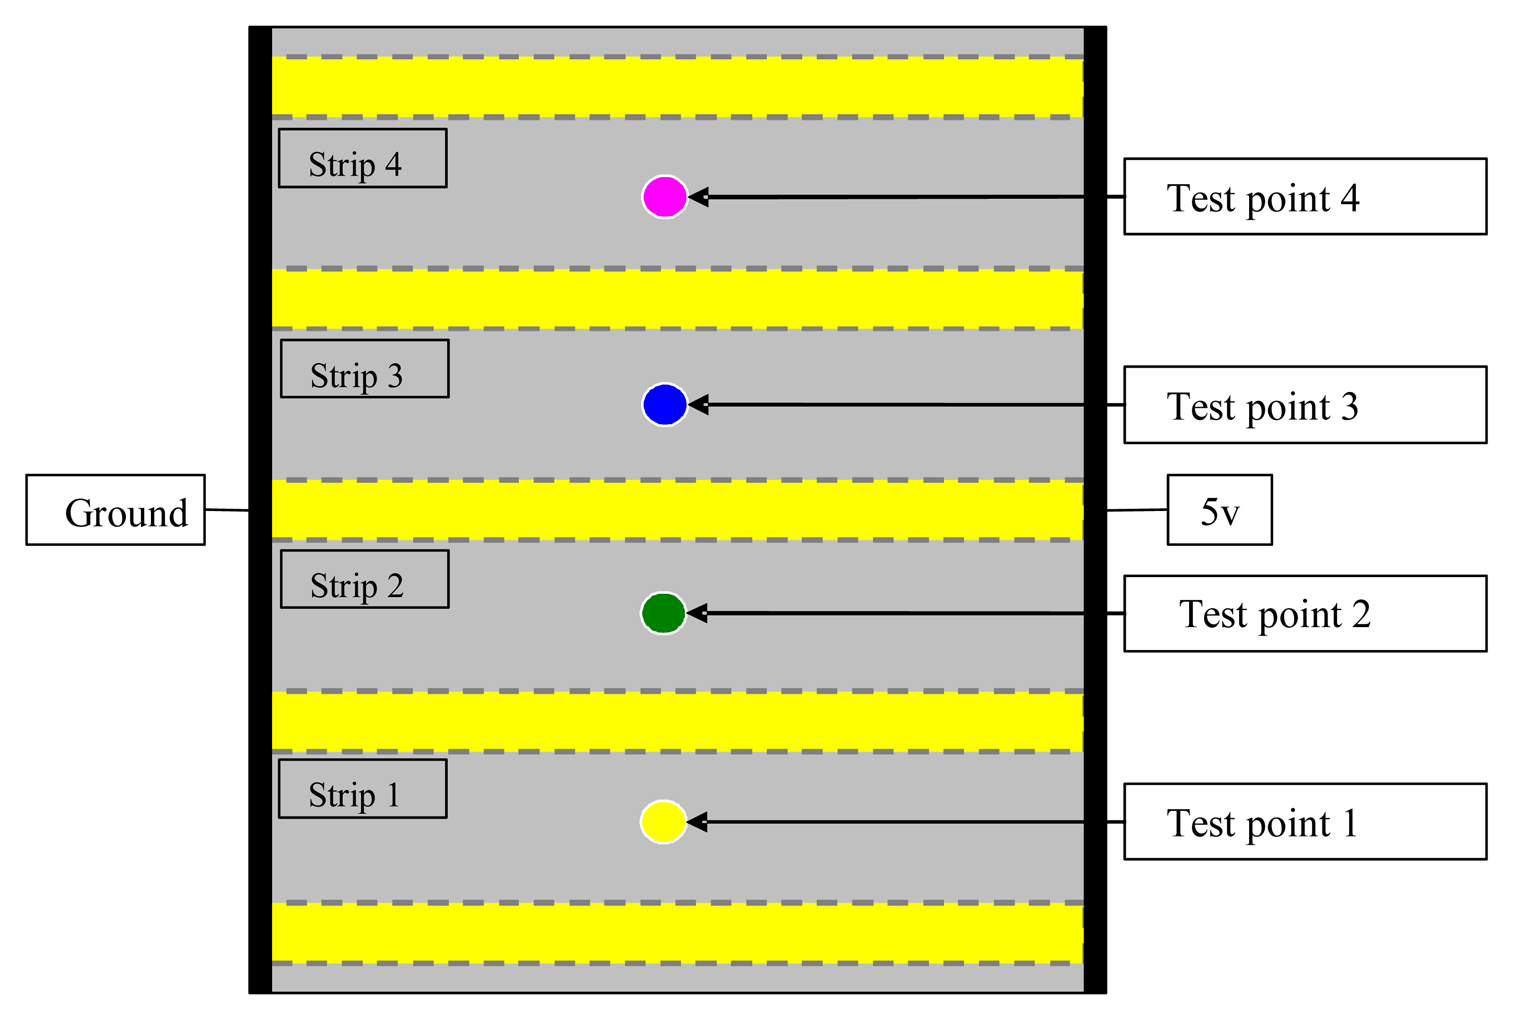
Figure 17.
Response to the connection of the power supply.
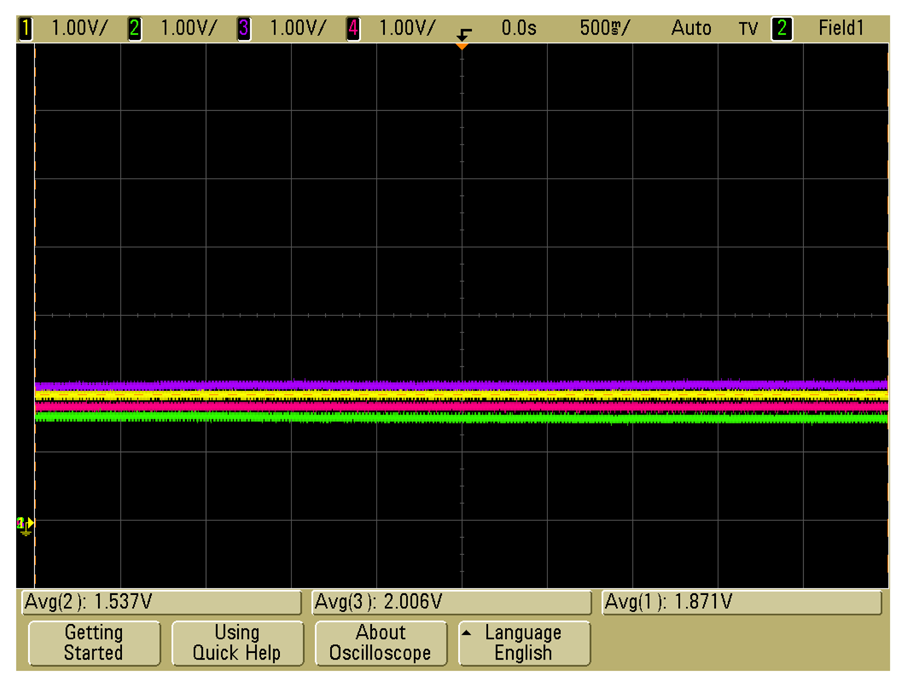
Figure 18.
Application and removal of the weights.
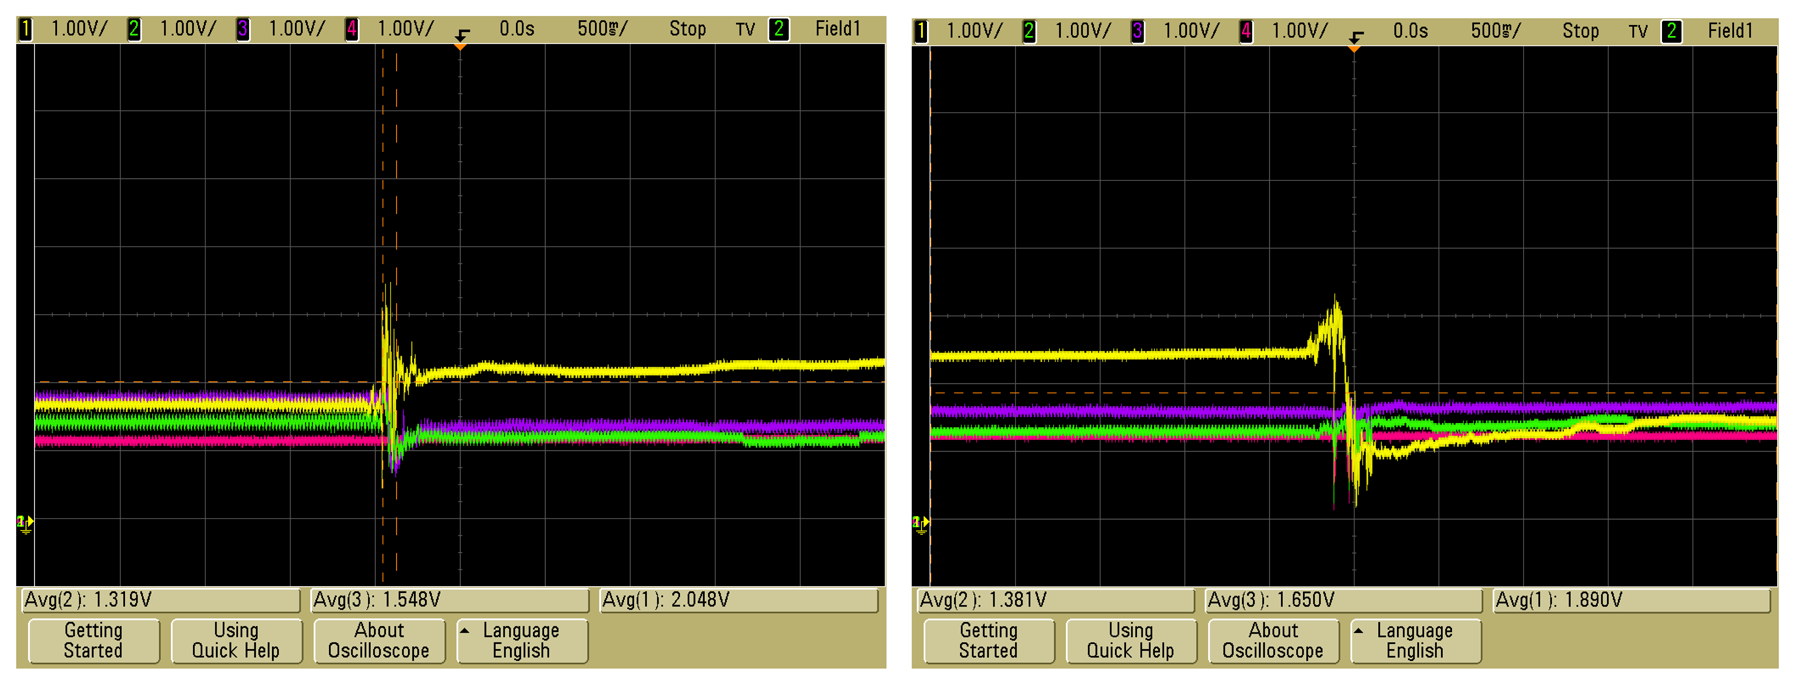
Figure 19.
Application of the weights.
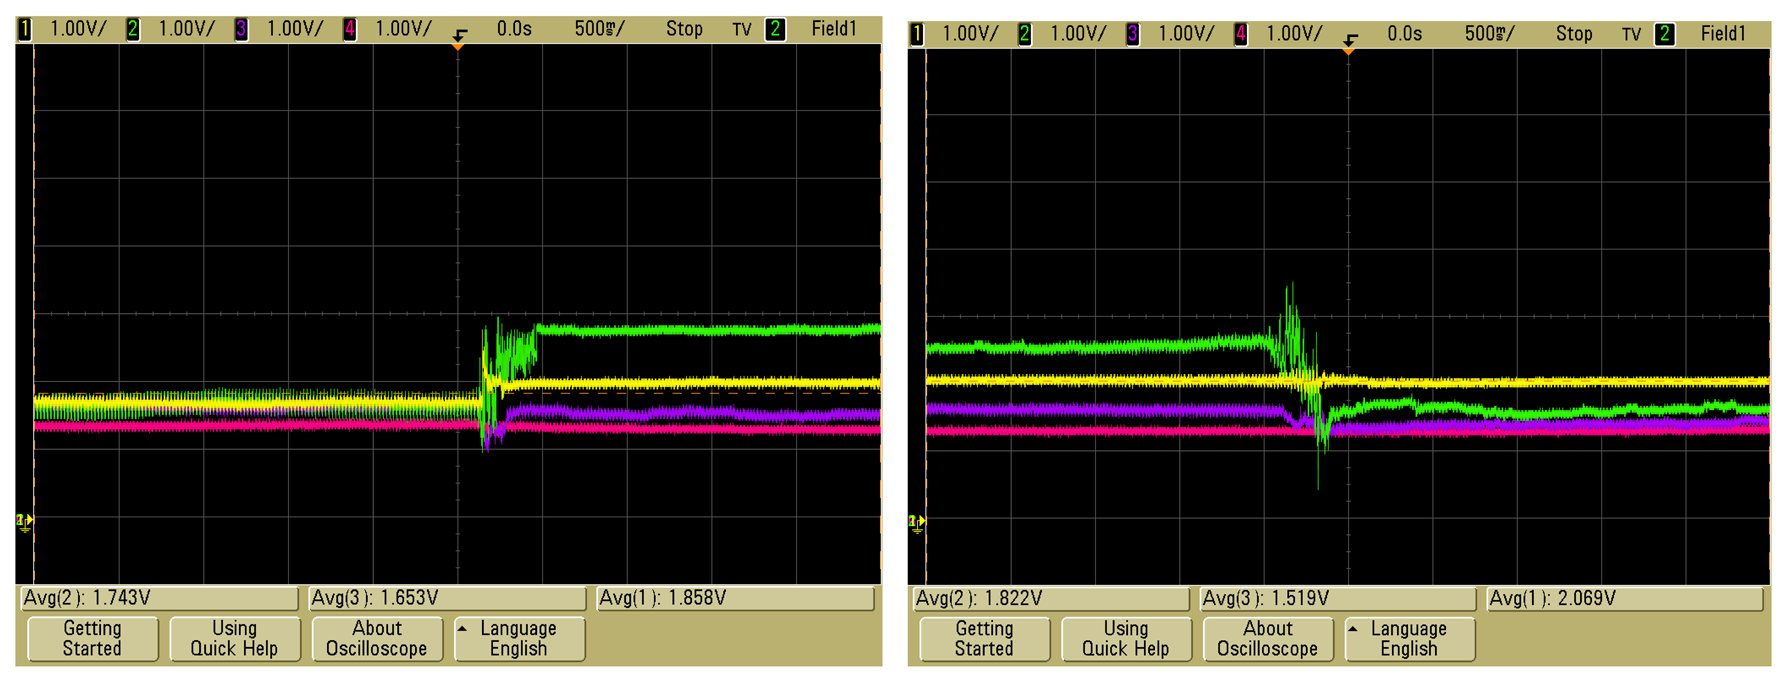
Figure 20.
Application of the weights.

Figure 21.
Application of the weights.
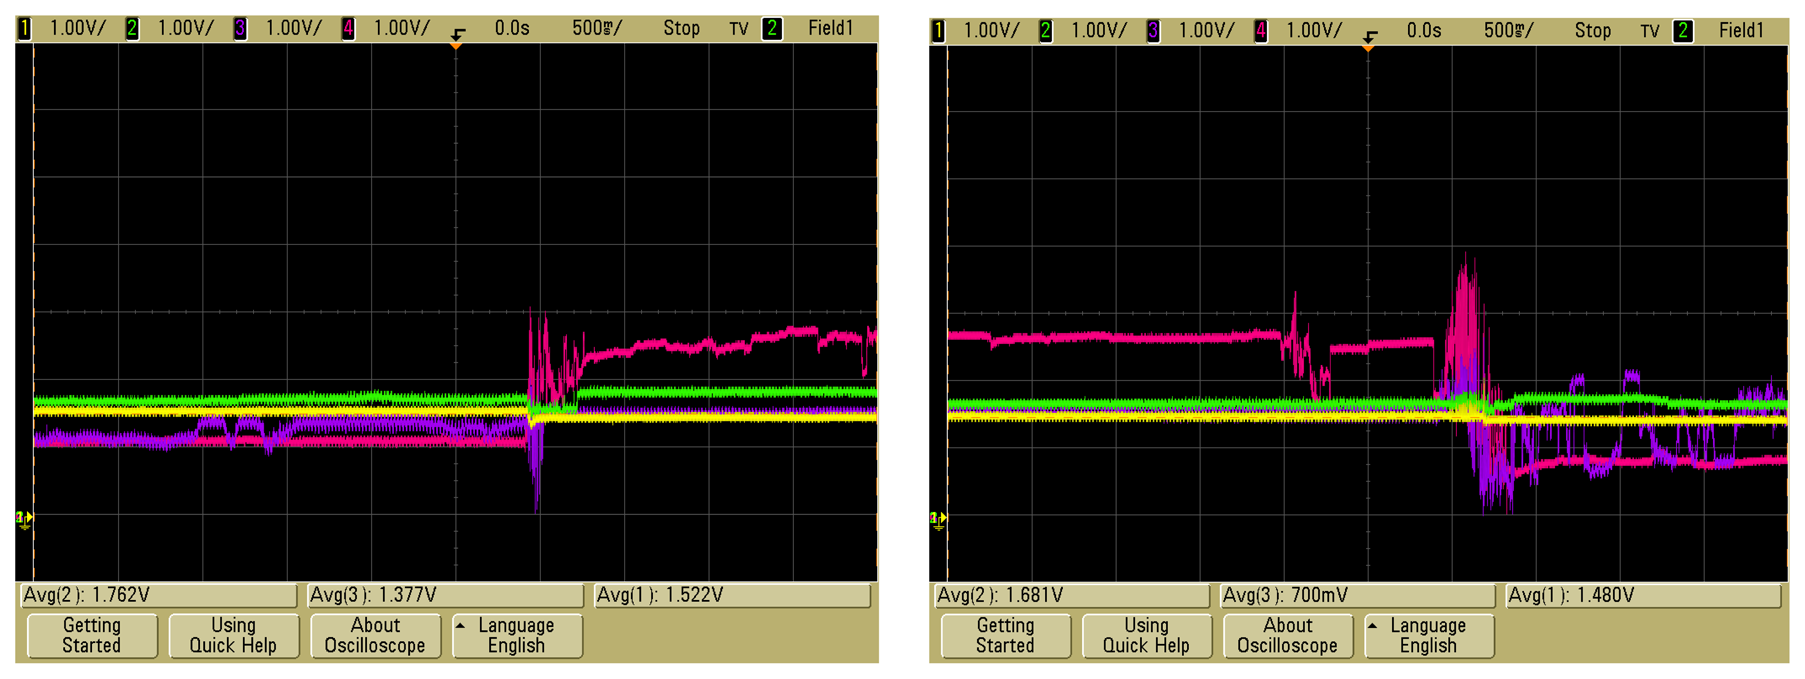
Figure 22.
Strip 1 and 2.
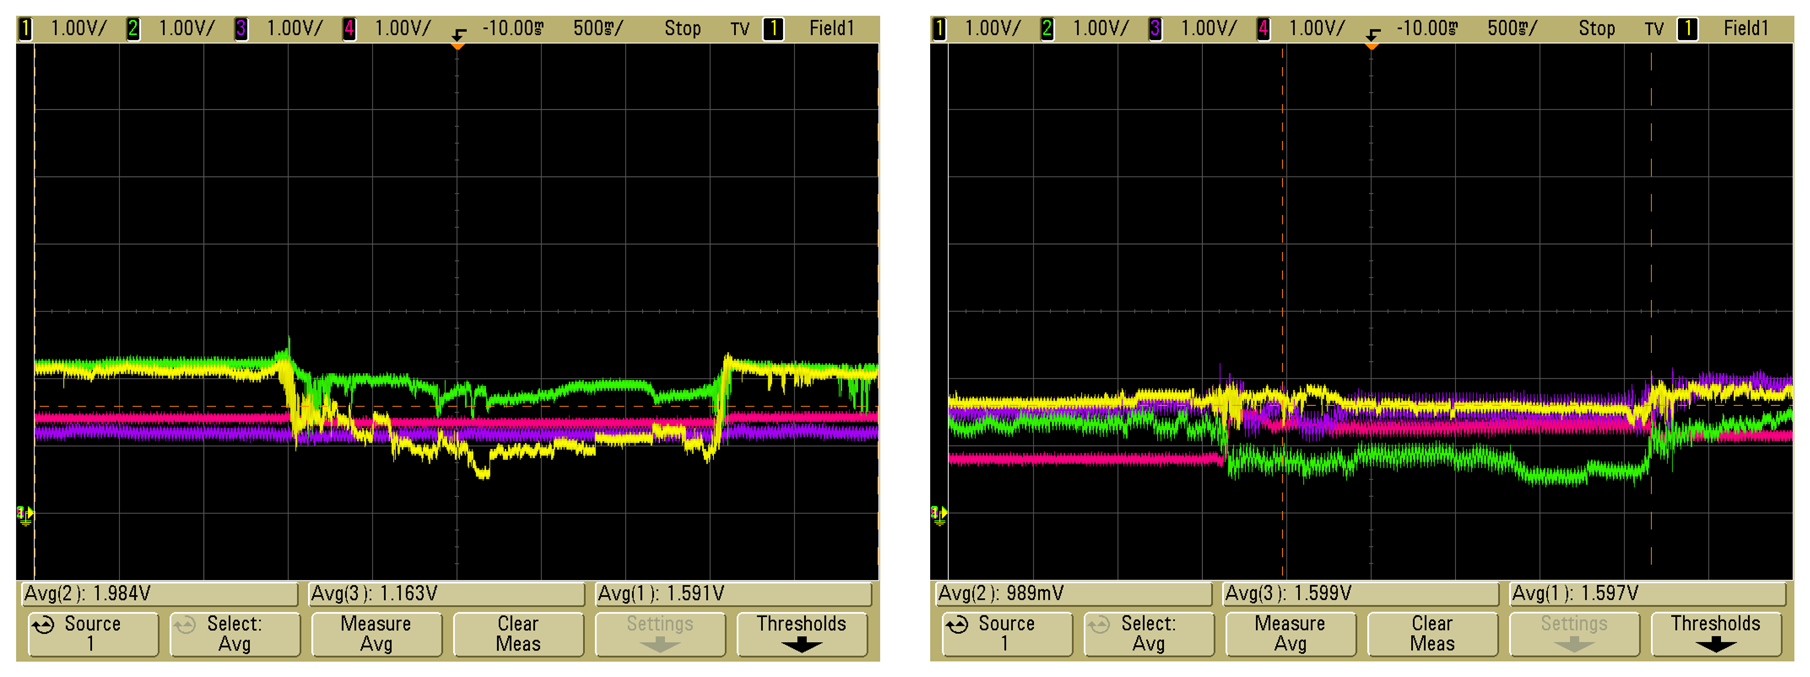
Figure 23.
Strip 3 and 4.
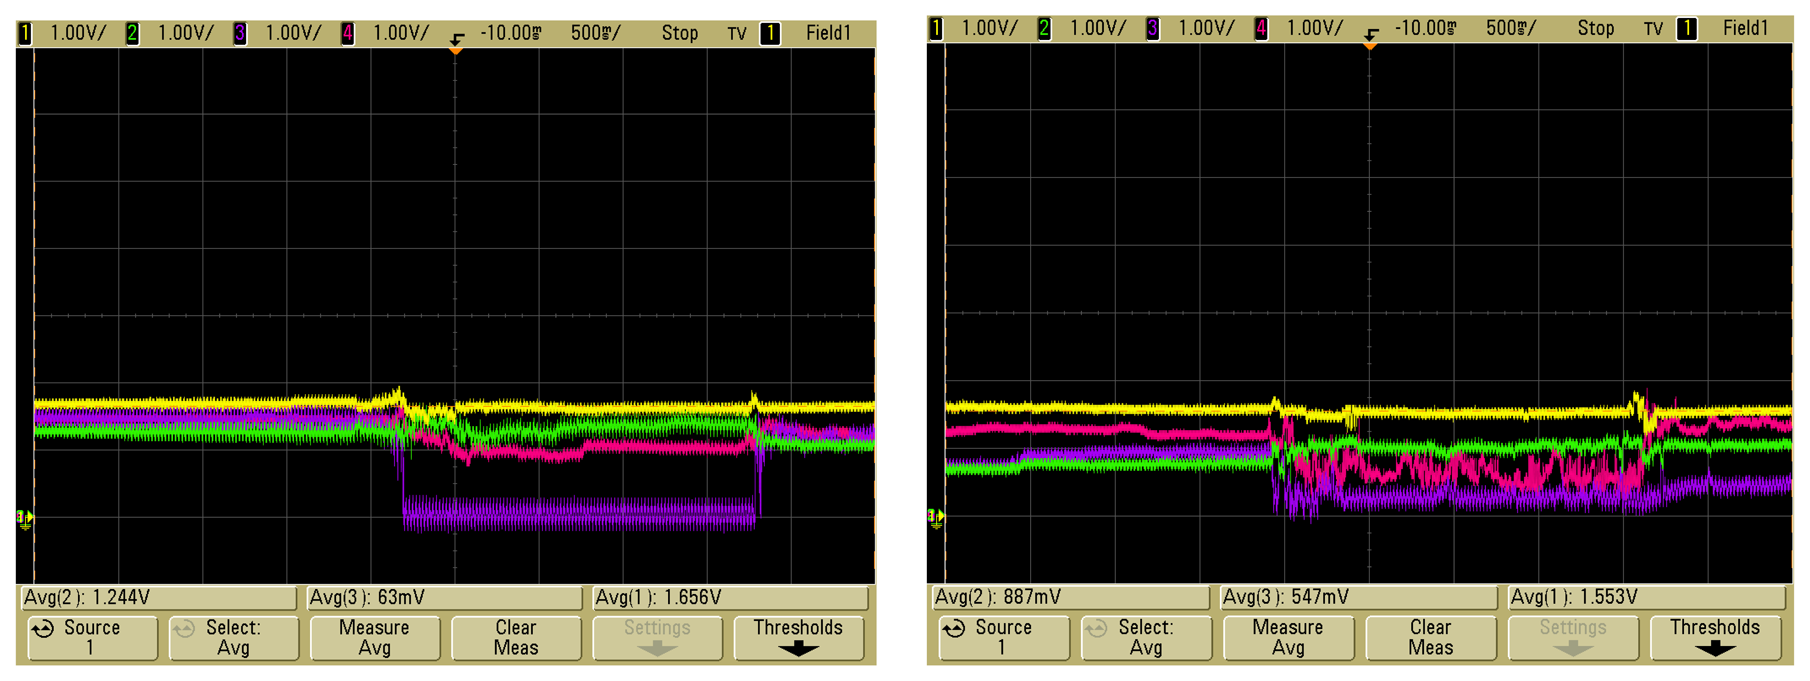
Figure 24.
Diagram of the positioning of the foam.
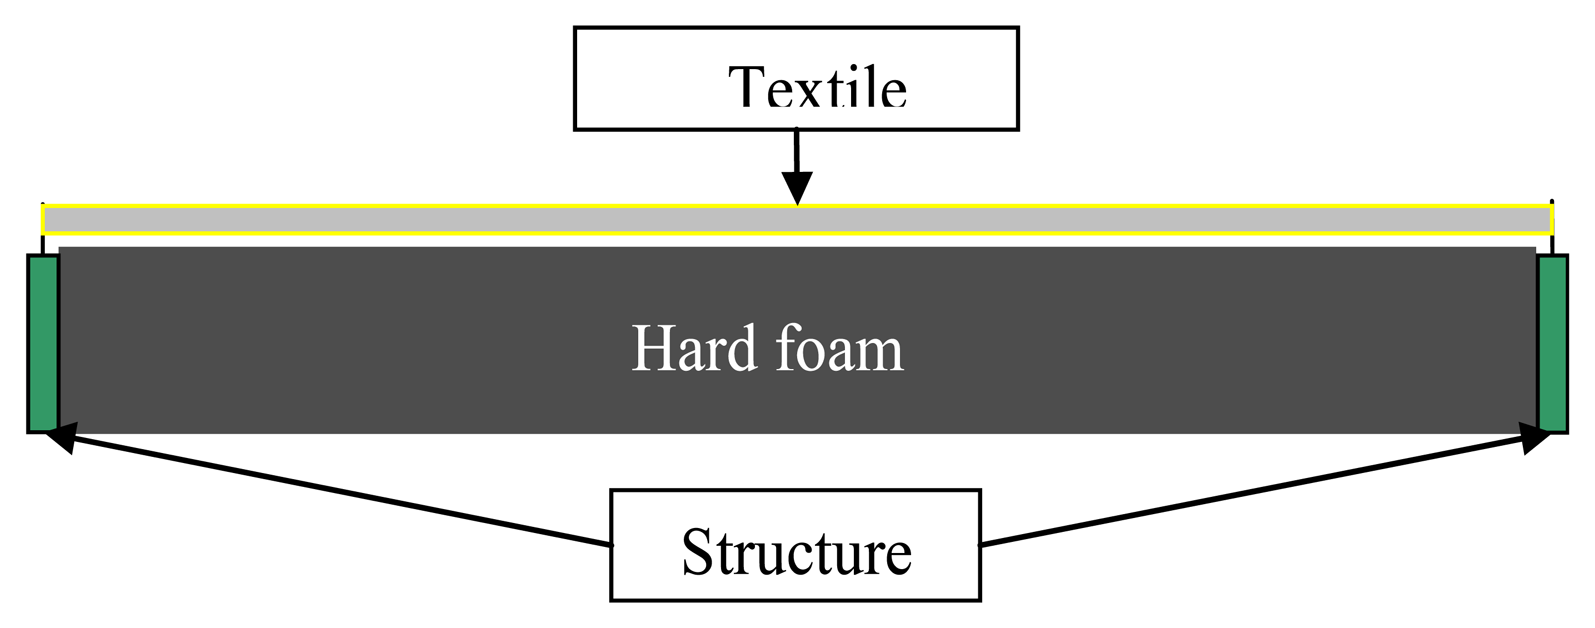
Figure 25.
Response of strip 1 and 2.

Figure 26.
Response of strip 3 and strip 4.
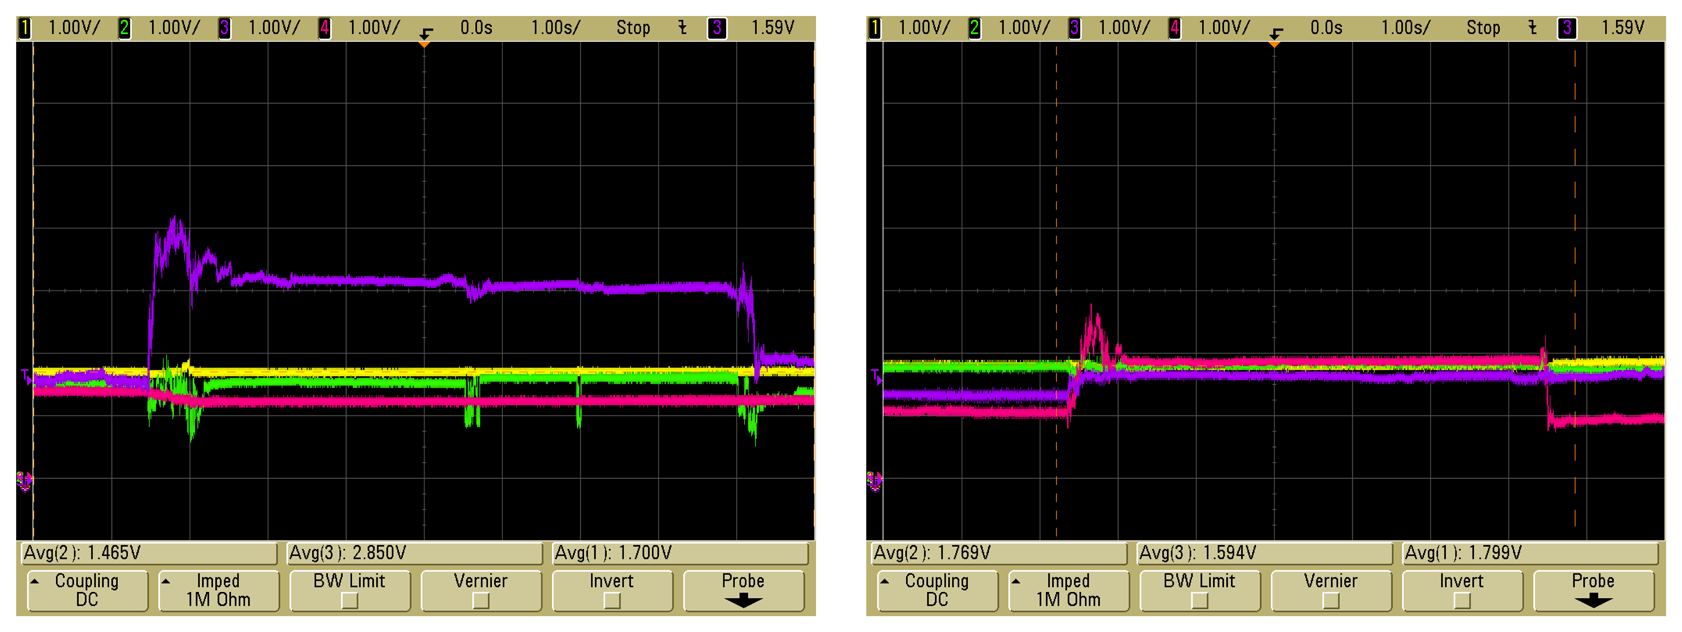
Figure 27.
Response of strip 1 and 2.
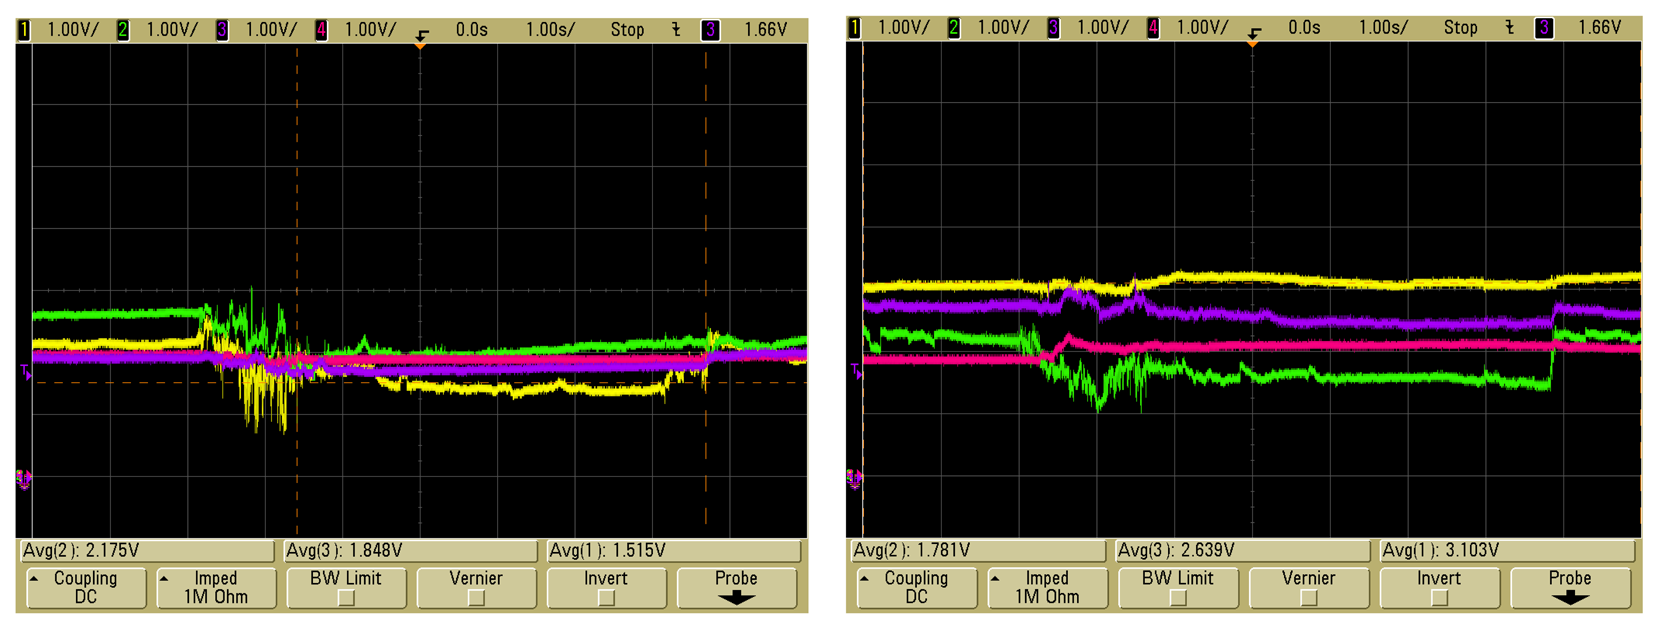
Figure 28.
Response of strip 3 and 4.
© 2007 by MDPI ( http://www.mdpi.org). Reproduction is permitted for noncommercial purposes.
Share and Cite
MDPI and ACS Style
Alsina, M.; Escudero, F.; Margalef, J.; Luengo, S. Tactile Fabric Panel in an Eight Zones Structure. Sensors 2007, 7, 2953-2969. https://doi.org/10.3390/s7112953
AMA Style
Alsina M, Escudero F, Margalef J, Luengo S. Tactile Fabric Panel in an Eight Zones Structure. Sensors. 2007; 7(11):2953-2969. https://doi.org/10.3390/s7112953
Chicago/Turabian StyleAlsina, Maria, Francesc Escudero, Jordi Margalef, and Sonia Luengo. 2007. "Tactile Fabric Panel in an Eight Zones Structure" Sensors 7, no. 11: 2953-2969. https://doi.org/10.3390/s7112953