Reducing the Discrepancy Between ASTER and MODIS Land Surface Temperature Products


1
Graduate School of Environmental Studies, Nagoya University, Furo-cho, Chikusa-ku, Nagoya 464-8601, Japan
2
Nanjing Institute of Geography and Limnology, Chinese Academy of Sciences, East Beijing Road, No.73, Nanjing 210008, China
3
Department of Geographical Information Science, Nanjing University, Hankou Road 22, Nanjing, 210093, China
*
Author to whom correspondence should be addressed.
Sensors 2007, 7(12), 3043-3057; https://doi.org/10.3390/s7123043
Submission received: 25 October 2007
/
Accepted: 2 December 2007
/
Published: 4 December 2007
(This article belongs to the Special Issue Remote Sensing of Natural Resources and the Environment)
Abstract
:Human-induced global warming has significantly increased the importance of satellite monitoring of land surface temperature (LST) on a global scale. The MODerate-resolution Imaging Spectroradiometer (MODIS) provides a 1-km resolution LST product with almost daily coverage of the Earth, invaluable to both local and global change studies. The Advanced Spaceborne Thermal Emission Reflection Radiometer (ASTER) provides a LST product with a high spatial resolution of 90-m and a 16-day recurrent cycle, simultaneously acquired at the same height and nadir view as MODIS. ASTER and MODIS are complementary in resolution, offering a unique opportunity for scale-related studies. ASTER and MODIS LST have been widely used but the errors in LST were mostly disregarded. Correction of ASTER-to-MODIS LST discrepancies is essential for studies reliant upon the joint use of these sensors. In this study, we compared three correction approaches: the Wan et al.'s approach, the refined Wan et al.'s approach, and the generalized split window (GSW) algorithm based approach. The Wan et al.'s approach corrects the MODIS 1-km LST using MODIS 5-km LST. The refined approach modifies the Wan et al.'s approach through incorporating ASTER emissivity and MODIS 5-km data. The GSW algorithm approach does not use MODIS 5-km but only ASTER emissivity data. We examined the case over a semi-arid terrain area for the part of the Loess Plateau of China. All the approaches reduced the ASTER-to-MODIS LST discrepancy effectively. With terrain correction, the original ASTER-to-MODIS LST difference reduced from 2.7±1.28 K to -0.1±1.87 K for the Wan et al.'s approach, 0.2±1.57 K for the refined approach, and 0.1±1.33 K for the GSW algorithm based approach. Among all the approaches, the GSW algorithm based approach performed best in terms of mean, standard deviation, root mean square root, and correlation coefficient.
1. Introduction
While human-induced global warming very likely will continue, there is a scientific consensus for monitoring environmental for comprehensive understanding on a global scale [1]. Of all environmental variables, surface temperature is a key to numerous physical, chemical, and biological processes on Earth. The skin temperature of the Earth's surface is a result of the complicated interactions of surface processes. It is a comprehensive indicator of the thermodynamic state of the surface.
The MODerate-resolution Imaging Spectroradiometer (MODIS) is one of five scientific instruments onboard the satellite platform, Terra, part of NASA's Earth Observation System (EOS), and provides data for retrieving land surface temperature (LST) at 1-km resolution with almost daily coverage of the Earth, which is invaluable for both local and global change research [2]. The Advanced Spaceborne Thermal Emission Reflection Radiometer (ASTER) also onboard Terra, and collects data at high spatial resolution from 15-m to 90-m with a 16-day recurrent cycle for geological and environmental applications [3]. The acquired data are used to routinely retrieve land surface temperature (LST) at 90-m resolution in the thermal and infrared (TIR) bands with coverage of 60-km by 60-km. Both ASTER and MODIS LST data have been widely used in meteorological, hydrological, and ecological studies [4]-[6]. However, the errors in LST were mostly disregarded in the studies.
As a result of being onboard the same satellite platform, ASTER and MODIS are complementary in spatial and temporal resolutions, offering a unique opportunity for scale-related studies. In general, the remotely sensed pixel-wise value reflects a mixture of different land covers (spatial heterogeneity). The simultaneous observations made at the same height and coincident nadirs eliminate the differences in atmospheric and surface conditions. The observations at different spatial resolutions are important for clarifying the effects of spatial heterogeneity. For example, ASTER and MODIS LST data have been used to investigate scale influences on the retrieval of evaporation [7]. The errors in MODIS LST have been reported [17], but not explicitly addressed in these scale-related studies. Without clarifying the errors, the reliability of the ASTER and MODIS LST based studies would be weakened.
Recent studies reported the discrepancy in ASTER and MODIS LST of approximately 3 K over a semi-arid area [8]-[9]. The ASTER-to-MODIS LST discrepancy can be ascribed to the differences in spatial resolution and the retrieval algorithm used [8] & [10]. Satellite-retrieved LST is an ensemble surface temperature, an integral quantity representing the integrated effects of temperature variations within a pixel [11]-[12]. Jacob et al. compared ASTER and MODIS LST over a semi-arid and a Savannah area, but found no significant ASTER-to-MODIS LST differences caused by spatial heterogeneity [10]. Using a scaling approach explicitly to account for resolution difference, Liu et al. showed that spatial heterogeneity made the effects negligible [8].
It was found that the limited accuracy of LST retrieval algorithm was the major uncertainty source contributing to the ASTER-to-MODIS LST discrepancy [8]. ASTER LST products are retrieved from the Temperature and Emissivity Separation (TES) algorithm with an accuracy of less than 1.5 K [13]-[14]. MODIS 1-km LST products are retrieved from the generalized split window (GSW) algorithm [15]-[16], which was found to underestimate LST, for example, by 3 K on average over the North America Continent [17]. To rectify the errors in 1-km LST, Wan et al. developed a correction approach [17]. Recently, Liu et al. used the Wan et al.'s approach to reduce the ASTER-to-MODIS LST discrepancy [8]. They further refined the Wan et al.'s approach using the Planck function and ASTER emissivity data. In addition, Liu et al. proposed another correction approach based on the principle of the GSW algorithm [9]. So far, all the correction techniques improved the agreement between ASTER and MODIS LST products. It is yet unclear which approach is best for practical use.
In this study, we compare the Wan et al.'s approach, the refined Wan et al.'s approach, and the GSW algorithm based approach to reduce ASTER-MODIS LST discrepancy. Section 2 introduces three correction approaches. Section 3 describes the ASTER and MODIS data used and data processing. Section 4 inter-compares the results from three approaches. We also discuss the advantages and disadvantages of each approach for practical use.
2. The GSW retrieval algorithm and three correction approaches
2.1. GSW retrieval algorithm
Wan and Dozier developed the generalized split-window (GSW) algorithm for retrieval of 1-km LST from MODIS thermal infrared (TIR) bands [18] under a range of atmospheric conditions. The algorithm can be expressed as follows
where T1km is the retrieved 1-km LST (K) included in MOD11_L2 product. T31 and T32 are MODIS band 31 and 32 brightness temperature (K). ε = 0.5(ε31 + ε32) and Δε= ε31 − ε32. ε31 and ε32 are MODIS band 31 and 32 emissivity. A1, A2, A3, B1, B2, B3, and C are regression coefficients based on the results of radiative transfer simulation under a range of surface and atmospheric conditions [18]. The emissivity of bands 31 and 32 are assigned according to land cover types that are based on a MODIS classification model. The emissivity is therefore referred to as classification-based [19].
2.2. Wan et al.'s correction approach
The GSW algorithm was found to underestimate MODIS 1-km LST, especially over semi-arid and arid regions [17]. The MODIS classification model has low accuracy over several land cover types and mixed areas [20]. It leads to the overestimation of the classification-based emissivities, resulting in an underestimation of LST from the GSW algorithm. To improve the retrieval accuracy, Wan et al. proposed a correction approach as follows [17]
where
is the corrected LST, T1km is the 1-km LST in the MOD11_L2 product, T1km→5km is the daytime LST aggregated from T1km, and T5km is the 5-km LST included in the MOD11B1 product retrieved from the day/night algorithm [15]. The day/night algorithm is capable of adjusting the uncertainties in atmospheric temperature and water vapor profile, and it is considered as a better algorithm for retrieval of surface temperature and emissivity [17]. In summary, this approach corrects the 1-km LST with reference to the 5-km LST.
2.3. Refined Wan et al.'s approach
The Wan et al.'s approach uses the 5-km LST to correct the 1-km LST. The relatively coarse resolution of the 5-km data is probably insufficient to correct 1-km LST for the residual effects in the GSW algorithm, because there may exist large spatial variations at 1-km resolution within the 5-km grid spacing. To rectify the 5-km LST used in Equation (2), Liu et al. proposed an approach using the Planck function and ASTER emissivity data [8].
The spectral radiance with surface emissivity, ε, can be described by
where L(λ,T) is spectral radiance (Wm-2μm-1sr-1), B(λ,T) is the spectral radiance of a black body (Wm-2μm-1sr-1)(the Planck function), λ is the wavelength (μm), T is the temperature (K), and c1 and c2 are universal constants (c1=3.7418*10-16 Wm2; c2=14388 μm K).
ASTER's TES algorithm is able to retrieve emissivity with a high accuracy of 0.015 [15]-[16]. Within a MODIS 5-km footprint, we assume that the ASTER narrowband emissivity, εAST1km, averaged to 1-km from the 90-m product, be the “true” emissivity, and that the at-sensor radiance of ASTER, L(λ,T)AST1km, at 1-km be equal to that at MODIS, L(λ,T)MOD5km. We may obtain the following equation to calculate the “true” LST,
,at 1-km within the corresponding LST, T5km, at 5-km
where λ is the wavelength (μm) near MODIS TIR band 31, for which 11.03μm was chosen, and ε5km is the band-31 emissivity. εAST1km can be upscaled from the 90-m narrowband ASTER emissivity data. Notably, this equation is different from equation (15) used in [8], but results in a negligible difference.
Equation (4) offers a way to downscale the MODIS LST from 5-km into 1-km. In this way, we get the LST at 1-km instead of 5-km resolution for LST correction. Replacing T5km with
, Equation (2) then becomes
This approach incorporates ASTER 1-km emissivity instead of solely using MODIS 5-km data for correction, which makes difference to the Wan et al.'s approach.
2.4. GSW algorithm based approach
The Wan et al.'s approach corrects the MODIS 1-km LST with reference to the MODIS 5-km LST. The refined approach further makes use of ASTER emissivity data in order to achieve a better agreement between the ASTER and MODIS 1-km LST. Alternatively, Liu et al. proposed another approach without using MODIS 5-km data, based on the principle of the GSW algorithm [9].
Equation (1) for the GSW algorithm can be rewritten with respect to emissivity as follows
Written this way, Ts is a function of 1/ε and Δε/ε2 with a, b, and c components as parameters to the same pixel.
If we correct the emissivities in (6) with the “actual” values, we can express the corrected LST,
as follows
where
and
.
and
are the “actual” emissivity. From equations (6) and (7), we have
Assuming Δεc = Δε leads to the following equation
Equations (8) & (9) show that the corrected LST is the result of the original LST Ts, the emissivity items ε , Δε, εc, and Δεc, the band brightness temperatures T31 and T32, and the regression coefficients A2, A3, B2, and B3. In the case that the regression coefficients are generally unavailable to the end user, the components a and b, assumed to be constant, can be estimated from a multiple regression approach using equation (6). In practice, only the ASTER emissivity corresponding to the MODIS emissivity ε31 is available. Because the ASTER emissivity that corresponds to the MODIS emissivity ε32 is unavailable, we assume
and Δεc = Δε for practicable use of equation (9).
3. Study materials and data processing
We used the ASTER and MODIS LST products acquired over a relief area over the Loess Plateau in China, part of the semiarid climate zone. The study area was chosen for its diverse land covers and highly variable topographical features that suffer from serious soil erosion. The dominant land covers include agricultural fields, grasslands, bare soil surfaces, forestlands, and inland water bodies. We used the same datasets as in [8], and this allowed us to focus on comparing the correction approaches rather than on addressing the scale-related issues.
ASTER surface emissivity (AST_05) and surface kinetic temperature (AST_08) products, observed on 8 June 2004, were acquired from the Earth Observing System Data Gateway (EDG). The AST_05 product has a spatial resolution of 90-m and contains band-averaged surface emissivity retrieved using the TES algorithm [13], [14], and [21]. The AST_08 product contains surface kinetic temperature retrieved from the TIR bands at 90-m resolution. The acquired data were generated from the Product Generation Executive (PGE) code (version 2.9) with updated radiometric database (version 2.17). Because the datasets were acquired over the relief area, the 3D-Ortho product (AST3A01) was also acquired from the Earth Remote Sensing Data Analysis Center (ERSDAC) of Japan. The 90-m resolution elevation data served as the digital elevation model (DEM) in this study.
MODIS MOD11B1 and MOD11_L2 data covering the study area, on 8 June 2004, were also acquired from the EDG. The MOD11_L2 data contains LST and band-averaged emissivity in band-31 (10.780–11.280μm) and band-32 (11.770–12.270μm) generated using the GSW algorithm [17]. The LST and emissivity have spatial resolutions of 1-km. The MOD11B1 Level-3 product contains the daytime LST (T5km) generated using the day/night LST algorithm [15], the daytime LST (T1km→5km) aggregated from 1-km LST retrieved from the GSW algorithm, and the band-averaged emissivity in band-31 and band-32, with a nominal resolution of 5-km [17]. The dataset was used to rectify the 1-km LST T1km in MOD11_L2 data. All the acquired MODIS data were re-projected onto UTM with a datum of WGS84.
The 90-m slope and aspect angles of the terrain area were generated from 90-m ASTER DEM data. The 1-km DEM data were generated from the 90-m DEM data by resampling with the cubic convolution algorithm [22]. The 1-km slope and aspect angles were then determined. The acquired ASTER images were registered to the MODIS images, as in [8]. Consequently, the coverage corresponding to the acquired ASTER image was extracted from the central part of the MODIS images. 90-m narrowband emissivity data were produced by averaging the emissivities in two ASTER bands 13 and 14. The wavelength location of the averaged ASTER emissivity was very close to that of MODIS band-31 emissivity [10]. The narrowband emissivity data were upscaled from 90-m to 1-km using the areally weighted averaging approach. ASTER LST was upscaled from 90-m to 1-km using the following equation accounting for the uncorrected terrain angular and adjacency effects resident in satellite-derived LST [8]
where ri is the areal ratio of the 90-m ASTER pixel i within the footprint of the corresponding nominal MODIS pixel. fi is a weighting factor accounting for the triangular line spread function of the MODIS instrument in the across-track direction [23]-[25]. ε is the surface emissivity, α the local slope angle, γ the angle between the view path and an imaginary line normal to the surface, and L̅ the local average radiance emitted from the surrounding terrain. To investigate the terrain effects on the correction, we also calculated 1-km ASTER LST using the following equation, which is a simplified form of equation (10)
The MODIS 1-km LST data were corrected using equation (2) for the Wan et al.'s approach, equation (5) for the refined approach, and equation (9) for the GSW algorithm based approach. The corrected LST,
was further rectified for terrain angular effect using the following equation as in [8]
where
is the rectified LST. Finally, statistical test, correlation analysis, and regression analysis were performed on all the images produced.
4. Results and discussion
The ASTER and MODIS images are referred to [8]. Statistical tests showed that the ASTER LST, the MODIS LST, and all the corrected LST data, followed a normal distribution (p<0.001). This allowed us to confidently use statistical descriptors such as mean, standard deviation (S.D.), root mean square error (RMSE), and correlation coefficient (r). Because satellite-retrieved LST is generally the product without correction for terrain effects, we analyzed the cases with and without terrain correction to investigate the effectiveness of the correction approaches over relief areas.
4.1. Comparison of three correction approaches in the case without terrain correction
The upscaled 1-km ASTER LST from Equation (11) represents the case without terrain effects or the case over flat area. As shown in Table 1, ASTER LST ranged from 296.2 K to 320.7 K with a mean and standard deviation of 312.5±3.85 K. The MODIS MOD11_L2 1-km LST (original data) had a range from 296.2 K to 317.3 K with a mean and standard deviation of 309.8±3.57 K. The ASTER LST was higher than the MODIS LST by 2.7 K for the mean and 0.28 K for S.D. The minimum LST values were the same, but the maximum values were 3.4 K higher than MODIS.
All three correction approaches made significant effects on the original MODIS LST. The Wan et al.'s approach increased the MODIS LST from 309.8±3.57 K to 312.0±3.48 K, and reduced the ASTER-to-MODIS difference from 2.7±1.28 K to 0.6±1.84 K. The minimum MODIS LST increased from 296.2 K to 299.0 K, higher than the ASTER value. The refined approach increased the MODIS LST to 311.6±3.74 K, reducing the ASTER-to-MODIS difference to 0.9±1.50 K. The GSW algorithm based approach increased the MODIS LST to 311.7±3.61 K, reducing the difference to 0.8±1.14 K. With respect to RMSE of ASTER-to-MODIS LST difference, it decreased from 3.02 K to 1.92 K with the Wan et al.'s approach, 1.74 K with the refined approach, and 1.39 K with the GSW algorithm based approach. Overall, all the approaches reduced the discrepancy to less than 1 K on average. Among all the approaches, the Wan et al.'s approach reduced the discrepancy the most in terms of mean.
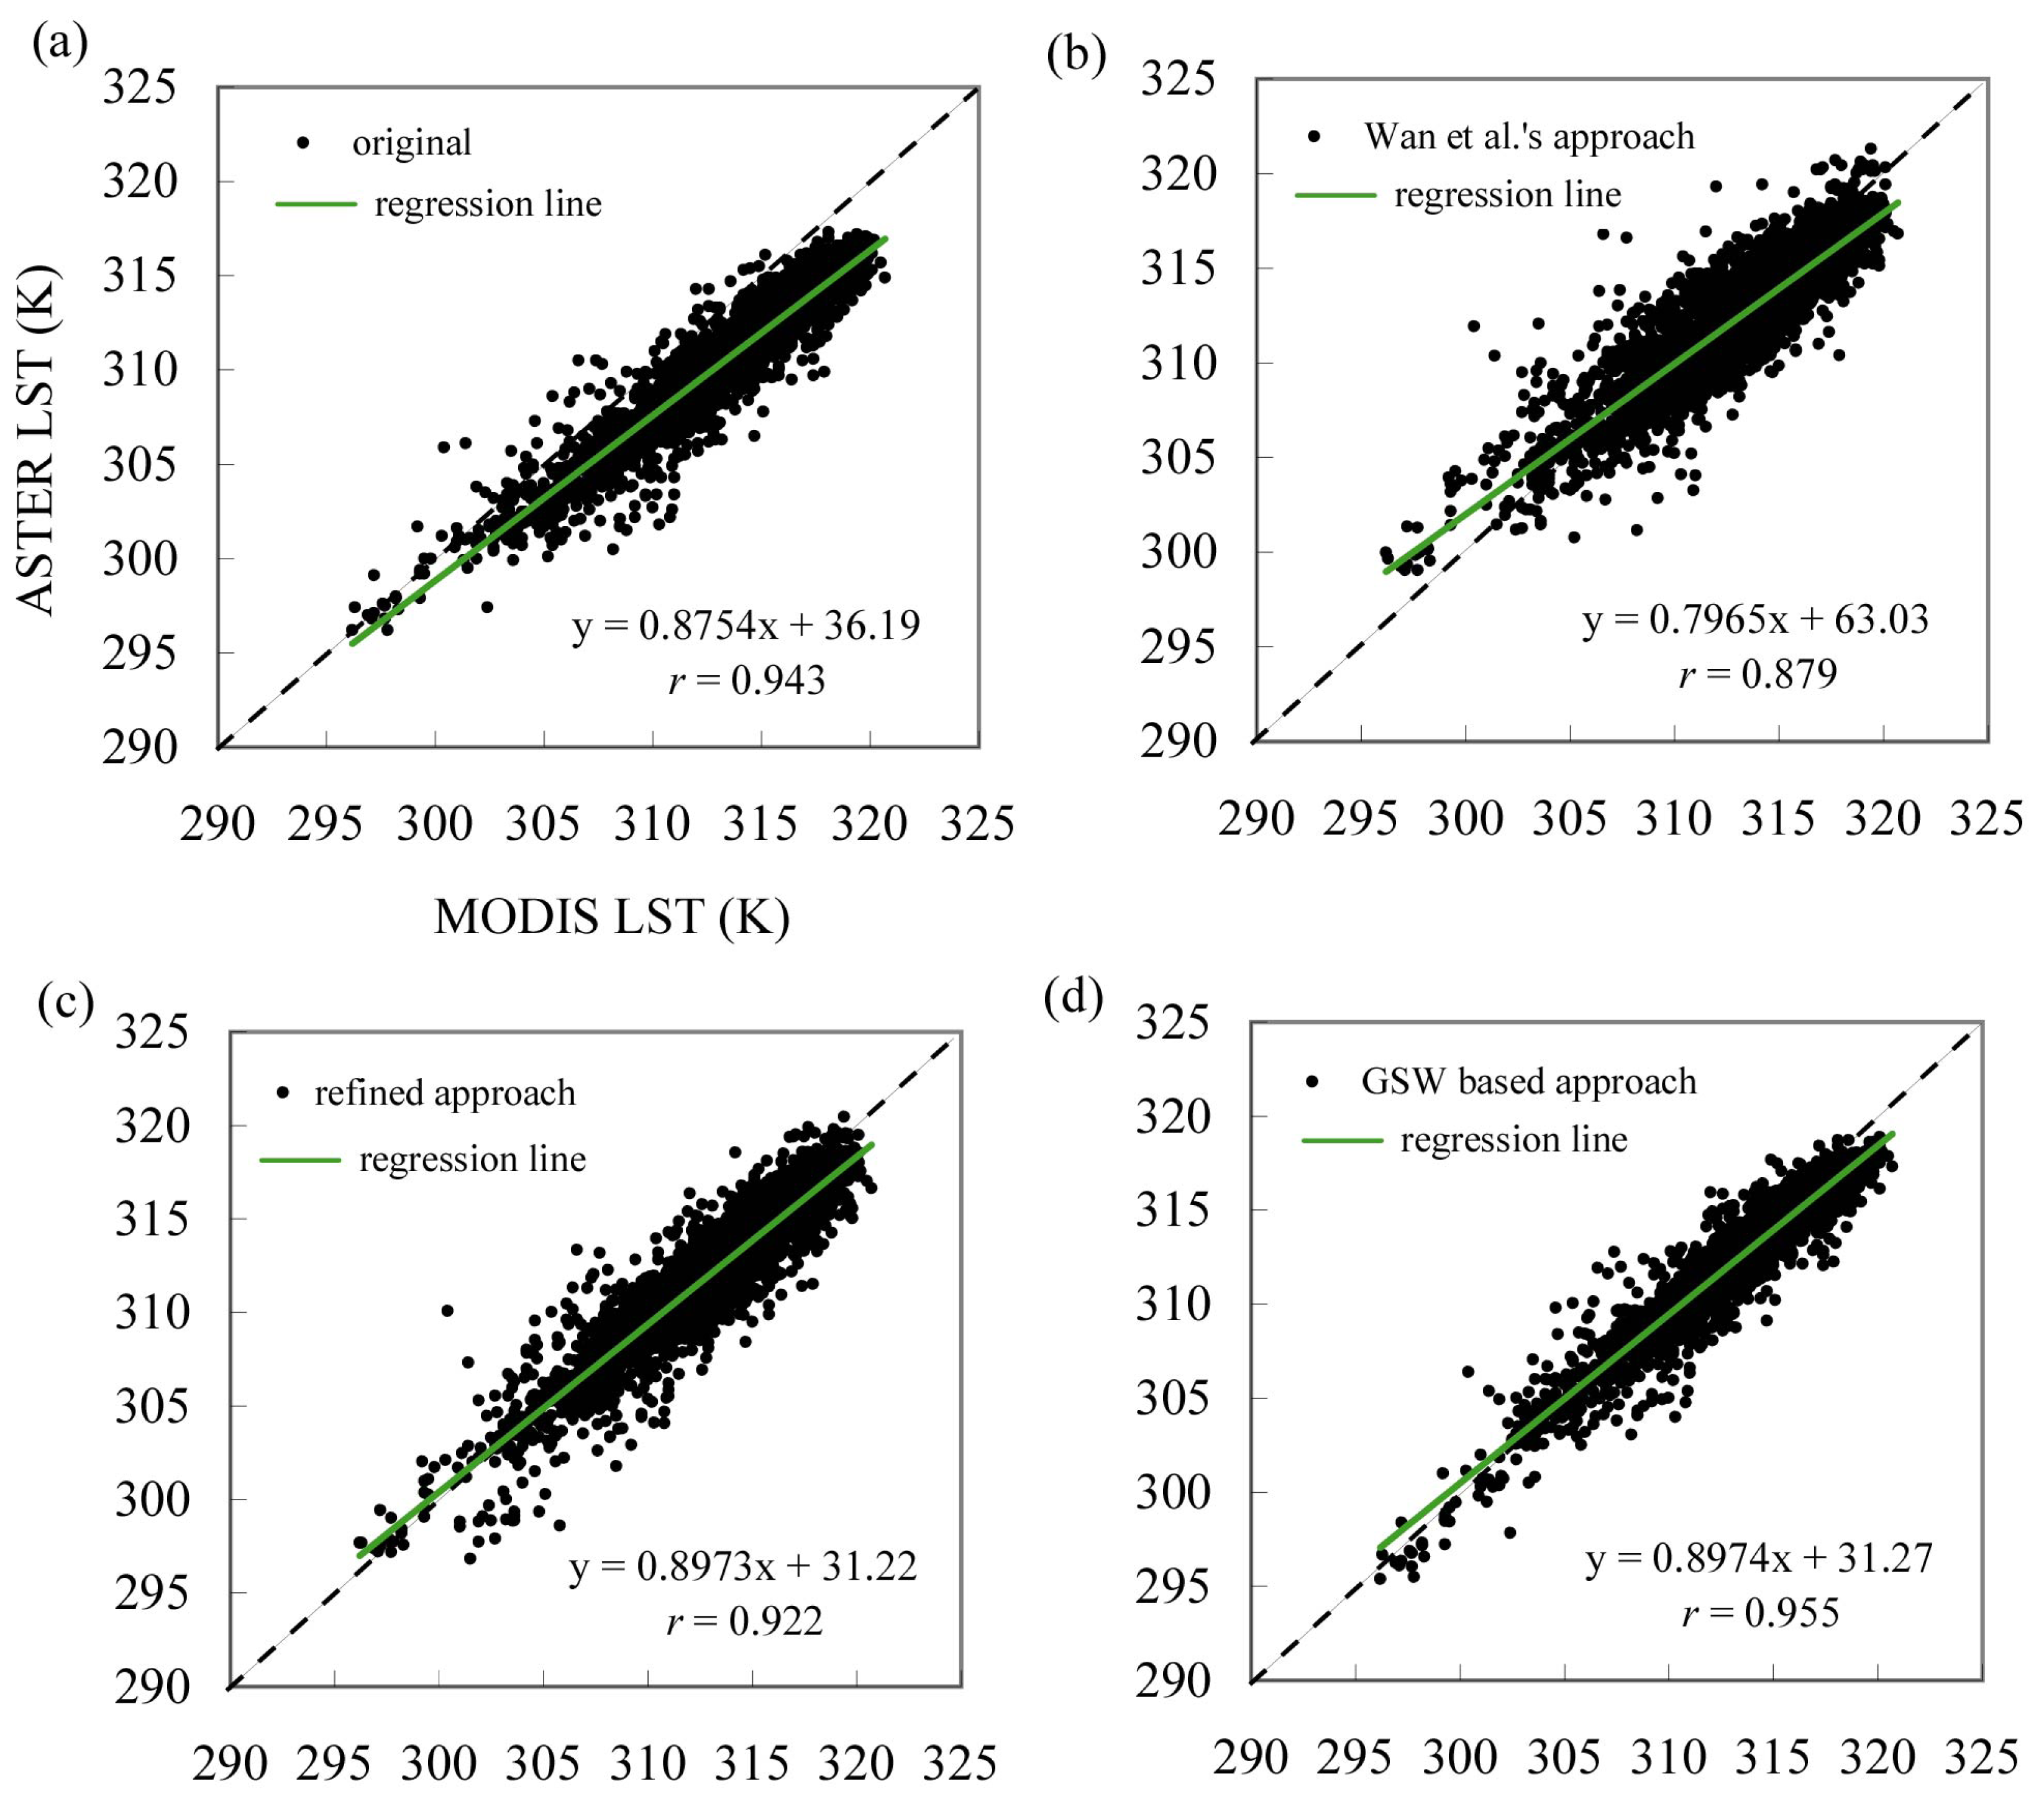
Fig.1 shows the distribution of the MODIS versus ASTER LST. Notably, the Wan et al.'s approach produced more scatter points (Fig. 1(b)) than other approaches. The correlation coefficient (r) of MODIS LST versus ASTER LST decreased from 0.943 to 0.879 with the Wan et al.'s approach. The deteriorated correlation resulted primarily from the coarse resolution of MODIS 5-km LST data [8]. The refined approach had a r of 0.922; and the GSW algorithm based approach had a r of 0.955. In general, the Wan et al.'s approach generated the lowest r that was primarily due to the use of coarse resolution 5-km LST data in the correction [8]. The GSW algorithm based approach produced the least ASTER-to-MODIS LST discrepancy in terms of S.D., RMSE, and r.
4.2. Comparison of three correction approaches in the case with terrain correction
From equation (10), we generated the upscaled 1-km ASTER LST, in which terrain angular and adjacency effects were accounted for. In this case, the ASTER LST ranged from 299.0 K to 320.8 K with a mean and standard deviation of 312.9±3.74 K (Table 2). The original MODIS LST with terrain correction ranged from 296.2 K to 318.8 K with a mean and standard deviation of 310.8±3.60 K. The ASTER LST was higher than the MODIS LST by 2.1 K for the mean and 0.14 K for S.D. The minimum ASTER LST was 2.8 K higher than MODIS.
All three approaches corrected the original MODIS LST effectively. The Wan et al.'s approach increased the MODIS LST to 313.0±3.54 K, significantly reducing the ASTER-to-MODIS difference from 2.1±1.31 K to -0.1±1.87 K. The minimum MODIS LST increased from 296.2 K to 299.0 K, close to the ASTER value. The refined approach reduced the ASTER-to-MODIS difference to 0.2±1.57 K, and the GSW algorithm based approach reduced the ASTER-to-MODIS difference to 0.1±1.33 K. The RMSE of the ASTER-to-MODIS difference decreased from 2.44 K to 1.87 K with the Wan et al.'s approach, 1.58 K with the refined approach, and 1.34 K with the GSW algorithm based approach. Overall, all the correction approaches largely reduced the ASTER-to-MODIS discrepancy. The GSW algorithm based approach achieved the best results in terms of mean, S.D. and RMSE.
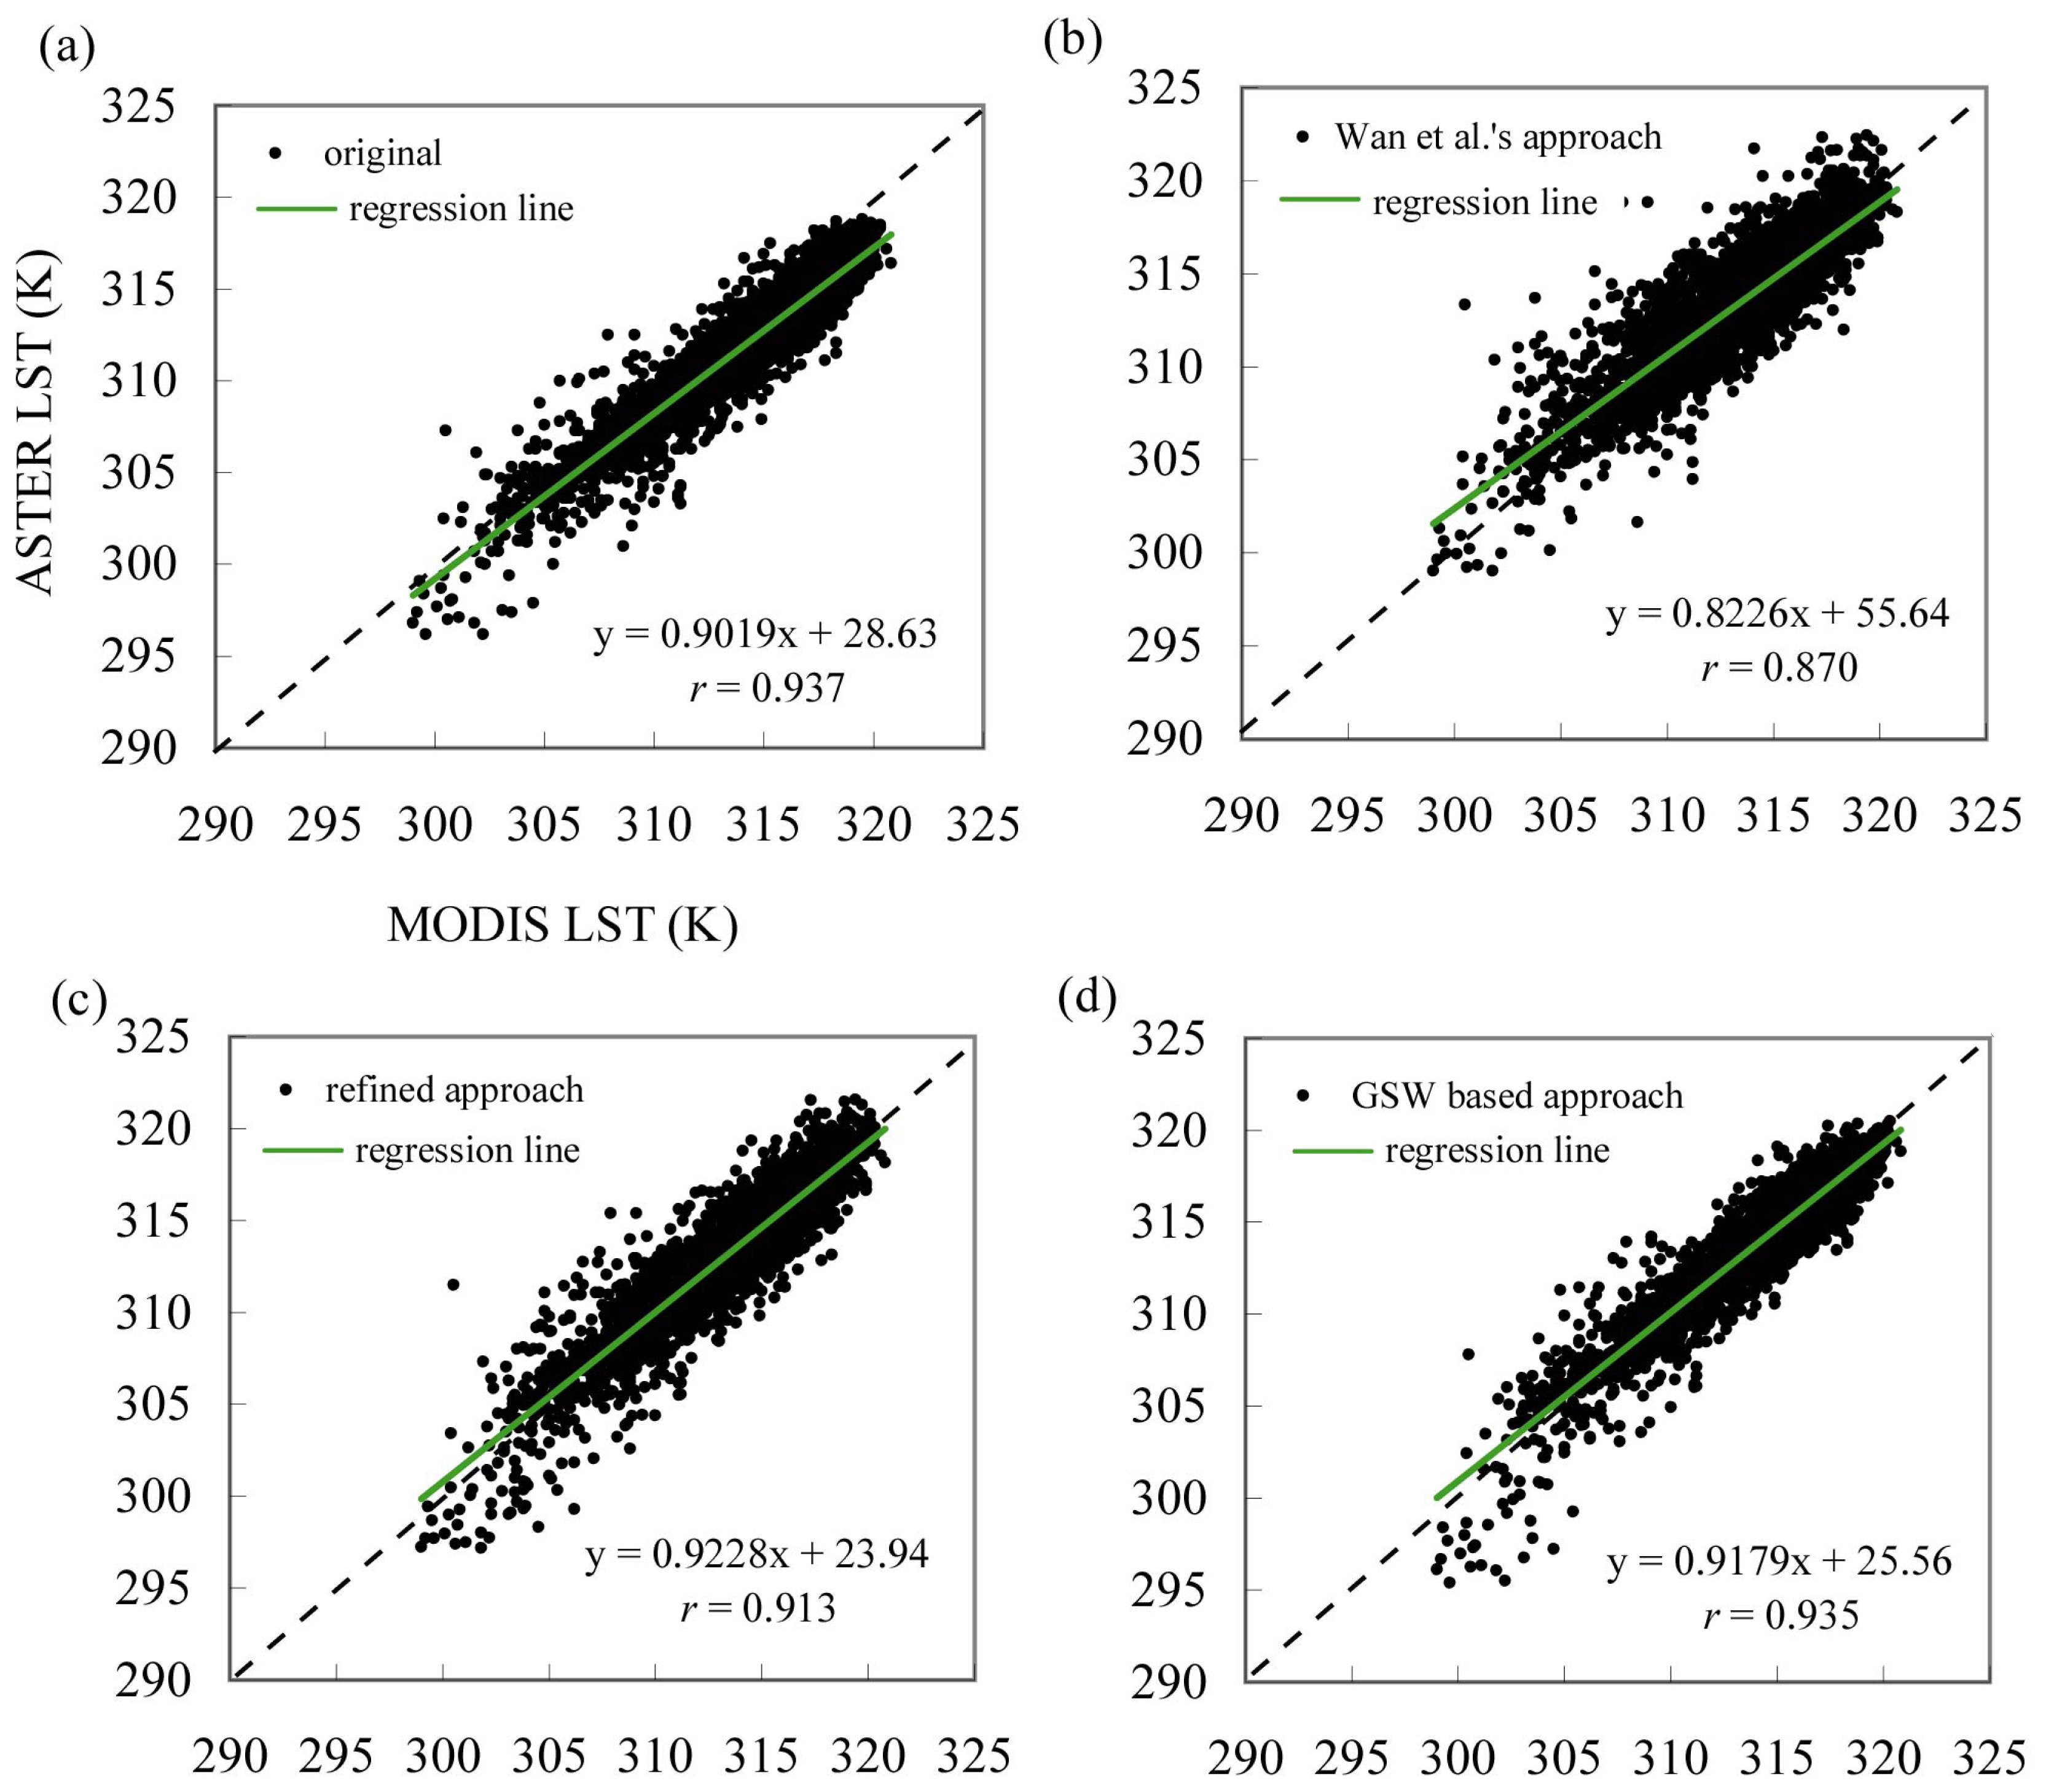
Fig.2 illustrates the distribution of the MODIS versus ASTER LST for the case with terrain correction. Once again, the Wan et al.'s approach generated more scatter points (Fig. 2(b)) than the other approaches. The correlation coefficient (r) of MODIS versus ASTER LST decreased from 0.937 to 0.870 with the Wan et al.'s approach; to 0.913 with the refined approach; and to 0.935 with the GSW algorithm based approach. Among the three approaches, the Wan et al.'s method had the lowest r, while the GSW algorithm based approach had the highest r values. Notably, the GSW algorithm based approach under-corrected the LST at low temperatures (300-305 K).
4.3. Overall evaluation
All three correction approaches reduced the ASTER-to-MODIS LST discrepancy effectively for the cases with and without terrain correction. The original ASTER-to-MODIS LST difference was 2.7±1.28 K. Without terrain correction, the corresponding reduced LST discrepancy was 0.6±1.84 K for the Wan et al.'s approach, 0.9±1.50 K for the refined approach, and 0.8±1.14 K for the GSW algorithm based approach. With terrain correction, the ASTER-to-MODIS LST discrepancy was minimized even further: -0.1±1.87 K for the Wan et al.'s approach, 0.2±1.57 K for the refined approach, and 0.1±1.33 K for the GSW algorithm based approach. The RMSE of the LST difference reduced from 3.02 K to 2.44 K for the original MODIS LST, 1.92 K to 1.87 K for the Wan et al.'s approach, 1.74 K to 1.58 K for the refined approach, and 1.39 K to 1.34 K for the GSW algorithm based approach. By comparing these values, we can deduce that the terrain effects contribution was approximately 30% of the total discrepancy for the examined case. To achieve a better agreement between ASTER and MODIS LST, it is necessary to correct terrain induced effects for the case over rough areas.
The Wan et al.'s approach was “globally” effective in reducing the ASTER-to-MODIS LST discrepancy in terms of mean. Among all three approaches, it had the lowest r values of the ASTER versus MODIS LST and the largest S.D. and RMSE values of the ASTER-to-MODIS LST discrepancy for the cases with and without terrain correction. The low r and the large S.D. and RMSE values were primarily resulted from the coarse resolution of the MODIS 5-km LST. To lessen the problem due to the coarse resolution, the refined approach downscaled the MODIS LST from 5-km into 1-km. As a result, r increased from 0.879 to 0.922 and from 0.870 to 0.913 for the cases without and with terrain correction, respectively. Correspondingly, S.D. reduced from 1.84 to 1.50 and from 1.87 to 1.57, and RMSE reduced from 1.92 to 1.74 and from 1.87 to 1.58, for the cases without and with terrain correction, respectively. Alternatively, the GSW algorithm based approach did not use the coarse resolution 5-km data but ASTER emissivity that has a high accuracy. By rectifying the classification based emissivity used in GSW retrieval algorithm, the approach achieved the best agreement between ASTER and MODIS LST in terms of mean, S.D., RMSE and r.
4.4. Advantages and disadvantages of each correction approach
All the correction approaches can be easily implemented for the end user of MODIS and ASTER LST products. The Wan et al.'s approach requires MODIS 5-km LST data to correct the MODIS 1-km LST. It achieved good agreement with the ASTER LST in the present case. Because it does not use the ASTER data, it is not absolutely necessary for the approach to be effective in all the cases in reducing the ASTER-to-MODIS LST discrepancy. Alternatively, the refined approach makes use of both ASTER emissivity and MODIS 5-km data. It achieved better agreement with the ASTER LST than the Wan et al.'s approach did. The approach appears more complex than the GSW algorithm approach for practical use. The GSW algorithm based approach does not use MODIS 5-km data but does use ASTER emissivity data, and it requires multiple regressions to obtain the regression coefficients that are unavailable to the end user.
5. Conclusions
LST is a key variable and indicator of change in numerous environmental studies. MODIS can provide 1-km LST with almost daily coverage of the Earth; invaluable to both local- and global-scale studies. ASTER provides an 90-m resolution LST product acquired at the same time, height and nadir view as for MODIS/Terra. ASTER and MODIS offer a unique opportunity for scale-related comparative studies. However, there was found the discrepancy as large as 3 K between ASTER and MODIS LST values, even when scale difference was explicitly accounted for. The discrepancy may weaken the reliability of relevant studies that are based on ASTER and MODIS LST.
This study compared three approaches available for correcting the ASTER-to-MODIS LST discrepancy. The Wan et al.'s approach corrects the MODIS 1-km LST with reference to the MODIS 5-km LST for the errors in classification-based emissivity. The refined approach modifies the Wan et al.'s approach through incorporating ASTER emissivity and MODIS 5-km data. The GSW algorithm approach does not use MODIS 5-km but only ASTER emissivity data. All the approaches effectively reduced the LST discrepancy in the examined cases with and without terrain correction. Terrain induced effects could contribute to the total LST discrepancy by approximately 30% on average, implying that terrain correction is essential in minimizing ASTER-to-MODIS differences. With terrain correction, the original ASTER-to-MODIS LST difference reduced from 2.7±1.28 K to -0.1±1.87 K for the Wan et al.'s approach, 0.2±1.57 K for the refined approach, and 0.1±1.33 K for the GSW algorithm based approach. Among all the approaches, the GSW algorithm based method performed best in terms of mean, S.D., RMSE, and correlation coefficient.
Acknowledgments
This work is sponsored by a grant from the Ministry of Education, Culture, Sports, Science and Technology, Japan, “Dynamics of the Sun-Earth-Life Interactive System, No.G-4, the 21st Century COE Program”, and a Grant-in-Aid for scientific Research (B) (No. 17360432) from the Japan Society for the Promotion of Science. ASTER and MODIS images were obtained from EOS Data Gateway at http://redhook.gsfc.nasa.gov. ASTER 3D-Ortho product was provided by ERSDAC. We thank Dr Kenichi Okada for his assistance to generate an ASTER acquisition schedule. We acknowledge Dr. Glynn Hulley at Jet Propulsion Laboratory for his review and useful comments. We thank the anonymous reviewers for their constructive comments and suggestions.
References
- Karl, T. R.; Hassol, S. J.; Miller, C. D.; Murray, W. L. Temperature trends in the lower atmosphere: Steps for understanding and reconciling differences. 2006. Available at http://www.climatescience.gov/Library/sap/sap1-1/default.php.
- Justice, C.; Vermote, E.; Townshend, J.; Defries, R.; Roy, D.; Hall, D.; Salomonson, V.; Privette, J.; Riggs, G.; Strahler, A.; Lucht, W.; Myneni, R.; Knyazikhin, Y.; Running, S.; Nemani, R.; Wan, Z.; Huete, A.; van Leeuwen, W.; Wolfe, R.; Giglio, L.; Muller, J.–P.; Lewis, P.; Barnsley, M. The MODerate Imaging Spectroradiometer (MODIS): land remote sensing for global change research. IEEE Transactions on Geoscience and Remote Sensing 1998, 36, 1228–1249. [Google Scholar]
- Yamaguchi, Y.; Kahle, A.; Tsu, H.; Kawakami, T.; Pniel, M. Overview of Advanced Space-borne Thermal Emission and Reflection Radiometer (ASTER). IEEE Transactions on Geoscience and Remote Sensing 1998, 36, 1062–1071. [Google Scholar]
- Houborg, R. M.; Soegaard, H. Regional simulation of ecosystem CO2 and water vapor exchange for agricultural land using NOAA AVHRR and Terra MODIS satellite data. Application to Zealand, Denmark. Remote Sensing of Environment 2004, 93, 150–167. [Google Scholar]
- Cleugh, H. A.; Leuning, R.; Mu, Q.; Running, S. W. Regional evaporation estimates from flux tower and MODIS satellite data. Remote Sensing of Environment 2007, 106, 285–304. [Google Scholar]
- Hashimoto, H.; Dungan, J. L.; White, M. A.; Yang, F.; Michaelis, A. R.; Running, S. W.; Nemani, R. R. Satellite-based estimation of surface vapor pressure deficits using MODIS land surface temperature data. Remote Sensing of Environment 2008, 112, 142–155. [Google Scholar]
- McCabe, M. F.; Wood, E. F. Scale influences on the remote estimation of evapotranspiration using multiple satellite sensors. Remote Sensing of Environment 2006, 105, 271–285. [Google Scholar]
- Liu, Y.; Hiyama, T.; Yamaguchi, Y. Scaling of land surface temperature using satellite data: A case examination on ASTER and MODIS products over a heterogeneous terrain area. Remote Sensing of Environment 2006, 105, 115–128. [Google Scholar]
- Liu, Y.; Yamaguchi, Y.; Hiyama, T. A new approach to reduce inconsistency between MODIS & ASTER land surface temperature products. Proc. of SPIE 2006, 6359, 635906. [Google Scholar]
- Jacob, F.; Petitcolin, F.; Schmugge, T.; Vermote, E.; French, A.; Ogawa, K. Comparison of land surface emissivity and radiometric temperature derived from MODIS and ASTER sensors. Remote Sensing of Environment 2004, 90, 137–152. [Google Scholar]
- Norman, J. M.; Becker, F. Terminology in thermal infrared remote sensing of natural surfaces. Agricultural and Forest Meteorology 1995, 77, 153–166. [Google Scholar]
- Dash, P.; Göttsche, F.–M.; Olesen, F.–S.; Fischer, H. Land surface temperature and emissivity estimation from passive sensor data: theory and practice – current trends. International Journal of Remote Sensing 2002, 23(13), 2563–2594. [Google Scholar]
- Gillespie, A.; Rokugawa, S.; Matsunaga, T.; Cothern, S.; Hook, S.; Kahle, A. A temperature and emissivity separation algorithm for Advanced Spaceborne Thermal Emission and Reflection Radiometer (ASTER) images. IEEE Transactions on Geoscience and Remote Sensing 1998, 36, 1113–1126. [Google Scholar]
- Schmugge, T.; Hook, S. J.; Coll, C. Recovering surface temperature and emissivity from thermal infrared multispectral data. Remote Sensing of Environment 1998, 65, 121–131. [Google Scholar]
- Wan, Z.; Li, Z. -L. A physics-based algorithm for retrieving land-surface emissivity and temperature from EOS/MODIS data. IEEE Transactions on Geoscience and Remote Sensing 1997, 35, 980–996. [Google Scholar]
- Wan, Z. MODIS land-surface temperature algorithm theoretical basis document (LST ATBD). Version 3. 1999. Available at http://modis.gsfc.nasa.gov/data/atbd/atbd_mod11.pdf.
- Wan, Z.; Zhang, Y.; Zhang, Q.; Li, Z. –L. Validation of the land-surface temperature products retrieved from Terra Moderate Resolution Imaging Spectroradiometer data. Remote Sensing of Environment 2002, 83, 163–180. [Google Scholar]
- Wan, Z.; Dozier, J. A generalized split-window algorithm for retrieving land-surface temperature from space. IEEE Transactions on Geoscience and Remote Sensing 1996, 34, 892–905. [Google Scholar]
- Snyder, W. C.; Wan, Z.; Zhang, Y.; Feng, Y.-Z. Classification-based emissivity for land surface temperature measurement from space. International Journal of Remote Sensing 1998, 19, 2753–2774. [Google Scholar]
- Muchoney, D.; Borak, J.; Chi, H.; Friedl, M.; Gopal, S.; Hodges, J.; Morrow, N.; Strahler, A. Application of the MODIS global supervised classification model to vegetation and land cover mapping of Central America. International Journal of Remote Sensing 2000, 21, 1115–1138. [Google Scholar]
- Abrams, M.; Hook, S.; Ramachandran, B. ASTER User Handbook. Jet Propulsion Laboratory, California Institute of Technology, 2002. Available at http://asterweb.jpl.nasa.gov/content/03_data/04_Documents/aster_user_guide_v2.pdf.
- Keys, R. G. Cubic Convolution Interpolation for Digital Image Processing. IEEE Transactions on Acoustics, Speech, and Signal Processing 1981, 29, 1153–1160. [Google Scholar]
- Nishihama, M.; Wolfe, R.; Solomon, D.; Patt, F.; Blanchette, J.; Fleig, A.; Masuoka, E. MODIS level 1A earth location: Algorithm theoretical basis document. Version 3. 1997. Available at http://modis.gsfc.nasa.gov/data/atbd/atbd_mod28.pdf.
- Barnes, W.; Pagano, T.; Salomonson, V. Prelaunch characteristics of the Moderate Resolution Imaging Spectroradiometer (MODIS) on EOS-AM1. IEEE Transactions on Geoscience and Remote Sensing 1998, 36, 1088–1100. [Google Scholar]
- Wolfe, R. E.; Nishihama, M.; Fleig, A. J.; Kuyper, J. A.; Roy, D. P.; Storey, J. C.; Patt, F. S. Achieving sub-pixel geolocation accuracy in support of MODIS land science. Remote Sensing of Environment 2002, 83, 31–49. [Google Scholar]
Figure 1.
Scattergram of MODIS LST versus scaled ASTER LST without terrain correction for the case (a) The original MODIS MOD11_L2 LST, (b) The MODIS LST corrected using the Wan et al's approach, (c) The MODIS LST corrected using the refined approach, and (d) The MODIS LST corrected using the GSW algorithm based approach.

Figure 2.
Scattergram of MODIS LST versus scaled ASTER LST with terrain correction for the cases (a) The original MODIS MOD11_L2 LST, (b) The MODIS LST corrected using the Wan et al's approach, (c) The MODIS LST corrected using the refined approach, and (d) The MODIS LST corrected using the GSW algorithm based approach.


Table 1.
Comparison of the MODIS LST (original and corrected by three approaches) with reference to the ASTER LST, without correction for terrain effects.
| ASTER LST (K) | MODIS LST (K) | |||||
|---|---|---|---|---|---|---|
| original | Wan et al. | refined | GSW algorithm based | |||
| Min. | 296.2 | 296.2 | 299.0 | 296.8 | 295.4 | |
| Max. | 320.7 | 317.3 | 321.3 | 320.5 | 318.9 | |
| Mean | 312.5 | 309.8 | 312.0 | 311.6 | 311.7 | |
| S.D. | 3.85 | 3.57 | 3.48 | 3.74 | 3.61 | |
| ASTER-to-MODIS LST difference | Mean. | 2.7 | 0.6 | 0.9 | 0.8 | |
| S.D. | 1.28 | 1.84 | 1.50 | 1.14 | ||
| RMSE | 3.02 | 1.92 | 1.74 | 1.39 | ||
Table 2.
Comparison of the MODIS LST (original and corrected by three approaches) with reference to the ASTER LST, all corrected for terrain effects.
| ASTER LST (K) | MODIS LST (K) | |||||
|---|---|---|---|---|---|---|
| original | Wan et al. | refined | GSW algorithm based | |||
| Min. | 299.0 | 296.2 | 299.0 | 297.2 | 295.4 | |
| Max. | 320.8 | 318.8 | 322.4 | 321.6 | 320.5 | |
| Mean | 312.9 | 310.8 | 313.0 | 312.7 | 312.8 | |
| S.D. | 3.74 | 3.60 | 3.54 | 3.78 | 3.67 | |
| ASTER-to-MODIS LST difference | Mean. | 2.1 | -0.1 | 0.2 | 0.1 | |
| S.D. | 1.31 | 1.87 | 1.57 | 1.33 | ||
| RMSE | 2.44 | 1.87 | 1.58 | 1.34 | ||
© 2007 by MDPI ( http://www.mdpi.org). Reproduction is permitted for noncommercial purposes.
Share and Cite
MDPI and ACS Style
Liu, Y.; Yamaguchi, Y.; Ke, C. Reducing the Discrepancy Between ASTER and MODIS Land Surface Temperature Products. Sensors 2007, 7, 3043-3057. https://doi.org/10.3390/s7123043
AMA Style
Liu Y, Yamaguchi Y, Ke C. Reducing the Discrepancy Between ASTER and MODIS Land Surface Temperature Products. Sensors. 2007; 7(12):3043-3057. https://doi.org/10.3390/s7123043
Chicago/Turabian StyleLiu, Yuanbo, Yasushi Yamaguchi, and Changqing Ke. 2007. "Reducing the Discrepancy Between ASTER and MODIS Land Surface Temperature Products" Sensors 7, no. 12: 3043-3057. https://doi.org/10.3390/s7123043