Article

Detection of Brominated By-Products Using a Sensor Array Based on Nanostructured Thin Films of Conducting Polymers

by
Eduarda Regina Carvalho
1,*,
Nelson Consolin Filho
1,
Everaldo Carlos Venancio
1,
Osvaldo N. O., Jr.
2,
Luiz H. C. Mattoso
1 and
Ladislau Martin-Neto
1
1
Embrapa Instrumentação Agropecuária, P.O. Box 741, 13560-970, São Carlos/SP, Brazil
2
Instituto de Física de São Carlos, Universidade de São Paulo, USP, SP, Brazil
*
Author to whom correspondence should be addressed.
Sensors 2007, 7(12), 3258-3271; https://doi.org/10.3390/s7123258
Submission received: 20 September 2007 / Accepted: 19 November 2007 / Published: 12 December 2007
(This article belongs to the Special Issue Electrochemical Sensors Based on Conductive Polymers)

Abstract

:
The detection of the carcinogenic trihalomethanes (THM) in public water supply systems using low-cost equipment has become an essential feature, since these compounds may be generated as by-products of water-treatment processes. Here we report on a sensor array that extends the concept of an “electronic tongue” to detect small amounts of bromoform, bromodichloromethane and dibromochloromethane, with detection limits as low as 0.02 mg L-1. The sensor array was made up of 10 sensing units, in which nanostructured films of conducting and natural polymers were deposited onto gold interdigitated electrodes. The principle of detection was impedance spectroscopy, with measurements carried out in the range between 1 Hz to 1 MHz. Using data at 1 kHz, at which the electrical response varied considerably by changing the analyte, we demonstrated with principal component analysis (PCA) that samples with the 3 brominated trihalomethanes can be distinguished from each other and for various concentrations.

1. Introduction

Water disinfection processes in public supply systems may generate carcinogenic by-products [1-3], such as those arising from chlorination. In addition to problems associated with kidney, colon, rectum and liver neoplasy [1, 2], recent studies showed correlations between cases of leukemia, lung and pancreas cancer with aquatic disinfection by-products [3]. The main precursors for organochlorinated by-products in aquatic systems are organic matter that interacts with disinfectants used in the water treatment process [4], thus forming especially trihalomethanes (THM – Figure 1). These by-products, in which three of the four hydrogen atoms are replaced with three atoms of chlorine, bromine or iodine, are generated by breaking organic molecules from aquatic humic substances (AHS), such as aromatic compounds, di-ketone phenolic structures and carboxylic acids [5, 6]. The most common THM species formed are chloroform (CHCl3), bromodichloromethane (CHBrCl2), dibromochloromethane (CHBr2Cl) and bromoform (CHBr3) [6], resulting from reactions between organic material and hypochlorous or hypobromous acids generated during water disinfection. This is the reason why AHS reactions with chlorine and bromine have become a major public health concern [5].
A higher formation rate is observed for Br-containing than chlorine-containing THM, since Br is more competitive for the “active sites” in organic precursor molecules [7]. Br occurs naturally in many supply waters either at the surface or underground [3]. Using ozone in the water treatment process has also been troublesome because of the formation of bromide compounds [7]. The concentrations of THMs in chlorinated drinking water (USA) are in the ranges: 0.7 × 10⁻³ - 540.0 × 10⁻³ mg L-1 (mean 26.4 × 10⁻³ mg L-1) for chloroform; 1.0 × 10⁻³ - 2.7 × 10⁻³ mg L-1 (mean 0.5 × 10⁻³ mg L-1) for bromoform, 1.9 × 10⁻³ – 183.0 × 10⁻³ mg L-1 (mean 9.1 × 10⁻³ mg L-1) for bromodichloromethane and 0.4 × 10⁻³ - 280.0 × 10⁻³ mg L-1 (mean 5.7 × 10⁻³ mg L-1) for dibromochloromethane [8]. In Brazil, concentrations of 0.08 mg L-1 - 0.20 mg L-1 (for chloroform); 0.1 × 10⁻³ mg L-1 - 0.03 mg L-1 (for bromoform); 0.02 mg L-1 - 0.07 mg L-1 (for bromodichloromethane) and 4.0 × 10⁻³ mg L-1 - 0.04 mg L-1 (for dibromochloromethane), have been reported [1,9, 10]. THMs represent 5 to 20% of the total by-products from water chlorination [11]. Even at low concentrations they are highly toxic, carcinogenic, teratogenic and mutagenic [12, 13]. For example, chloroform concentrations of the order of 0.2 mg L-1 gave positive results in bioassays for cancer development [14]. As for brominated THMs, reports have been made of cancer risk for concentrations of 1.0 × 10⁻³ mg L-1 (Bromodichloromethane), 0.8 × 10⁻³ mg L-1 (Dibromochloromethane) and 8.0 × 10⁻³ mg L-1 (Bromoform) [15].
Given the obvious need to detect and control THMs in waters, especially in the public supply systems, there is now the challenge of developing low-cost equipment for monitoring water quality. An alternative is the sensor array, normally referred to as “electronic tongue”, which has been proven suitable to detect trace amounts of impurities in water [16, 17]. In such an array, a nanostructured organic film is deposited onto interdigitated electrodes, which are then immersed into the liquid samples and the electrical impedance of the whole system is measured [17]. Though a variety of materials can be used in the sensing units [see for instance ref. 18, 19], a judicious choice of the materials may help optimize the sensor performance for specific analytes. In this work, in particular, we selected conducting polymers, sulfonated lignin and aquatic humic substances for building the sensing units. This choice is justified by the large change in electrical properties of conducting polymers exposed to different environments, and by the well-known ability of humic substances to interact with brominated compounds. Using a 10-unit sensor array, we demonstrate it to be possible to detect and distinguish between 3 types of THM, at concentrations that are much lower than normally encountered in treated water.

2. Experimental

Bromoform, bromodichloromethane and dibromochloromethane samples (PA) were acquired from Supelco USA (SIGMA-ALDRICH) with a purity degree of 99.90%. A stock solution with 10 mg L-1 and pH = 6.5 was prepared with pure water from a Milli-Q system (Millipore®), from which dilute solutions were obtained with concentrations ranging from 0.05 mg L-1 to 8.0 mg L-1.
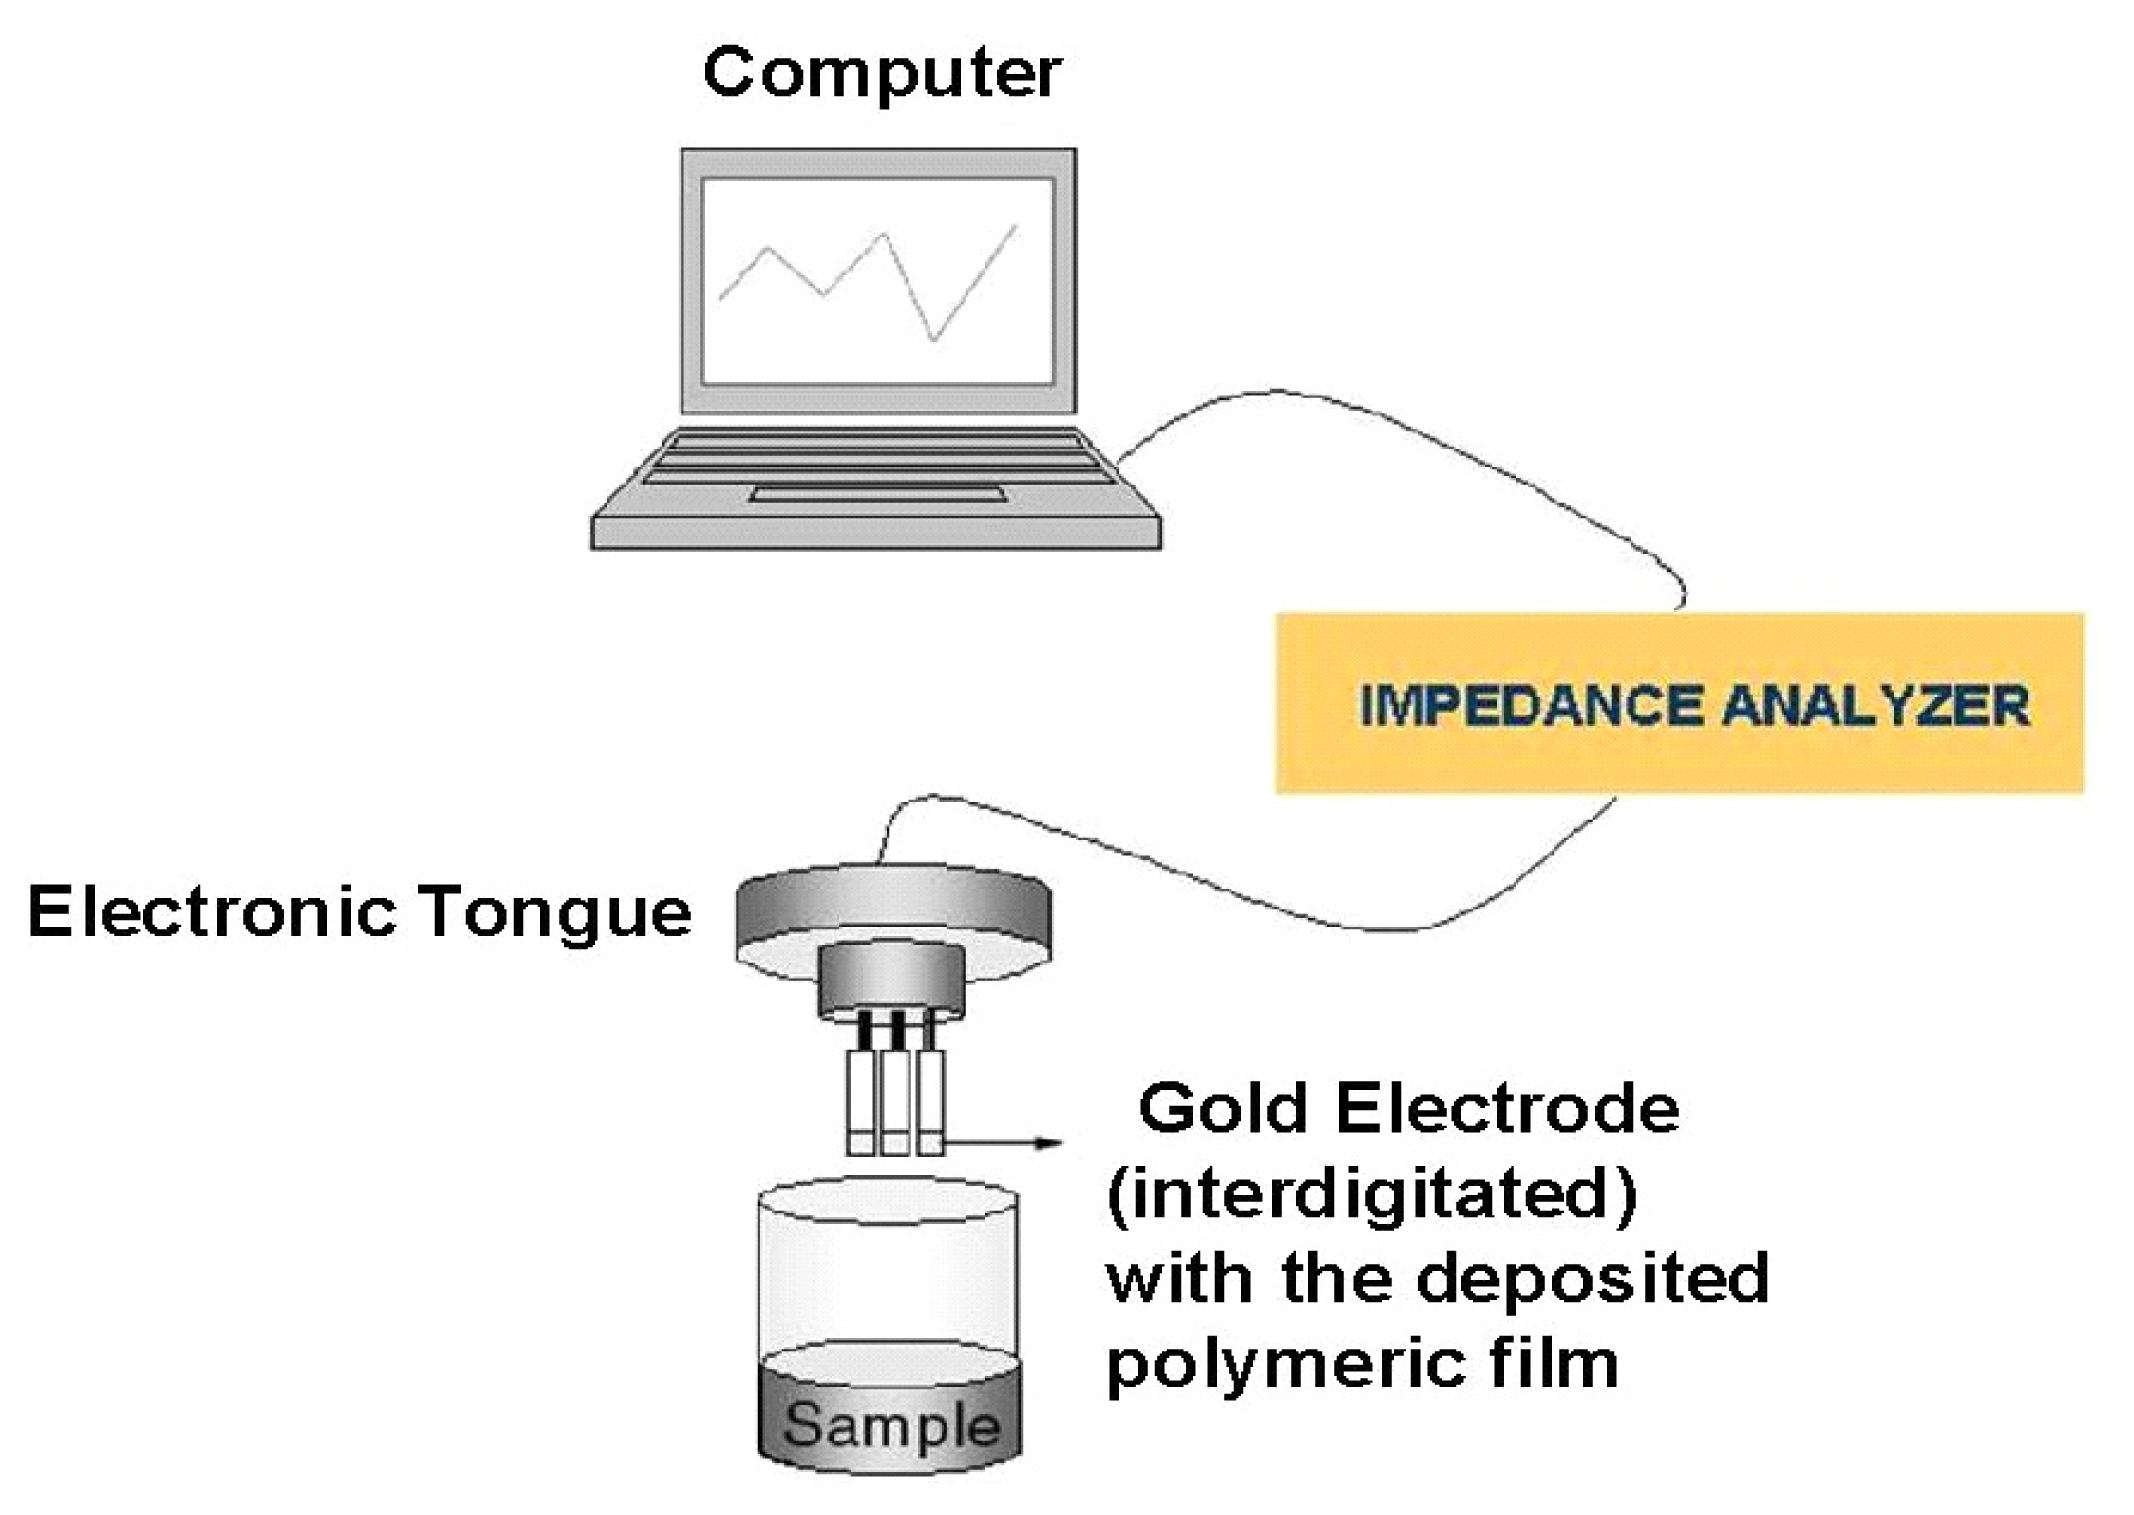
The polymers used for film fabrication were polyaniline (PANI), poly(o-ethoxyaniline) (POEA), aquatic humic substances (AHS) and sulfonated lignin (SL). PANI and POEA were chemically synthesized as described in references [20-22], using ammonium peroxydisulfate in solution of 1.0 mol L-1 HCl at 0 °C. SL was obtained from Melbar (Brazil) and AHS were isolated from a water sample collected from River João Pereira, which is a tributary of the River Itapanhaú, located downstream-upstream. River Itapanhaú is located in an environmentally-protected area near the city of Bertioga, on the south coast of São Paulo state, Brazil [23]. The extraction and fractioning were made according to procedures established by the International Society of Humic Substances [24], as well as recommendations by Malcolm [25]. The AHS solutions were prepared in the concentrations of 5, 10 and 30 mg L-1. All the aqueous solutions of POEA, SL and AHS were prepared using ultra pure water from a Milli-Q system (Millipore®). The pH was adjusted by adding amounts of 0.1 M of HCl or 0.1 M of NH4OH. The details for film deposition for the sensing units are presented in Table 1, while the experimental setup for sensing is depicted in Figure 2.
The polymer nanostructured films with different architectures were deposited onto the interdigitated microelectrodes of glass-coated gold using the layer-by-layer (LbL) technique [26-29]. The layers were deposited with an immersion time of 3 min. per layer, from aqueous solutions at pH = 5.0 and concentration 10-3 mol L-1, with the exception of PANI that was dissolved in NMP (N-Methyl-2-Pyrrolidone), with concentration of 10-3 mol L-1. Ten sensing units were produced as follows: i) Sensor 1 (S1): without film; ii) Sensor 2 (S2) had one layer of POEA deposited from a pH = 5 solution onto the electrode; iii) Sensor 3 (S3): a bilayer of POEA and SL (POEA/SL), with each layer being deposited for 3 min.; iv) Sensor 4 (S4): one layer was deposited from a complexed mixture of POEA and SL (in the same solution) (POEA+SL); v) Sensor 5 (S5): one layer of SL deposited for 3 min. (SL); vi) Sensor 6 (S6): one bilayer of AHS and POEA, with each layer being deposited for 3 min. (AHS/POEA); vii) Sensor 7 (S7): one layer obtained from a complexed mixture of POEA and AHS (POEA+AHS); viii) Sensor 8 (S8): one layer deposited from a PANI solution at pH = 5.0 (PANI); ix) Sensor 9 (S9): one layer deposited from a AHS solution (AHS); x) Sensor 10 (S10): one bilayer of PANI and SL, with each layer being deposited for 3 min. (PANI/SL).
Atomic force microscopy (AFM) images were obtained in a Digital Instruments microscope, model Nanoscope III A, in tapping mode using a silicon tip attached to a cantilever of spring constant 70 N/m and resonance frequency of 280 kHz. The gold interdigitated microelectrodes contained 50 pairs of 10 μm wide, 0.1μm thick fingers, with 10 μm spacing between 2 adjacent fingers. Electrical impedance measurements were performed with an impedance analyzer Solartron SI 1260 coupled to a microcomputer, in the frequency range from 1 Hz to 1 MHz and 50 mV of amplitude for the input signal. The data were interpreted with an equivalent circuit, from which the capacitance of the film was chosen as the variable to be treated with principal component analysis (PCA), using MATLAB version 5.2. PCA analysis consists in a mathematical manipulation of the data in a matrix form to reduce its original dimensionality, thus allowing correlations to be established between the variables [30, 31].

3. Results and Discussion

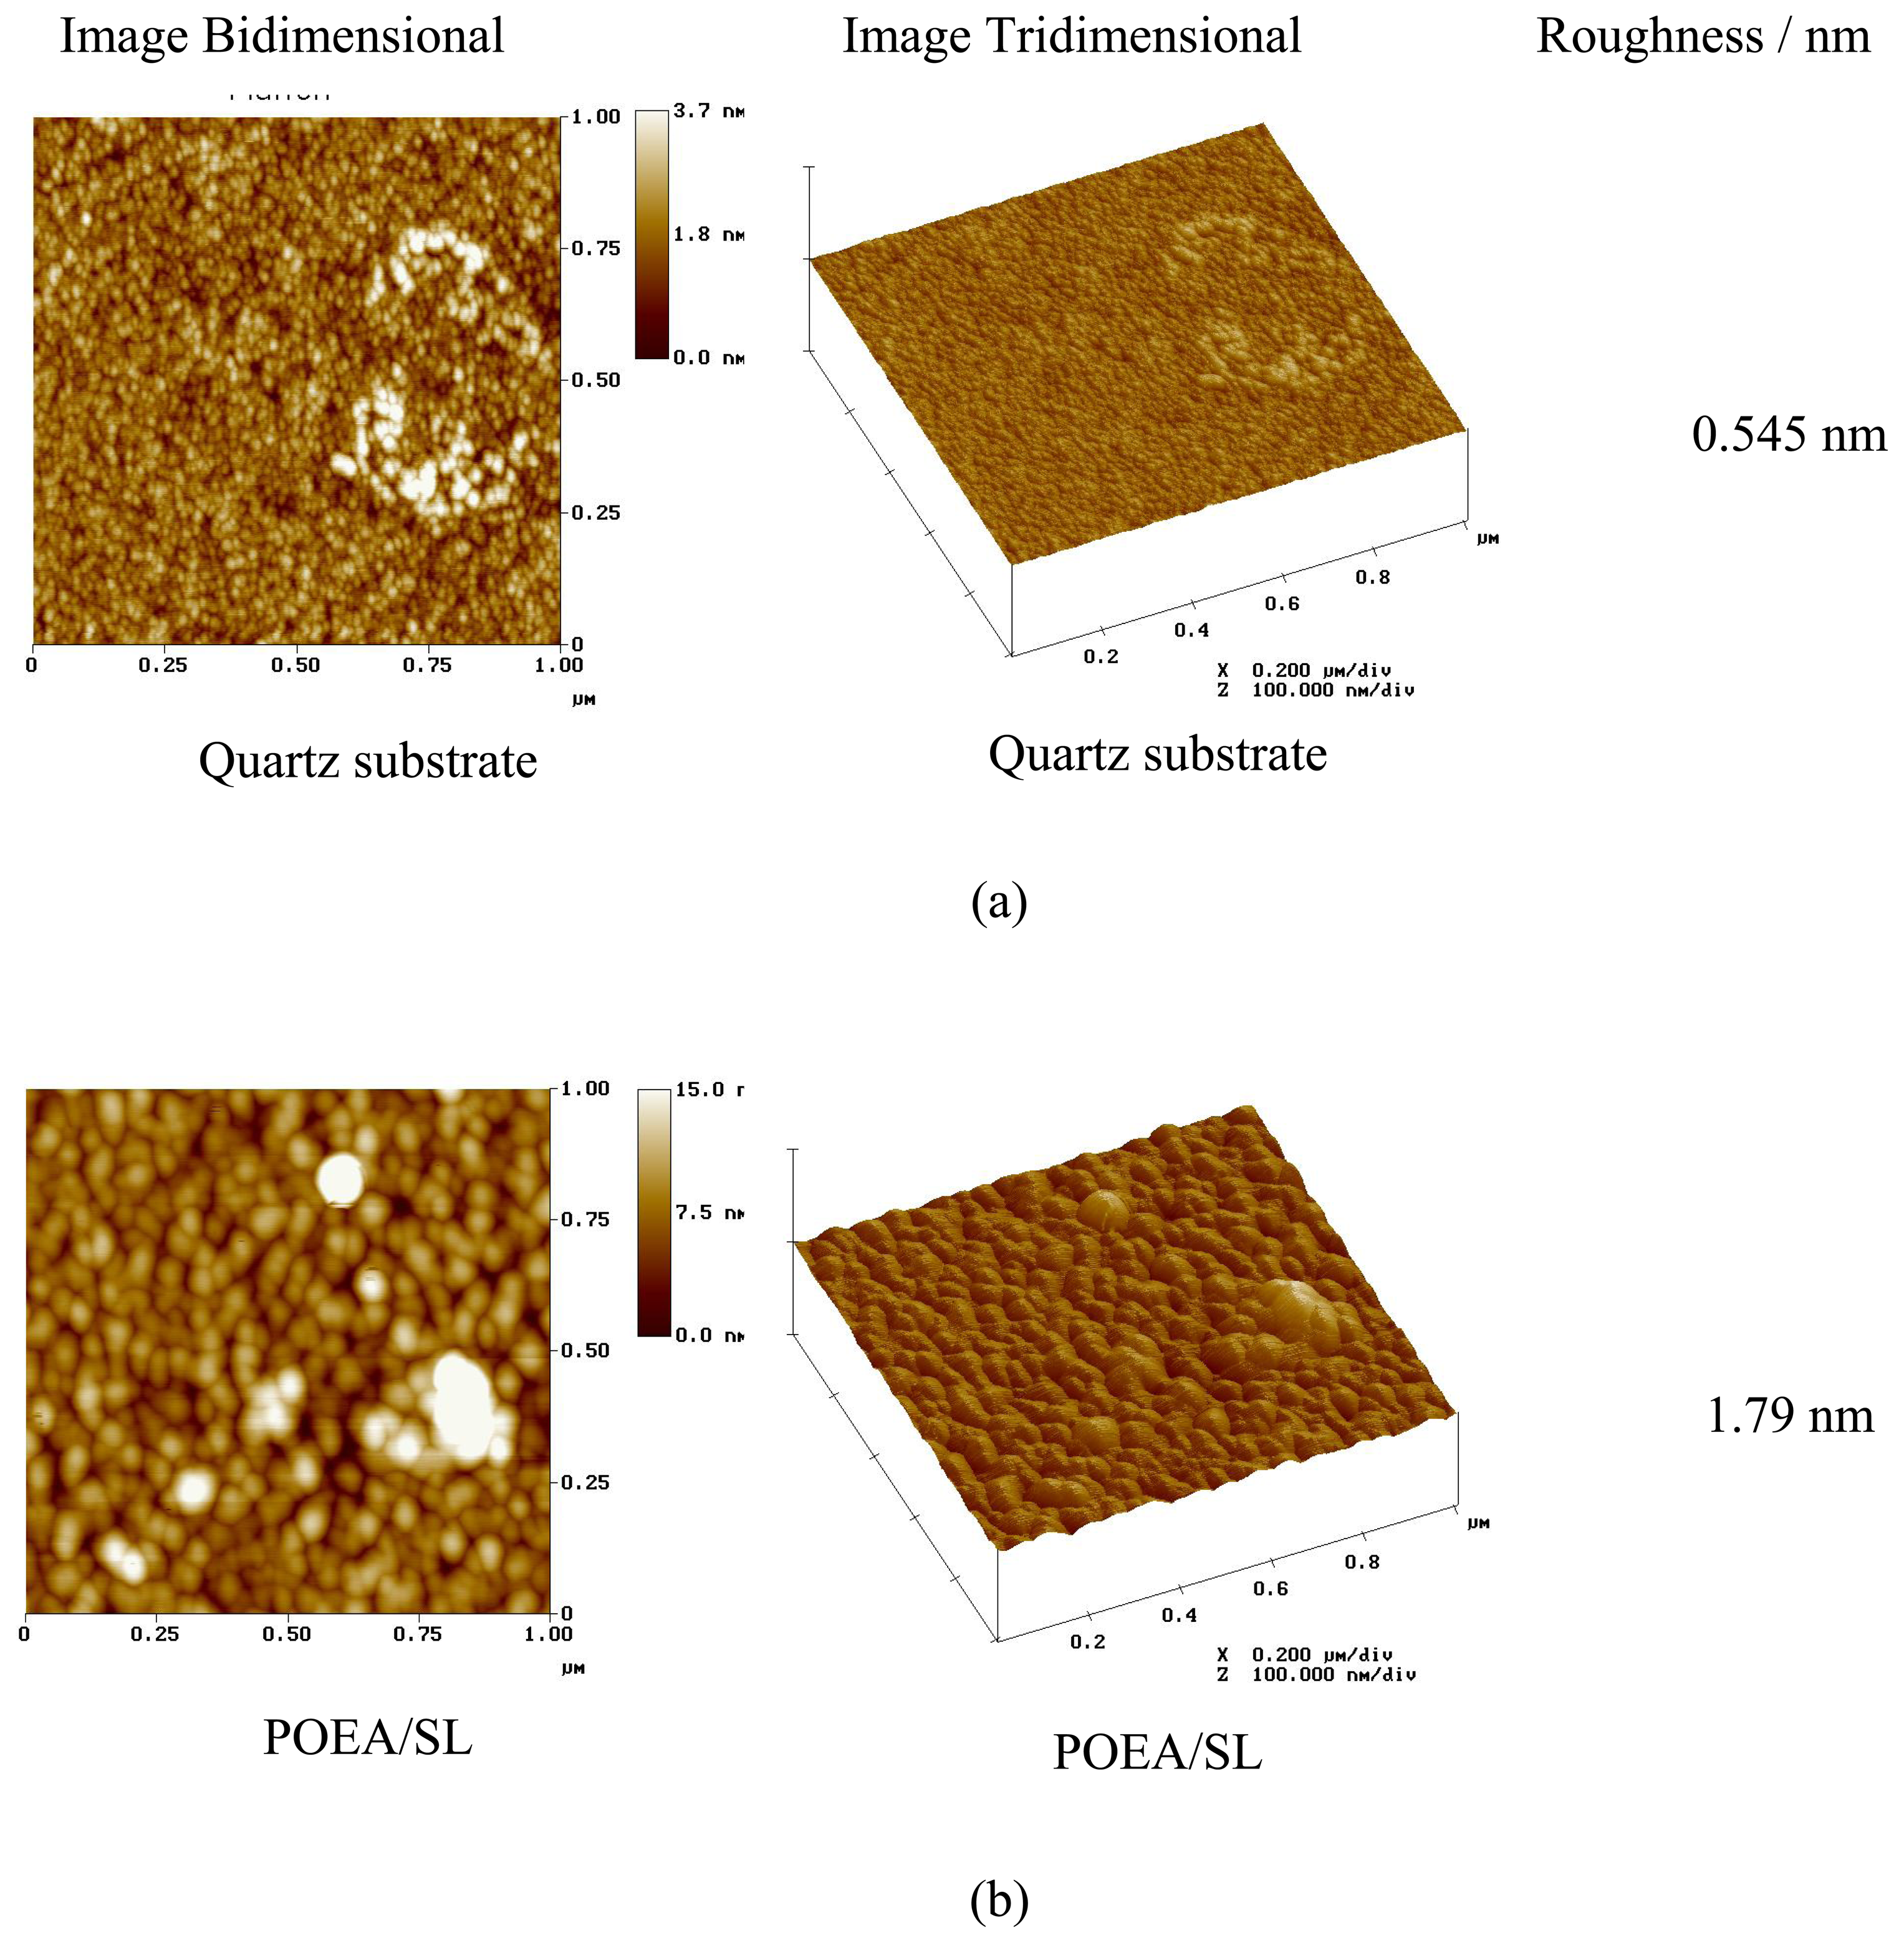
In Figure 3a is presented the AFM image of a clean quartz substrate without any film deposited. This image shows a globular morphology with very low roughness (RMS). In Figure 3b is presented the AFM image for the self-assembled POEA nanostructured thin film prepared using a bilayer of POEA and SL (POEA/SL). As we can see, the film deposited shows globules of POEA adsorbed, larger than those observed for the plain substrate. The coating is not uniform with some regions of the surface having more material than others. The formation of polyaniline films from solutions has been investigated in the literature and, in general, it has been observed that at the beginning of deposition nucleation represents an important step. After the nuclei are formed they start a radial growth through incorporation of more chains from the solution what gives the film a typical globular morphology [32]. In addition, Venancio et al., [33] constructed sensor units using interdigitated patterns of graphite deposited on plastic and paper, and coated with a thin film of conducting electronic polymer, e.g. nanofibers and conventional films of polyaniline emeraldine salt. Since the sensing process occurs at the surface of the polyaniline, nanofibers of polyaniline enhanced the sensing process due to its higher active surface area, which showed higher sensitivity than conventional films of polyaniline emeraldine salt that are not nanostructured.
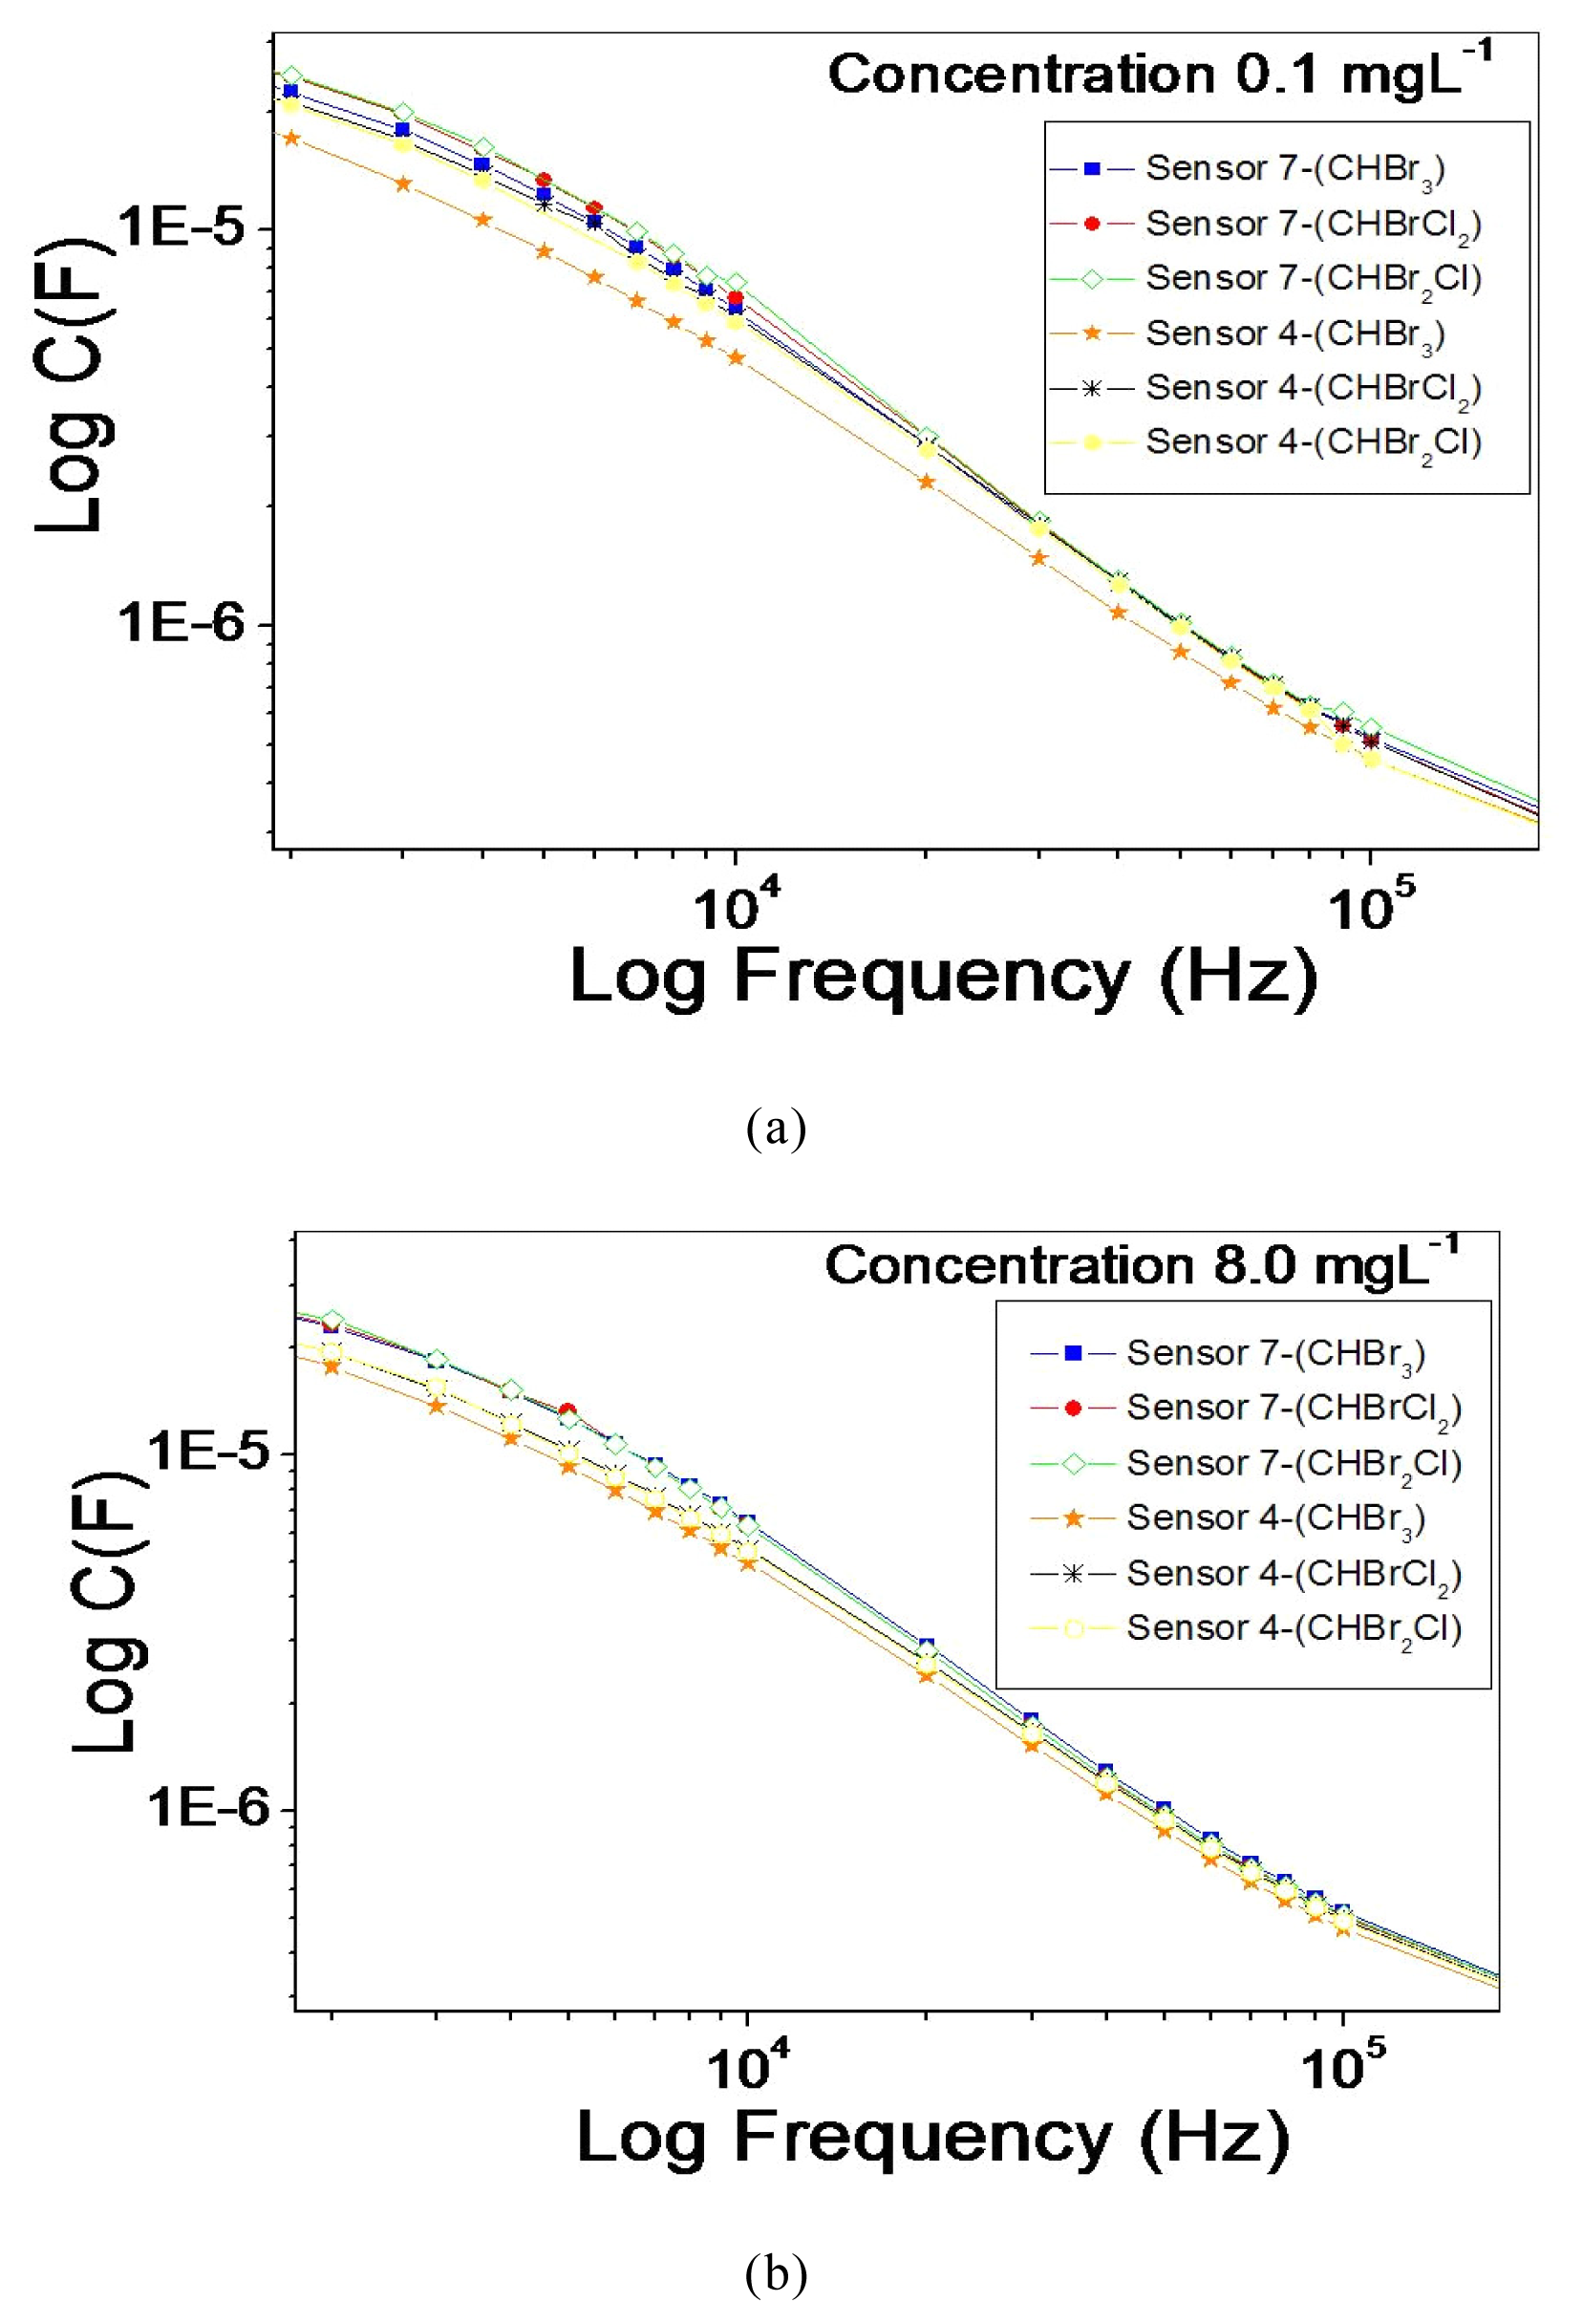
Figures 4(a) and 4(b) show the frequency dependence of film capacitance for some of the sensing units (numbered according to the specifications in Table 1) immersed into aqueous solutions with different concentrations of brominated compounds. As it is usual for films immersed into liquid samples, the capacitance decreases monotonically with the frequency [19]. Especially at lower frequencies, the electrical response of the sensing units differs from each other, which is useful for building a sensor array with high discriminating power for similar liquids. The low frequency region is dominated by the double-layer effect, while at the region between 102 and 104 Hz appears to be dominated by the effects from the nanostructured thin film used to coat the gold interdigitated electrodes. At frequencies higher than 105 Hz the impedance of the system is dominated by electrode geometric capacitance [17].
The coating of the interdigitated gold electrodes with different materials resulted in the formation of a distinct electrical signal pattern, which is characteristic of the substance being investigated. Therefore, to optimize the performance and specificity of the sensor array, it is essential to obtain the electrical impedance in various frequencies ranges and plot the data in a way that facilitates identification of main features such as the relaxation peaks in the loss tangent versus frequency [34].
In order to make the analysis more straightforward, we chose the capacitance at a fixed frequency, namely 1 kHz, at which there is good distinction among different sensing units. Significantly, the processes governing the electrical response at 1 kHz are mainly associated with film properties [35]. Figure 5 shows that the capacitance increases with the concentration of brominated compounds for all sensors. The units 4 and 7, obtained by deposition of mixtures of POEA with SL and POEA with AHS, were the most sensitive to the presence of the brominated compounds, which also occurred for sensors for chloroform [16].
The Detection Limits (DL) for brominated compounds in solution were determined according to IUPAC standards [36], using analytical curves for each compound according to the following [equation 3739]:
D L = 3 S b s
where Sb corresponds to the standard deviation of capacitance values at 1 kHz with reference with a pure water sample. In this procedure, we took 10 measurements for pure water and 10 measurements for each concentration. s is slope of the capacitance change vs. concentration curves. Table 2 displays the detection limits for the various sensing units and 3 brominated compounds, obtained from the slopes at lower concentrations. Not surprisingly, the smallest DL was observed for sensors 4 and 7, ranging from 0.02 mg L-1 to 0.09 mg L-1 for the 3 brominated compounds.
The interactions between analytes and the film-forming molecules are obviously difficult to analyze, for various types of interaction may occur, including electrostatic, H-bonding and hydrophobic interactions. Nevertheless, one may speculate about the reasons why sensors 4 and 7 exhibited the best performance in responding to the presence of brominated compounds. For sensor 7, the mixing of AHS and POEA in the same solution may have induced higher doping of POEA due to protonation [32], while AHS itself may favor interaction with brominated compounds because of the affinity between aromatic groups in AHS with the halogens of the THMs, in substitution and oxidation reactions [14]. As for sensor 4, made up of a layer of mixed POEA+SL, the high performance may be attributed to synergism between the responses of POEA and SL, which are expected to interact strongly via the amine groups in POEA and sulfonated groups in SL [32].
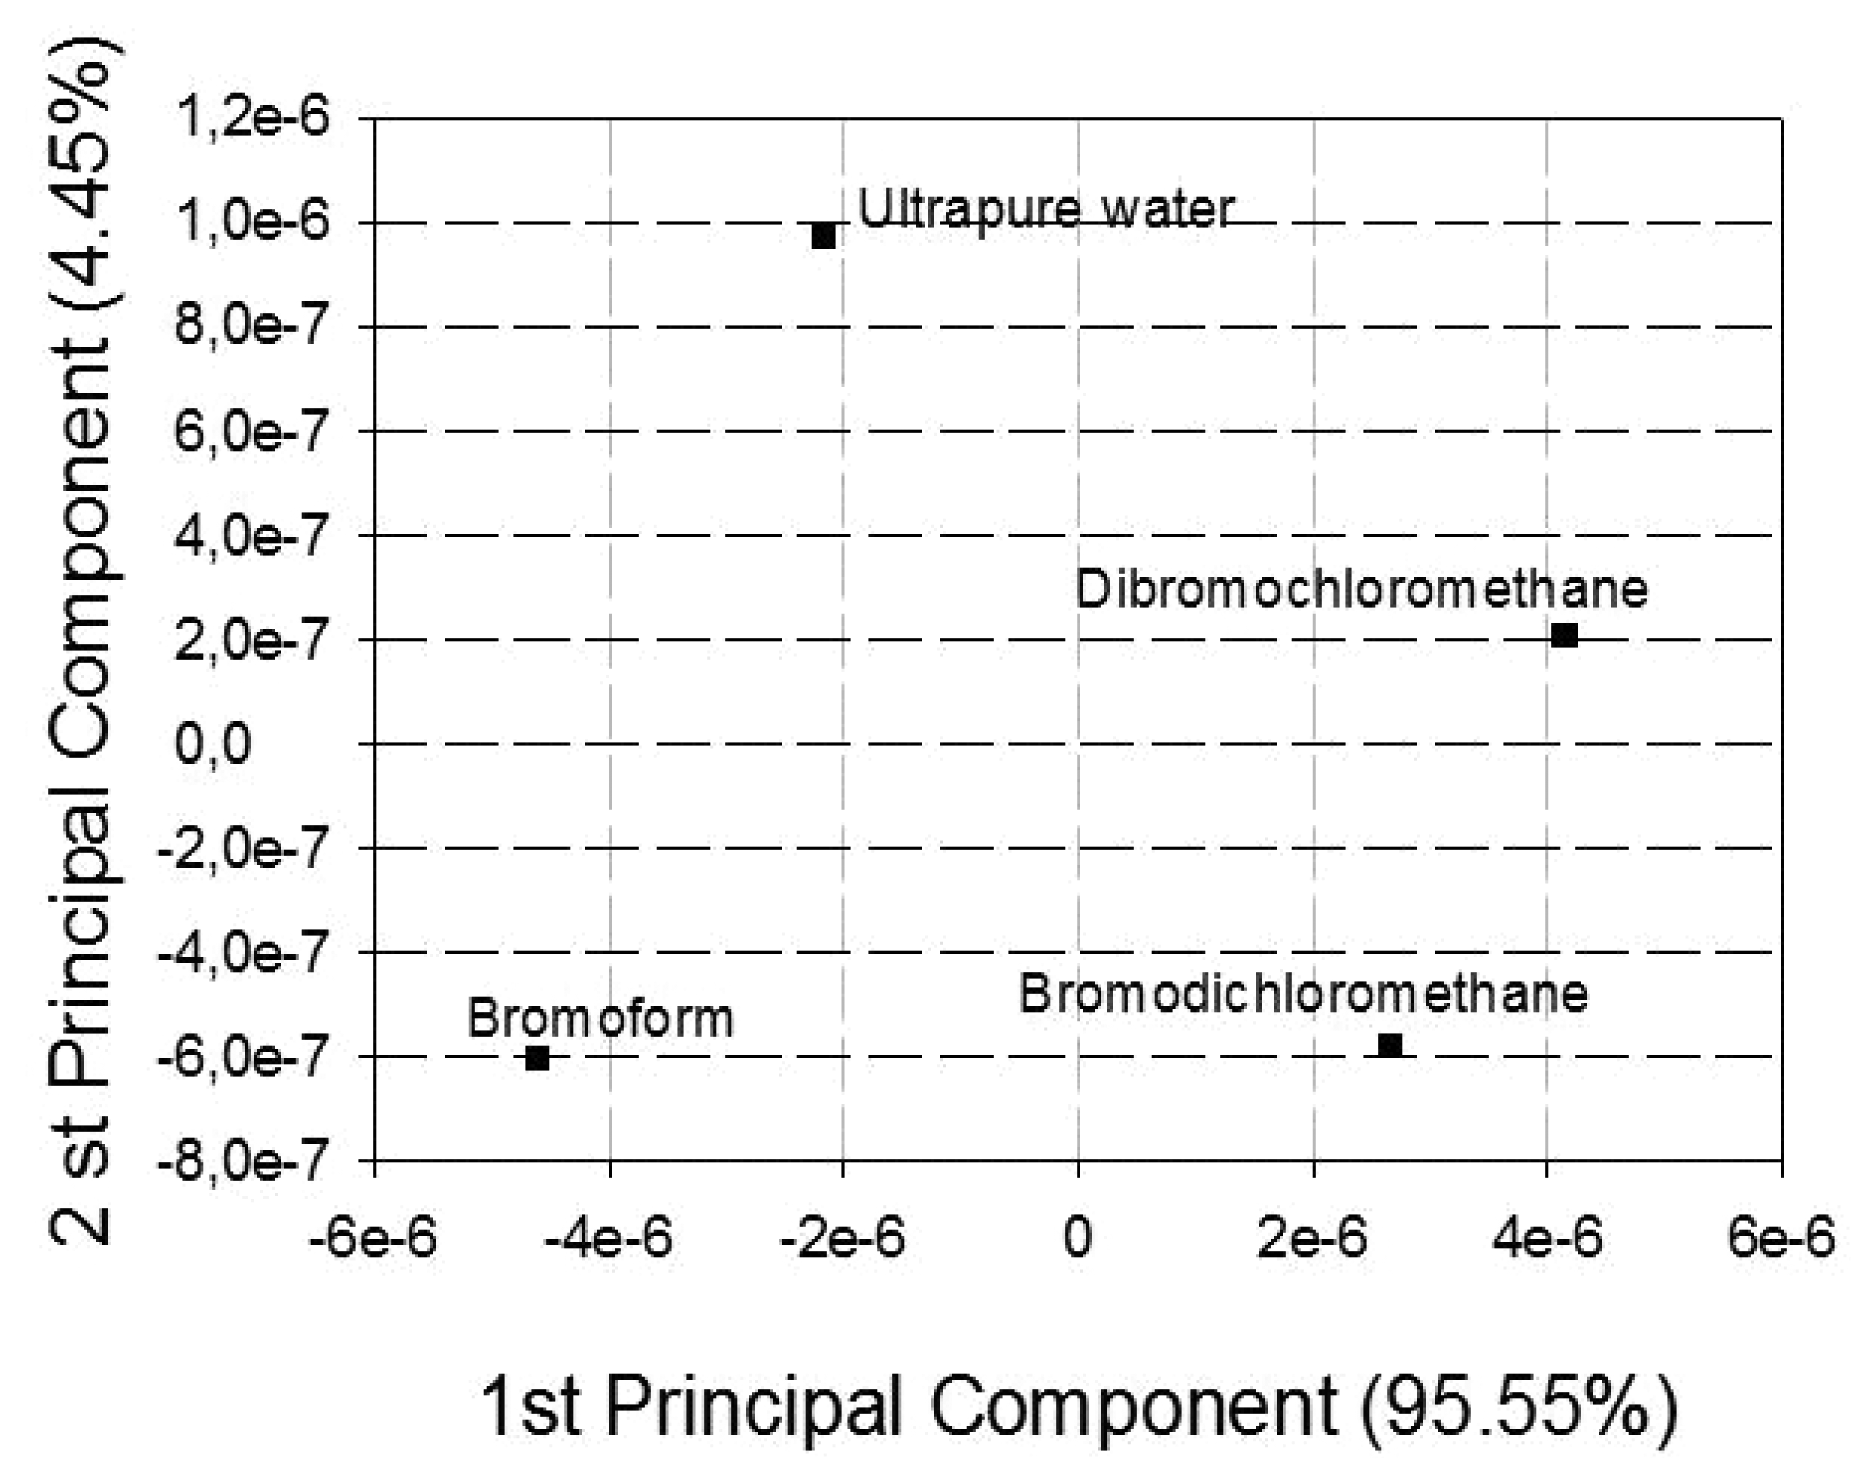
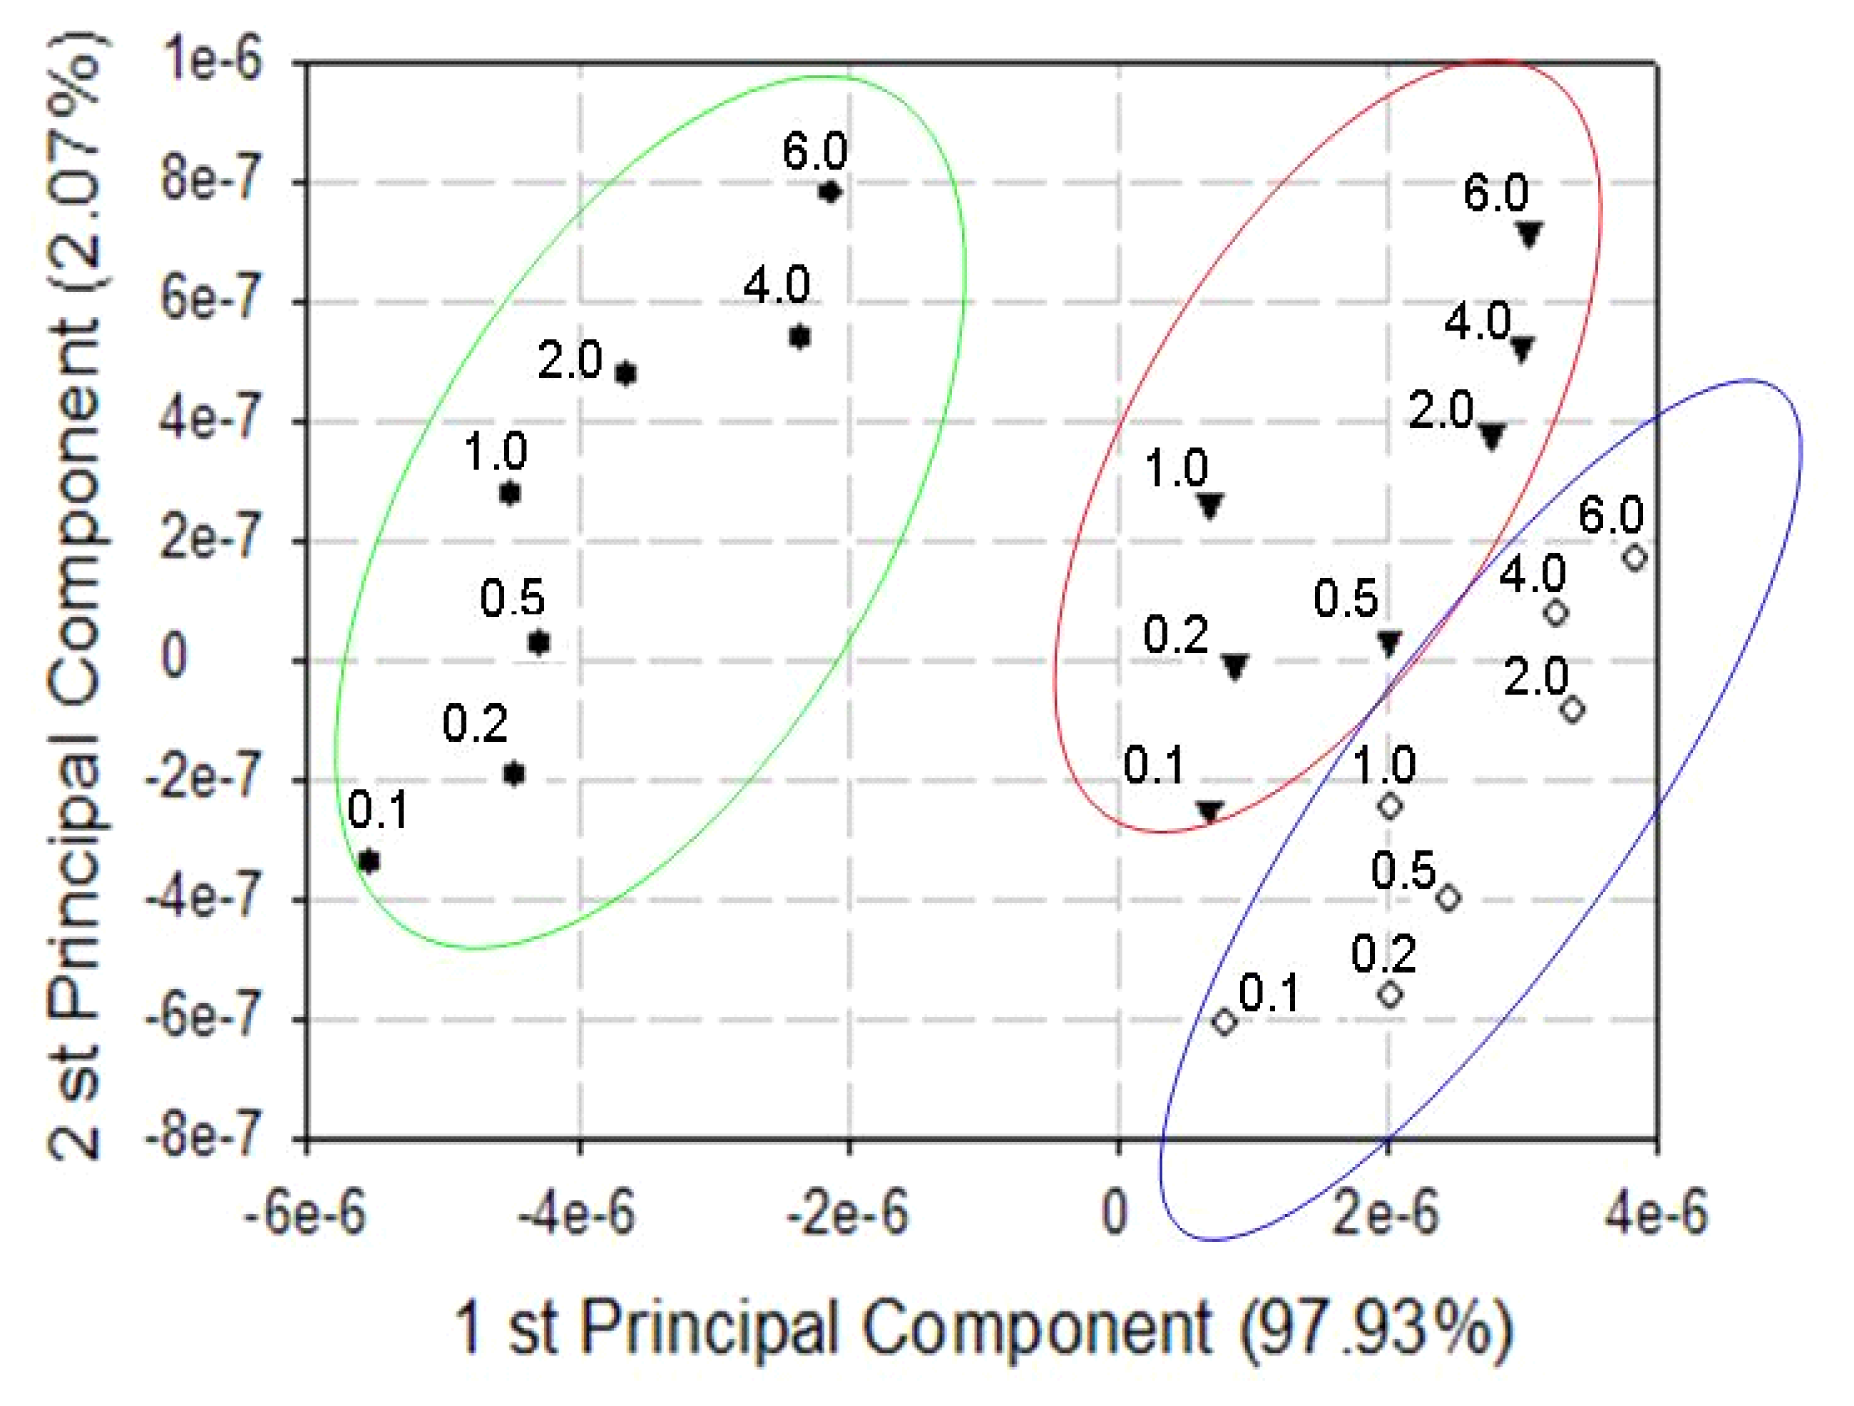
When the capacitance data for all sensors are analyzed together in a Principal Component Analysis (PCA) plot, it is clear that the sensor array is capable of distinguishing the 3 THMs from each other, and from pure water. This is demonstrated in Figure 5 for a fixed concentration of 0.05 mg L-1. Furthermore, with the sensor array one can also distinguish THM solutions with distinct concentrations, from 0.05 mg L-1 to 8.0 mg L-1, as indicated in Figures 5 and 6. Note that in both PCA plots of Figures 6 and 7, the sum of the 1st and 2nd component almost reaches 100% of the total variance, thus pointing to a statistically significant distinction among the different samples. With regard to reproducibility, each measurement for each sensor and THM concentration was done in triplicate and the data fall well in the points presented in the plots.

4. Conclusions

We have demonstrated that the use of the concept of global selectivity (e.g. “electronic tongue”), based on electrochemical impedance spectroscopy and with nanostructured films in the sensing units, can be used to detect relatively small concentrations of brominated compounds. The lowest detection limits, ranging from 0.02 to 0.09 mg L-1, were obtained with the sensing units containing one layer of mixed AHS and POEA, or one layer of mixed POEA and SL, as synergy in the interactions with the brominated compounds was achieved. When all the capacitance data were analyzed by using the PCA plots, it was clear that the sensor array could distinguish among the three brominated compounds and among samples with different concentrations of these compounds, in the range between 0.05 and 8.0 mg L-1. These concentrations are within the mean values obtained for drinking water, and therefore the sensor array might be used as a low-cost system to monitor drinking water quality. Furthermore, the sensitivity can be further enhanced if a search is carried out to optimize the materials chosen for the units.

Acknowledgments

The authors acknowledge the financial support from Fundação de Amparo à Pesquisa do Estado de São Paulo (FAPESP – Proc. 06/60767-0, Proc. 06/58872-0 e Proc. 01/13745-7), Conselho Nacional de Desenvolvimento Científico e Tecnológico (CNPq – Proc. 150042/2004-3, Proc. 150215/2007-0, Proc. 380436/2007-8, Proc. 302935/2004-3 and Proc. 550188/2002-9) and Embrapa Instrumentação Agropecuária (CNPDIA).

References

  1. Tominaga, M. Y.; Antonio, F. M. Exposição humana a trialometanos presentes em água tratada. Rev. Saúde Pública 1999, 33, 413–21. [Google Scholar]
  2. Melnick, R. L.; Dunnick, J. K.; Sandler, D. P.; Elwell, M. R.; Barrett, J. C. Trihalomethanes and other environmental-factors that contribute to colorectal-cancer. Environmental Health Perspectives 1994, 102, 586–588. [Google Scholar]
  3. Kasim, K.; Levallois, P.; Johnson, K. C.; Abdous, B.; Auger, P. Chlorination Disinfection By-products in Drinking Water and the Risk of Adult Leukemia in Canada. Am. J. Epidemiol. 2006, 163, 116–126. [Google Scholar]
  4. Pelizetti, E.; Maurino, V.; Minero, C.; Vinceti, M. Disinfection by-product in drinking water treatments. Mechanism of formation, analysis and research needs. Sci. Technol. 1994, 76, 701–707. [Google Scholar]
  5. Singer, P. C. Formation and characterization of disinfection by-products; In: Craun GF. Safety of water desinfection: balancing chemical and microbial risks; ILSI Press: Washington (DC), 1993; pp. 201–19. [Google Scholar]
  6. Gallard, H.; Von Gunten, U. Chlorination of natural organic matter: Kinetics of chlorination and THM formation. Water Res. 2002, 36, 65–74. [Google Scholar]
  7. Paraskeva, P.; Graham, N. J. D. Ozonation of municipal wastewater effluents. Water Environ. Res. 2002, 74, 569–581. [Google Scholar]
  8. (USEPA) United States Environmental Protection Agency. National primary drinking water standards. 2003. < http://www.epa.gov/safewater/standards.html> (cited April 20/2005).
  9. Budziak, D.; Carasek, E. Determination of Trihalomethanes in Drinking Water from Three Different Water Sources in Florianopolis–Brazil using Purge and Trap and Gas Chromatography. J. Braz. Chem. Soc. 2007, 18. [Google Scholar]
  10. Braga, F. M. G.; Araújo, J. C.; Sales, M. V.; Nascimento, F. R.; Padua, V.L. Diagnóstico da ocorrência de trialometanos (thms) na rede de abastecimento de água de Fortaleza – CE, Brasil. Projeto: “Potenciais fatores de risco à saúde decorrentes da presença de subprodutos de cloração na água utilizada para consumo humano”; PADETEC, da Universidade Federal do Ceará, 2002; p. 14p. [Google Scholar]
  11. Golfinopoulos, S. K.; Kostopoulou, M. N.; Lekkas, T. D. Volatile halogenated organics in the water supply system in Athens, Greece. Water Res. 1998, 32, 1811–1818. [Google Scholar]
  12. Minh, T.; Nicholas, D. O.; Birkett, J.; Kenneth, C. J.; Krewski, D.; Villeneuve, P. Chlorination Disinfection By-products and Pancreatic Cancer. Risk Environmental Health Perspectives 2005, 113, 418–424. [Google Scholar]
  13. Krewski, D.; Balbus, J.; Butler-Jones, D.; Haas, C.; Isaac-Renton, J.; Roberts, K. Managing health risks from drinking water: a report to the Walkerton Inquiry. J Toxicol. Environ. Health 2002, 65, 1635–1823. [Google Scholar]
  14. Fawell, J. Risk assessment case study-Chloroform and related substances. Food and Chemical Toxicology 2000, 38, 91–95. [Google Scholar]
  15. U.S. EPA (2005). U.S. EPA Drinking water criteria document for brominated trihalomethanes; Office of Science and Technology Office of Water U.S. Environmental, Protection, Agency: Washington, D.C., November 15 2005. [Google Scholar]
  16. Carvalho, E. R.; Consolin-Filho, N.; Firmino, A.; Oliveira, O. N., Jr.; Mattoso, L. H. C.; Martin-Neto, L. Sensorial System to Detect Chloroform in Water. Sensor Letters 2006, 4, 129–134. [Google Scholar]
  17. Riul, A., Jr.; Gallardo, S. A. M.; Mello, S. V.; Bone, S.; Taylor, D. M.; Mattoso, L. H. C. An electronic tongue using polypyrrole and polyaniline. Synthetic Metals 2003, 132, 109–116. [Google Scholar]
  18. Macdiarmid, A. G. Polyaniline and polypyrrole: where are we headed? Synthetic Metals 1997, 84, 27–34. [Google Scholar]
  19. Wessling, B. Dispersion as the key to processing conductive polymers. Handbook of conducting polymers; Marcel Dekker: New York, 1998. [Google Scholar]
  20. Janata, J. Principles of Chemical Sensors; Plenum Press: New York, 1989. [Google Scholar]
  21. Zhang, Q.; Jin, H.; Wang, X.; Jing, X. Morphology of conductive blend fibers of polyaniline and polyamide-11. Synthetic Metals 2001, 123, 481–485. [Google Scholar]
  22. Mattoso, L. H. C.; Manohar, S. K.; Macdiarmid, A. G.; Epstein, A. J. Studies on the chemical syntheses and on the characteristics of polyaniline derivatives. J. Polym. Sci., Part A, Polym. Chem. 1995, 33, 1227–1234. [Google Scholar]
  23. Carvalho, E. R.; Martin-Neto, L.; Milori, D. M. B. P.; Rocha, J. C.; Rosa, A. H. Interactions of chlorine with tropical aquatic fulvic acids and formation of intermediates observed by fluorescence spectroscopy. J. Braz. Chem. Soc. 2004, 15, 421–426. [Google Scholar]
  24. Aiken, G. R. Humic Substances in Soil, Sediment and Water; John Wiley & Sons: New York, 1985. [Google Scholar]
  25. Malcolm, R. L. Humic Substances in the Aquatic and Terrestrial Environment; Springer-Verlag: Berlin, 1989. [Google Scholar]
  26. Paterno, L. G.; Mattoso, L. H. C.; Oliveira, O. N., Jr. Filmes poliméricos ultrafinos produzidos pela técnica de automontagem: preparação, propriedades e aplicações. Quim. Nova 2001, 24, 228–235. [Google Scholar]
  27. Kern, W. Purifying Si and SiO/sub 2/ surfaces with hydrogen peroxide. Semicond. Int. 1984, 7, 94–99. [Google Scholar]
  28. Paterno, L. G.; Mattoso, L. H. C. Effect of pH on the preparation of self-assembled films of poly(o-ethoxyaniline) and sulfonated lignin. Polymer 2001, 42, 5239–5245. [Google Scholar]
  29. Crespilho, F. N.; Zucolotto, V.; Siqueira, J. R.; Constantino, C. J. L.; Nart, F. C.; Oliveira JR, O. N. Immobilization of humic acid in nanostructured layer-by-layer films for sensing applications. Env. Sci. and Technol. 2005, 39, 5385–5389. [Google Scholar]
  30. Wold, S.; Esbensen, K.; Geladi, P. Principal component analysis. Chemom. Intell. Lab. Sys. 1987, 2, 37–52. [Google Scholar]
  31. Paterno, L. G.; Constantino, C. J. L.; Oliveira JR, O. N.; Mattoso, L. H. C. Self-assembled films of poly(o-ethoxyaniline) complexed with sulfonated lignin. Colloids and Surfaces B-Biointerfaces 2002, 23, 257–262. [Google Scholar]
  32. Venancio, E. C.; Consolin-Filho, N.; Constantino, C. J. L.; Martin-Neto, L.; Mattoso, L. H. C. Studies on the interaction between humic substances and conducting polymers for sensor application. J. Braz. Chem. Soc. 2005, 16, 24–30. [Google Scholar]
  33. Venancio, E. C.; Mattoso, L. H. C.; Herrmann, P. S. P. J.; MacDiarmid, A. G. Line Patterning of Graphite and the Fabrication of Cheap, Inexpensive, “Throw-away” Sensors. Sensors and Actuators B 2007, 1–26, Accepted Manuscript. [Google Scholar]
  34. Carvalho, E. R.; Correa, A. A.; Consolin Filho, N.; Oliveira, O. N., Jr.; Gomes, H. L.; Mattoso, L. H. C.; Martin-Neto, L. Detection of Chloroform with a Sensor Array Consisting of Electrochemically Deposited Polythiophenes Films: Processes Governing the Electrical Response. Sensor Letters 2007, 5, 1–6. [Google Scholar]
  35. Taylor, D. M.; MacDonald, A. G. AC admittance of the metal/ insulator/ electrolyte interface. J. Phys. D: Appl. Phys. 1987, 20, 1277–1283. [Google Scholar]
  36. Currie, L. A. Nomenclature in evaluation of analytical methods including detection and quantification capabilities: IUPAC Recommendations 1995. Pure Appl. Chem. 1995, 67, 1669–1723. [Google Scholar]
  37. International Conference on Harmonisation (ICH). Validation of Analytical Procedures: Definitions and Terminology; Q2A (CPMP/ICH/381/95); 1995. [Google Scholar]
  38. International Conference on Harmonisation (ICH). Validation of Analytical Procedures: Methodology; Q2B (CPMP/ICH/281/95); 1995. [Google Scholar]
  39. Instituto Nacional de Metrologia, Normalização e Qualidade Industrial (INMETRO). Orientações sobre Validação de Métodos de Ensaios Químicos; DOQ-CGCRE-008; 2003. [Google Scholar]
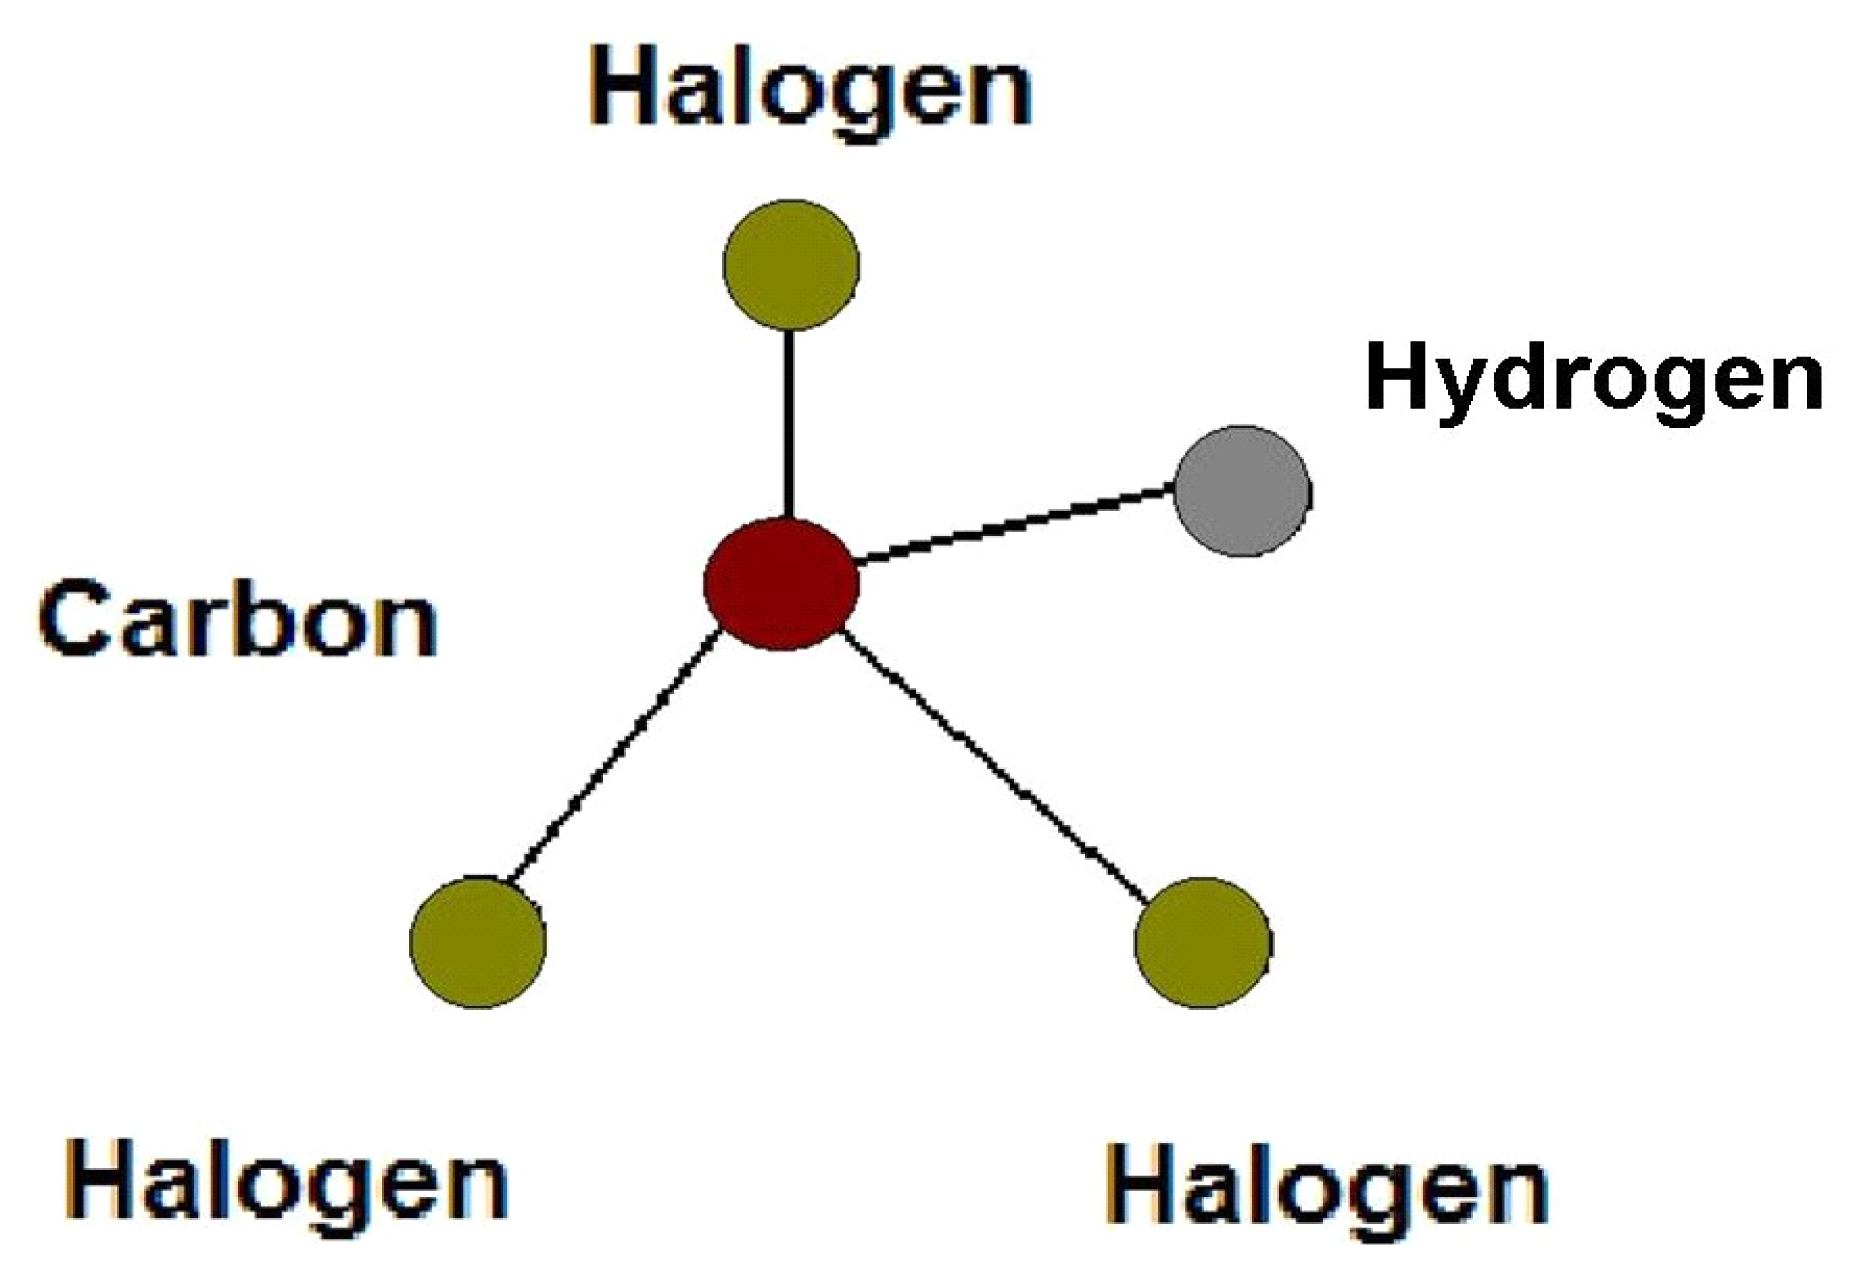
Figure 1. Basic structure of trihalomethanes.
Sensors 07 03258f1
Figure 2. Diagram illustrating the sensing system.
Sensors 07 03258f2
Figure 3. AFM images of POEA films obtained at pH 5: (a) quartz substrate; (b) bilayer of POEA and SL films (POEA/SL).
Sensors 07 03258f3
Figure 4. Log of Capacitance (C / Faraday) as a function of the log of Frequency (Hz) for the sensors 7 and 4 in the presence of different concentrations of THMs: (a) 0.1 mg L-1 and (b) 8.0 mg L-1.
Sensors 07 03258f4
Figure 5. Capacitance (C / Faraday) measurements at 1 kHz, obtained for THM solutions with different concentrations: (a) bromoform; (b) bromodichloromethane and (c) dibromochloromethane.
Sensors 07 03258f5
Figure 6. PCA for the 3 THMs at a concentration of 0.05 mg L-1 and pure water, using capacitance data at 1 kHz for the 10 sensing units.
Sensors 07 03258f6
Figure 7. PCA obtained from the capacitance data at 1 kHz for the 10 sensing units and various concentrations of the brominated compounds (✹Bromoform; ◊Bromodichloromethane; ▼ Dibromochloromethane;. Note that upward arrows can be established indicating increasing concentration (in mg L-1) for the 3 compounds.
Sensors 07 03258f7
Table 1. Sensing units in the sensor array to analyze brominated trihalomethanes.
Type of MaterialSensing Unit
without filmS1
POEAS2
POEA/SLS3
POEA + SLS4
SLS5
AHS/POEAS6
POEA + AHSS7
PANIS8
AHSS9
PANI/SLS10
Table 2. Detection limits for each sensing unit for the 3 brominated compounds.
SensorsDL (mg L-1)
CHBr3CHBrCl2CHBr2Cl
S10.074 ± 0.0030.175 ± 0.0040.115 ± 0.005
S20.082 ± 0.0010.137 ± 0.0050.145 ± 0.010
S30.165 ± 0.0410.608 ± 0.0500.257 ± 0.030
S40.033 ± 0.0040.064 ± 0.0000.070 ± 0.000
S50.071 ± 0.0030.223 ± 0.0040.253 ± 0.004
S60.084 ± 0.0200.707 ± 0.0200.203 ± 0.010
S70.020 ± 0.0050.042 ± 0.0020.091 ± 0.000
S80.043 ± 0.0050.328 ± 0.1000.205 ± 0.002
S90.104 ± 0.0030.168 ± 0.0010.309 ± 0.004
S100.050 ± 0.0050.204 ± 0.0300.137 ± 0.080