A Novel Pulse Measurement System by Using Laser Triangulation and a CMOS Image Sensor

1
Department of Biomedical Engineering, Ming Chuan University, No. 5, Deming Rd., Gweishan Township, Taoyuan 333, Taiwan
2
Department of Optics and Photonics, National Central University, No. 300, Jung-Da Rd., Chung-Li City, Taoyuan 320, Taiwan
3
Department of Bio-Industrial Mechatronics Engineering, National Taiwan University, No. 1, Sec. 4, Roosevelt Rd., Taipei 106, Taiwan
*
Author to whom correspondence should be addressed.
Sensors 2007, 7(12), 3366-3385; https://doi.org/10.3390/s7123366
Submission received: 2 November 2007
/
Accepted: 18 December 2007
/
Published: 19 December 2007
(This article belongs to the Special Issue Integrated High-performance Imagers)
Abstract
:This paper presents a novel, non-invasive, non-contact system to measure pulse waveforms of artery via applying laser triangulation method to detect skin surface vibration. The proposed arterial pulsation measurement (APM) system chiefly consists of a laser diode and a low cost complementary metal-oxide semiconductor (CMOS) image sensor. Laser triangulation and centroid method are combined with the Fast Fourier Transform (FFT) in this study. The shape and frequency of the arterial pulsation can be detected rapidly by using our APM system. The relative variation of the pulse at different measurement points near wrist joint is used as a prognostic guide in traditional Chinese medicine (TCM). An extensive series of experiments was conducted to evaluate the performance of the designed APM system. From experimental results, the pulse amplitude and frequency at the Chun point (related to the small intestine) of left hand showed an obvious increase after having food. In these cases, the peak to peak amplitudes and the frequencies of arterial pulsations range from 38 to 48 μm and from 1.27 to 1.35 Hz, respectively. The height of arterial pulsations on the area near wrist joint can be estimated with a resolution of better than 4 μm. This research demonstrates that applying a CMOS image sensor in designing a non-contact, portable, easy-to-use, low cost pulse measurement system is feasible. Also, the designed APM system is well suited for evaluating and pre-diagnosing the health of a human being in TCM clinical practice.
1. Introduction
The waveform of arterial pulsation is considered a fundamental indicator for the diagnosis of cardiovascular disease, which can guide therapeutic decisions in complex clinical situations [1]. Abnormalities of the waveform shape and frequency of the arterial palpitation are indicators of certain cardiovascular disorders. Thus, how to distinguish arterial pulse waveforms without distortion has become an important issue in biomedical signal processing. In addition, pulse diagnosis is one of four kinds of diagnostic methods used in TCM clinical practice to determine the physiological condition of the patients [2]. The most commonly used clinical methods to measure the behavior of the pulse include the stethoscope, sphygmomanometer, and Doppler-based instrumentation. Recently, some practitioners in TCM use a pulse diagnosis machine or other device to record changes in the pulse [3]. A set of three pressure transducers for sensing the pulses at three locations has already been developed [4]. Lu et al. analyzed the harmonics of the frequency spectrum of arterial pulse waves and correlated some illness conditions to certain harmonics [5]. Hong et al. described a non-touch pulse measurement method based on optical interferometer [6], which could estimate skin vibration velocity. However, the devices used in the above-mentioned studies could either interfere with the measurement results because of making contact with the body, or were more costly because of having additional sensors for probing multiple points. An optical non-contacting technology, which is based on optical triangulation, is proposed in this study. Laser triangulation is a well-known method in thickness and contour measurement, and has been applied to many industrial fields [7-9]. It was also used to examine the vertical movements of the vocal folds during phonation [10].
Laser triangulation is normally used in conjunction with light centroid measuring devices, e.g. position sensing detectors (PSDs) and charge coupled devices (CCDs). Since the manufacturing technology behind the CMOS image sensors has now been advanced sufficiently to achieve good stability and low cost, the CMOS image sensors have become increasingly significant in industrial optical sensors [11-12]. The CMOS image sensors possess several programmable features including electronic exposure (ET) control, continuous or single frame capture, and progressive or interlaced scanning modes. The first of these features is very important to our experiments, especially for reducing noise and locating measurement point of laser spot.
In general, the relationship between pulse waves and physiological or healthy conditions of the tested subjects is quite complex. Such relationship might exhibit nonlinear characteristic and might also vary person to person due to characteristics of the artery, deep or shallow, healthy or hardened, etc. Basically, the more pulse waveforms are obtained, the more information including pulse rates and harmonics related to the diagnosis in TCM can be achieved. In TCM clinical practice, an experienced TCM physician can do the pulse diagnosis by palpation treatment conducted on multiple measurement points (i.e., Chun, Guan, and Chy points) to determine the relationships between the organs health and the wave patterns of pulses. These facts have been demonstrated in many literatures [13-14]. Of course, a more complex and accurate arterial pulse measurement system is necessary if more factors are taking into consideration in TCM clinical practice.
This paper describes the design of the arterial pulsation measurement (APM) system, and presents the results of tests conducted to verify the pulse measurement accuracy. The pulsation rate was derived from the frequency spectrum of the laser spot vibration, and showed great consistence with data taken from loudspeaker movement driven by a function generator at a specific frequency. Frequency validation was also conducted by comparing the experimental results with data obtained from a standard blood pressure monitor. The amplitude and frequency variation at each point measured on the tested subject's wrist is an important symptom for some illness during the patient's medical examinations in TCM clinical practice. The evaluation of pulse variation gives us some valuable information concerning about the tested subjects' health.
2. Principles of Measurement
The proposed APM system combines the Fast Fourier Transform (FFT), the centroid method, and the optical triangulation method. The frequency spectrum of the arterial pulse waveforms measured at the specified point is obtained by FFT method. The calculations were conducted by MATLAB 7.0 and Origin 6.0. It is possible by using the FFT theory [15] to build a variety of non-sinusoidal waveforms consisting of many sinusoidal waveforms. In other words, a non-sinusoidal waveform can be decomposed into many sinusoidal waveforms with different frequencies, amplitudes, and phases. Due to the speed limitation of the CMOS image sensor, we discuss only the fundamental sinusoidal waveform in this paper.
The laser triangulation method is simple in structure. It makes possible to measure the subject's arterial pulse waveforms in a non-contact way. The experimental data show that changes in the arterial pulse waveforms can be detected by analyzing the centroid movements of a laser spot. The changes of the centroid of the laser spot, which is measured at certain points on the wrist, can be transformed into the changes in magnitude of relative height caused by skin vibration.
The basic operation principle of the proposed APM system is described as follow. A laser diode, a laser driver, and a CMOS image sensor are used to establish an optical non-contact pulse measurement device. The laser diode emits laser light onto the measurement site of skin surface where its arterial pulsation needs to be determined. The laser spot is formed on the skin surface of the wrist of tested subject and the variation of the spot image is captured by the CMOS image sensor and then projected onto the scattered points that represent arterial pulsations. These scattered light points are processed by FFT method to determine the amplitude and frequency of arterial pulses of tested subjects. In this work, the proposed APM system adopts a simple structure based on optical triangulation. The geometrical layout of the designed APM system is depicted in Fig. 1. In Fig. 1, X represents the distance between the target and the collimated lens of laser diode and δX is the small fluctuation (i.e., the distance between measured points A and B) of skin surface due to arterial pulsation. The target distance X is measured continuously. Using a simple triangulation principle, the measured X target coordinates are mapped onto the detection position d on the CMOS sensor, as shown in Fig. 1. The target distance X is given by
where L is the distance between the laser and the CMOS image sensor, d is the distance between the two spots mapped onto the CMOS image sensor, f is the focal length of the lens, Z is the distance between the measured point A and the center C of the lens of the CMOS image sensor, α is the angle between the axis and the measured point A, δX' is the distance between the measured point A and the optical axis of the lens, and θ0 is the angle between the two axes of the CMOS image sensor and the laser. In our APM system, these parameters are X = 94 mm, L = 110 mm, Z = 144.7 mm, and f = 16 mm (the focal length of the lens of the CMOS image sensor). The diameter of the lens in front of the CMOS image sensor is 6 mm.
Differentiating Eq. (1) with respect to the measured distance and rearranging the result yields
where δX is also regarded as the resolution of the designed APM system.
For the experiments conducted in this study, the smallest resolvable amplitude change to a sub-pixel size of d = 0.8 μm on the CMOS image sensor can be achieved. After calibration, this value corresponds to a measurement resolution of 9.5 μm achieved by the designed APM system, i.e., δX = 9.5 μm in Eq. (2). Such a measurement resolution is sufficient to detect the vibration of human pulsation.
The actual implementation of the APM system is shown in Fig. 2. The sampling area in Fig.2 was located by a TCM physician. Using simple triangulation method, the displacement δX of the variation of the laser spot mapped onto the CMOS image sensor can be determined. The amplitude and frequency of the arterial pulse can be obtained by analyzing the spot position.
The centroid method has been widely used to locate a light spot with respect to various types of image features, to sub-pixel accuracy [16-17]. The resolution of the APM system can be increased by introducing sub-pixel processing technique [16-17]. The threshold level of image pixel is deliberately set so that in the captured laser spot image a pixel with intensity below the threshold level will be neglected. In our experiments, the threshold of the gray level of image pixel is set to 20% below the highest full range level. Also, note that the vibration frequency of arterial pulsation can be obtained by processing the recorded image by means of FFT method.
A CMOS image sensor with a 5.3 × 3.8 mm2 active area (HV7131D, manufactured by Hynix Semiconductor Incorporated.) was used to detect the laser light spot with high accuracy and stability. The sensor has a 648 × 488 pixels array and each compact active pixel element has high photo-sensitivity (3150 mV/lux-sec). It can convert the photon energy to analog voltage signal with a resolution of 8 μm. The CMOS sensor utilizes three On-chip 8-bit Digital to Analog Converts (DAC) and 648 comparators to digitize the pixel output.
The output power of the adopted laser diode (Model no.: QL63d5sA, MORETEC, Inc.) is 1.3 mW, its wavelength is 650 nm, and its spectral width is about 20 nm. The diameter of the laser spot on the skin surface is approximately 1 mm, giving a spot on the CMOS sensor of tens of pixels in both directions.
At normal incidence of laser light, about a 4 ∼ 7% power reflection occurs due to the differences in the refractive indices of the skin layers [18]. Also, some photons are scattered by superficial skin. The light scattered from the skin surface is the most important signal for this pulse measurement. However, photons penetrating into skin layers are also scattered, providing diffuse reflections which are of lower power than the first kind of light scattered by the superficial skin. The exposure time (ET, equivalent to gain level) of the CMOS sensor can be adjusted to different levels for different situations. This means that the signal-to-noise ratio (SNR) can be improved by setting the gain level.
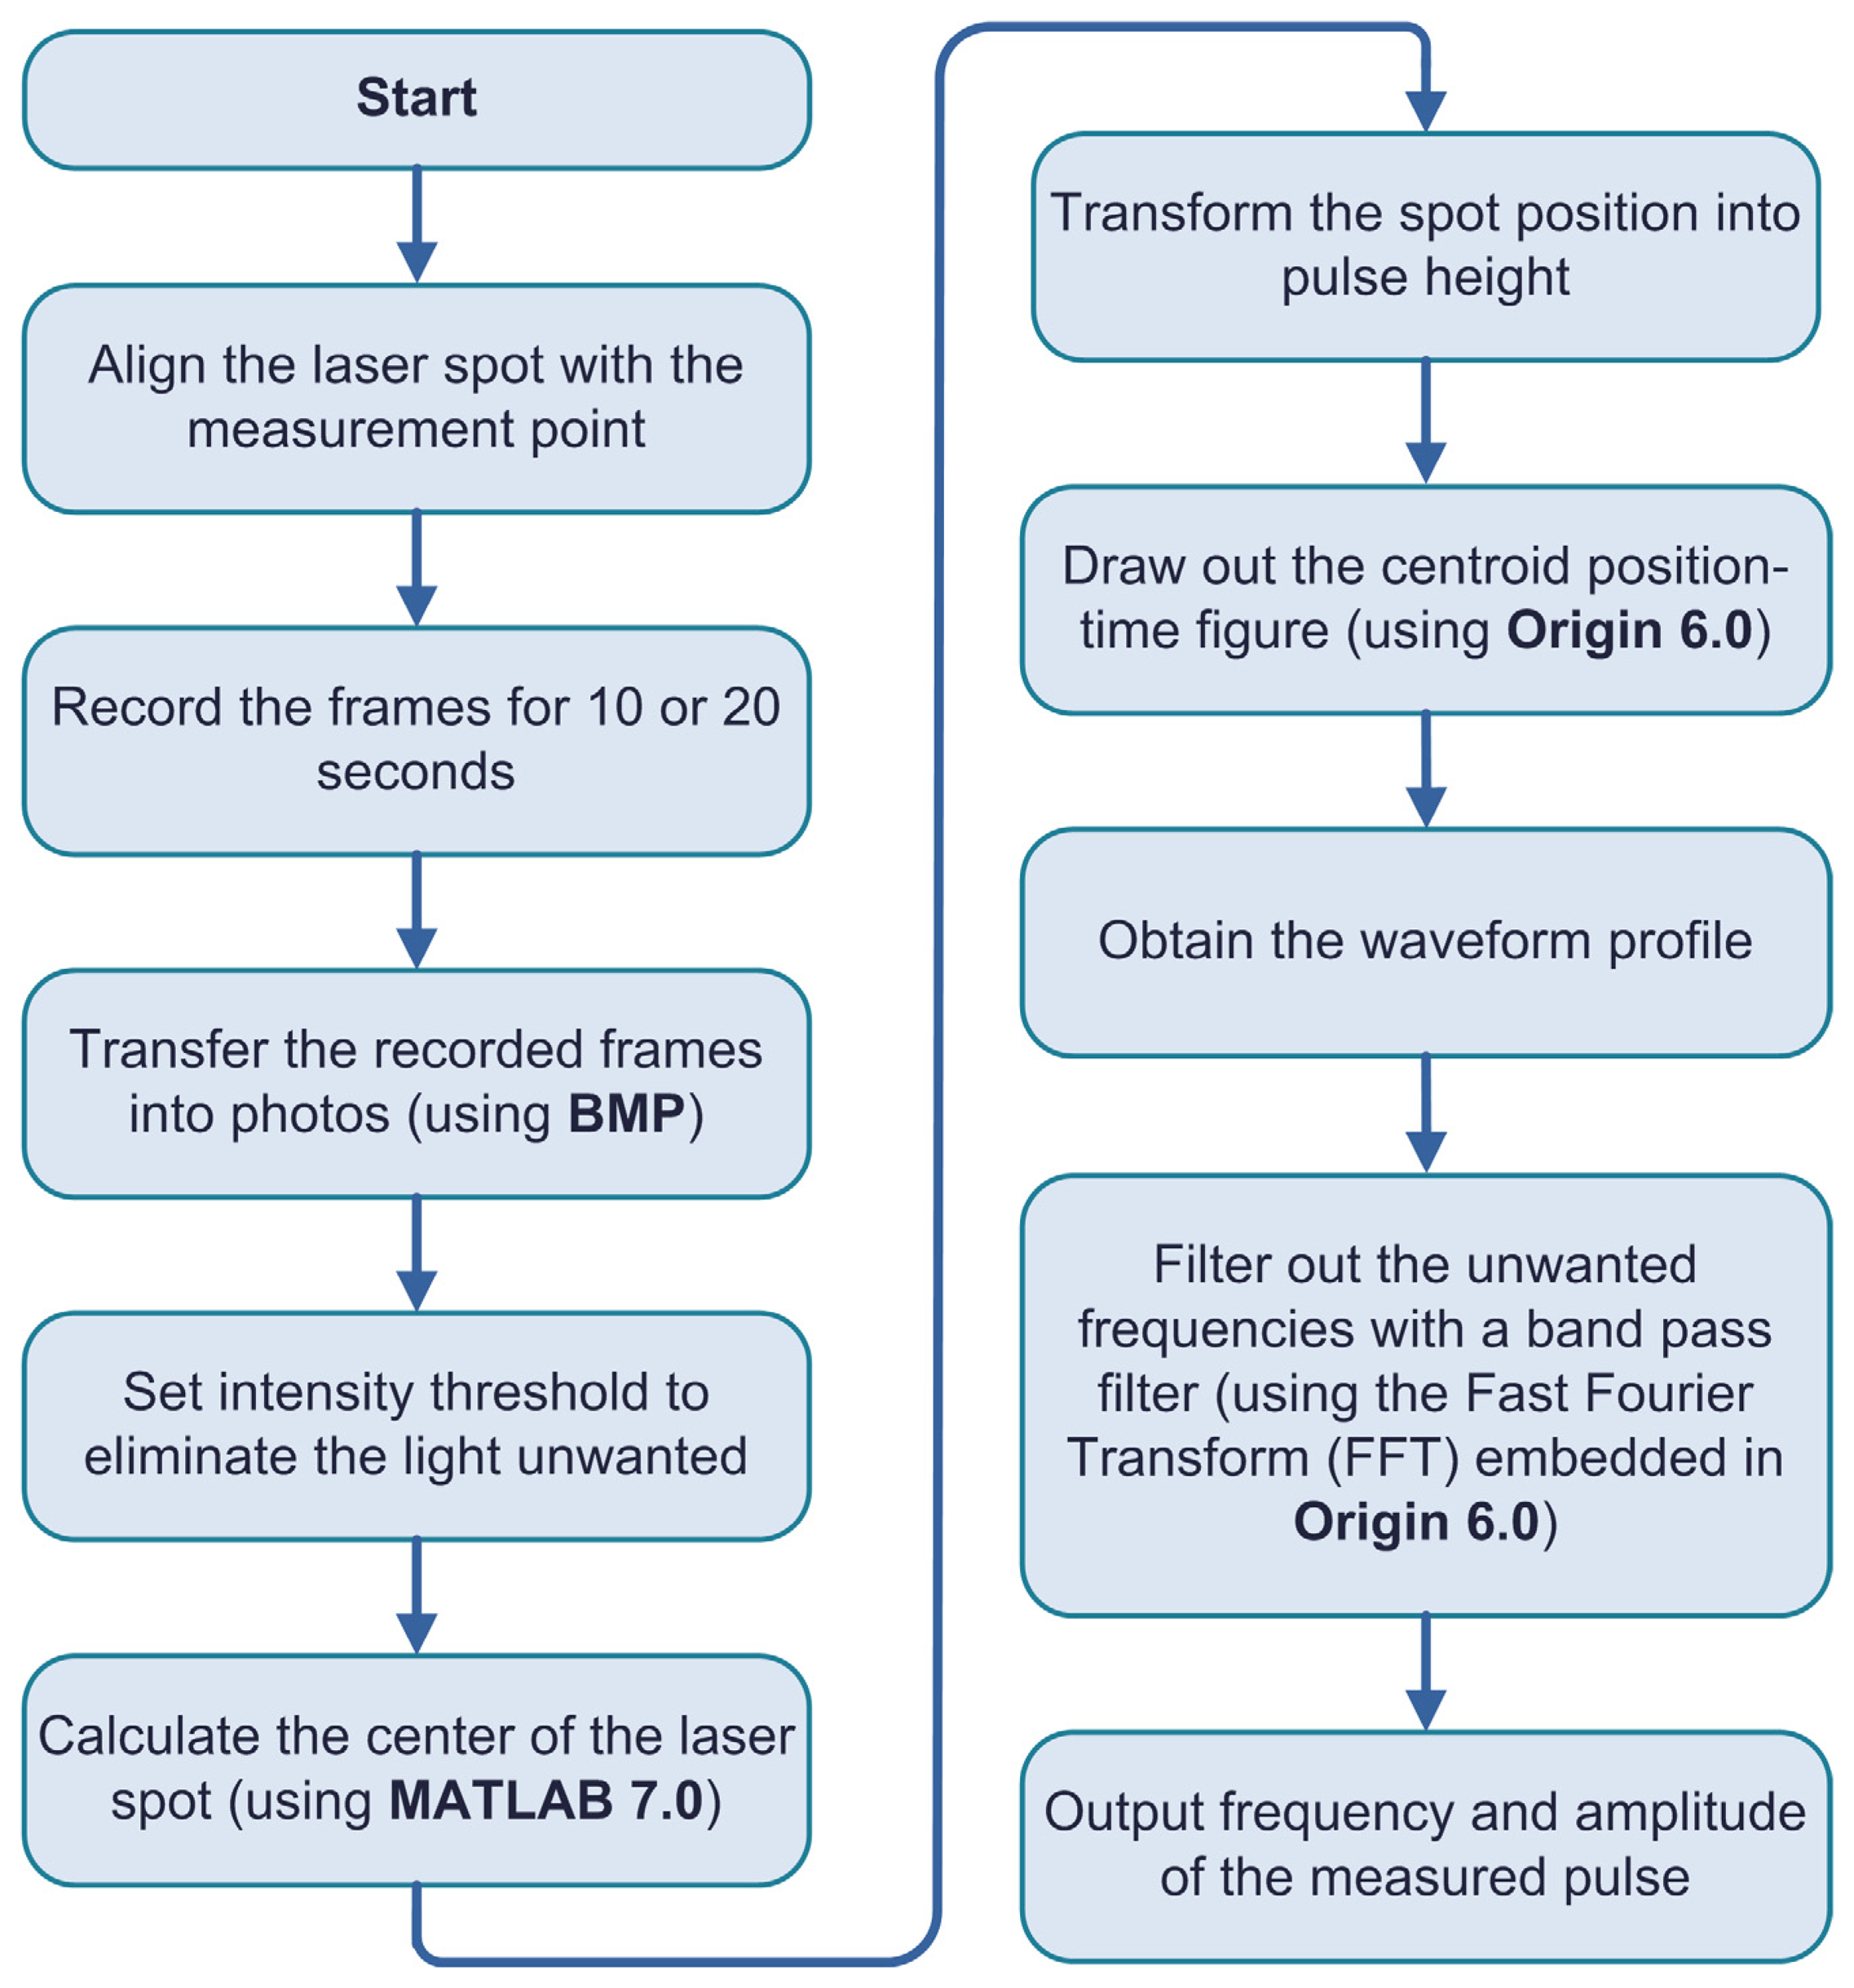
There is a large amount of stray light due to the diffusely scattering nature of the skin tissue. By decreasing the ET of the CMOS sensor, the undesirable light can be eliminated. For example, Fig. 3(a) shows the experimental result when the ET value of the CMOS image sensor was set to 40. In the case of Fig. 3(b), the ET value of the CMOS image sensor was set to 1. The contours of the laser spot shown in Fig. 3(b) are obviously smaller than that in Fig. 3(a). In a normal image capturing situation, as shown in Fig. 3(a), the previously measured point can be approximately relocated by comparing the two consecutively captured frames. The signal processing flowchart is shown in Fig. 4. The software packages of MATLAB 7.0 and Origin 6.0 were used to develop the signal processing program. The program we developed can calculate the amplitude and frequency of the arterial pulse of the tested subject via examining the relative movements of the measured laser spots.
3. Calibration and validation of the arterial pulse measurement system
The image data were recorded by a CMOS image sensor and transmitted to a personal computer for further analysis. The images were saved in bitmap format for later image processing and frequency spectrum analysis. Fifteen frames per second were captured by the CMOS image sensor. The pictures captured by the CMOS image sensor lasted for 10 or 20 seconds in each measurement. The more frames are recorded; the better resolution of the image data can be achieved.
The calibration of the APM system was very straightforward and easy. A precise translator was used to calibrate the linearity of the APM system. A white paper was placed above the translator as a reference panel, and then the shift of the laser spot can be calibrated by adjusting the elevation of the translator step-by-step. The adopted step size of the translator that can mimic pulsation amplitude measurement is 20 μm. The schematic drawing of the linearity calibration of the APM system is shown in Fig. 5. The amplitude calibration of pulsation height measured by the APM system was conducted on an isolated optical table. The results for the linearity calibration experiments are shown in Fig. 6(a).
The one standard deviation (1σ) is obtained by conducting the measurements 30 times, and the results are as shown in Fig. 6(b). Examining Fig. 6(b) indicates that the one standard deviation of the APM system achieved is less than 0.04 pixels, i.e., approximately equivalent to 3.8 μm. This fact demonstrates that the APM system provides pretty good performance on measurement stability.
The frequency calibration was conducted by comparing the experimental results with the drumhead movements of a loudspeaker driven by a high-precision function generator (LFG-1300, Leader, Inc.). In this experiment, we used a function generator with a specific frequency to drive the loudspeaker. So, the drumhead variation of the loudspeaker referred to a standard frequency can be provided as the reference of the frequency calibration of our APM system. The schematic drawing of the frequency calibration of the APM system is shown in Fig. 7. For the loudspeaker operated at 1.0 Hz, the amplitude variation of the loudspeaker drumhead movements in the time domain and its frequency spectrum are shown in Fig. 8(a) and 8(b), respectively. The calibration results, from 0.6 to 2.0 Hz, are shown in Table 1. In this test, the frame capture rate of CMOS image sensor of the APM system is set to 15 frames/sec. The accuracy of pulse measurement could reach 2.5%, i.e. the error in the pulse rate would be less than 1.5 pulses per minute.
The accuracy of the frequency measurement of our APM system was also validated by comparing the experimental results with the data obtained from a blood pressure monitor (Model No.: OS-512, OSIM, Inc.). Ten healthy volunteers participated in this study. The experimental results are summarized in Table 2. The difference between the measured results obtained from the APM system and the blood pressure monitor was no more than 2.8%, i.e., 2 pulses/min.
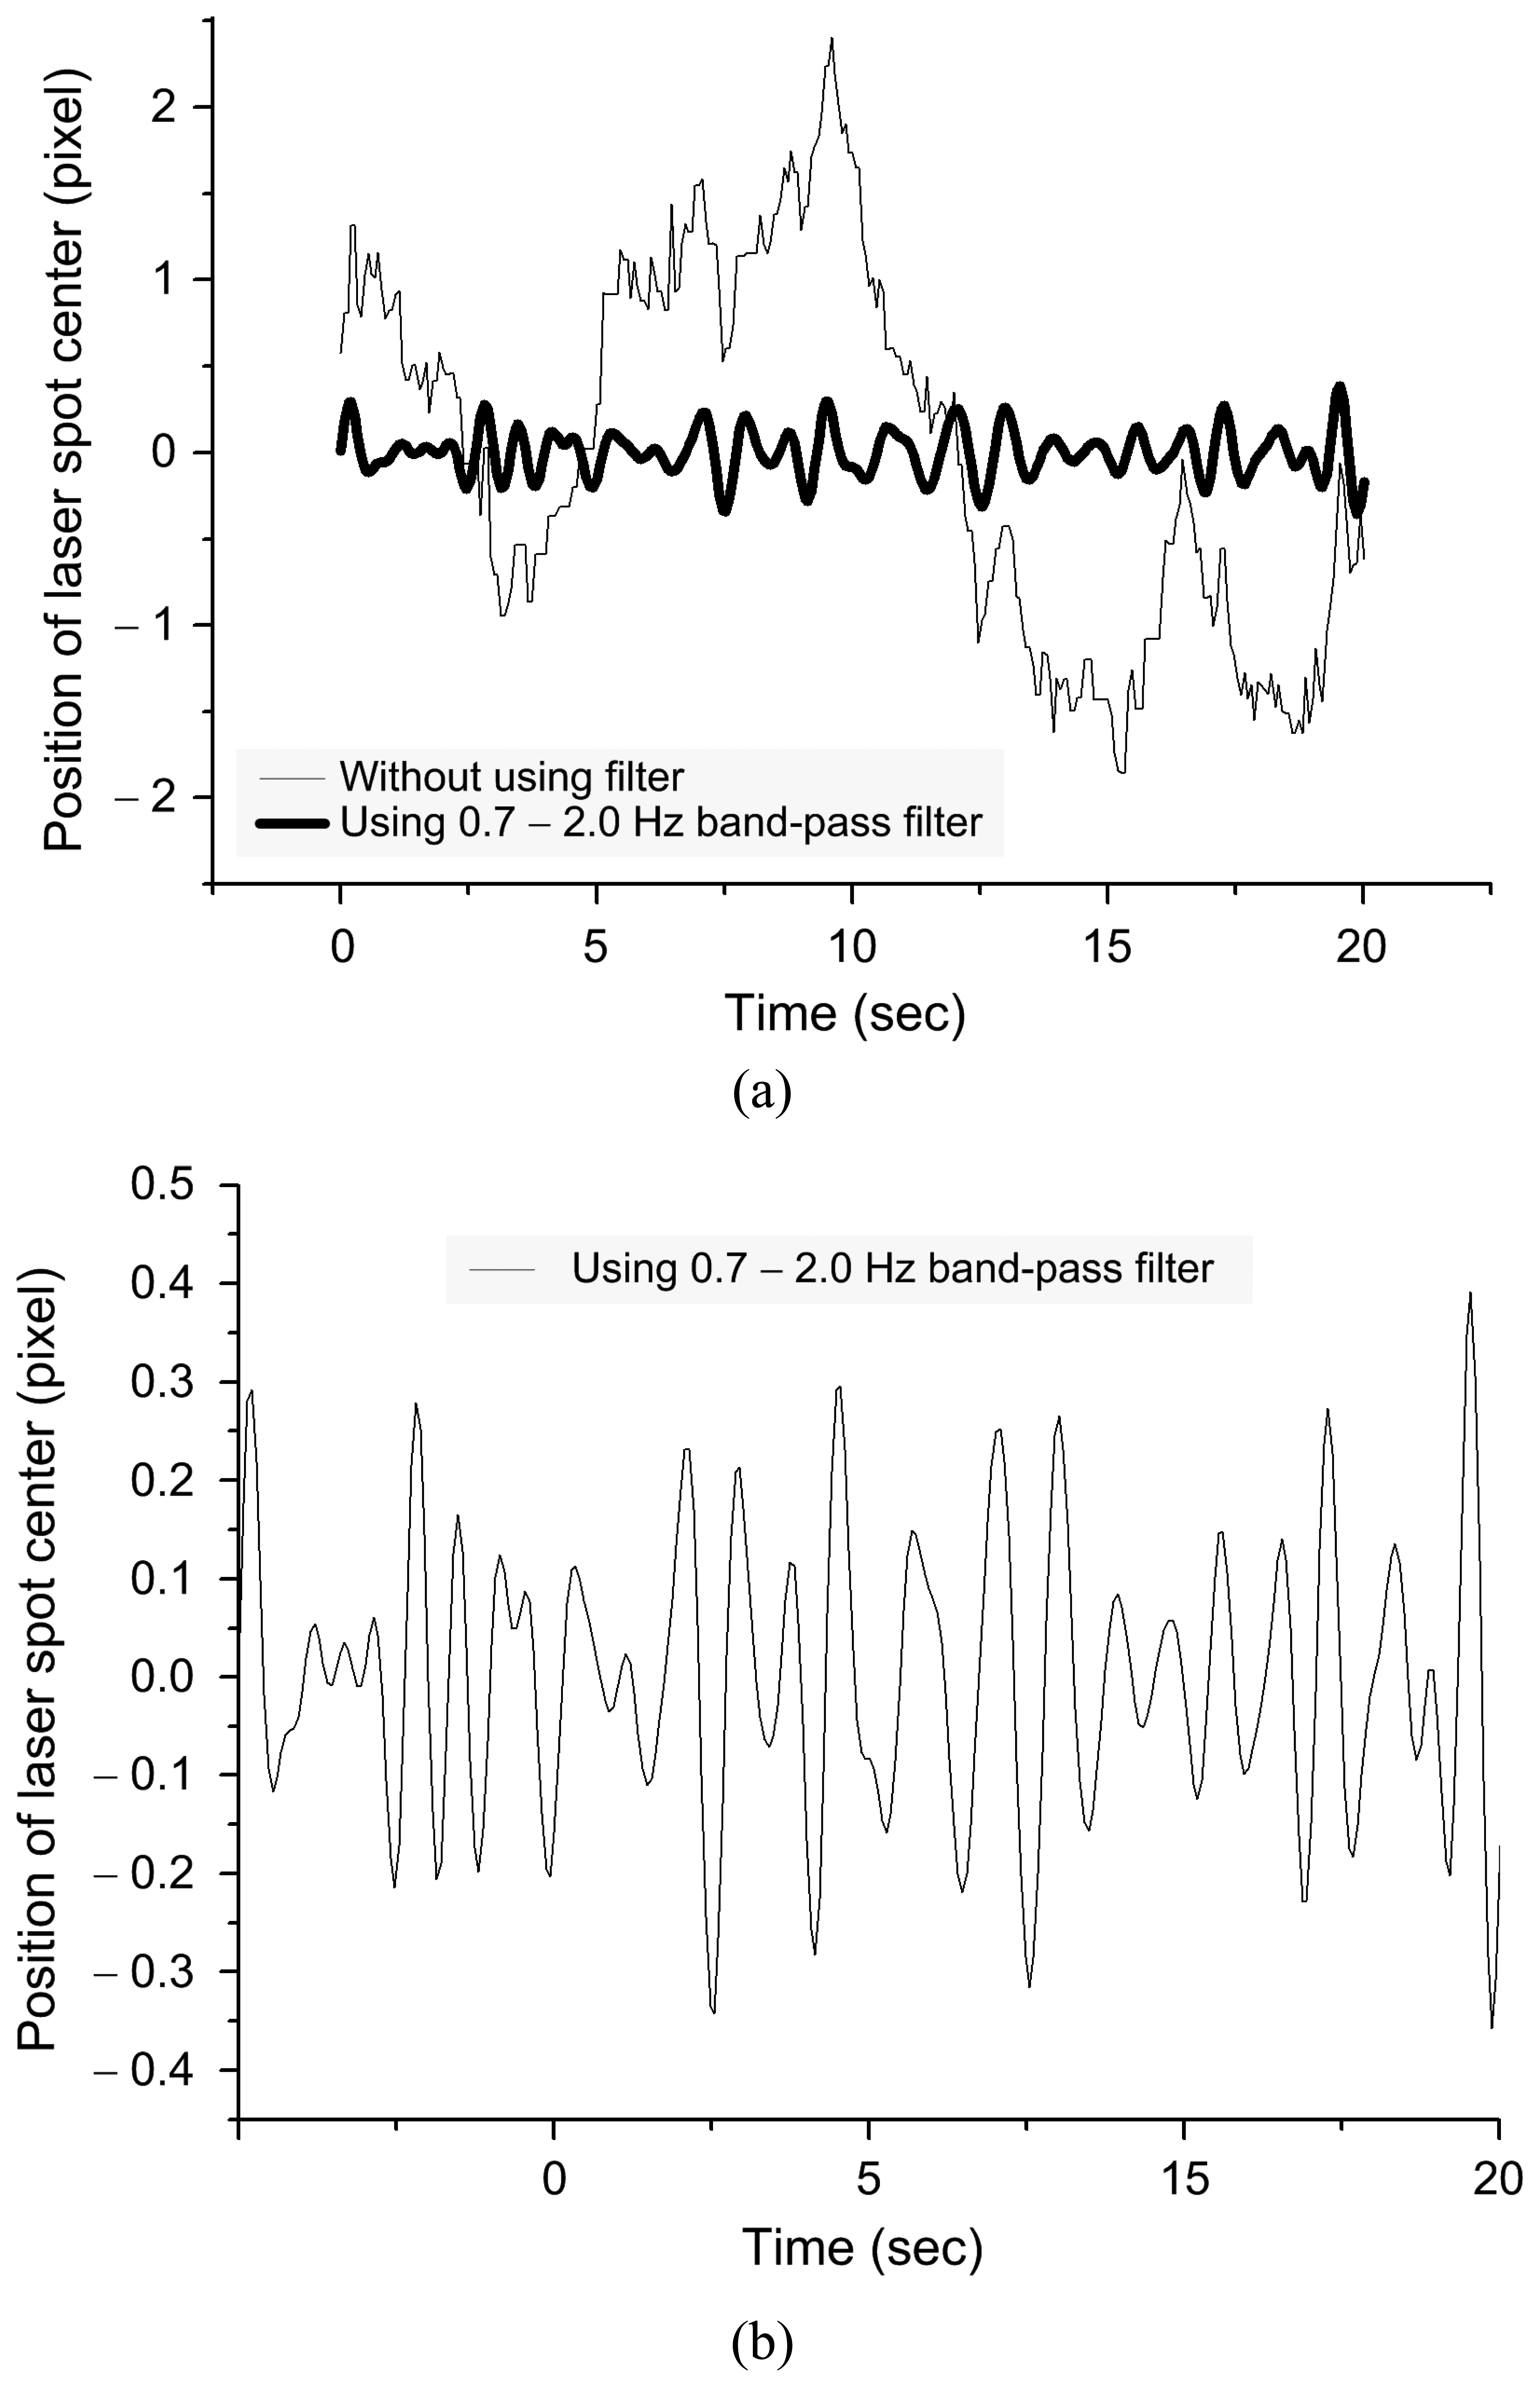
The position variations of the laser spot centers measured in the time domain are illustrated by the thin line in Fig. 9(a). This variation curve contains a full region of information associated with vibration frequencies and amplitudes of the arterial pulses, breathings, hand movements, and involuntary body tremors. Generally, the human pulse is about 0.7 to 2 Hz. The measurement data after being filtered with a band pass filter is depicted by a thick line as shown in Fig.9 (a). The amplitude of vibration of laser spot center (in terms of pixels) has been enlarged in Fig. 9(b). It can be seen that the change of the center of the laser spot is proportional to the change in distance to the skin as calculated in Eq. (1). In Fig. 9(b), the peak to peak values of the spot center variation curve are almost fallen within 0.6 pixels, i.e., the arterial pulse amplitude is approximately equal to 57 μm. The full spectrum in frequency domain for Fig. 9(a) is shown in Fig. 10 (a). An inspection of both Fig. 9(a) and Fig. 10(a) indicates that there was low frequency vibration caused by noise, hand movements, and breathings. After filtering, the pulse frequency (1.17 Hz) could be obtained easily, as seen in Fig. 10(b).
4. Experimental results
In TCM there are four diagnostic methods: inspection, auscultation, questioning, and palpation. Among these methods, the pulse diagnosis by palpation is the most important and also the most difficult one. According to Chinese medical literature [13], there are in total of 29 wave patterns of the arterial pulse, each having a specific name. However, it is too difficult and too subjective for most people to distinguishing 29 different wave patterns with the finger tips. The TCM physician usually needs to use an auxiliary device to determine these patterns. The relationships between the organs health and the measurement points are illustrated in Fig. 11. This is especially meaningful in TCM clinical practice, because for pulse diagnosis the physician places his index, middle, and ring fingers on the patient's wrist, in accordance with the three locations called Chun, Guan, and Chy [14]. In our experiments, we found that variations in the pulse at relative measurement points on the wrist mentioned-above could reveal something about the physiology of the tested subjects.
Some of the measurement results for pulse amplitude and frequency obtained under different conditions are shown in Figs. 12 and 13, respectively. In Fig. 12, the pulse amplitude and frequency measured at the Chun point of left hand (related to the small intestine) showed an obvious increase after having food. Fig.12 (a) shows results observed before the meal and Fig. 12(b) are those after meal, respectively. The measurements were conducted 30 minutes before and 30 minutes after eating the meal.
In Fig. 12(a), the peak to peak value of pulsation amplitude is approximately within 0.4 pixels, i.e., the maximum variation in pulse amplitude is approximately equal to 38 μm. In Fig. 12(b), the peak to peak value of pulsation amplitude is approximately ranged from – 0.32 to 0.28 pixels. This means that the maximum variation in pulse amplitude of the tested subject after meal 30 min will increase to 48 μm. An examination of Figs. 12(a) and 12(b) also observes that the pulse frequency measured at the Chun point of left hand of the tested subject is changed from 1.27 to 1.35 Hz.
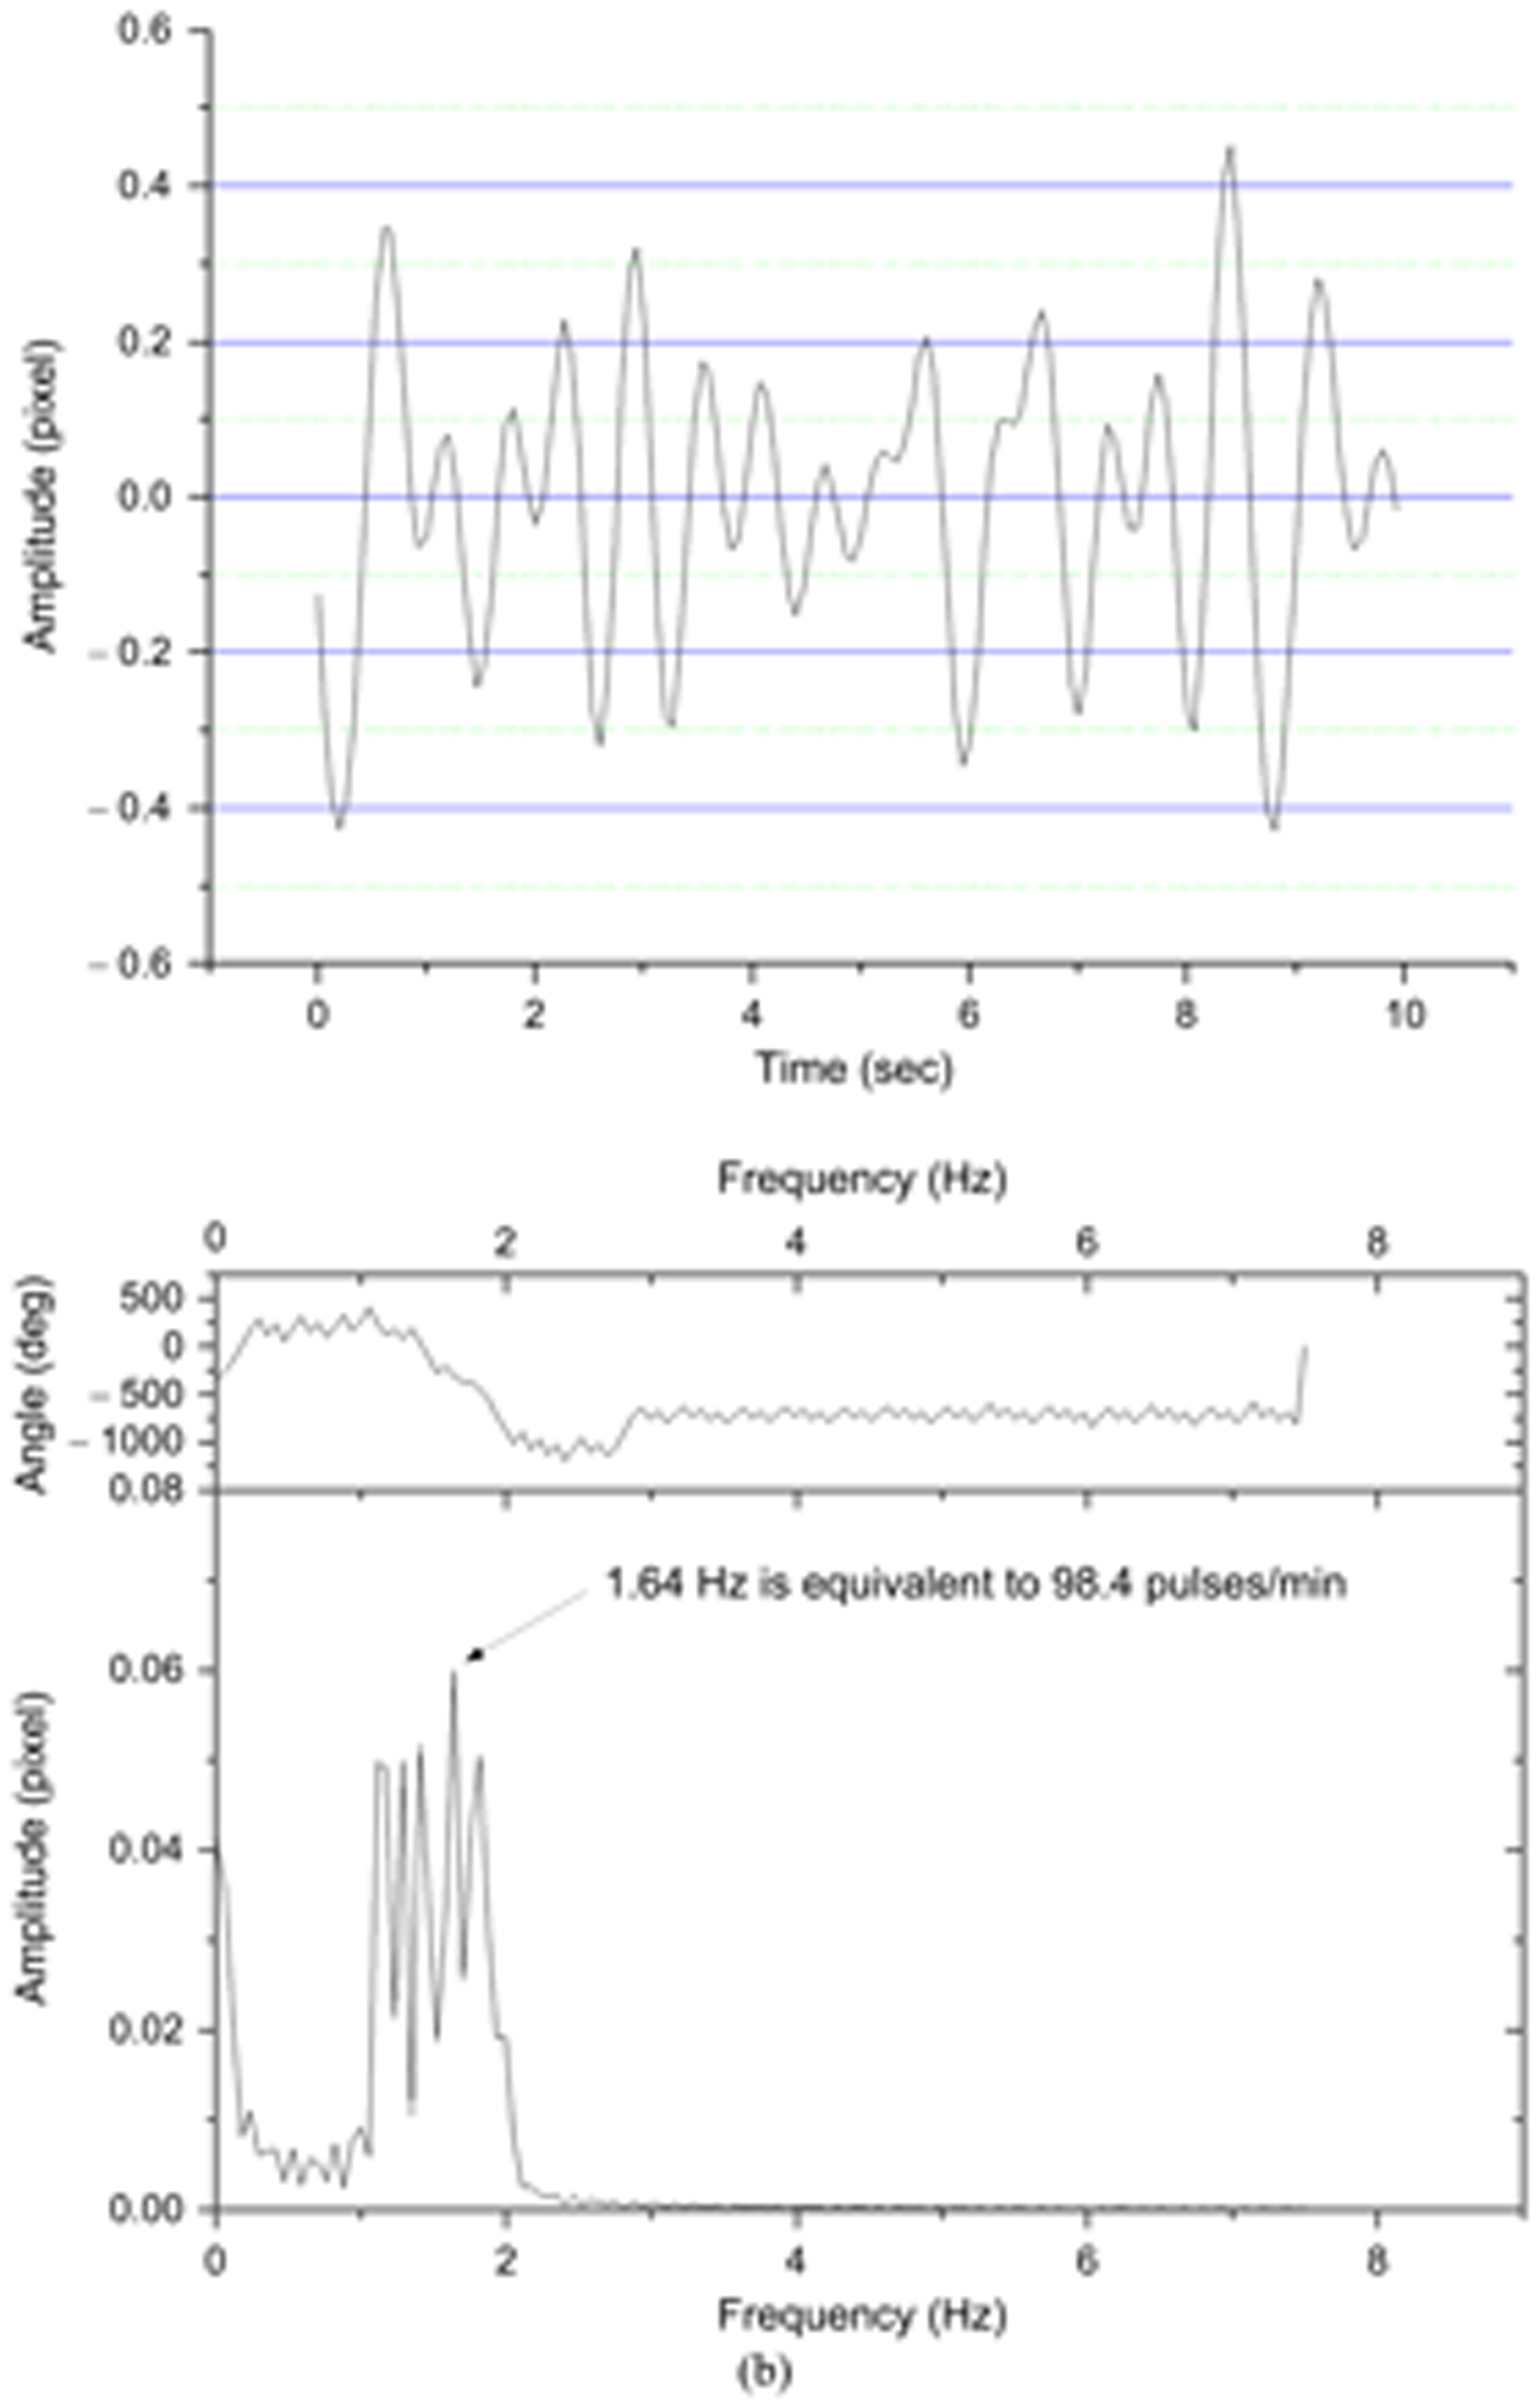
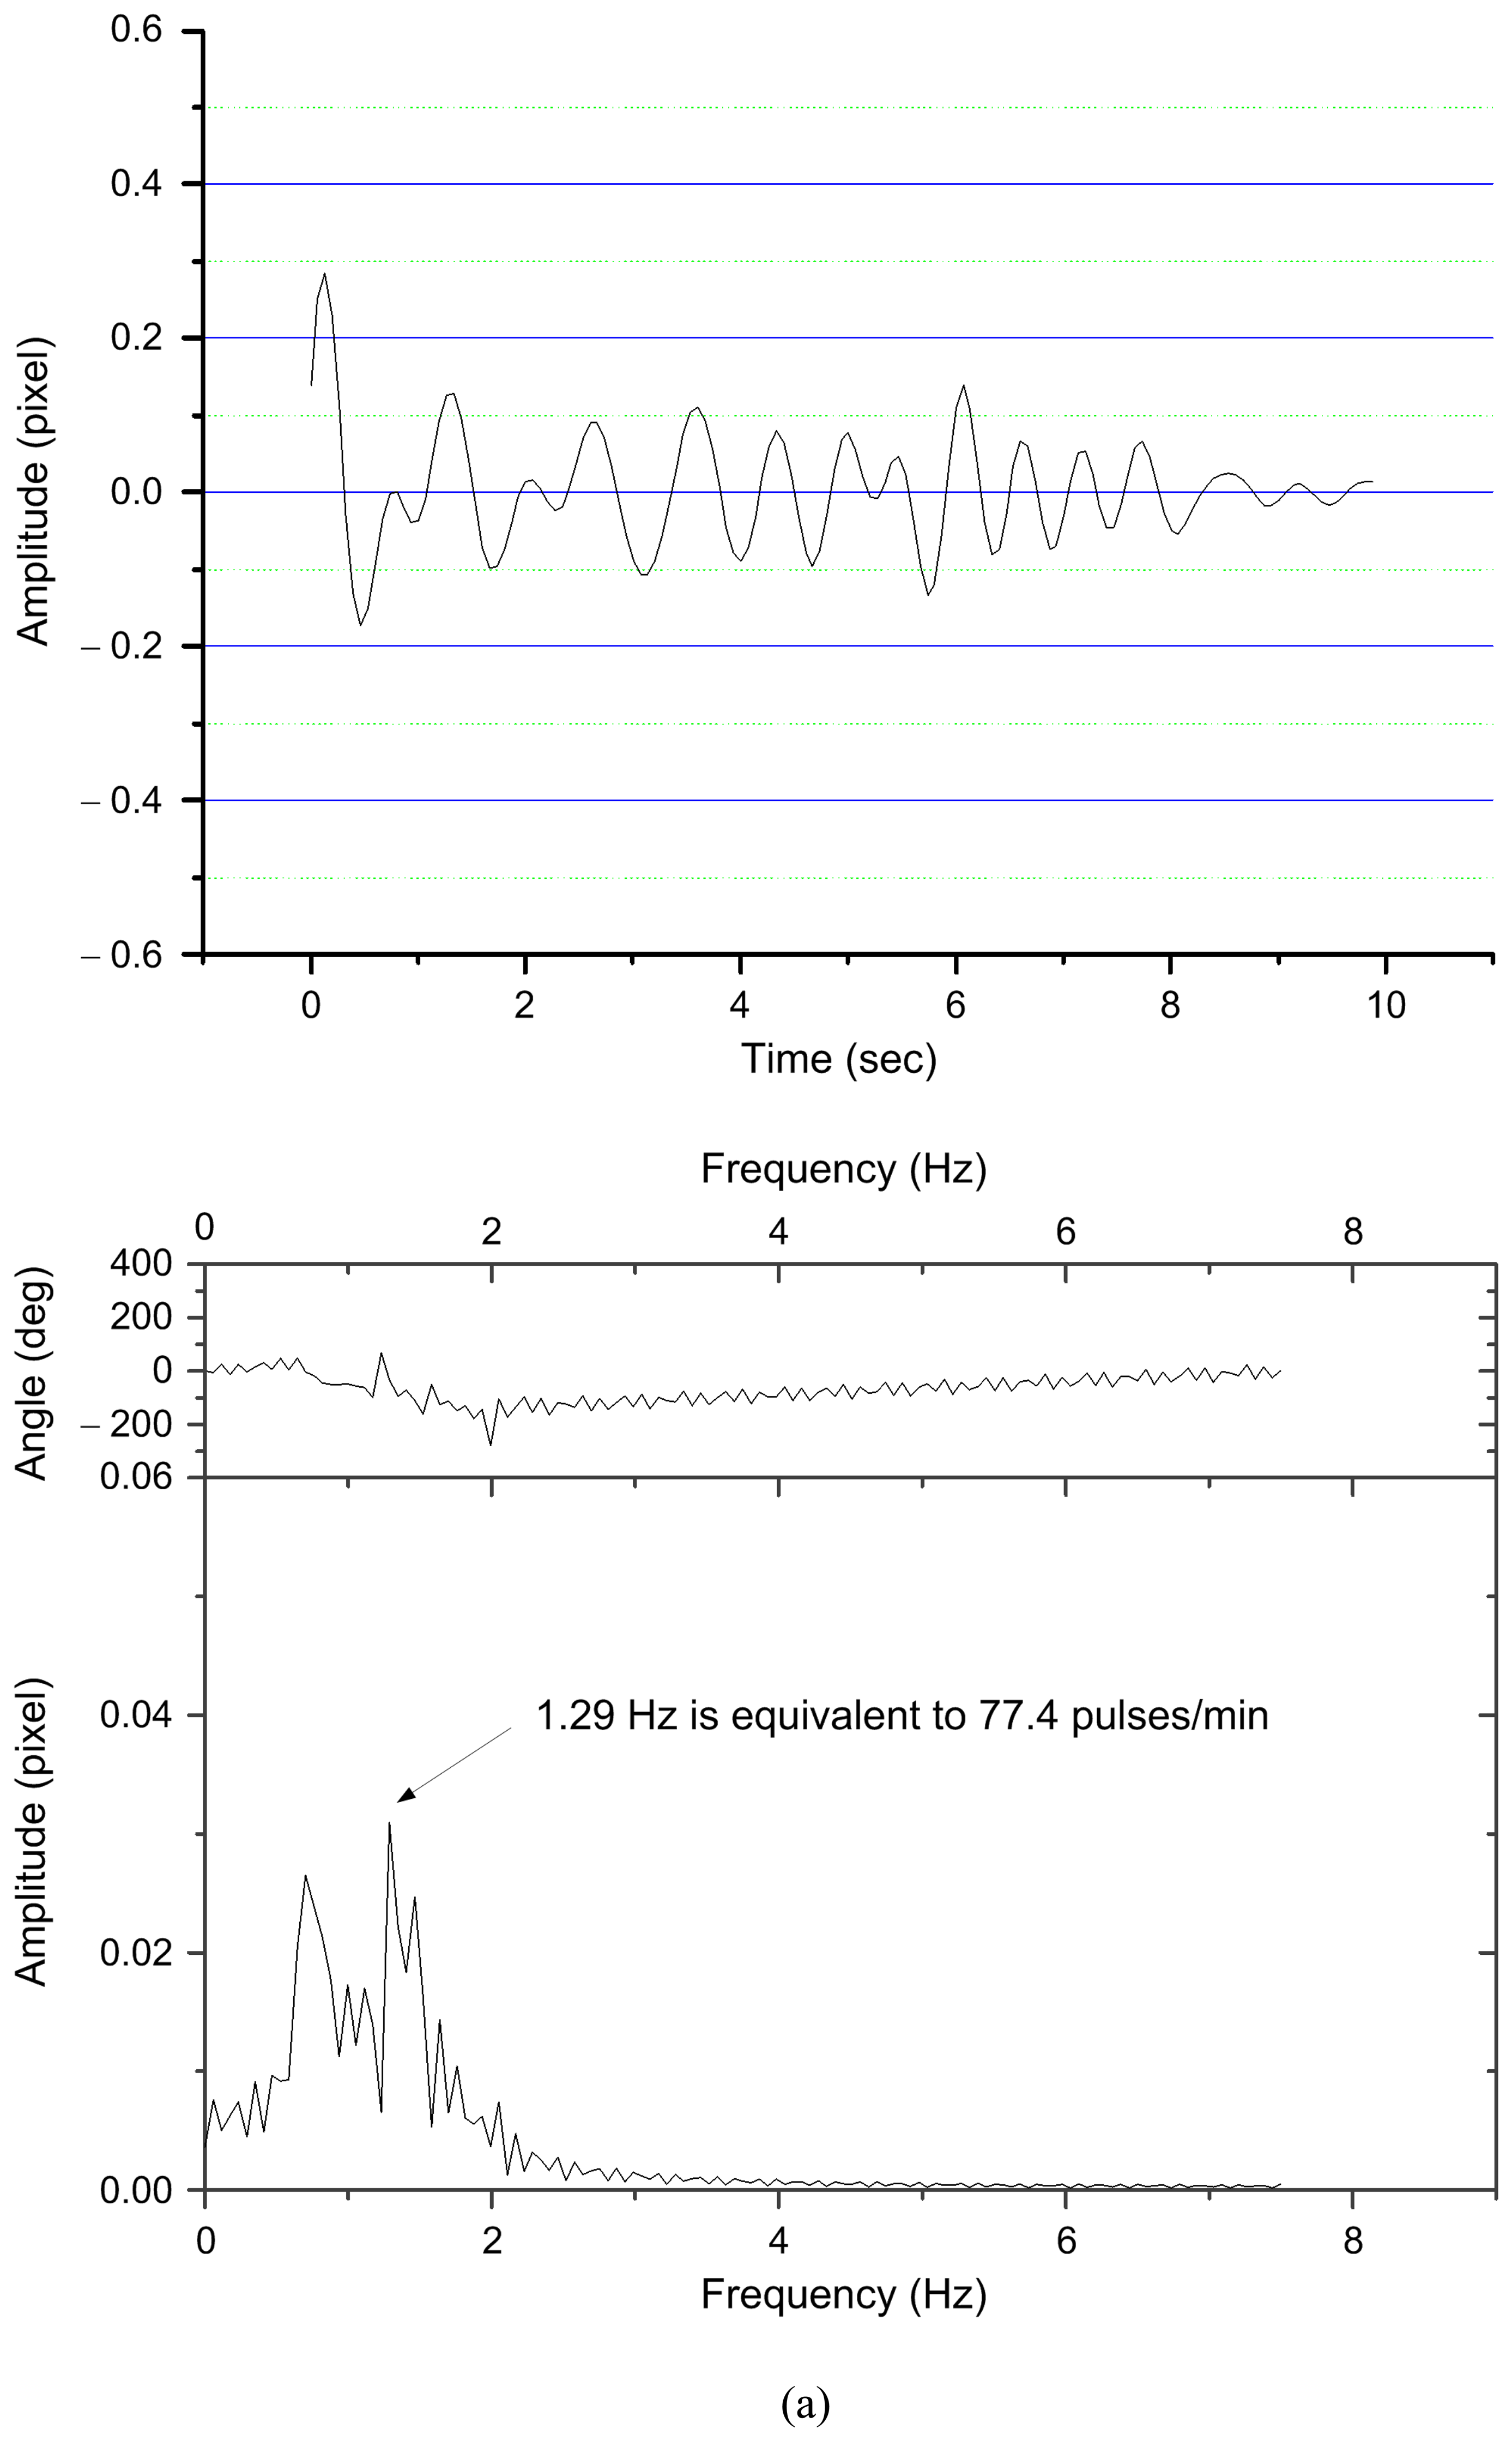
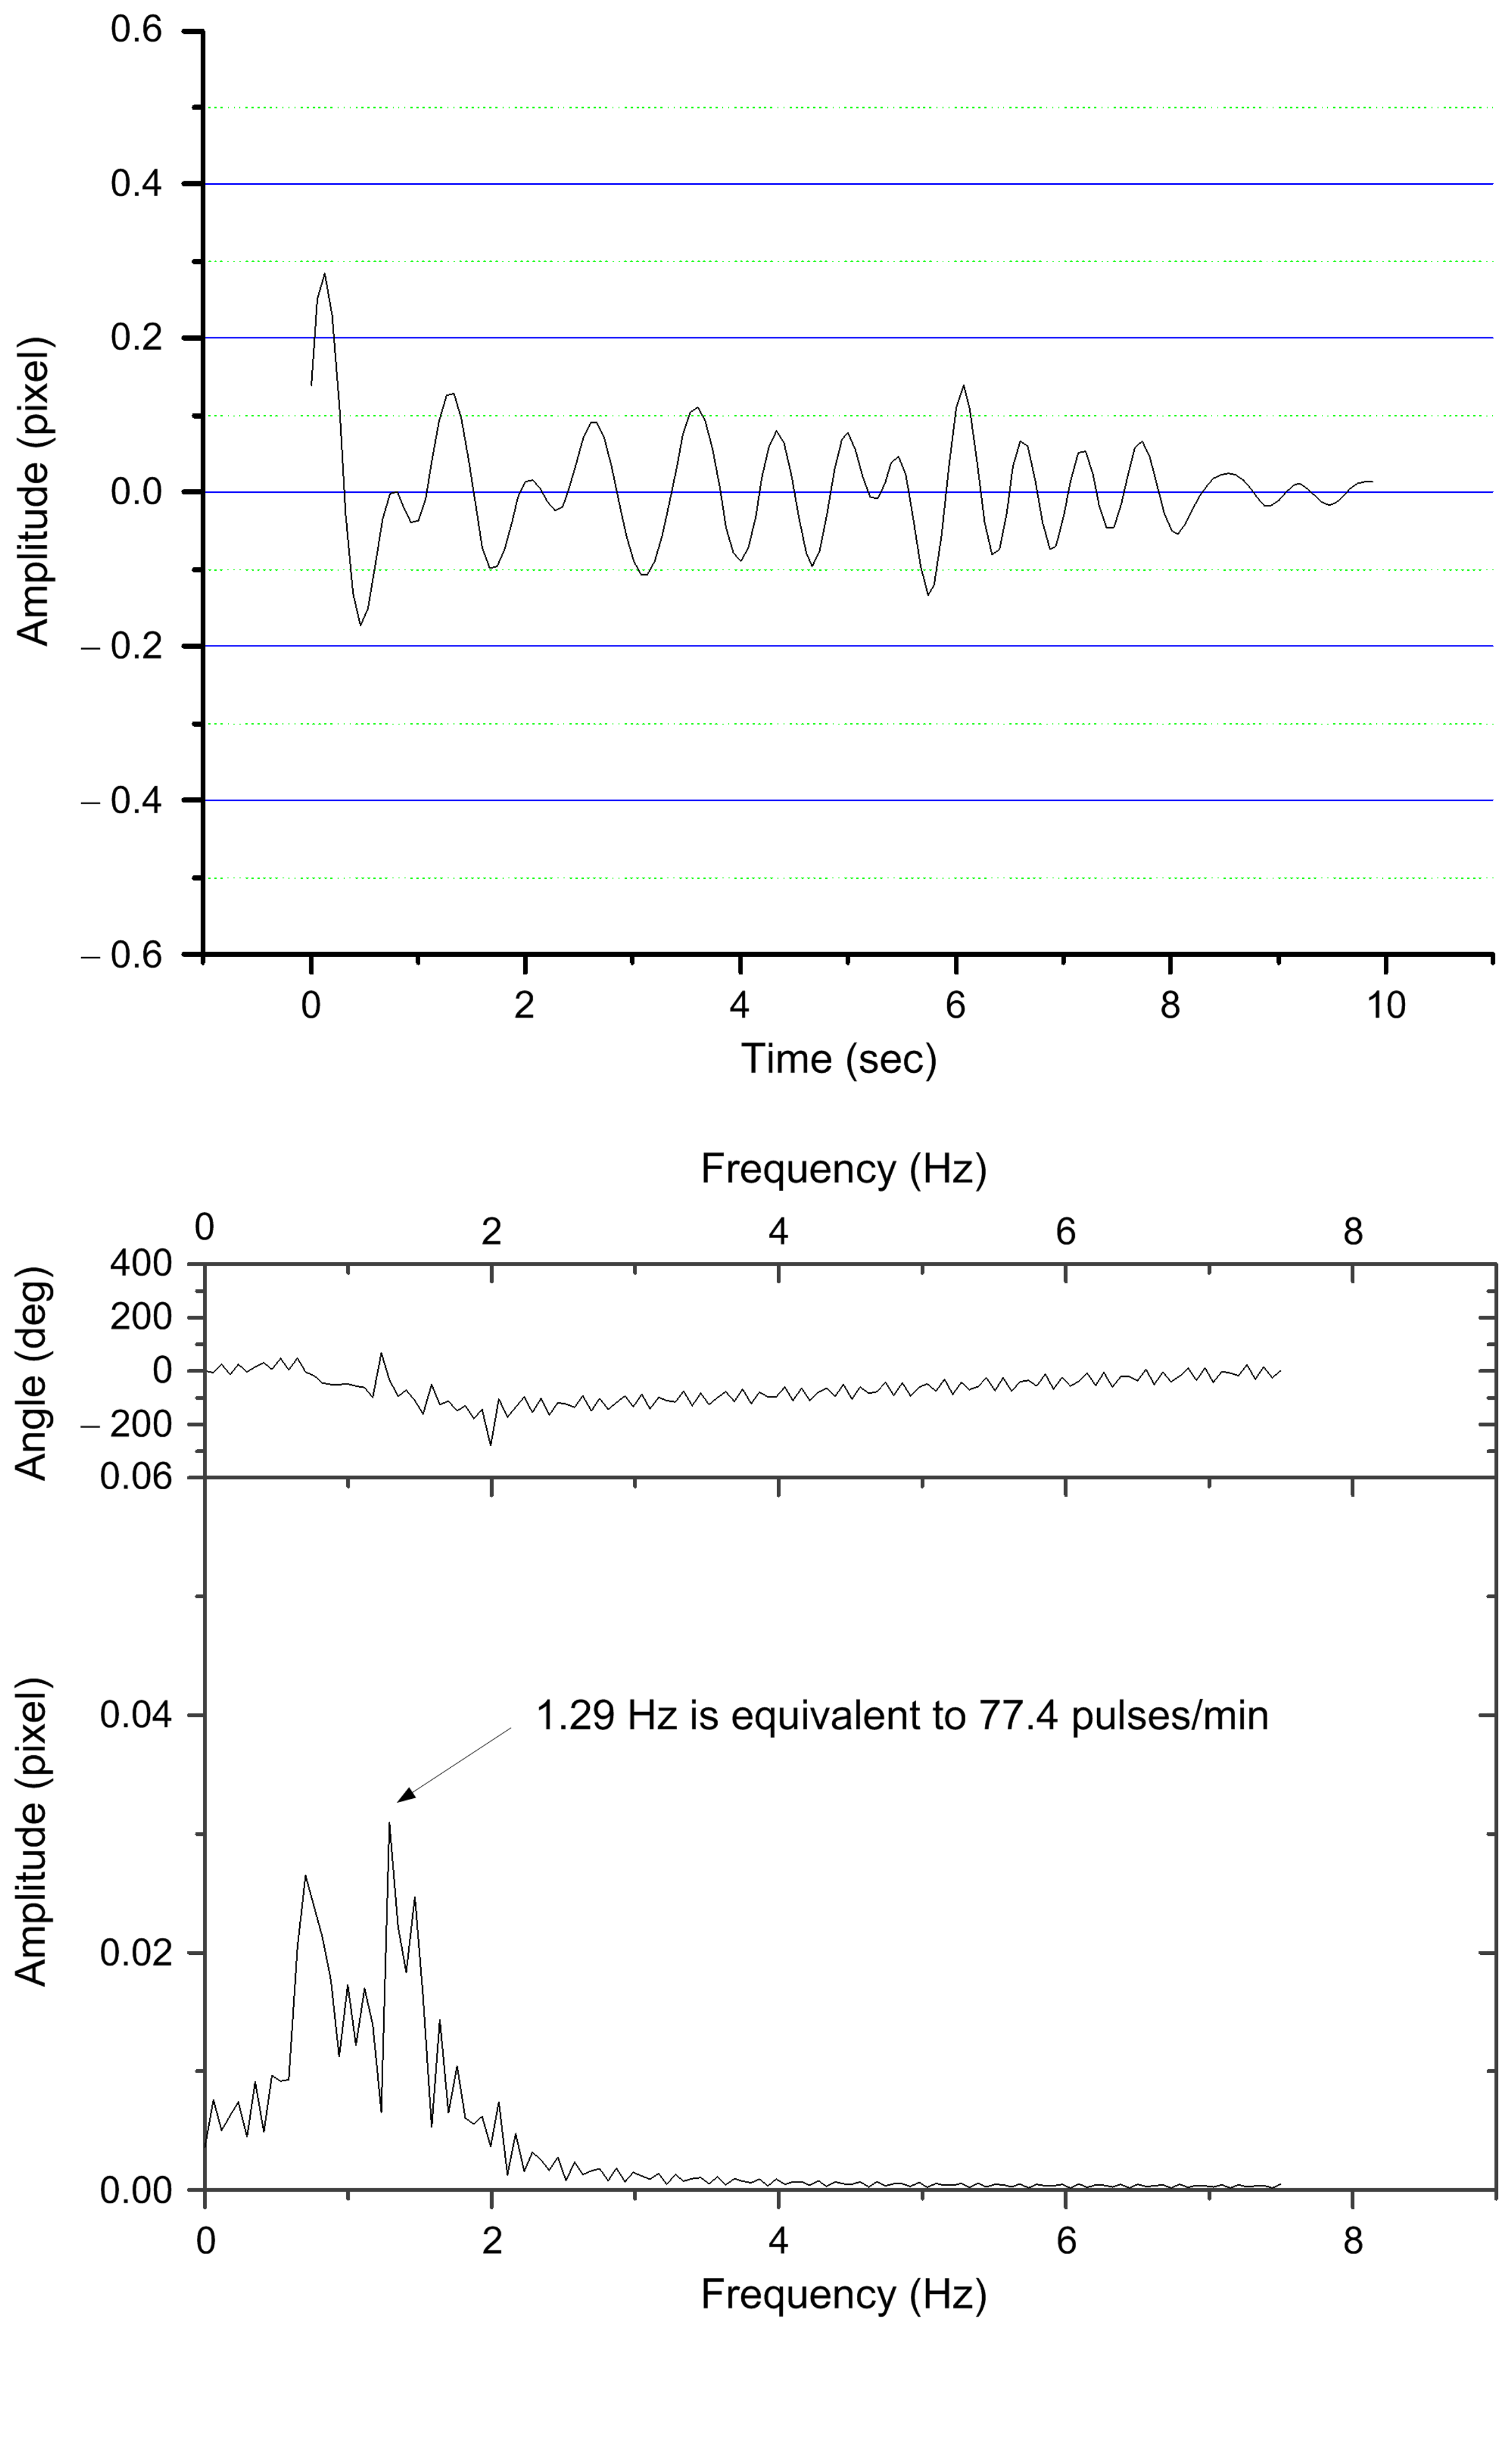
The other test showed that staying up late caused changes in the amplitude and frequency of the pulse at the Guan point of left hand. The pulsation at the Guan point of left hand is closely related to the liver activity. Without staying up late, the amplitude and frequency of the pulsation of the tested subject measured at Guan point were normal, as shown in Fig. 13(a). But after staying up late, it showed an apparent increase in the amplitude of measurement data, as shown in Fig. 13(b). In Fig. 13(a), the peak to peak amplitude of pulsation measured at the Guan point on the left hand of the tested subject varies in small range, approximately equal to 0.2 pixels (i.e., equivalent to 19 μm). In Fig. 13(b), for the tested subject staying up late the pulse variation in peak to peak amplitude measured at the Guan point enlarged approximately to 0.6 pixels (for most portion), which is equivalent to 57 μm. In this case, the pulse frequency is also changed from 1.29 to 1.64 Hz. In TCM practice, this measurement indicated the state of the liver's health.
5. Conclusions
Based on optical laser triangulation theory, a non-invasive and non-contact arterial pulsation measurement (APM) system to detect micro-vibration on skin surface is developed in this work. The APM system consists chiefly of a laser diode and a CMOS image sensor, and the implementation cost is pretty low. An extensive series of experiments to evaluate the performance of the APM system was conducted. The pulse waveforms of the tested subject can be detected by our APM system easily. The APM system achieves a measurement resolution of μm order. Experimental results also show that the amplitude and frequency of the pulse of tester have been changed under different conditions. These tests demonstrate the performance of the proposed APM system for measuring micro-pulsation on skin surface is pretty good. If a speedier CMOS or CCD image sensor, such as 200 frames per second or more and a smaller pixel size can be used, the pulse waveform obtained by our APM system would be more accurate and clearer. To reduce the speckle effect of the laser, a non-coherent light could be chosen. This would also reduce the noise caused by laser light.
Our experimental results have shown the feasibility of using the optical triangulation method and a CMOS image sensor to measure arterial pulsation. Although the demonstrated examples are not yet sufficient to clinical bearings, they serve to test the method and evaluate the performance of the proposed APM system. In the future, this arterial pulse measurement system can be improved by using 3 light sources to simultaneously check the pulsation of three or six different TCM points on the wrist (i.e., Chun, Guan, and Chy points on one hand or two hands, respectively). And the relation between the pulse signal and the healthy condition of the subject will be established. We hope that we can report the investigation results in future.
Acknowledgments
The authors are grateful to the National Science Council of the Republic of China for financially supporting this research under contract no.: NSC 94-2213-E-002-120 and NSC 95-2218-E-002-073.
References and Notes
- Martin, J. F.; Volfson, L. B.; Kirzon-Zolin, V.V.; Schukin, V.G. Application of pattern recognition and image classification techniques to determine continuous cardiac output from the arterial pressure waveform. IEEE Trans. Biomed. Eng. 1994, 41(10), 913–920. [Google Scholar]
- Fu, S. E.; Lai, S. P. A system for pulse measurement and analysis of Chinese medicine., Proceedings of IEEE Engineering in Medicine & Biology Society's 11th Annual International Conference; 1989; pp. 1695–1696.
- Min, S. G.; Yoon, D. H. Convergence characteristics of MADF algorithm in the pulse diagnostic apparatus. Proceedings of IEEE Region 10 Conference; 1999; 2, pp. 1551–1554. [Google Scholar]
- Yoon, S. H.; Koga, Y.; Matsumoto, I.; Ikezono, E. An objective method of pulse diagnosis. American J. of Chinese Medicine 1987, 15(3/4), 147–153. [Google Scholar]
- Lu, W.A.; Lin, Y.Y.; Wang, W. K. Pulse analysis of patients with severe liver problems. IEEE Eng. in Med. and Bio. 1999, 18(1), 73–75. [Google Scholar]
- Hong, H. D.; Fox, M. D. No touch pulse measurement by optical interferometry. IEEE Trans. Biomed. Eng. 1994, 41(11), 1096–1099. [Google Scholar]
- Sequeira, V.; Goncalves, J. G. H.; Isabel Ribeiro, M. 3D environment modeling using laser range sensing. Robotics and Autonomous Systems 1995, 16, 81–91. [Google Scholar]
- Amann, M. C.; Bosch, T.; Myllylä, R.; Rioux, M. Laser ranging: a critical review of usual techniques for distance measurement. Opt. Eng. 2001, 40(1), 10–19. [Google Scholar]
- Wu, J. H.; Horng, K. Y.; Chang, R. S. Triangulation-based range finder using a complementary metal-oxide semiconductor (CMOS) image sensor for application to automotive systems. Opt. Eng. 2006, 45(4). [Google Scholar]
- Manneberg, G.; Hertegard, S.; Liljencrantz, J. Measurement of human vocal fold vibrations with laser triangulation. Opt. Eng. 2001, 40(9), 2041–2044. [Google Scholar]
- Agwani, S.; Domer, S.; Rubacha, R.; Stanley, S. High performance, VGA resolution digital color CMOS imager. In SPIE 3649, Conference on Sensors, Cameras, and Systems for Scientific/Industrial Applications; 1999; pp. 154–164. [Google Scholar]
- Wong, H. S. Technology and device scaling considerations for CMOS imagers. IEEE Trans. on Electron Devices 1996, 43(12), 2131–2342. [Google Scholar]
- Wang, S. H. 265-317AD; The classic of the Pulse (in Chinese).; reprinted by Wen Kuan Publishing Co.: Taipei, Taiwan, ROC, 1972. [Google Scholar]
- Dharmananda, S. The significance of traditional pulse diagnosis in the modern practice of Chinese medicine. Institute for Traditional Medicine: Portland, Oregon, 2000. http://www.itmonline.org/arts/pulse.htm.
- Ramirez, R. W. The FFT Fundamentals and Concepts; Tektronix Inc.: Englewood Cliffs, New Jersey, 1986; pp. 12–13. [Google Scholar]
- Dorsch, R. G.; Häusler, G.; Herrmann, J. M. Laser triangulation: fundamental uncertainty in distance measurement. Appl. Opt. 1994, 33(7), 1306–1314. [Google Scholar]
- Fillard, J. P. Subpixel accuracy location estimation from digital signals. Opt. Eng. 1992, 31(11), 2465–2471. [Google Scholar]
- Van Gemert, M. J. C.; Jacques, S. L.; Sterenborg, H. J. C. M.; Star, W. M. Skin optics. IEEE Trans. Biomed. Eng. 1989, 36(12), 1146–1154. [Google Scholar]
Figure 1.
Geometrical layout of the arterial pulse measurement system.
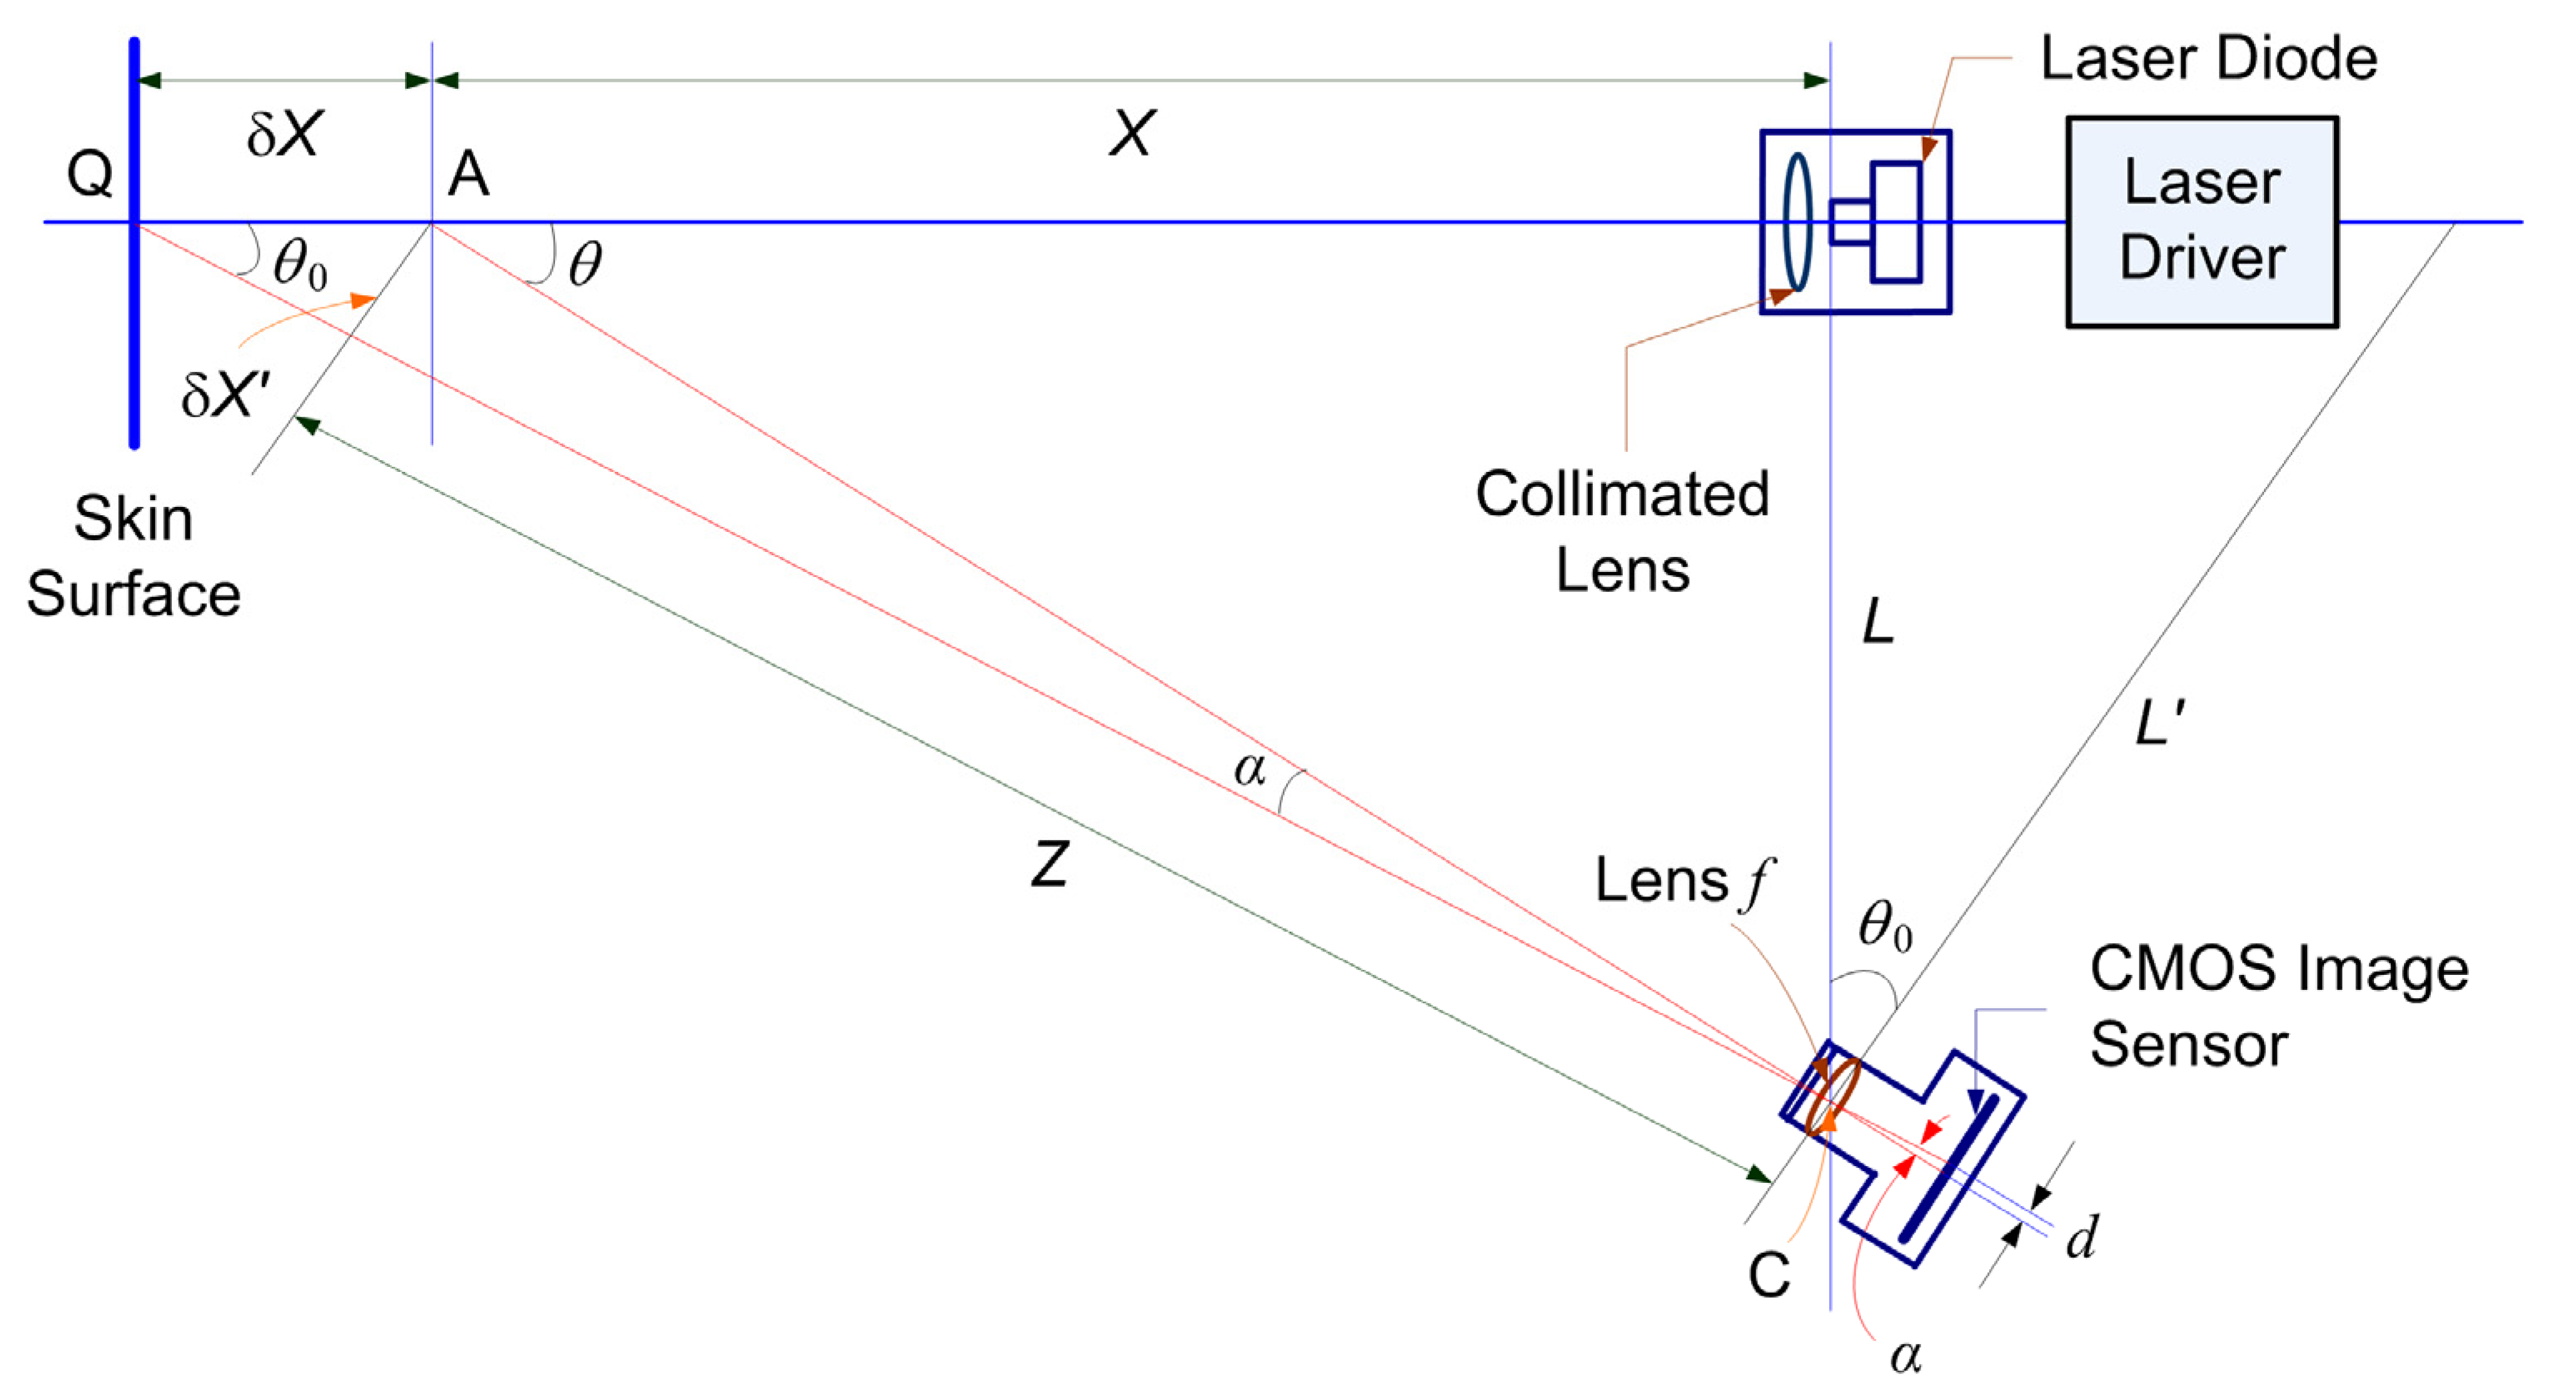
Figure 2.
The actual implementation of the proposed APM system.
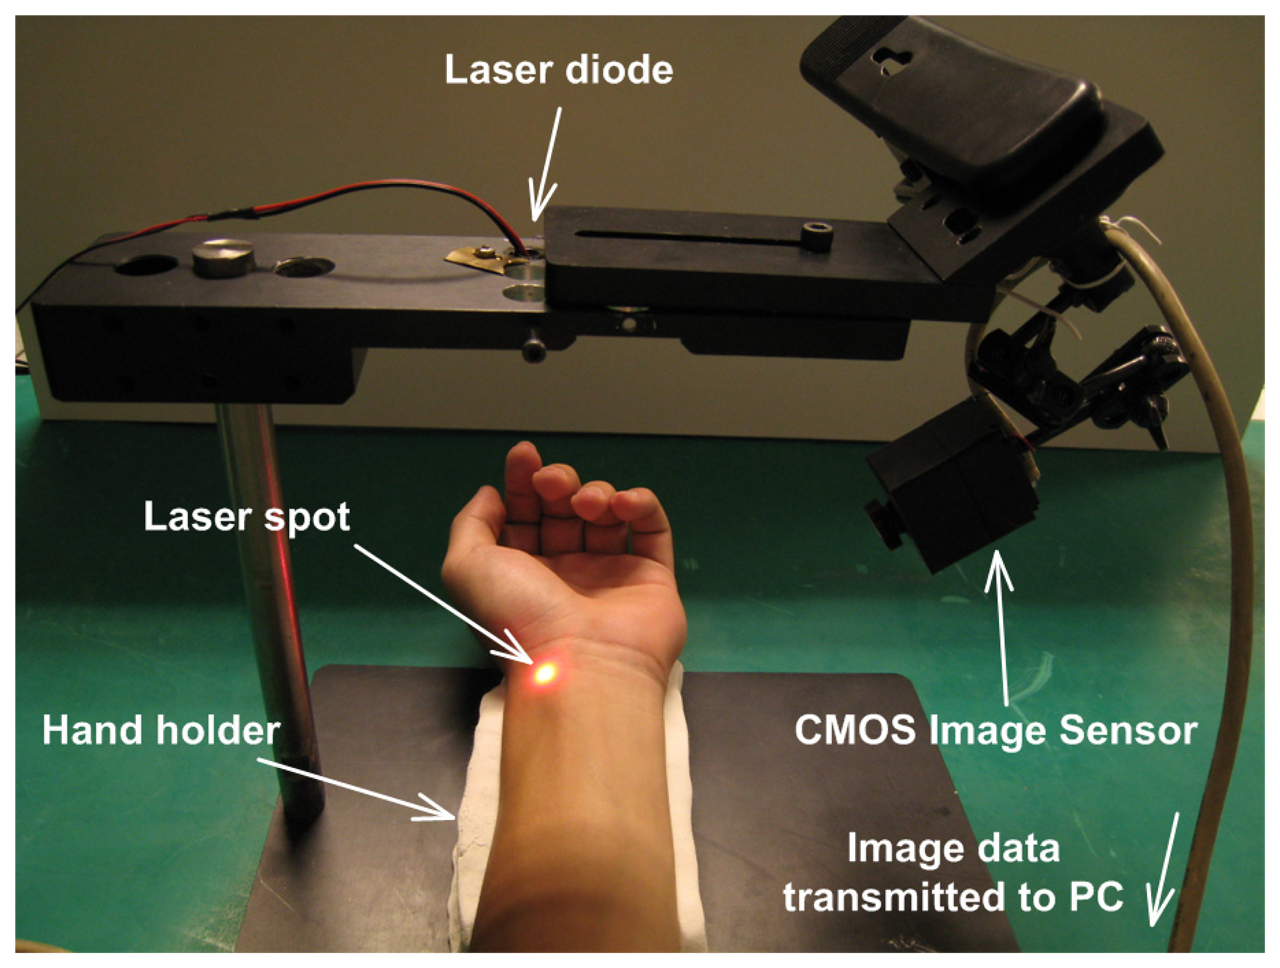
Figure 3.
The contours of laser spots after ET values of the CMOS image sensor were set to: (a) 40 and (b) 1.
Figure 3.
The contours of laser spots after ET values of the CMOS image sensor were set to: (a) 40 and (b) 1.
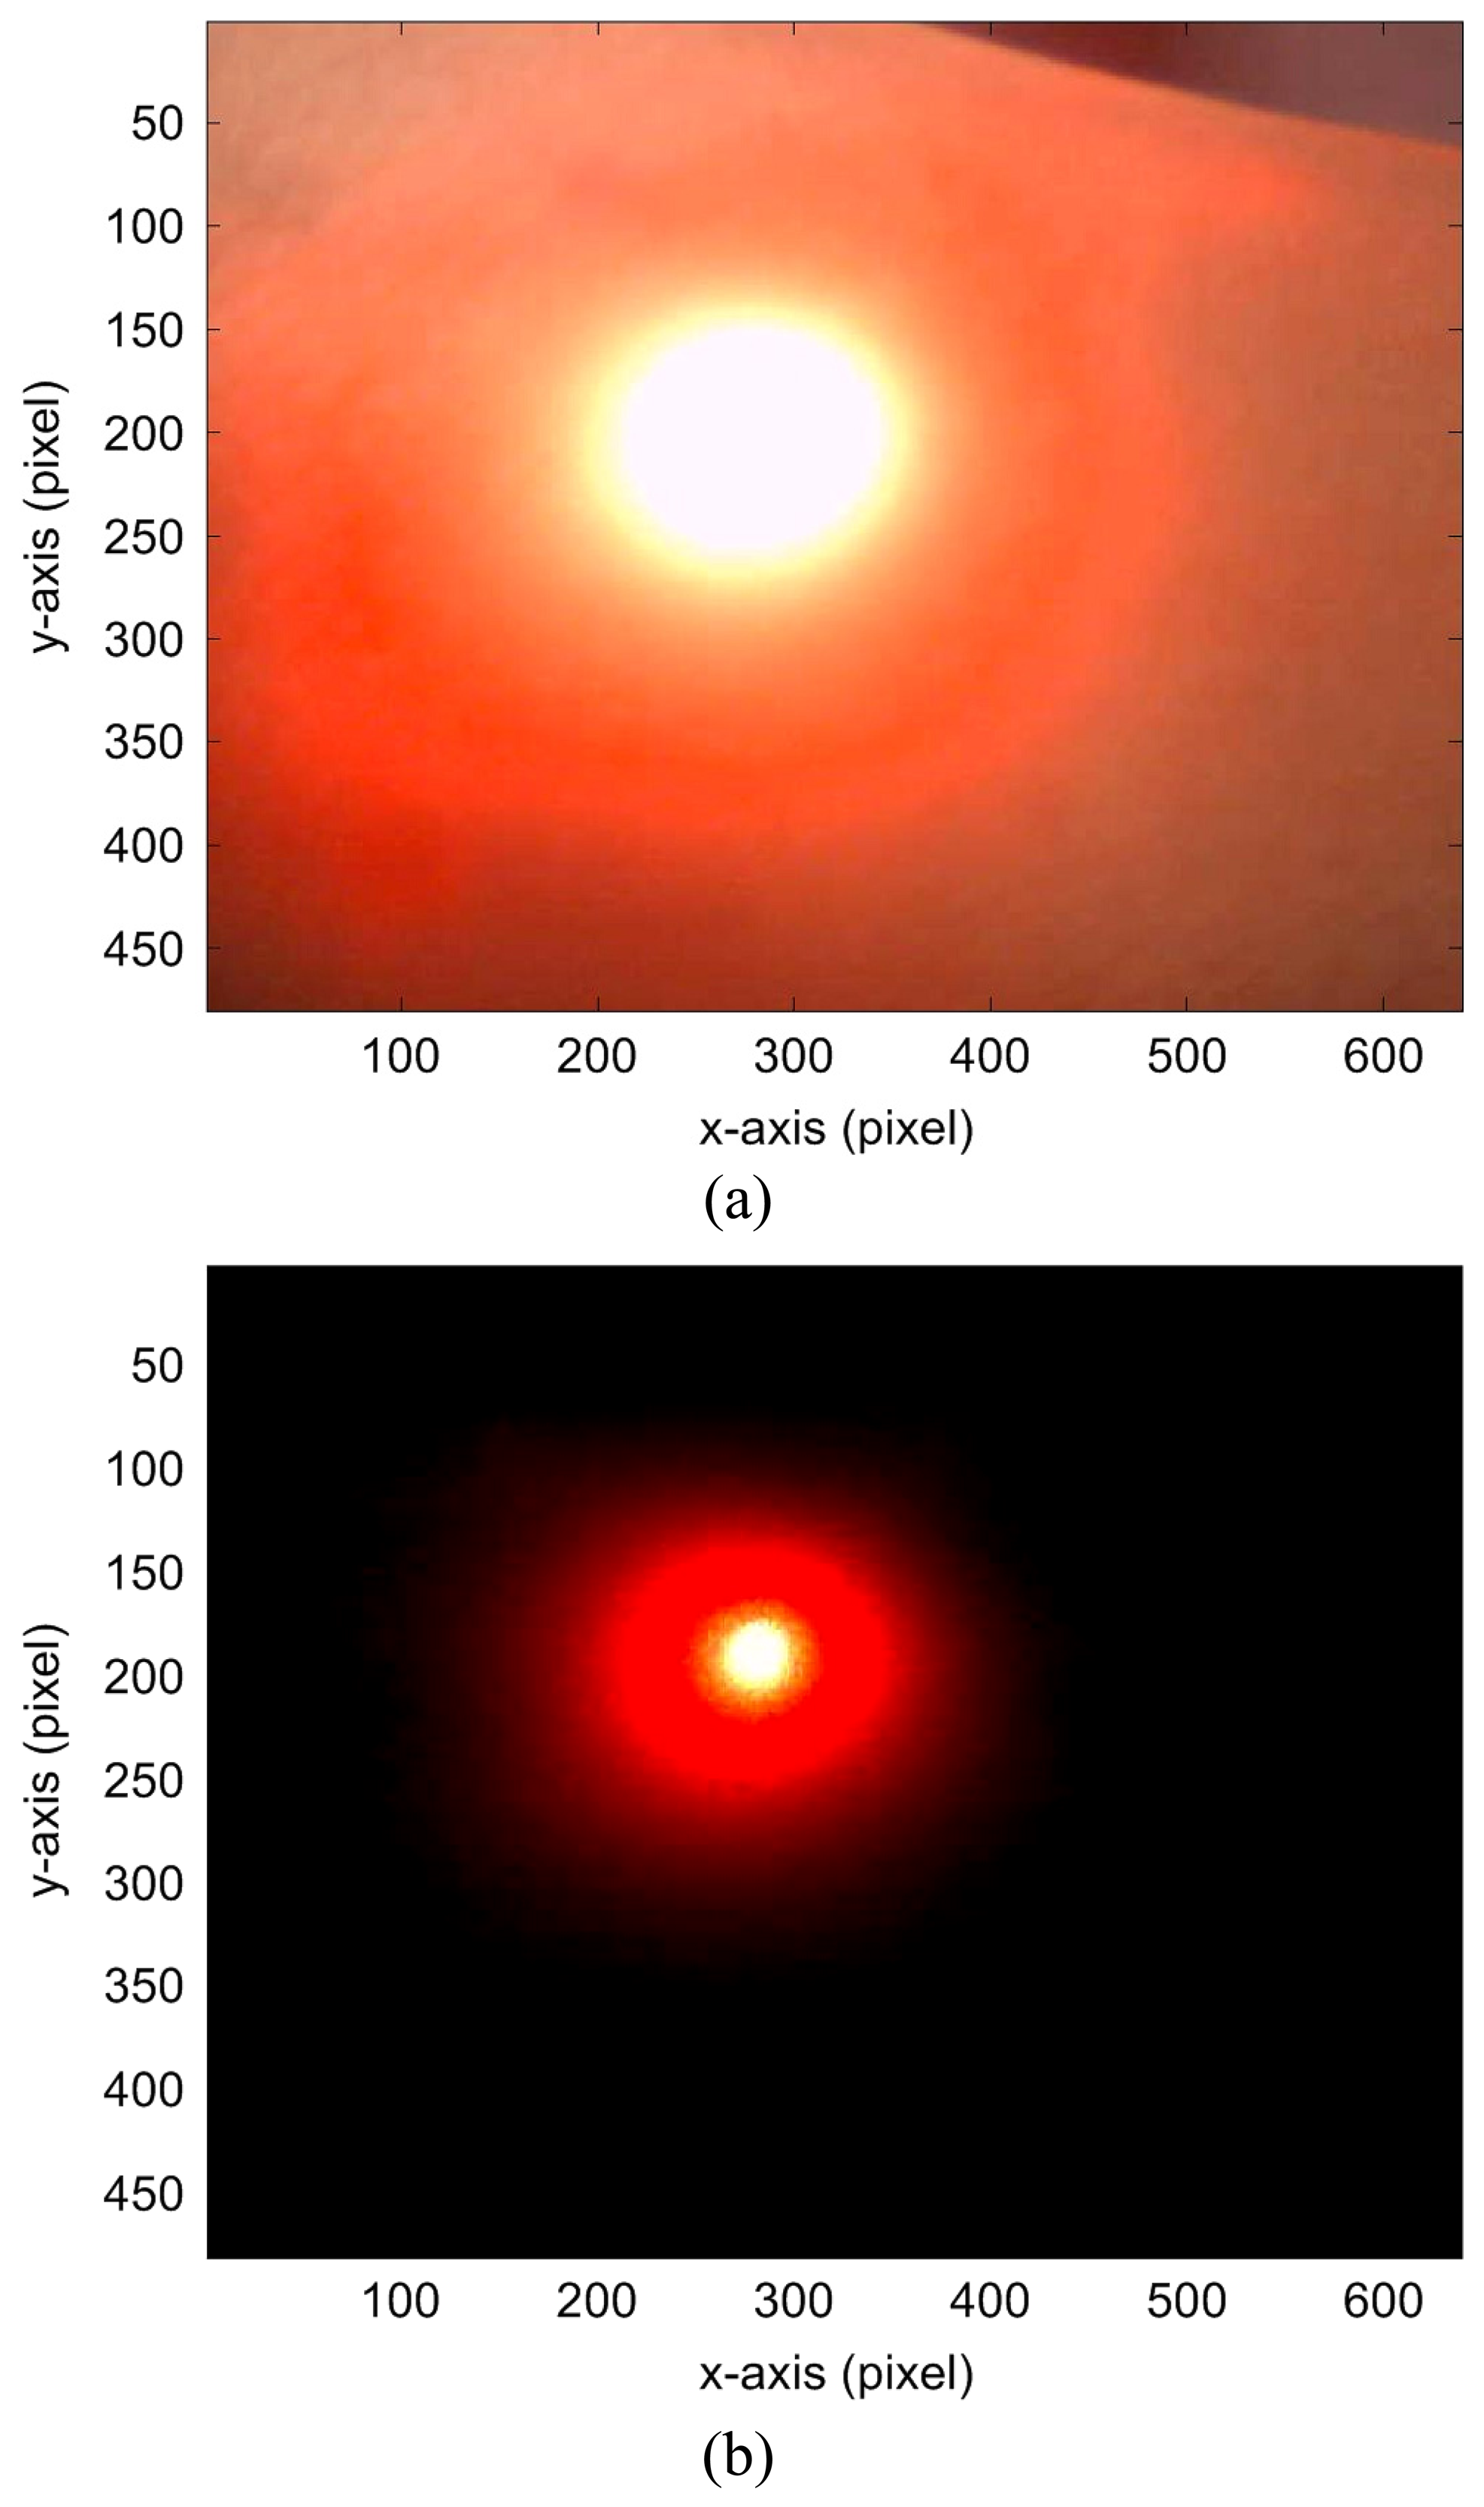
Figure 4.
Signal processing flowchart for the proposed arterial pulse measurement system.

Figure 5.
The schematic drawing of the linearity calibration of the APM system.
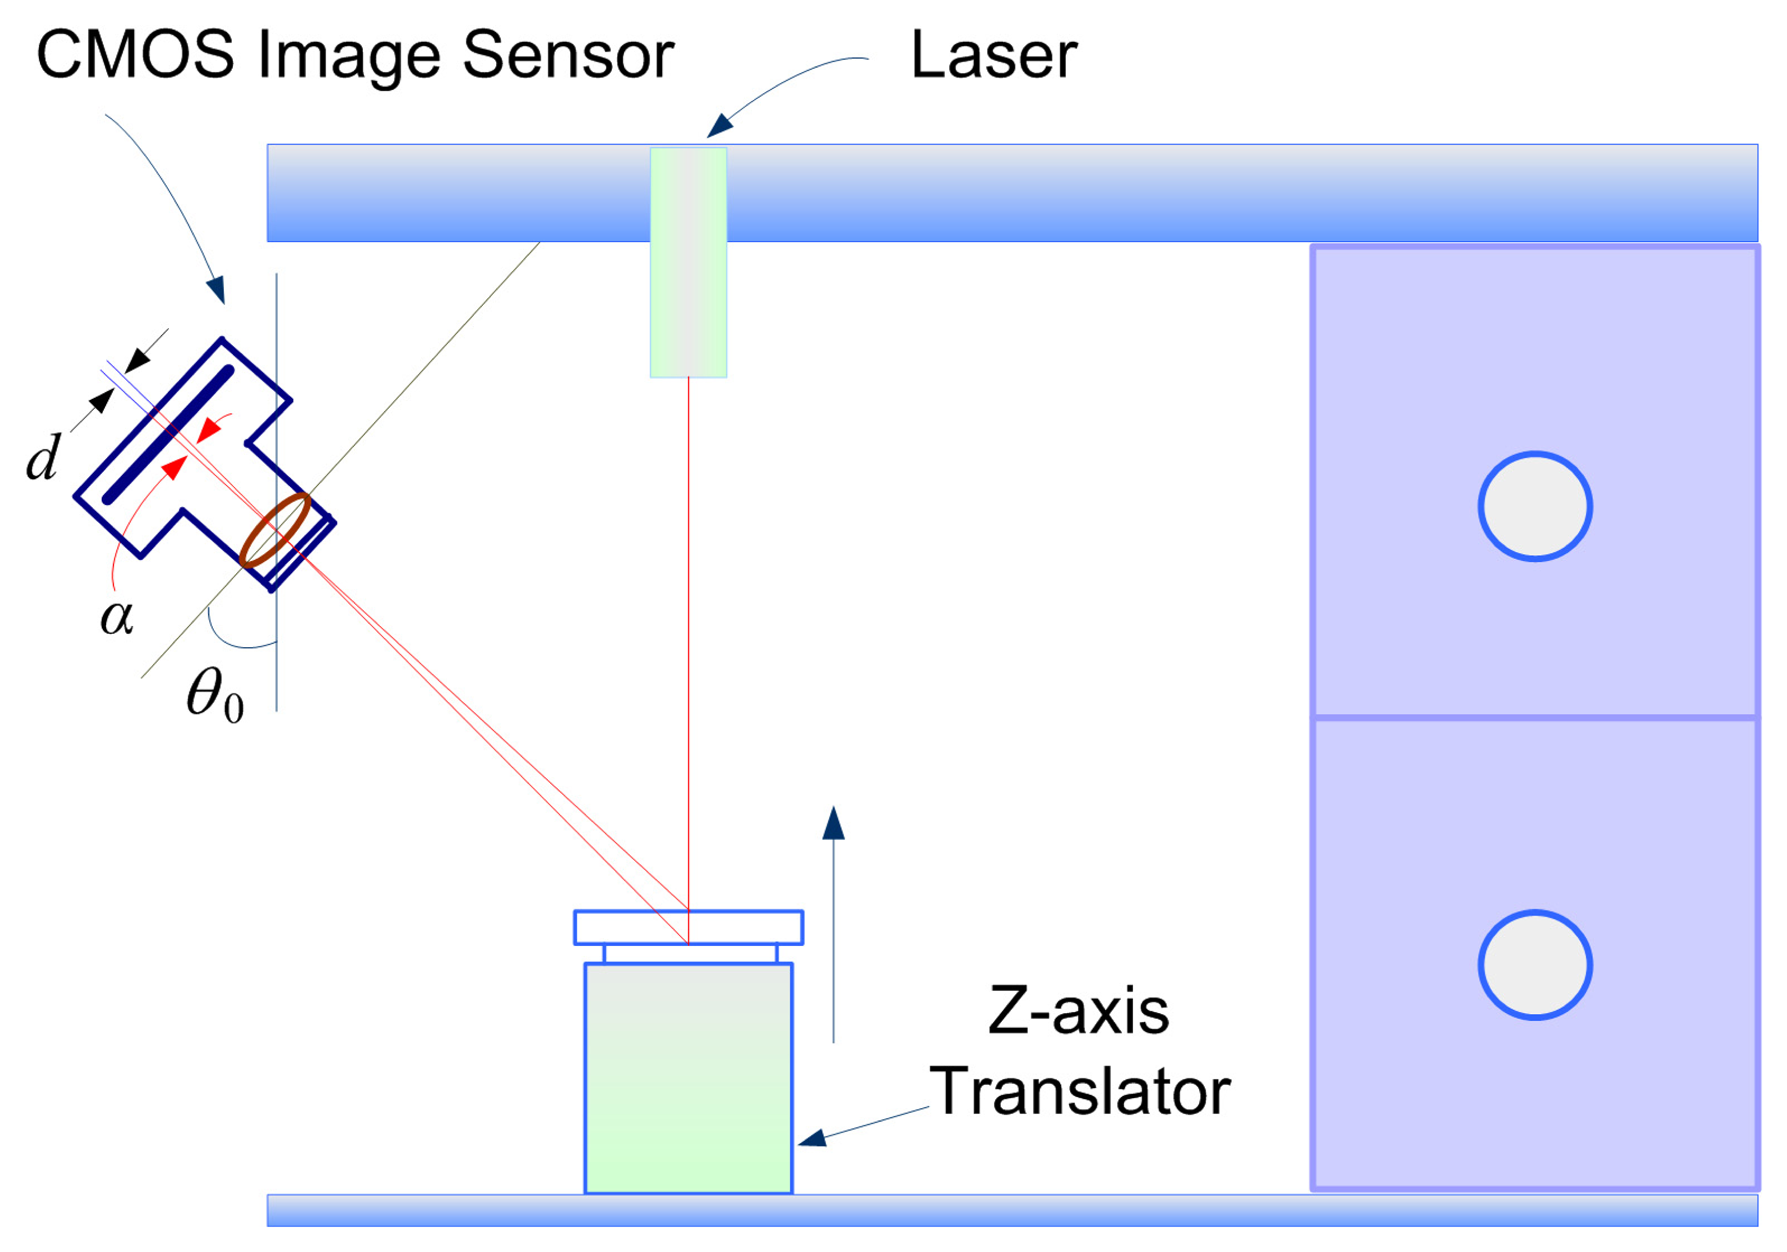
Figure 6.
Calibration for the pulsation amplitude measurement of the proposed APM system: (a) the results for linearity calibration experiments and (b) the one standard deviation of amplitude calibration experiments.
Figure 6.
Calibration for the pulsation amplitude measurement of the proposed APM system: (a) the results for linearity calibration experiments and (b) the one standard deviation of amplitude calibration experiments.
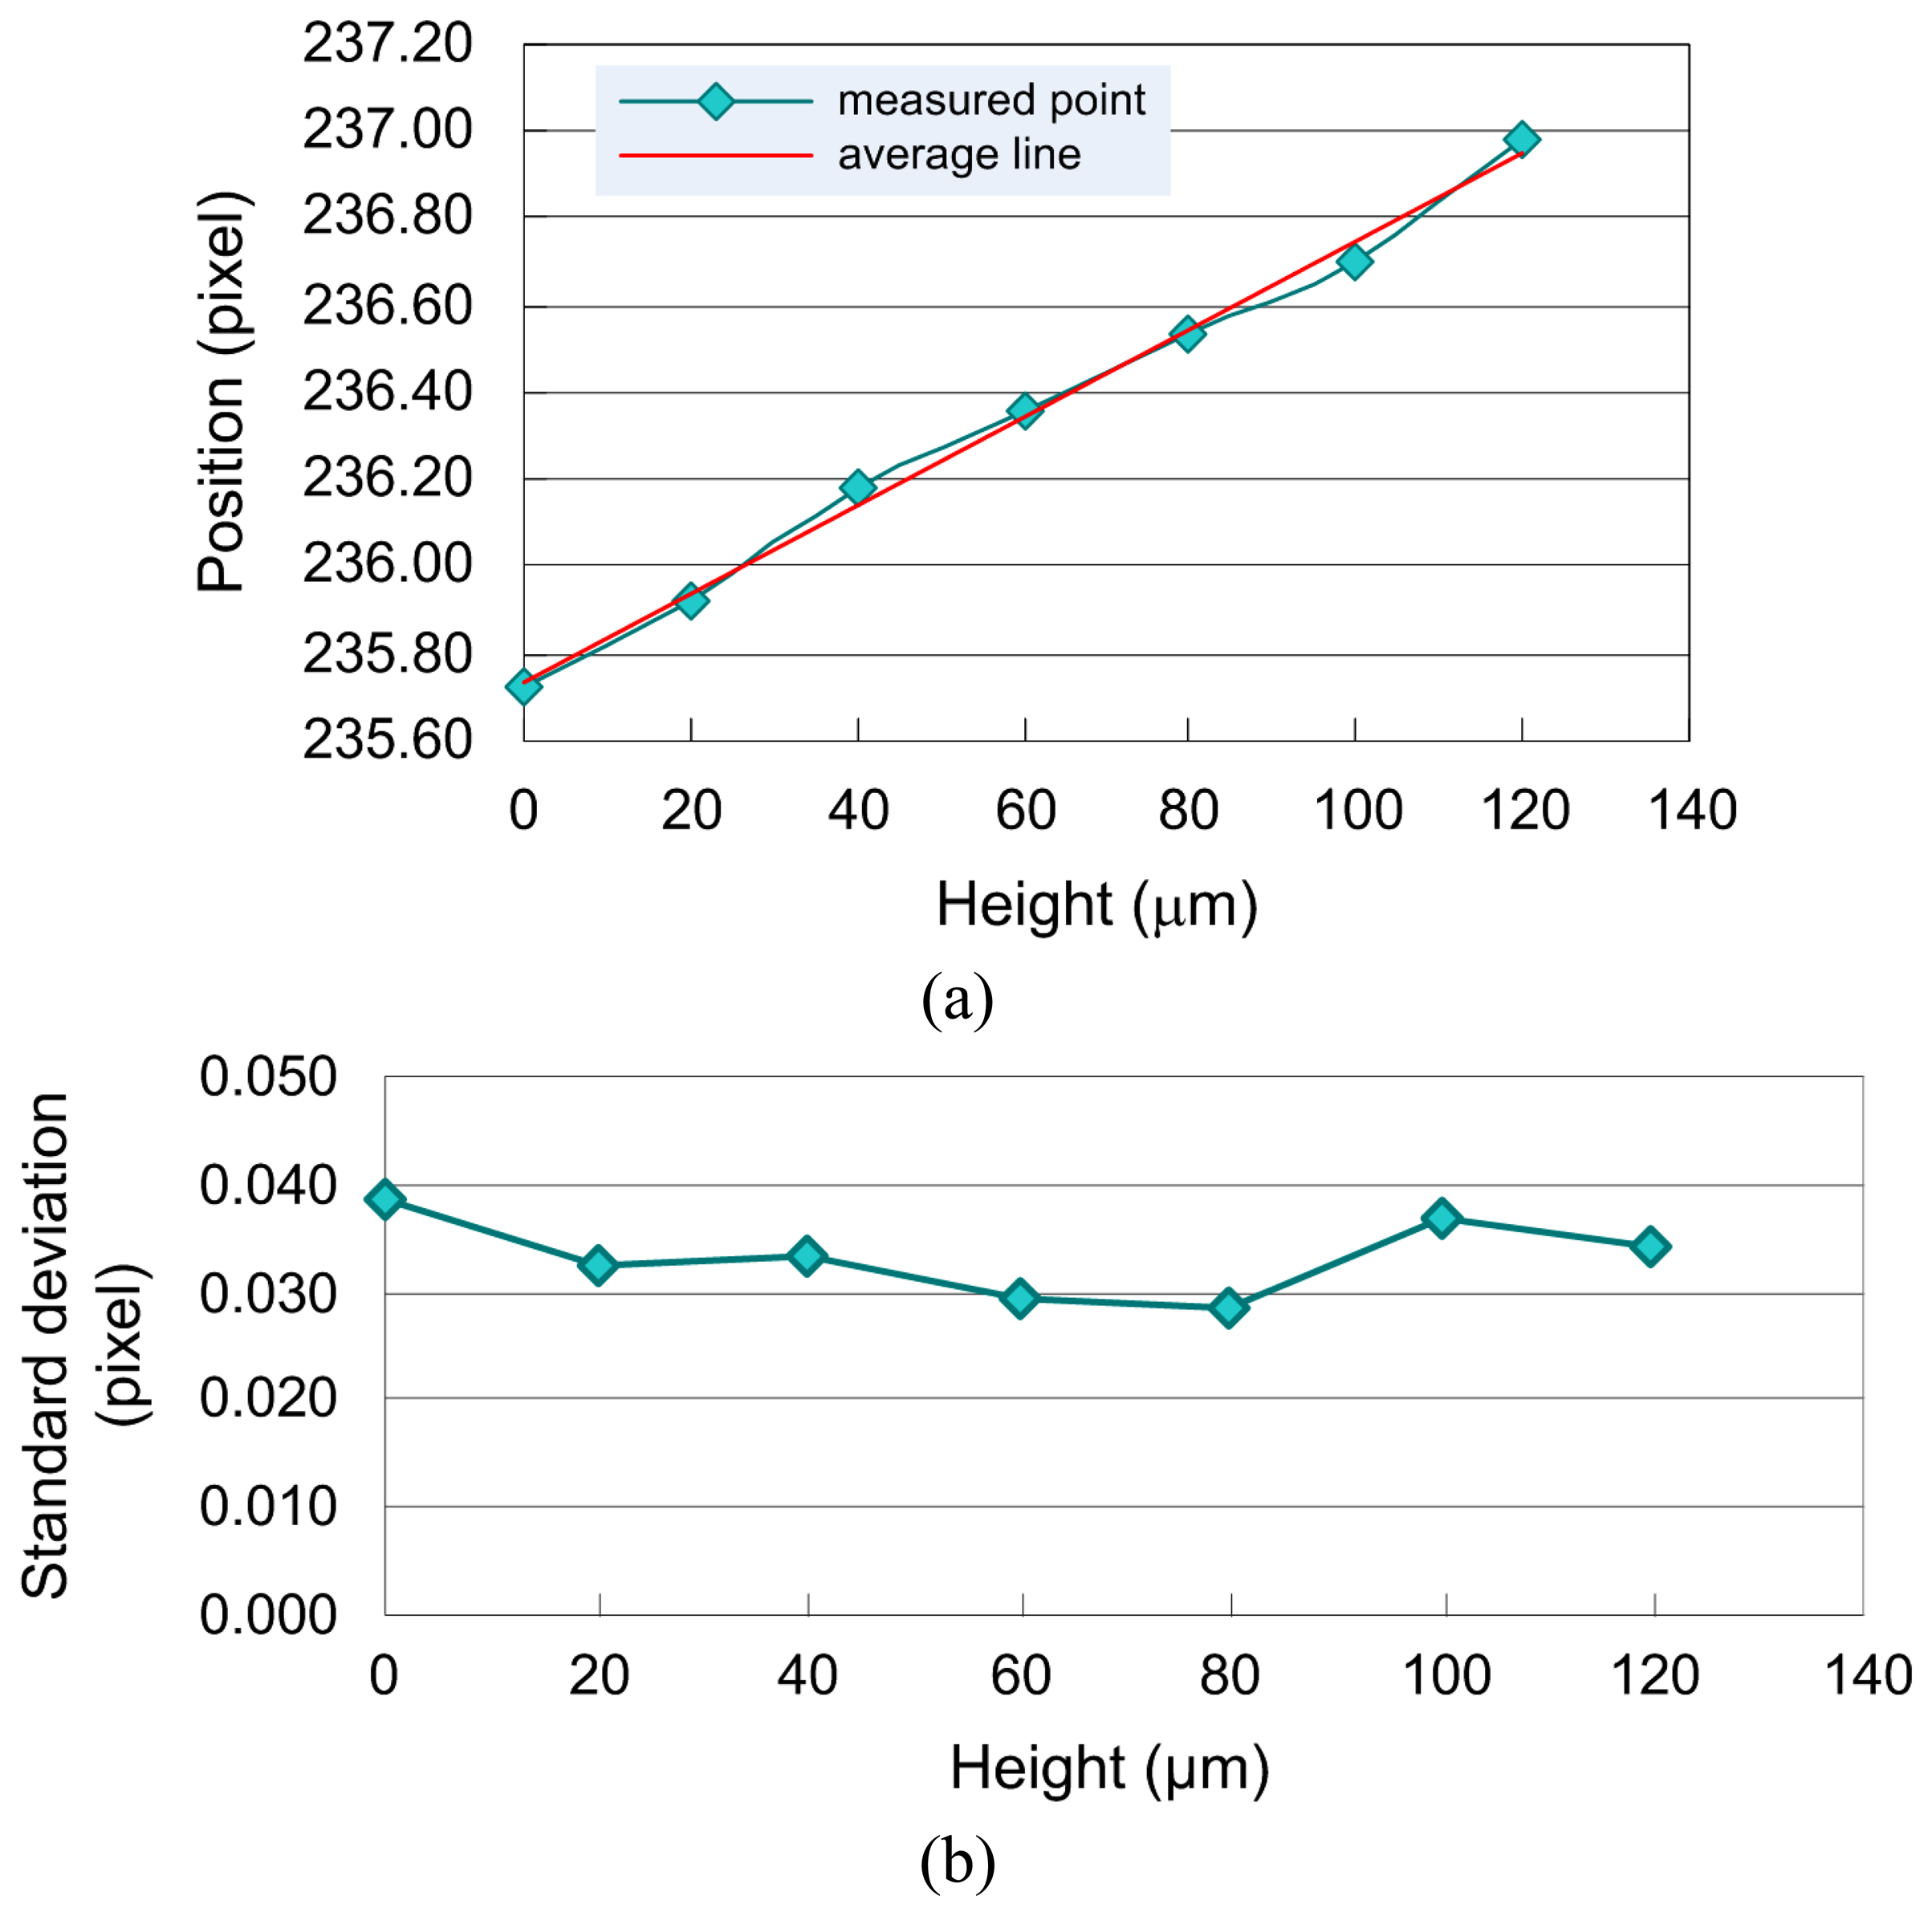
Figure 7.
The schematic drawing of the frequency calibration of the APM system.
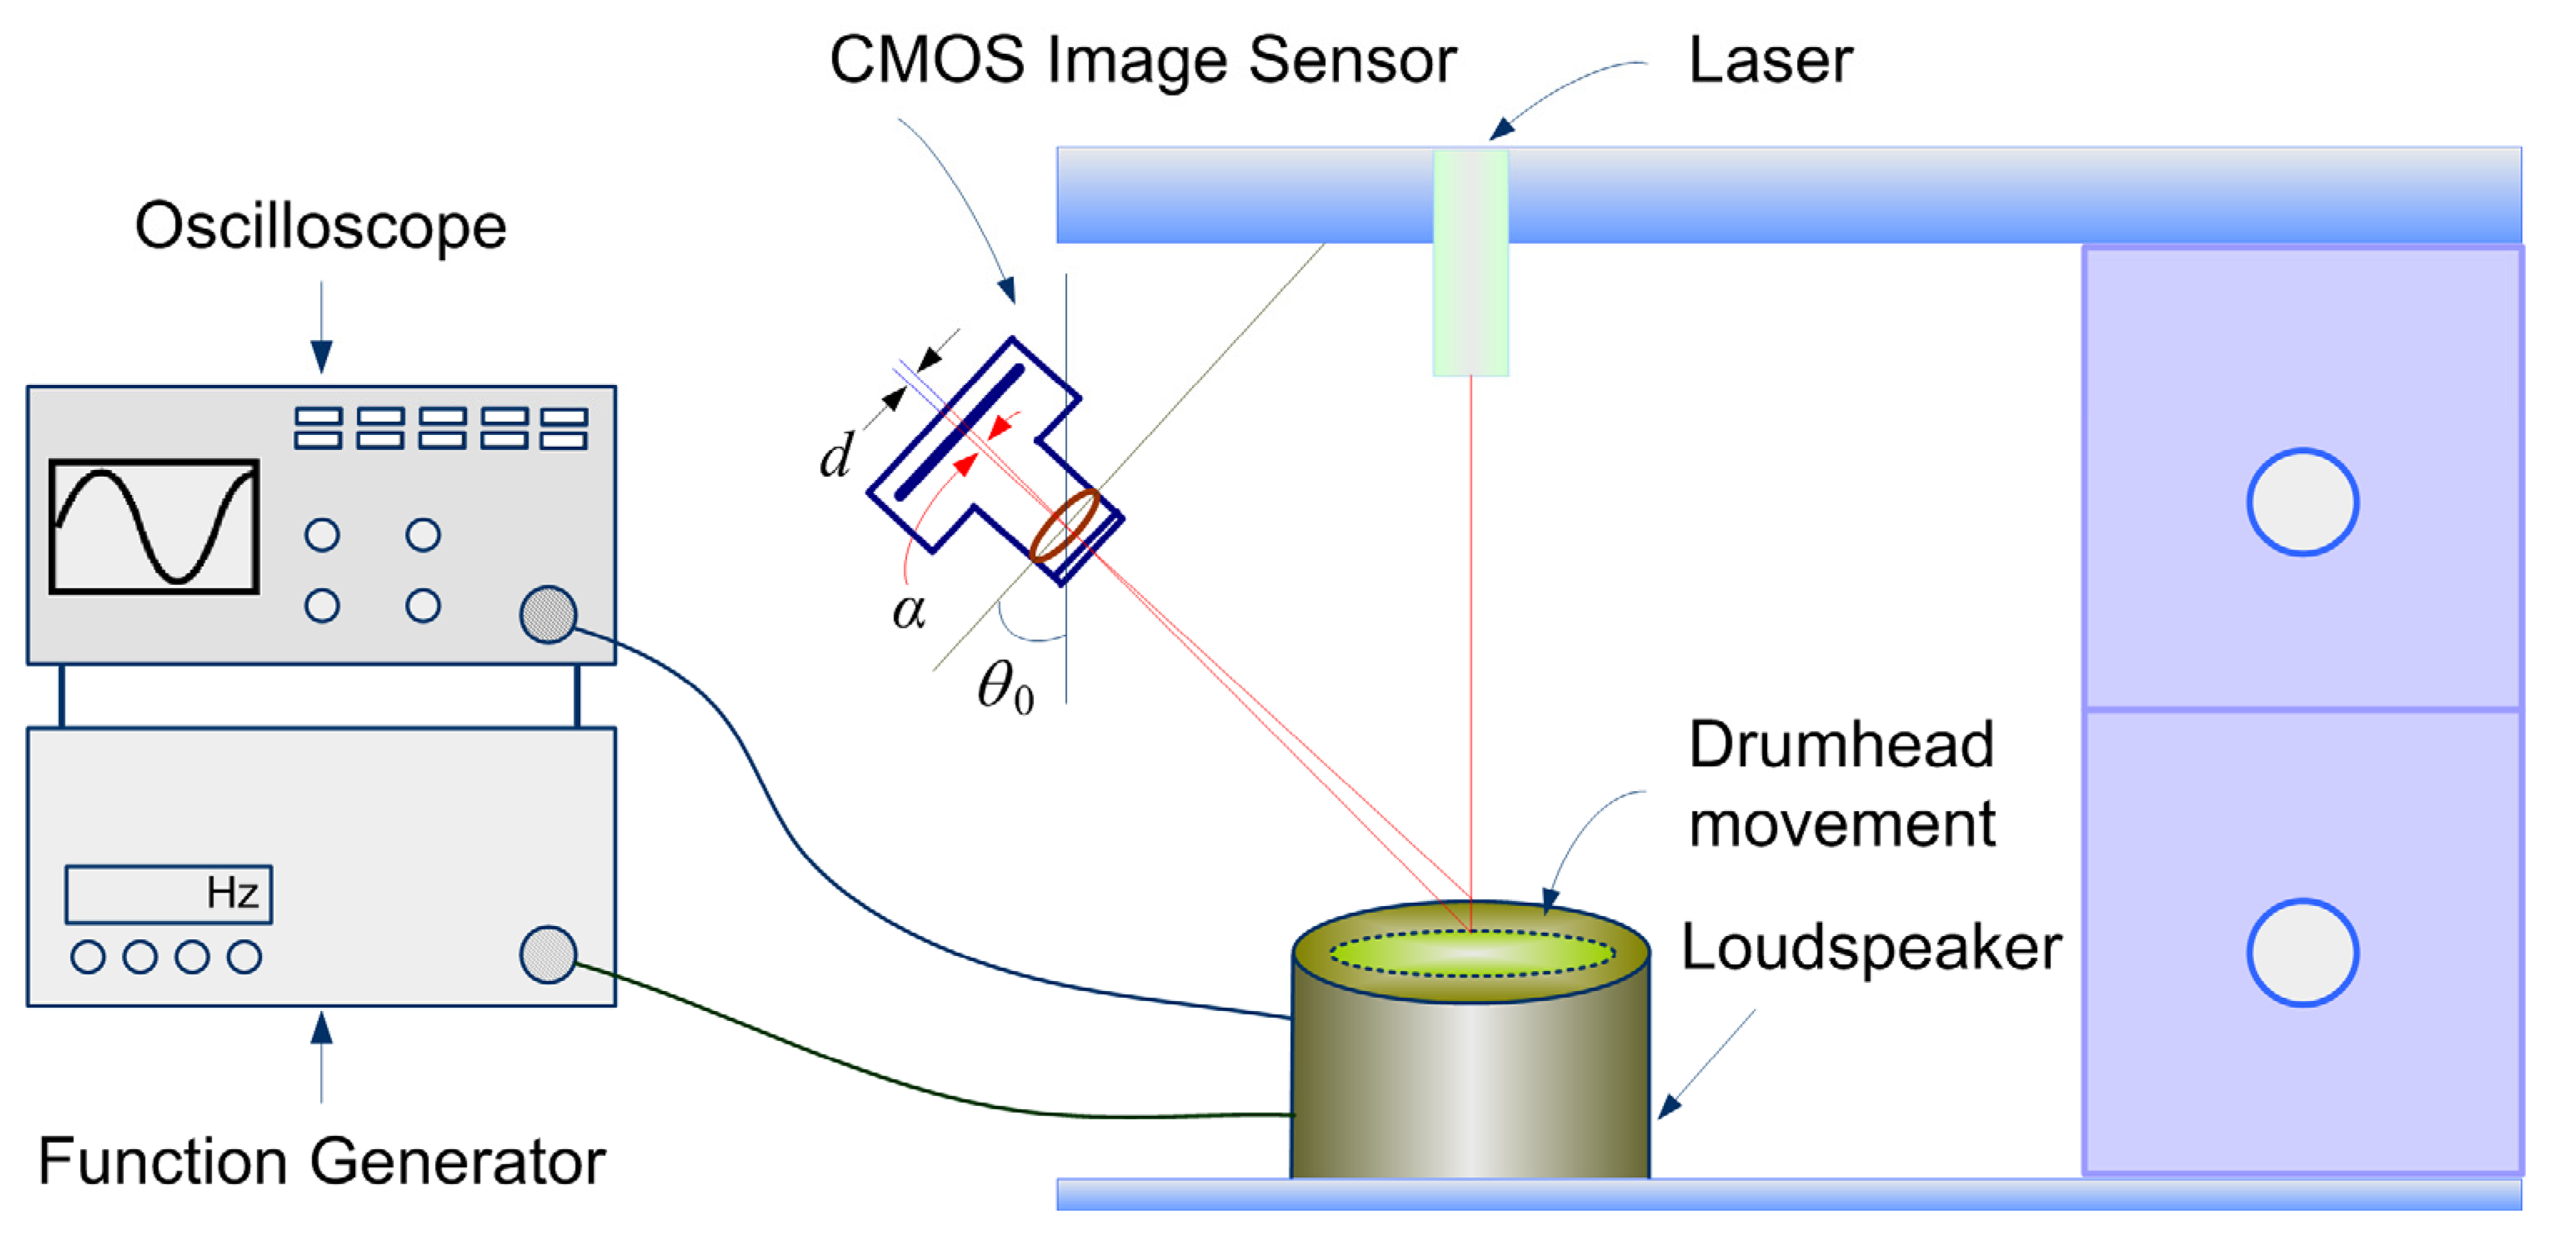
Figure 8.
Frequency calibration of the APM system: (a) the spot variation versus time (time domain) and (b) the frequency spectrum analysis of the data in (a) using FFT method.
Figure 8.
Frequency calibration of the APM system: (a) the spot variation versus time (time domain) and (b) the frequency spectrum analysis of the data in (a) using FFT method.
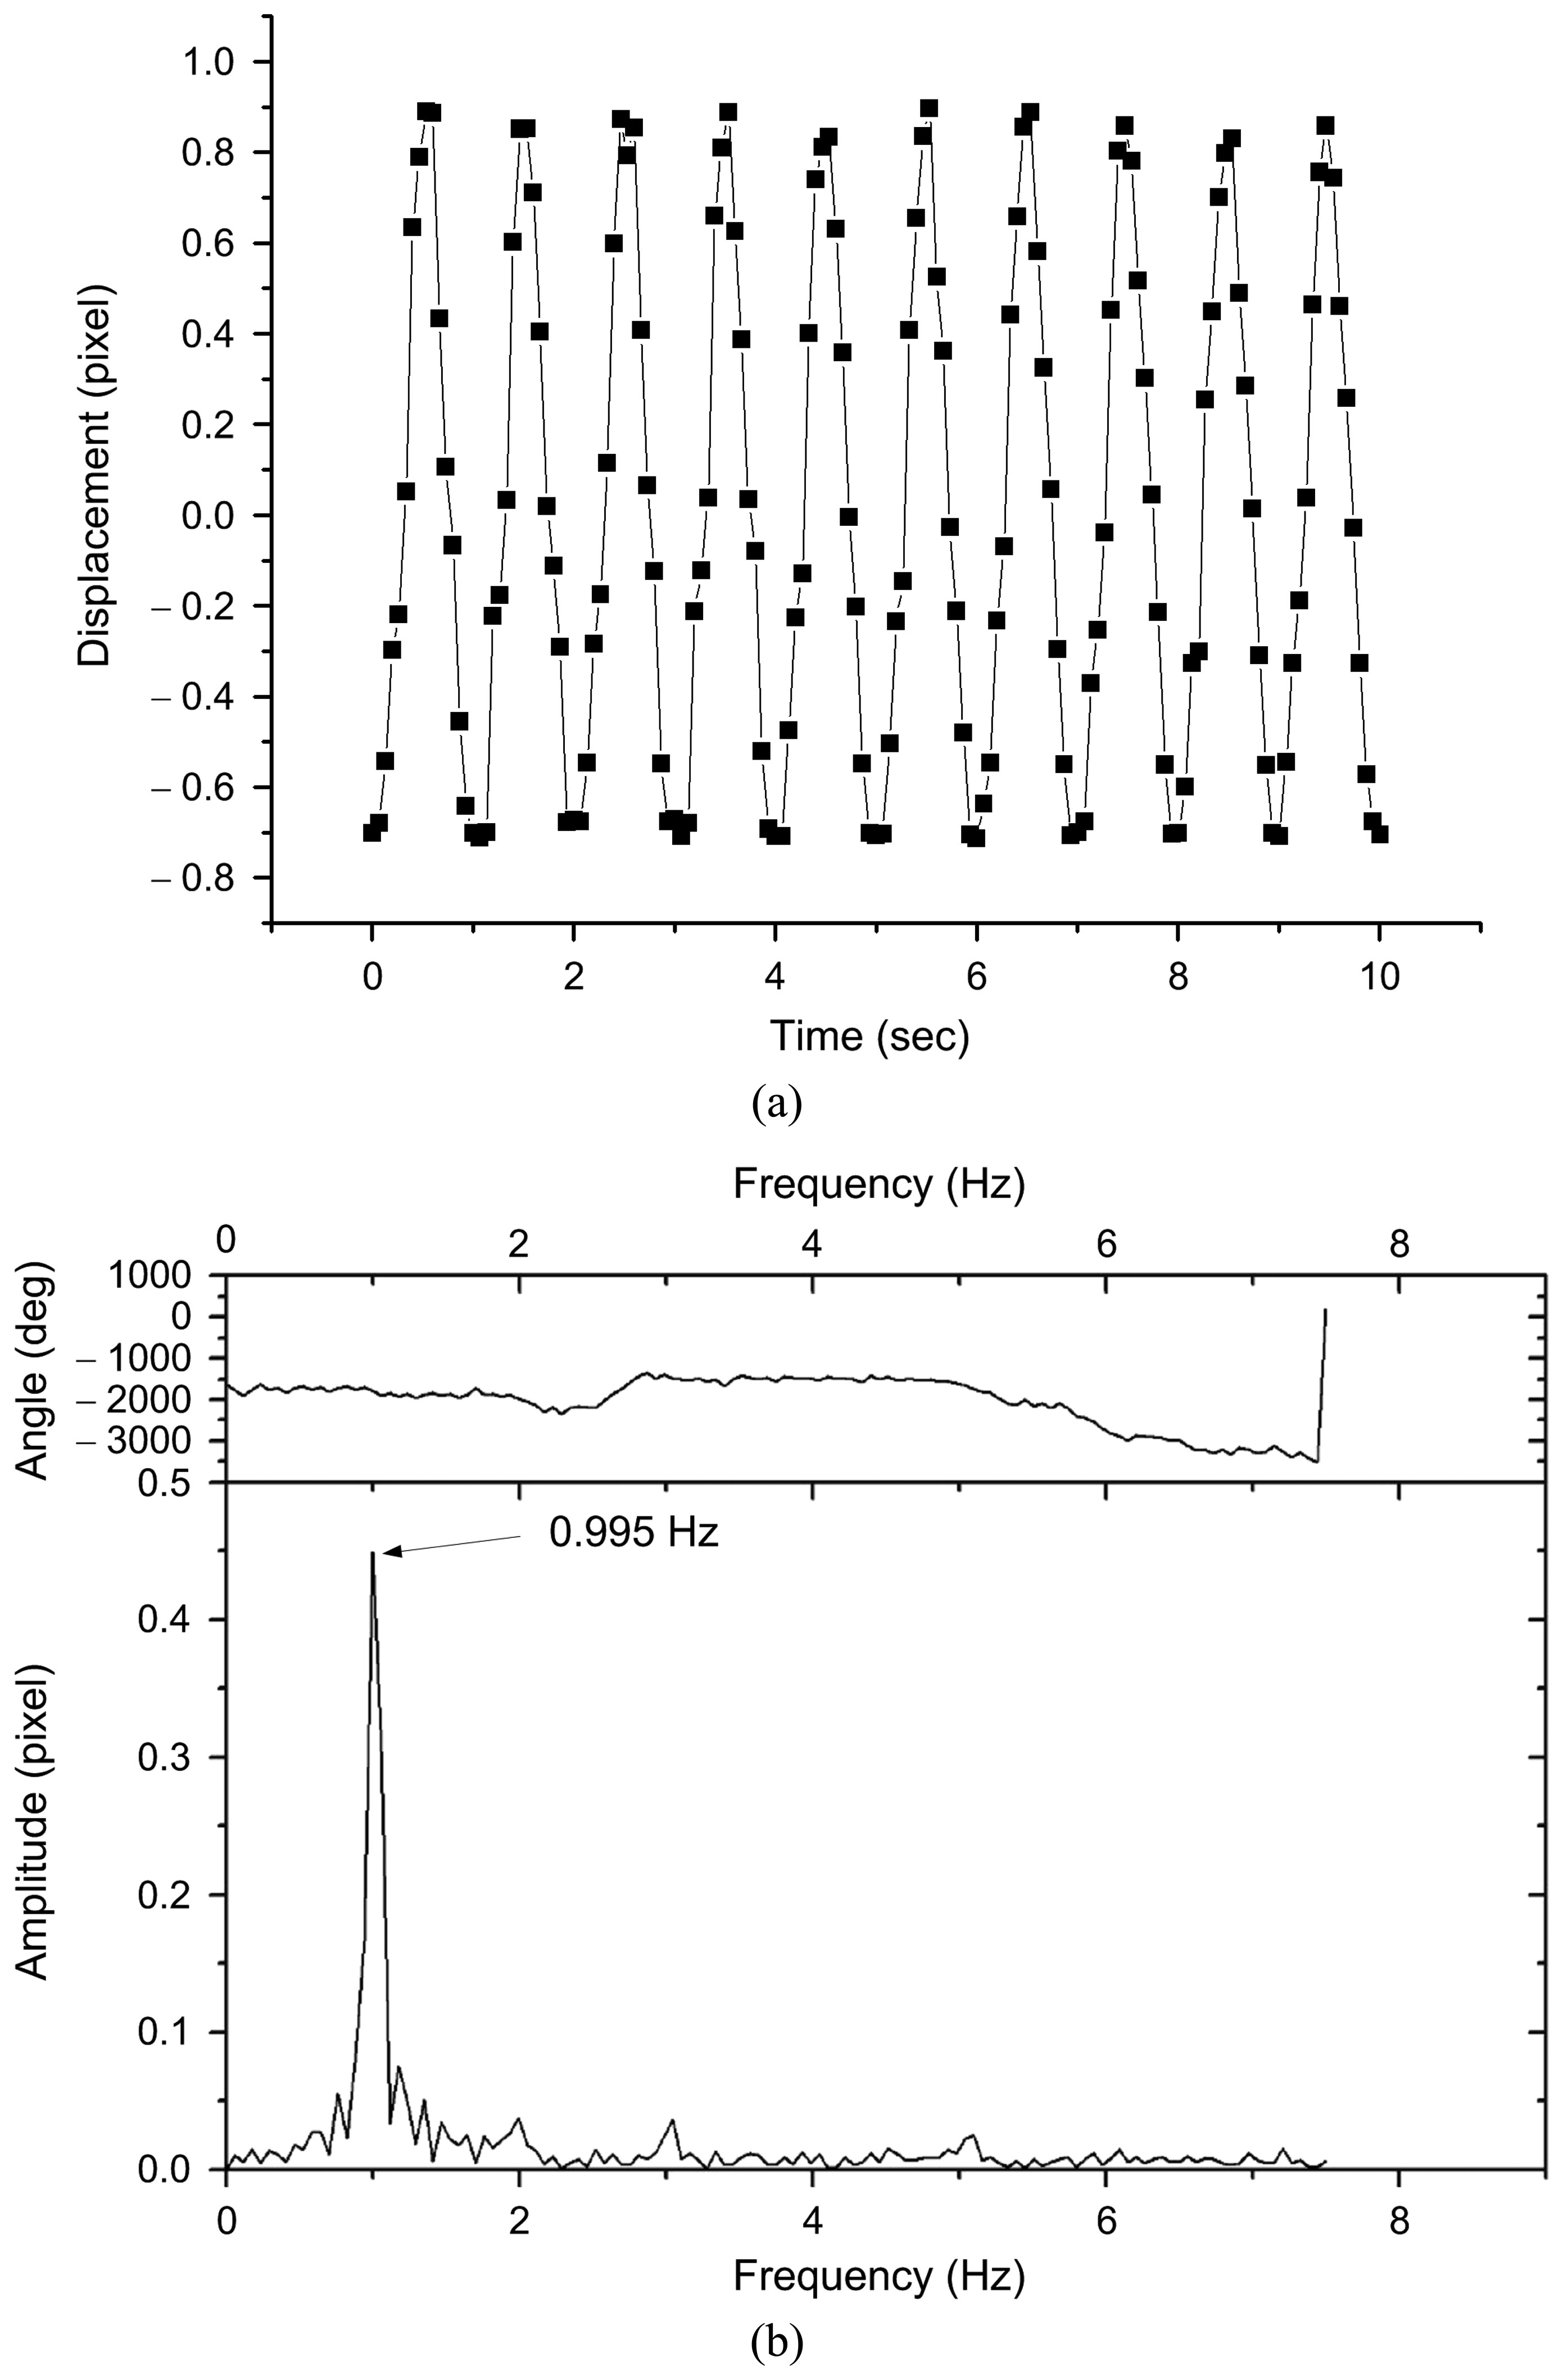
Figure 9.
Laser spot centers measured by APM system: (a) the original data of centroid variation of laser spot center and (b) the data after enlarged amplitude scale and with filtering.
Figure 9.
Laser spot centers measured by APM system: (a) the original data of centroid variation of laser spot center and (b) the data after enlarged amplitude scale and with filtering.

Figure 10.
Full spectrum analysis of the data in Figure 9: (a) the results of without using filter and (b) the results of using filter.
Figure 10.
Full spectrum analysis of the data in Figure 9: (a) the results of without using filter and (b) the results of using filter.

Figure 11.
Illustration of palpation positions for pulse diagnosis used in traditional Chinese medicine.
Figure 11.
Illustration of palpation positions for pulse diagnosis used in traditional Chinese medicine.
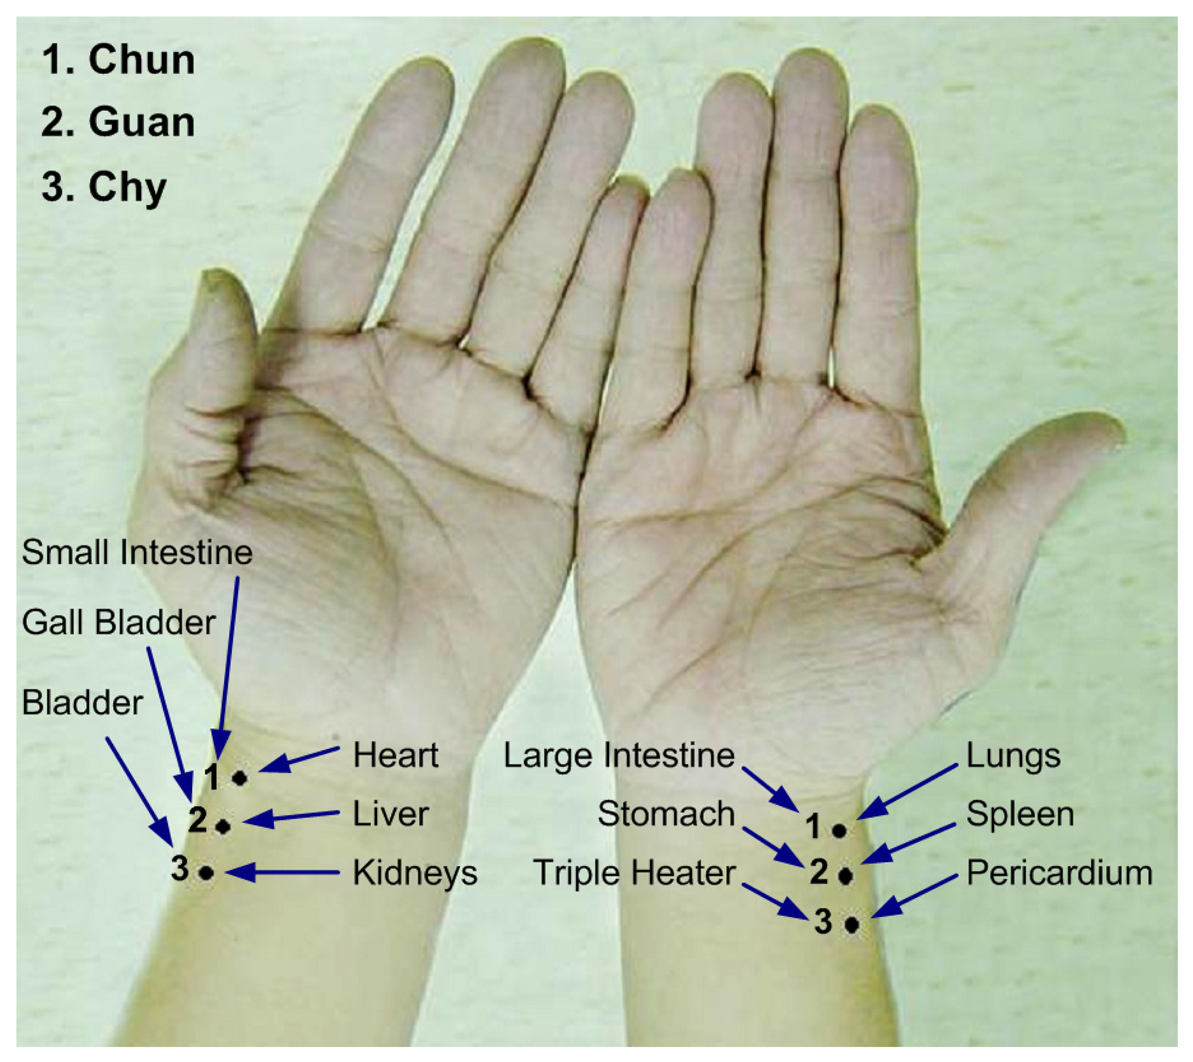
Figure 12.
Pulse information measured at the Chun point on the left hand (small intestine) of the tested subject: (a) 30 min before a meal, (b) 30 min after a meal.
Figure 12.
Pulse information measured at the Chun point on the left hand (small intestine) of the tested subject: (a) 30 min before a meal, (b) 30 min after a meal.

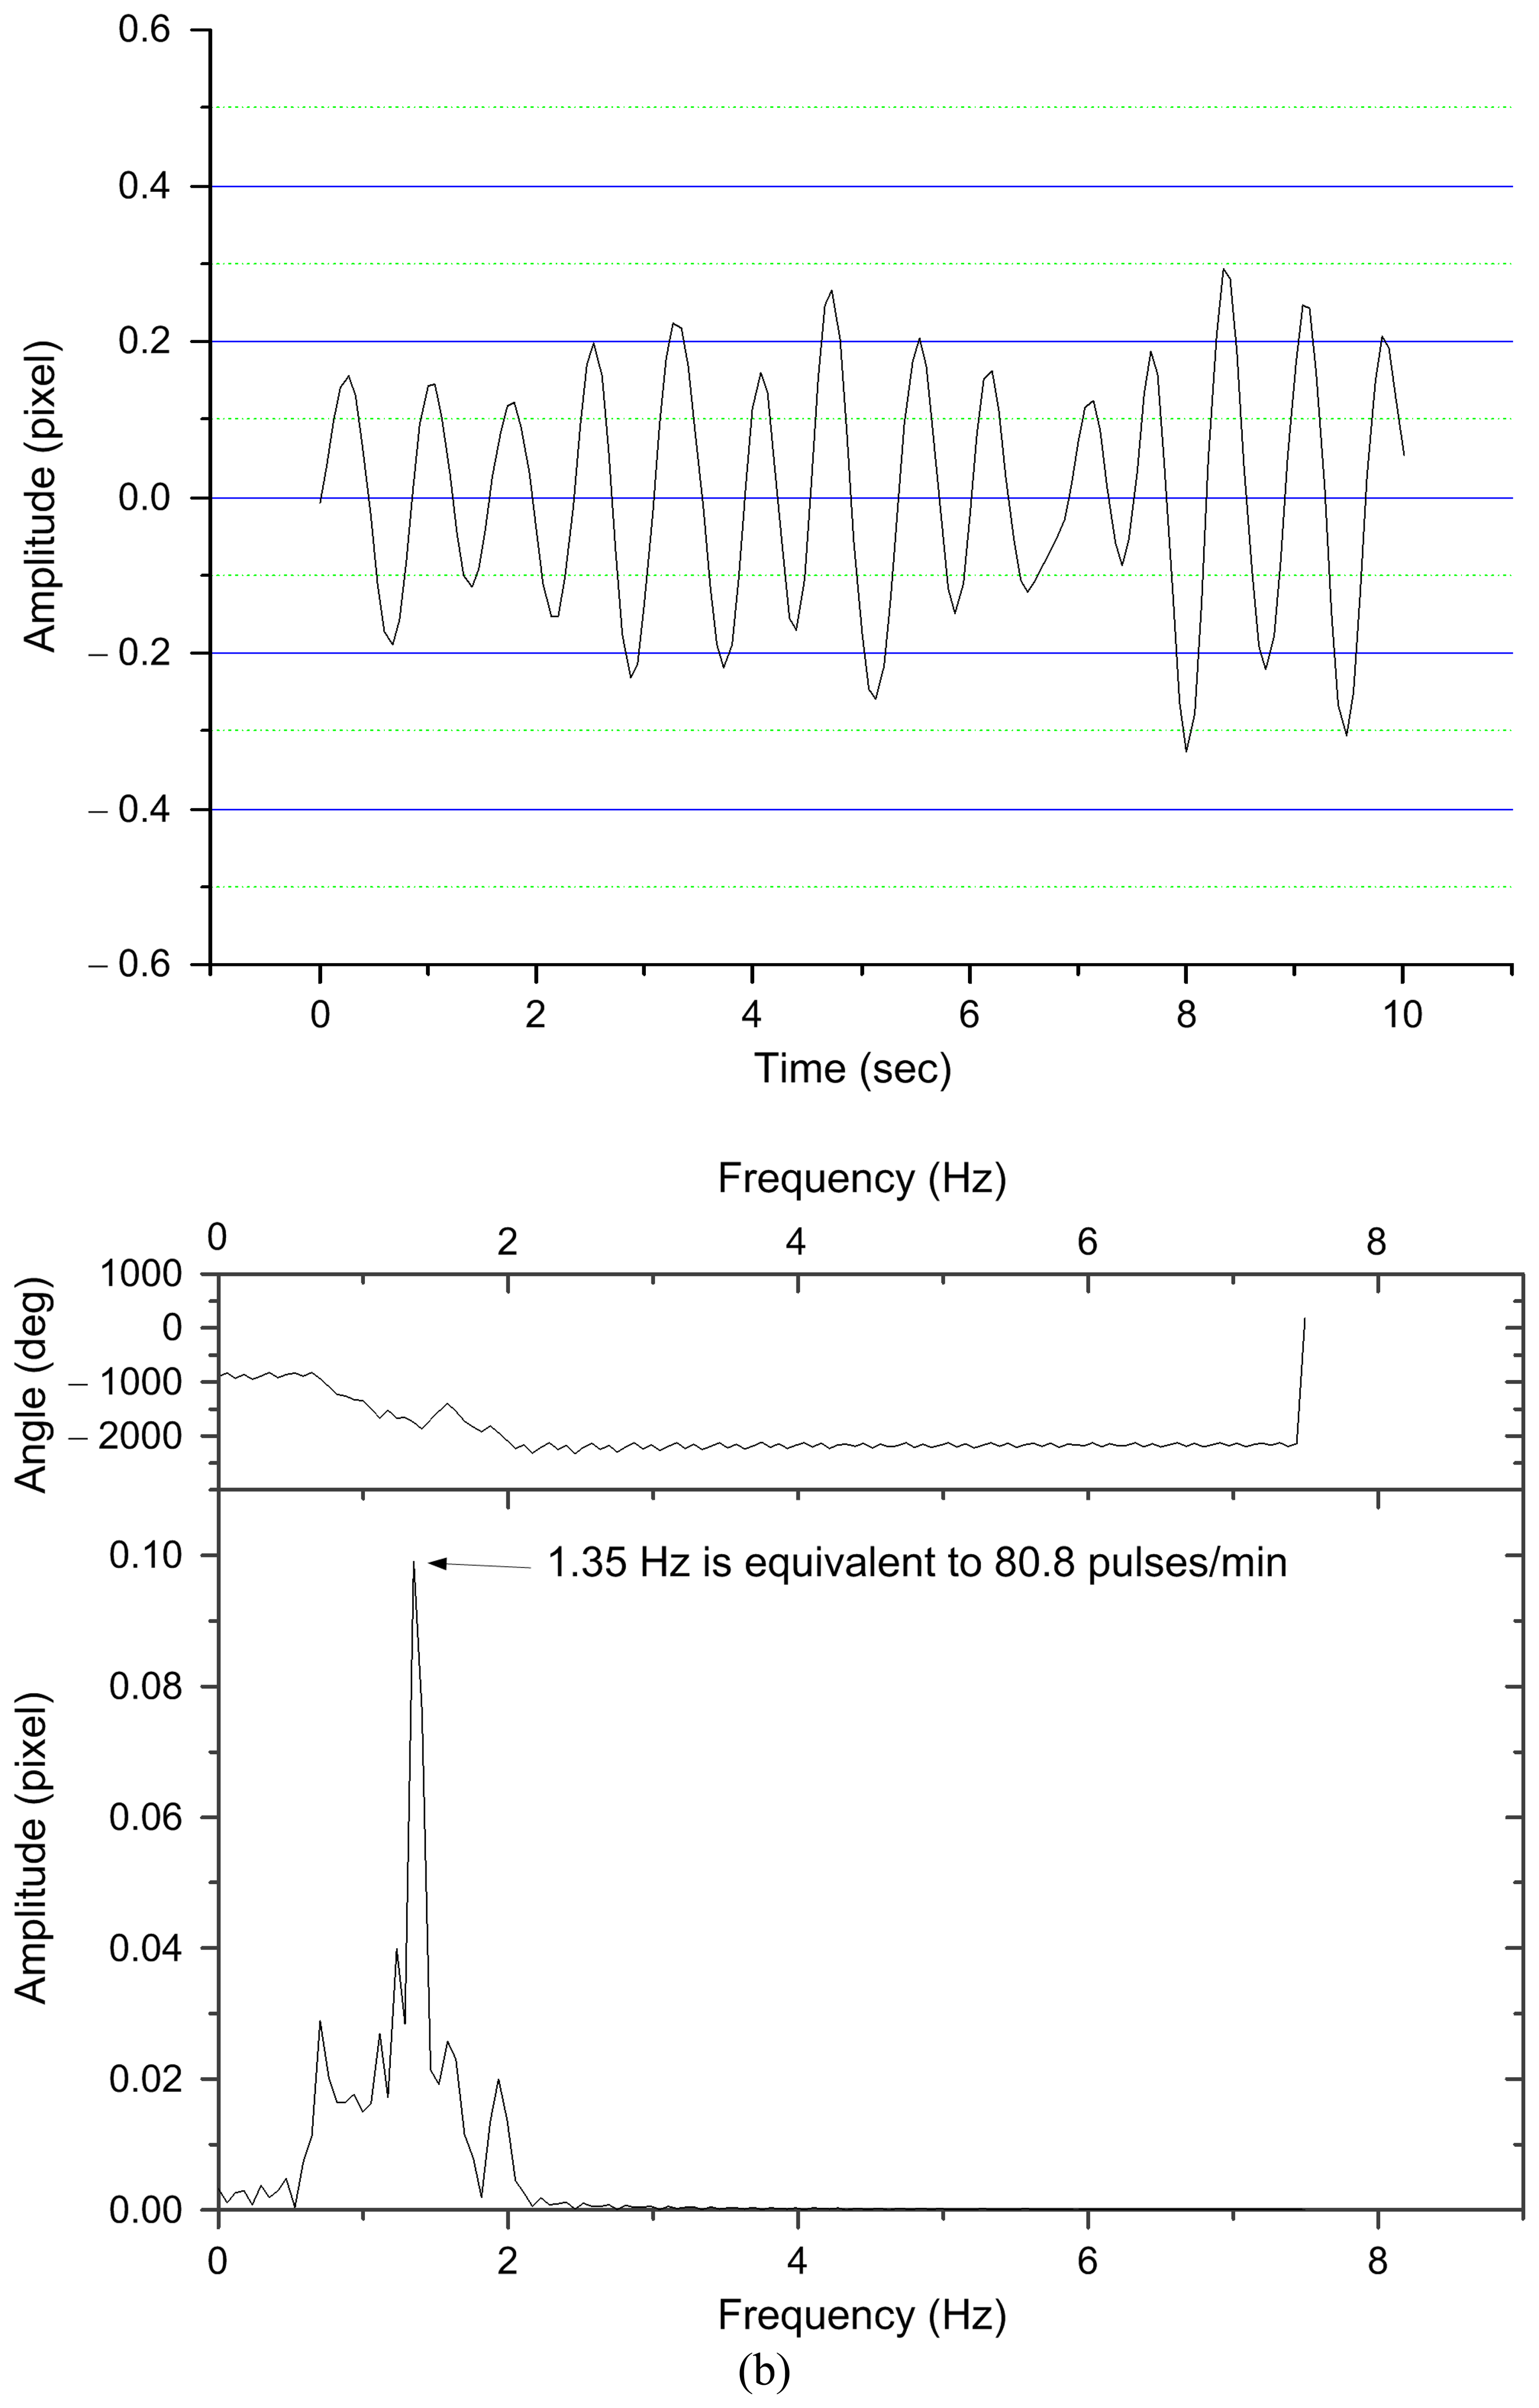
Figure 13.
Pulse information for the Guan point on the left hand (liver) of the tested subject: (a) before staying up late, (b) after staying up late.
Figure 13.
Pulse information for the Guan point on the left hand (liver) of the tested subject: (a) before staying up late, (b) after staying up late.


Table 1.
Frequency calibration of the APM system from 0.6 – 2.0 Hz with a function generator and a loudspeaker.
| Standard frequency (Hz) | Frequency obtained from the APM system | Error (%) |
|---|---|---|
| 0.6 | 0.585 | 2.5 |
| 0.7 | 0.703 | 0.4 |
| 0.8 | 0.820 | 2.5 |
| 0.9 | 0.879 | 2.3 |
| 1.0 | 0.995 | 0.4 |
| 1.1 | 1.113 | 1.2 |
| 1.2 | 1.230 | 2.5 |
| 1.3 | 1.288 | 0.9 |
| 1.4 | 1.406 | 0.4 |
| 1.5 | 1.523 | 1.5 |
| 1.6 | 1.581 | 1.2 |
| 1.7 | 1.698 | 0.2 |
| 1.8 | 1.816 | 0.9 |
| 1.9 | 1.874 | 1.4 |
| 2.0 | 1.991 | 0.4 |
Table 2.
Comparison of the frequency measurements made by the APM system and a blood pressure monitor (Model No.: OS-512, OSIM, Inc.).
| Volunteer No. | OSIM OS-512 (pulse rate) | APM system (pulse rate) | Error (%) |
|---|---|---|---|
| 1 | 69 | 68 | −1.4 |
| 2 | 76 | 77 | 1.3 |
| 3 | 75 | 76 | 1.3 |
| 4 | 84 | 86 | 2.4 |
| 5 | 90 | 92 | 2.2 |
| 6 | 82 | 81 | −1.2 |
| 7 | 78 | 78 | 0.0 |
| 8 | 72 | 74 | 2.8 |
| 9 | 94 | 96 | 2.1 |
| 10 | 78 | 78 | 0.0 |
© 2007 by MDPI ( http://www.mdpi.org). Reproduction is permitted for noncommercial purposes.
Share and Cite
MDPI and ACS Style
Wu, J.-H.; Chang, R.-S.; Jiang, J.-A. A Novel Pulse Measurement System by Using Laser Triangulation and a CMOS Image Sensor. Sensors 2007, 7, 3366-3385. https://doi.org/10.3390/s7123366
AMA Style
Wu J-H, Chang R-S, Jiang J-A. A Novel Pulse Measurement System by Using Laser Triangulation and a CMOS Image Sensor. Sensors. 2007; 7(12):3366-3385. https://doi.org/10.3390/s7123366
Chicago/Turabian StyleWu, Jih-Huah, Rong-Seng Chang, and Joe-Air Jiang. 2007. "A Novel Pulse Measurement System by Using Laser Triangulation and a CMOS Image Sensor" Sensors 7, no. 12: 3366-3385. https://doi.org/10.3390/s7123366