Satellite-based Flood Modeling Using TRMM-based Rainfall Products

Abstract
:1. Introduction
2. Study Area and Data
3. Hydrologic Model Configurations
4. Implications of Satellite Rainfall Uncertainty on Flood Prediction
5. Conclusion
Acknowledgments
References and Notes
- Barry, D.A.; Bajracharya, K. On the Muskingum-Cunge Flood Routing Method. Environmental International 1995, 21(5), 485–490. [Google Scholar] [CrossRef]
- Beven, K.J.; Kirkby, M.J. A physically-based variable contributing area model of basin hydrology. Hydrological Sciences Bulletin 1979, 24(1), 43–69. [Google Scholar]
- Borga, M. Accuracy of radar rainfall estimates for stream-flow simulation. Journal of Hydrology 2002, 267, 26–39. [Google Scholar]
- Ebert, E.; Janowiak, J.E.; Kidd, C. Comparison of near real-time precipitation estimates from satellite observations and numerical models. Bulletin of American Meteorological Society 2007, 88, 47–64. [Google Scholar]
- Fulton, R.A.; Breidenbach, J.P.; Seo, D.J.; Miller, D.A.; O'Bannon, T. The WSR-88D Rainfall Algorithm. Weather and Forecasting 1998, 13(2), 377–395. [Google Scholar]
- Harris, A. Investigating the optimal configuration of conceptual hydrologic models for satellite based flood prediction. M.S. Thesis, unpublished. Department of Civil and Environmental Engineering, Tennessee Technological University, 2007. [Google Scholar]
- Hossain, F.; Katiyar, N.; Wolf, A.; Hong, Y. The Emerging role of Satellite Rainfall Data in Improving the Hydro-political Situation of Flood Monitoring in the Under-developed Regions of the World. Natural Hazards 2007, 43, 199–210. [Google Scholar] [CrossRef]
- Hossain, F.; Anagnostou, E.N. Assessment of a multi-dimensional satellite rainfall error model for ensemble generation of satellite rainfall data. IEEE Geosciences and Remote Sensing Letters 2006, 3(3), 419–423. [Google Scholar] [CrossRef]
- Hossain, F.; Katiyar, N. Improving Flood Forecasting in International River Basins. EOS (AGU) 2006, 87(5), 49–50. [Google Scholar]
- Hossain, F.; Anagnostou, E.N. Assessment of current passive microwave and infrared based satellite rainfall remote sensing for flood prediction. Journal of Geophysical Research-Atmosphere 2004, 109, D07102. [Google Scholar]
- Huffman, G.J.; Adler, R.F.; Morrissey, M.; Bolvin, D.T.; Curtis, S.; Joyce, R.; McGavock, B.; Susskind, J. Global precipitation at one-degree daily resolution from multi-satellite observations. Journal of Hydrometeorology 2001, 2, 36–50. [Google Scholar]
- Huffman, G.J.; Adler, R.F.; Bolvin, D.T.; Gu, G.; Nelkin, E.J.; Bowman, K.P.; Hong, Y.; Stocker, E.F.; Wolff, D.B. The TRMM Multi-satellite Precipitation Analysis: Quasi-Global, Multi-Year, Combined-Sensor Precipitation Estimates at Fine Scale. Journal of Hydrometeorology 2007, 8, 38–55. [Google Scholar]
- Joyce, R.L.; Janowiak, J.E.; Arkin, P.A.; Xie, P. CMORPH: A method that produces global precipitation estimates from passive microwave and infrared data at high spatial and temporal resolution. Journal of Hydrometeorology 2004, 5, 487–503. [Google Scholar]
- Kavetski, D.; Kuczera, G.; Franks, S.W. Bayesian analysis of input uncertainty in hydrological modeling: 2 Application. Water Resources Research 2006, 42(W03408). [Google Scholar] [CrossRef]
- Krzyzstofowicz, R. Bayesian theory of probabilistic forecasting via deterministic hydrological model. Water Resources Research 1999, 35(9), 2739–2750. [Google Scholar]
- Krzyzstofowicz, R. The case for probabilistic forecasting in hydrology. Journal of Hydrology 2001, 249, 2–9. [Google Scholar]
- Kull, D.W.; Feldman, A.D. Evolution of Clark's Unit Graph Method to Spatially Distributed Runoff. Journal of Hydrologic Engineering 1998, 3(1), 9–19. [Google Scholar] [CrossRef]
- Negri, A.; Burkardt, N.; Golden, J.H.; Halverson, J.B.; Huffman, G.J.; Larsen, M.C.; Mcginley, J.A.; Updike, R.G.; Verdin, J.P.; Wieczorek, J.F. The Hurricane-Flood-Landslide Continuum. Bulletin of American Meteorological Society 2004. [Google Scholar] [CrossRef]
- Petersen, W.A.; Rutledge, S.A. Regional variability in tropical convection: observations from TRMM. Journal of Climate 2002, 14, 3566–3586. [Google Scholar]
- Quinn, P.F.; Beven, K.J.; Lamb, R. The ln(a/tanb) index: how to calculate it and how to use it in the TOPMODEL framework. Hydrological Processes 1995, 9, 161–182. [Google Scholar]
- Shiklomanov, A.I.; Lammers, R.B.; Vörösmarty, C.J. Widespread decline in hydrological monitoring threatens pan-arctic research. EOS Transactions 2002, 83(2), 16–17. [Google Scholar]
- Smith, E.; Asrar, G.; Furuhama, Y.; Ginati, A.; Kummerow, C.; Levizzani, V.; Mugnai, A.; Nakamura, K.; Adler, R.; Casse, V.; Cleave, M.; Debois, M.; Durning, J.; Entin, J.; Houser, P.; Iguchi, T.; Kakar, R.; Kaye, J.; Kojima, M.; Lettenmaier, D.P.; Luther, M.; Mehta, A.; Morel, P.; Nakazawa, T.; Neeck, S.; Okamoto, K.; Oki, R.; Raju, G.; Shepherd, M.; Stocker, E.; Testud, J.; Wood, E.F. The international global precipitation measurement (GPM) program and mission: An overview. In Measuring Precipitation from Space: EURAINSAT and the Future; Levizzani, V., Turk, F.J., Eds.; Kluwer Academic Publishers, 2006; In Press. [Google Scholar]
- Sorooshian, S.; Hsu, K.L.; Gao, X.; Gupta, H.V.; Imam, B.; Braithwaite, D. Evaluation of PERSIANN system satellite-based estimates of tropical rainfall. Bulletin of American Meteorological Society 2000, 81, 2035–2046. [Google Scholar]
- Stokstad, E. Scarcity of rain, stream gages threatens forecasts. Science 1999, 285, 1199. [Google Scholar]
- Syed, T.H.; Lakshmi, V.; Paleologos, E.; Lohmann, D.; Mitchell, K.; Famiglietti, J. Analysis of process controls in land surface hydrological cycle over the continental United States. Journal of Geophysical Research 2004, 109(D22105). [Google Scholar] [CrossRef]
- World Disasters Report. International Federation of Red Cross and Red Crescent Societies 2003, 239.


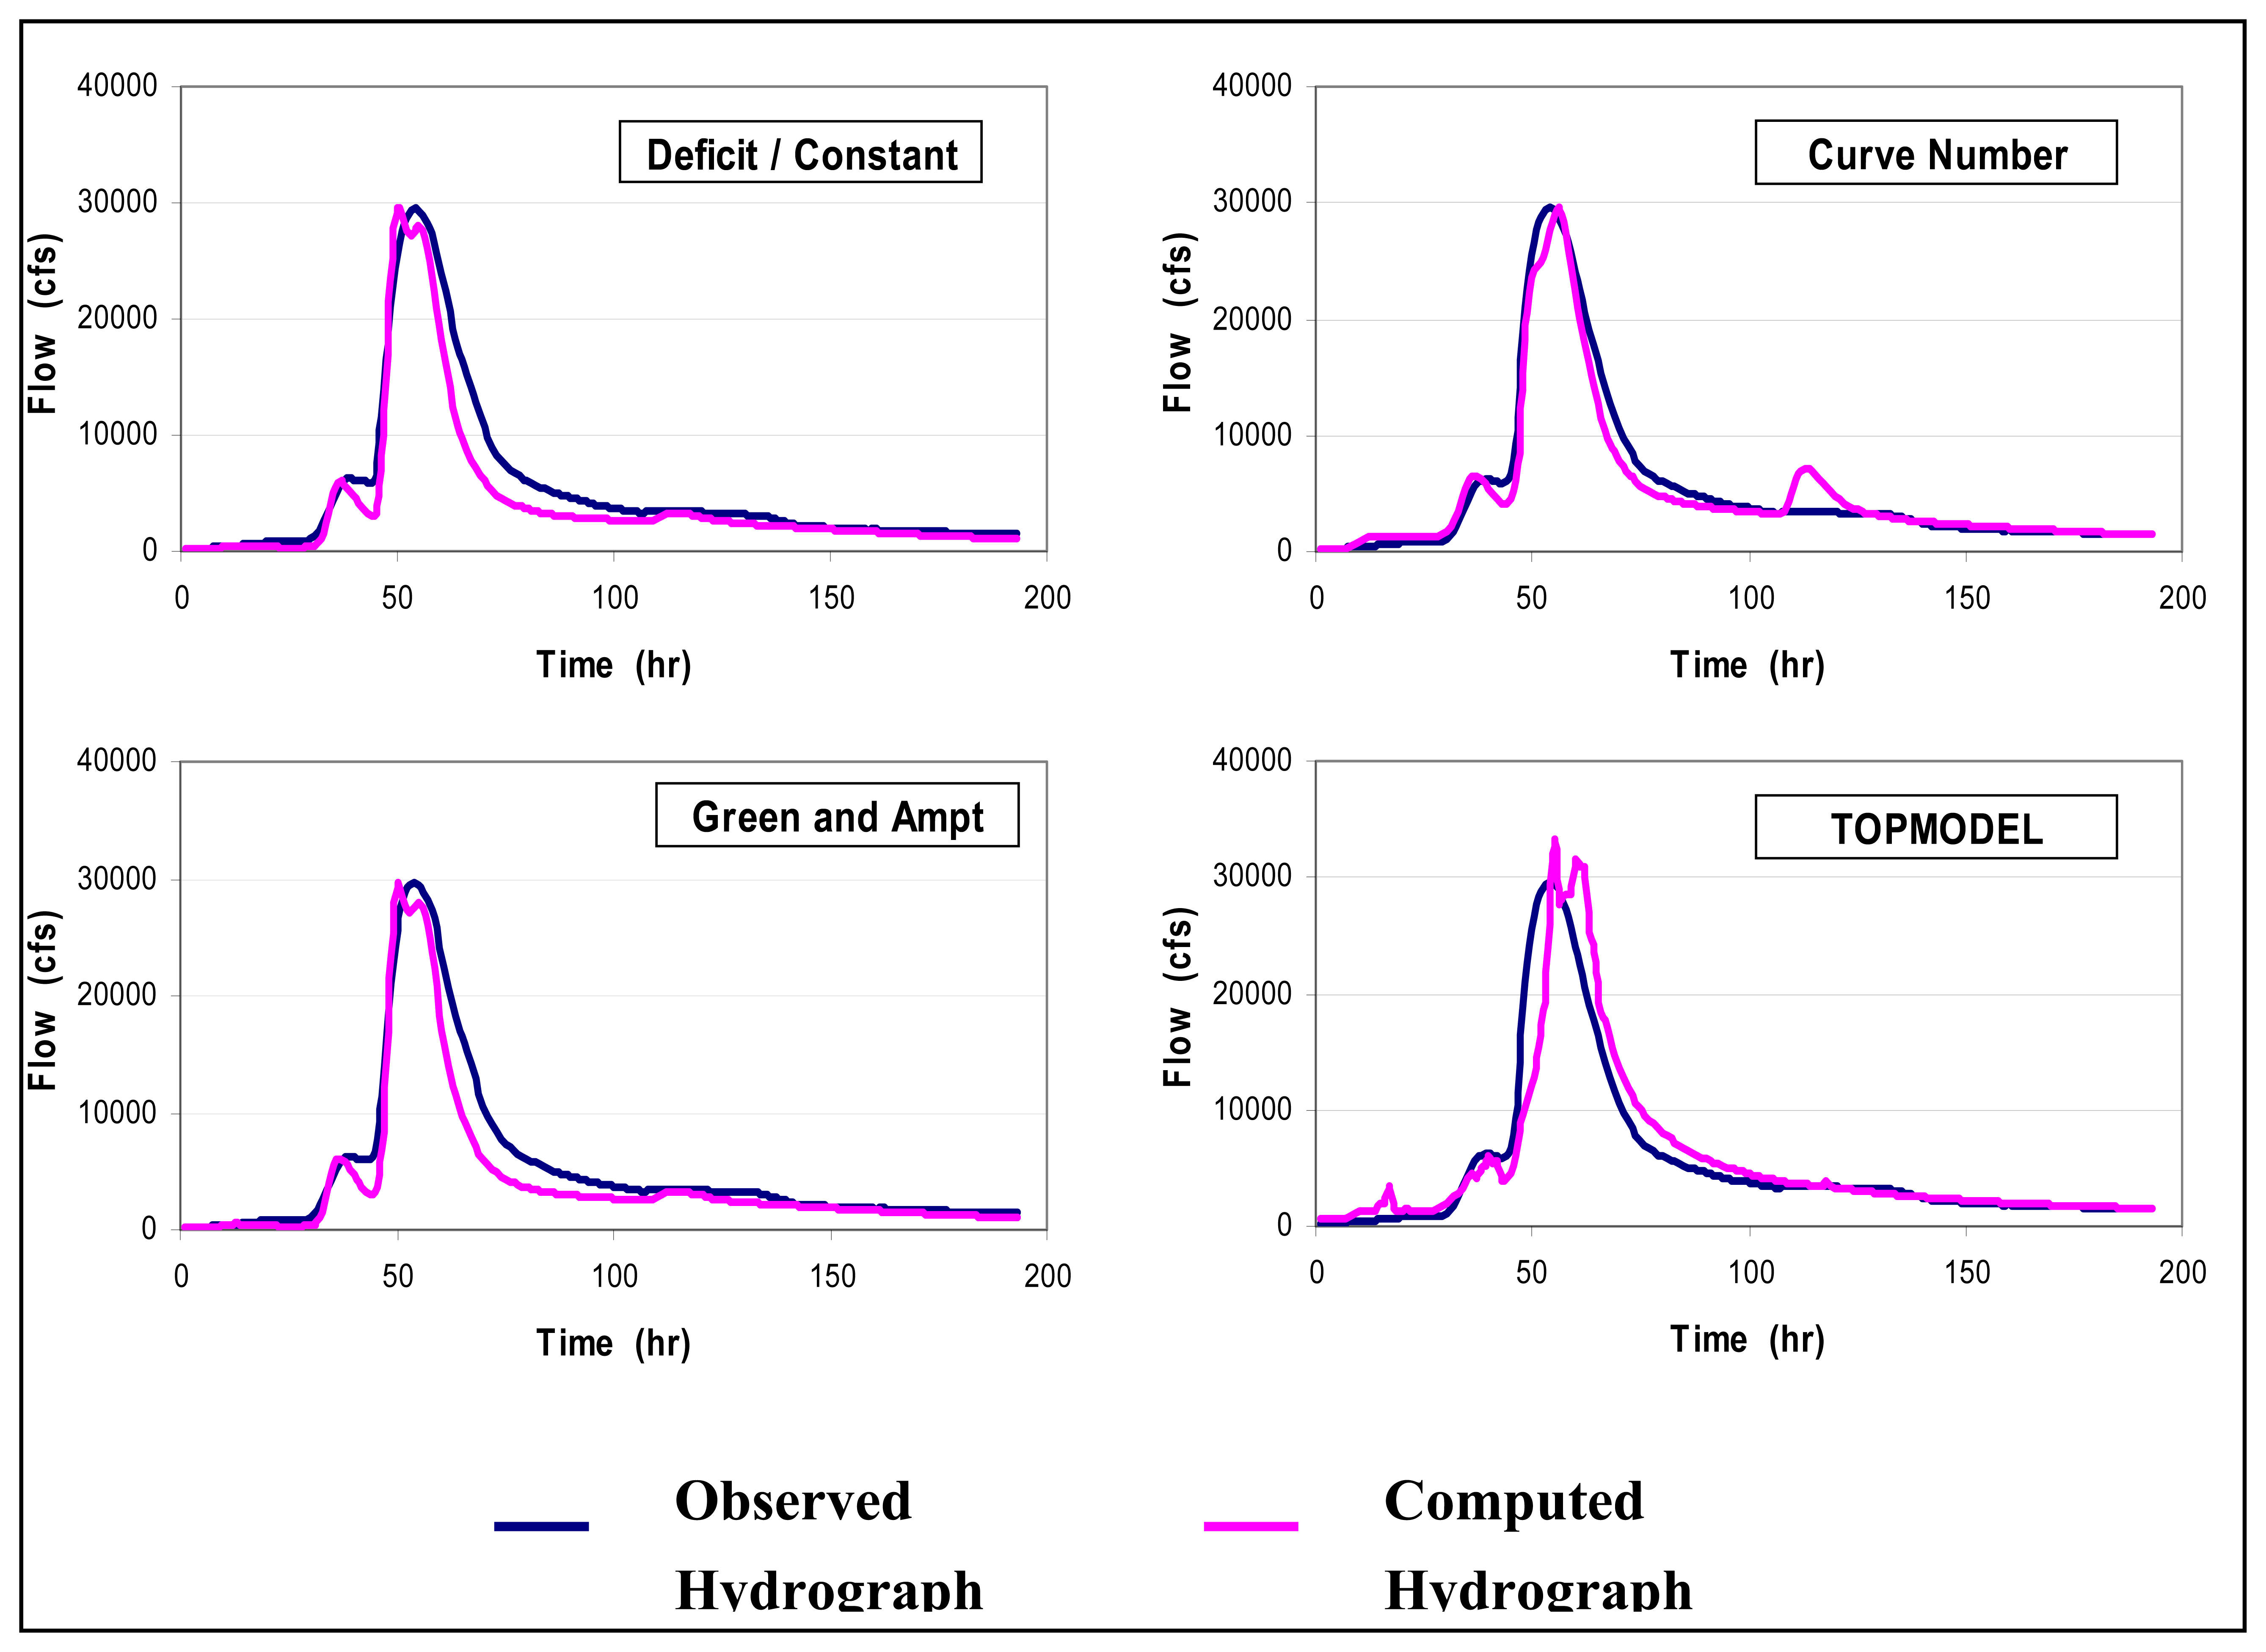
| Peak Flow | |||
|---|---|---|---|
| Hydrologic Model | Observed (cfs) | Computed (cfs) | Error (%) |
| D/C | 29600 | 29584 | 0.05 |
| Curve Number | 29600 | 29574 | 0.09 |
| Green and Ampt | 29600 | 29524 | 0.26 |
| TOPMODEL | 29600 | 33258 | 12.4 |
| Total Runoff Volume | |||
| Hydrologic Model | Observed (in) | Computed (in) | Error (%) |
| D/C | 4.43 | 3.49 | 21.2 |
| Curve Number | 4.43 | 4.24 | 4.3 |
| Green and Ampt | 4.43 | 4.22 | 4.7 |
| TOPMODEL | 4.43 | 4.58 | 3.4 |
| Time to Peak | |||
| Hydrologic Model | Observed (hr) | Computed (hr) | Error (%) |
| D/C | 53 | 49 | 7.6 |
| Curve Number | 53 | 55 | 3.8 |
| Green and Ampt | 53 | 49 | 7.6 |
| TOPMODEL | 53 | 55 | 3.8 |
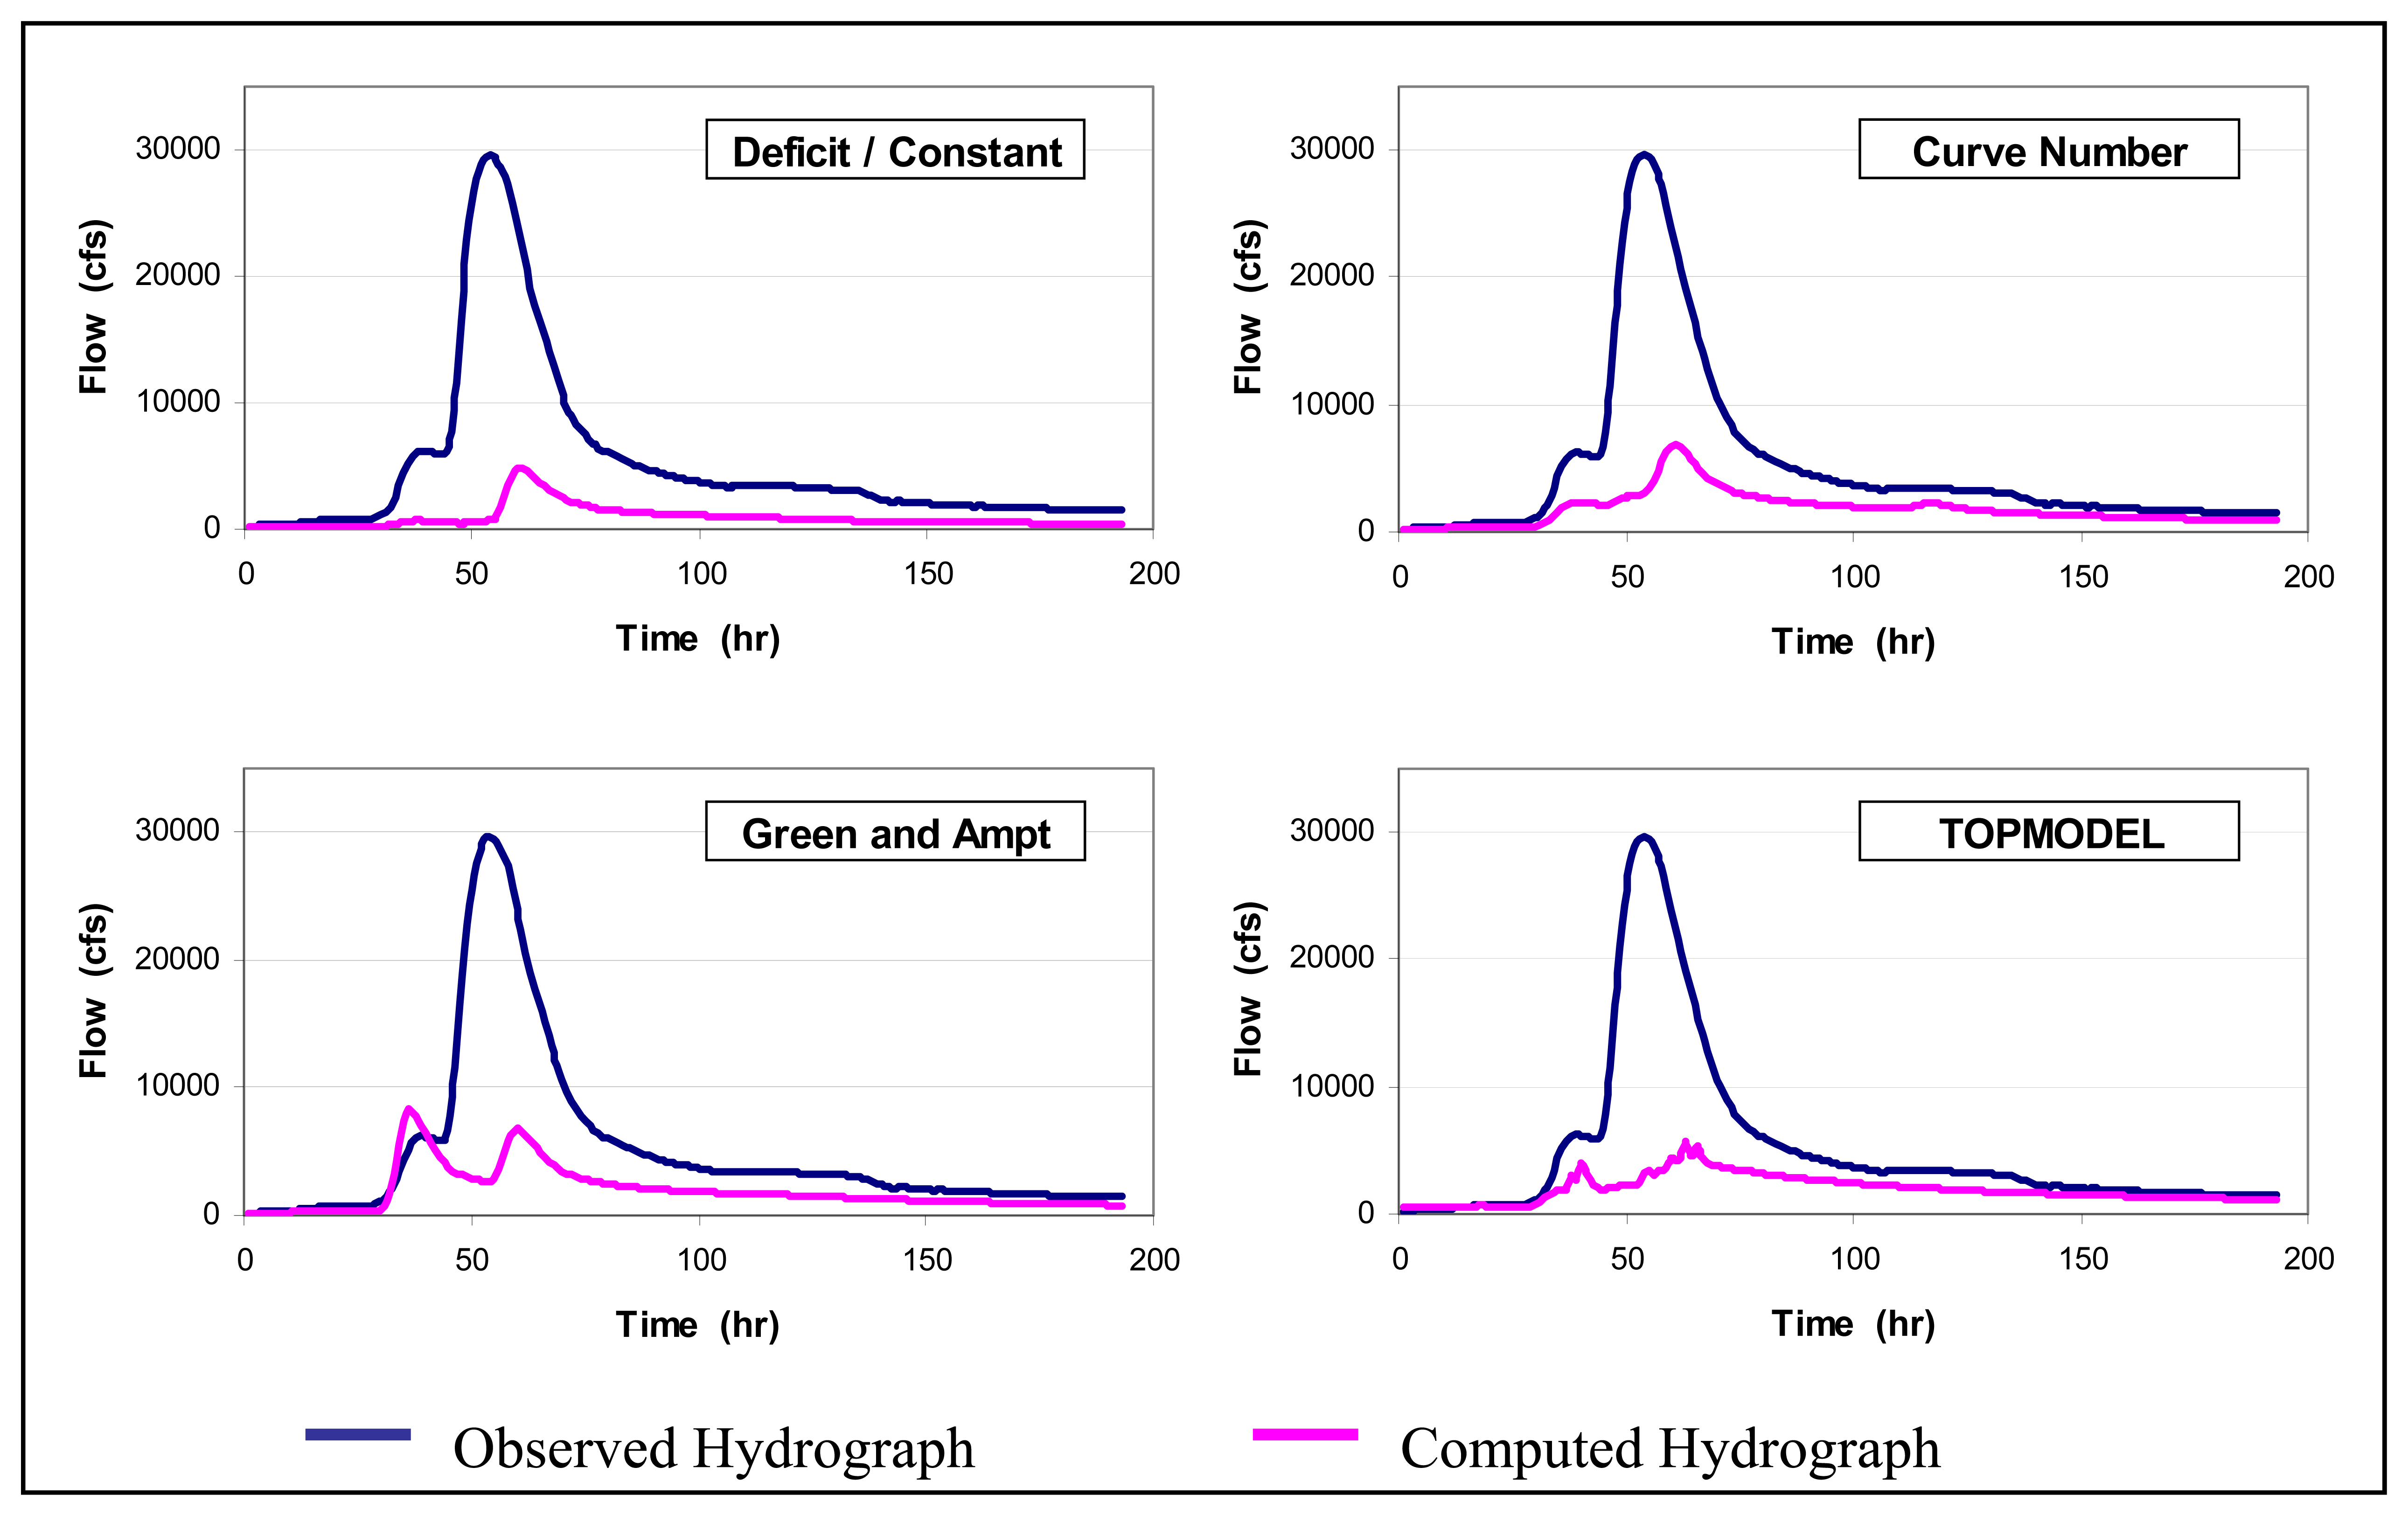
| Peak Flow | |||
|---|---|---|---|
| Loss Method | Observed (cfs) | Computed (cfs) | Error (%) |
| D/C | 29600 | 4823 | 83.7 |
| Curve Number | 29600 | 6848 | 76.9 |
| Green and Ampt | 29600 | 8360 | 71.8 |
| Total Volume | |||
| Loss Method | Observed (in) | Computed (in) | Error (%) |
| D/C | 4.43 | 0.85 | 80.8 |
| Curve Number | 4.43 | 1.63 | 63.2 |
| Green and Ampt | 4.43 | 1.75 | 60.5 |
| Time to Peak | |||
| Loss Method | Observed (hr) | Computed (hr) | Error (%) |
| D/C | 53 | 60 | 13.2 |
| Curve Number | 53 | 60 | 13.2 |
| Green and Ampt | 53 | 35 | 34.0 |
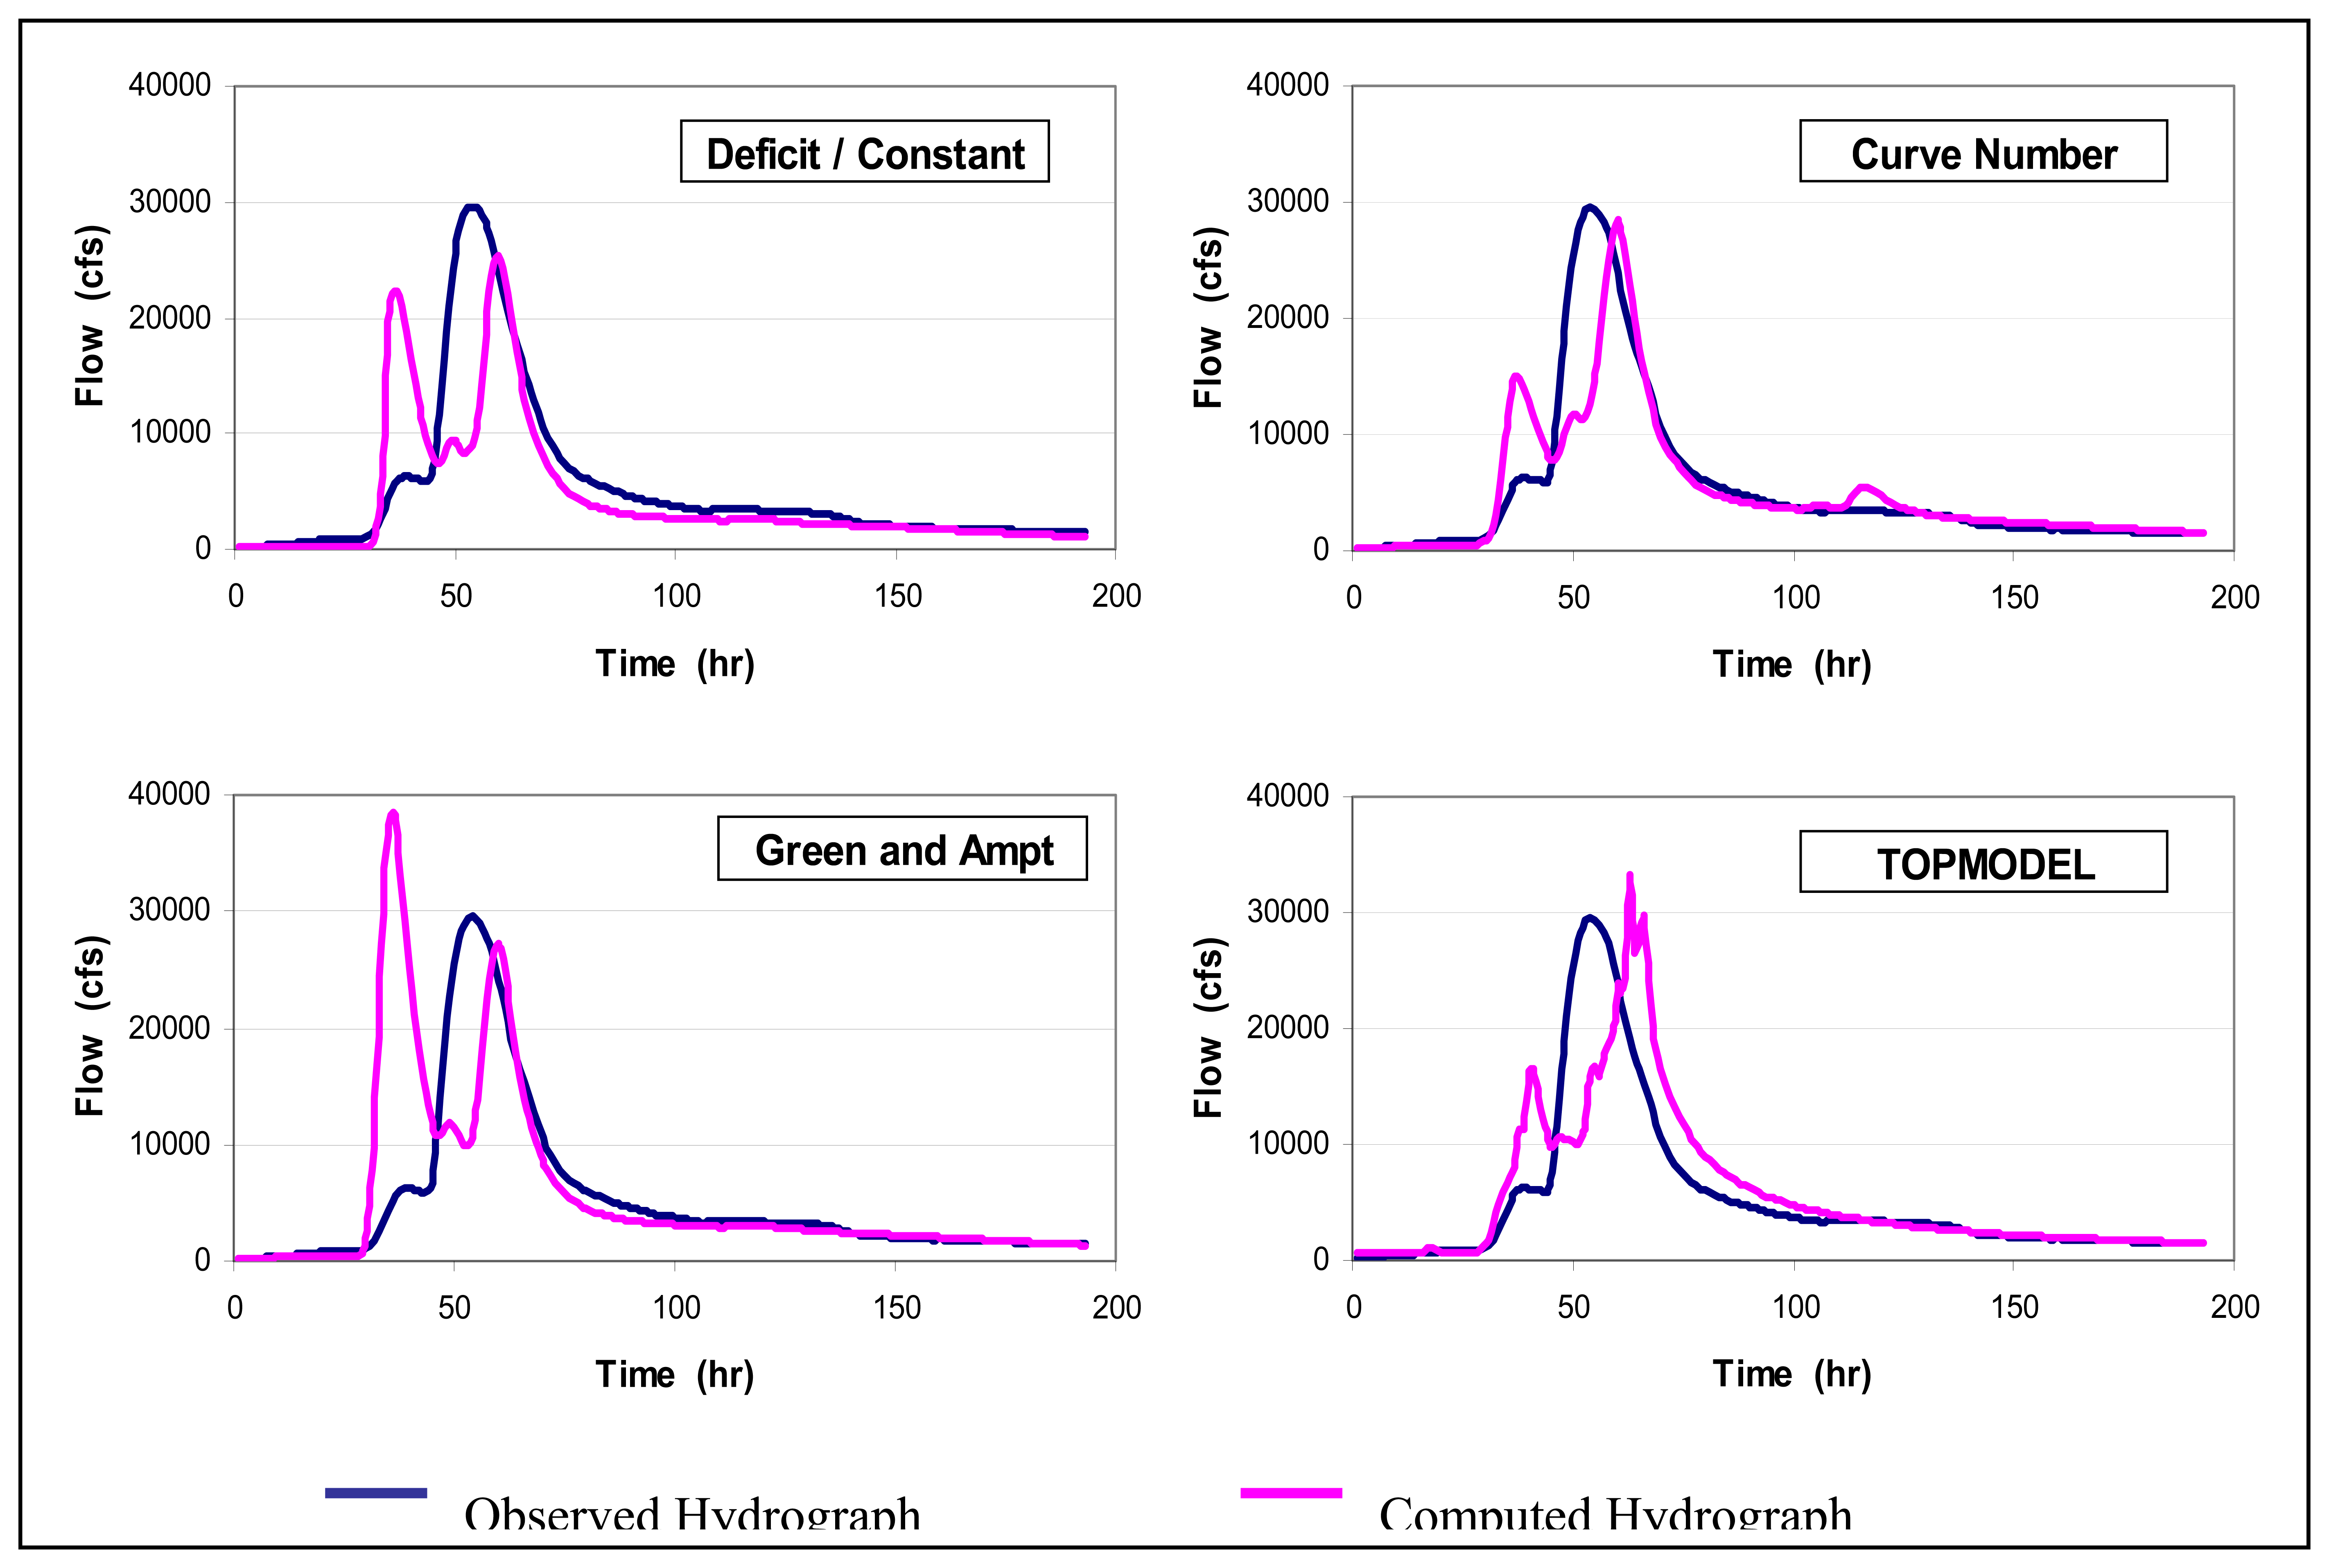
| Peak Flow | |||
|---|---|---|---|
| Loss Method | Observed (cfs) | Computed (cfs) | Error (%) |
| D/C | 29600 | 25348 | 14.4 |
| Curve Number | 29600 | 28580 | 3.4 |
| Green and Ampt | 29600 | 38406 | 29.8 |
| Total Volume | |||
| Loss Method | Observed (in) | Computed (in) | Error (%) |
| D/C | 4.43 | 3.63 | 18.1 |
| Curve Number | 4.43 | 4.27 | 3.6 |
| Green and Ampt | 4.43 | 4.73 | 6.8 |
| Time to Peak | |||
| Loss Method | Observed (hr) | Computed (hr) | Error (%) |
| D/C | 53 | 59 | 11.3 |
| Curve Number | 53 | 60 | 13.2 |
| Green and Ampt | 53 | 35 | 34.0 |
© 2007 by MDPI ( http://www.mdpi.org). Reproduction is permitted for noncommercial purposes.
Share and Cite
Harris, A.; Rahman, S.; Hossain, F.; Yarborough, L.; Bagtzoglou, A.C.; Easson, G. Satellite-based Flood Modeling Using TRMM-based Rainfall Products. Sensors 2007, 7, 3416-3427. https://doi.org/10.3390/s7123416
Harris A, Rahman S, Hossain F, Yarborough L, Bagtzoglou AC, Easson G. Satellite-based Flood Modeling Using TRMM-based Rainfall Products. Sensors. 2007; 7(12):3416-3427. https://doi.org/10.3390/s7123416
Chicago/Turabian StyleHarris, Amanda, Sayma Rahman, Faisal Hossain, Lance Yarborough, Amvrossios C. Bagtzoglou, and Greg Easson. 2007. "Satellite-based Flood Modeling Using TRMM-based Rainfall Products" Sensors 7, no. 12: 3416-3427. https://doi.org/10.3390/s7123416