Article

Influence of Thickness on Ethanol Sensing Characteristics of Doctor-bladed Thick Film from Flame-made ZnO Nanoparticles

by
Chaikarn Liewhiran
1 and
Sukon Phanichphant
2,*
1
Department of Physics, Faculty of Science, Chiang Mai University, Chiang Mai 50200, Thailand
2
Nanoscience Research Laboratory, Department of Chemistry, Faculty of Science, Chiang Mai University, Chiang Mai, Thailand 50200
*
Author to whom correspondence should be addressed.
Sensors 2007, 7(2), 185-201; https://doi.org/10.3390/s7020185
Submission received: 21 February 2007 / Accepted: 27 February 2007 / Published: 28 February 2007

Abstract

:
ZnO nanoparticles were produced by flame spray pyrolysis (FSP) using zinc naphthenate as a precursor dissolved in toluene/acetonitrile (80/20 vol%). The particle properties were analyzed by XRD, BET, and HR-TEM. The sensing films were produced by mixing the particles into an organic paste composed of terpineol and ethyl cellulose as a vehicle binder and were fabricated by doctor-blade technique with various thicknesses (5, 10, 15 μm). The morphology of the sensing films was analyzed by SEM and EDS analyses. The gas sensing characteristics to ethanol (25-250 ppm) were evaluated as a function of film thickness at 400°C in dry air. The relationship between thickness and ethanol sensing characteristics of ZnO thick film on Al2O3 substrate interdigitated with Au electrodes were investigated. The effects of film thickness, as well as the cracking phenomenon, though, many cracks were observed for thicker sensing films. Crack widths increased with increasing film thickness. The film thickness, cracking and ethanol concentration have significant effect on the sensing characteristics. The sensing characteristics with various thicknesses were compared, showing the tendency of the sensitivity to ethanol decreased with increasing film thickness and response time. The relationship between gas sensing properties and film thickness was discussed on the basis of diffusively and reactivity of the gases inside the oxide films. The thinnest sensing film (5 μm) showed the highest sensitivity and the fastest response time (within seconds).

1. Introduction

Zinc oxide (ZnO) is an n-type semiconductor of wurtzite structure, with a direct large-band gap of about 3.37 eV at room temperature [1, 2]. It is one of the most promising materials for sensors, especially for ethanol vapor [3-19]. However, the physical and sensing properties of semiconductor gas sensors are directly related to their preparation e.g. particle size, sensing film morphology, and film thickness as well as sensing film characteristics.
Flame aerosol technology is employed widely for large-scale manufacture of carbon blacks and commodities such as fumed SiO2 and TiO2 and to a lesser extent, for specialty chemicals such as Al2O3 and ZnO powders. Flame spray pyrolysis (FSP) is a promising technique for synthesis of high purity nano-sized materials with controlled size and crystallinity in one step [20, 21]. In general, a flame is used to force chemical reactions of precursor compounds, finally resulting in the information of clusters, which increase their size to a range of some nanometers by coagulation and sintering. Finally, the nanostructured powders are collected on a filter [22]. Reactant mixing, precursor mixing, additives, and electric fields also influence the particle size. Reactant mixing influences the flame temperature, flame height and the particle residence time. The more fuel is introduced the higher the flame is and due to that the residence time of particles in the flame is increased. As a consequence time for particle growth is enlarged and bigger particles are formed. External electric field reduces the average particle size in a narrow range up to a factor of two. Electric fields can be used in application as control devices [23]. Moreover, at low oxidant flow rates, the specific surface area increased with increasing oxidant flow rate as the spray flame length was reduced leading to shorter residence time allowing less time for particle growth. Using oxygen as oxidant the droplets burn much faster than with air, thus, product particles experience longer residence times at higher temperature [22, 24]. The effect of solution feed rate on particles specific surface area and crystalline size were investigated [25]. The solution feed rate increased the flame height, and therefore coalescence was enhanced, resulting in large primary particles [25]. Furthermore, the flame conditions can be used to control the morphology of particles. ZnO nanorods formation were produced by FSP, which was described basically by XRD lattice aspect ratio [26, 27].
Several oxide materials commonly used as ethanol gas sensors including pure and metal-doped SnO2[28-35], In2O3[36, 37], TiO2[35, 38-42], ZrO2[35], WO3[34, 42], MoO3[42], and Cu2O [43]. Many researchers reported that pure ZnO [3-9] and metal-doped ZnO [10-18] were widely used to detect the alcohol vapor. For examples, ZnO thin films were produced by spray pyrolysis [5]. Film layers of 20 μm in thickness showed sensitivity in terms of rather high ethanol concentration (1000-5000 ppm) at 150-350°C. At high operating temperature, they did not depend on the concentration of ethanol [5]. An ethanol sensor based on ZnO nanorods prepared by hydrothermal method [6] showed high sensitivity to ethanol concentration ranging from 10 to 2000 ppm at 330°C, with good response and recovery time. Furthermore, ZnO nanowire ethanol gas sensor showed high sensitivity and fast response to ethanol gas at concentration up to 200 ppm with operating temperature of 300°C [7]. In addition, pure ZnO nanorods and nano-needles produced by hybrid induction and laser heating (HILH) technique also showed capability to produce sensors with good sensitivity goes a maximum temperature around 400°C for a concentration of 100 ppm for volatile organic compounds (VOCs) including acetone, toluene, and ethanol. 4.58 at% In/ZnO showed highest sensitivity compared to pure ZnO [11]. ZnO films doped with 3 at% La showed enhancement of ethanol sensitivity of 350, shorter response and recovery time of about 60 s at an operating temperature of 300°C [14]. ZnO nanorods and nanowires doped with Pt also showed high sensitivity for 1000 ppm of ethanol at an operating temperature below 150°C, with short response and recovery time [15]. Therefore it is interesting to apply FSP for production of ZnO nanoparticles [24-25] as used in gas sensor of ethanol vapor.
The effect of film thickness, as well as the sensing temperature, on the sensor characteristics of sensing films was reported [44-54]. Many researchers mentioned a variety of techniques used to prepare the sensing films, i.e. plasma enhanced chemical vapor deposition (PECVD) [47], spray pyrolysis [5, 47], screen printing [50], and doctor-blade [55, 56]. They have been shown that the sensor characteristics of sensing films are affected by the film structure, morphology, and film thickness, which are determined by the film preparation procedure. In addition, the sensing temperature and film thickness are important parameters that affect the gas sensing properties in terms of sensitivity, response, and recovery time. Especially, doctor-blade technique has several advantages in producing the sensing thick films suitable for the gas sensor including relatively homogeneous composition and easy control of film thickness. Therefore, it is very significant to investigate the most suitable thickness for the ethanol sensor based on flame-made ZnO nanoparticles.

2. Experimental

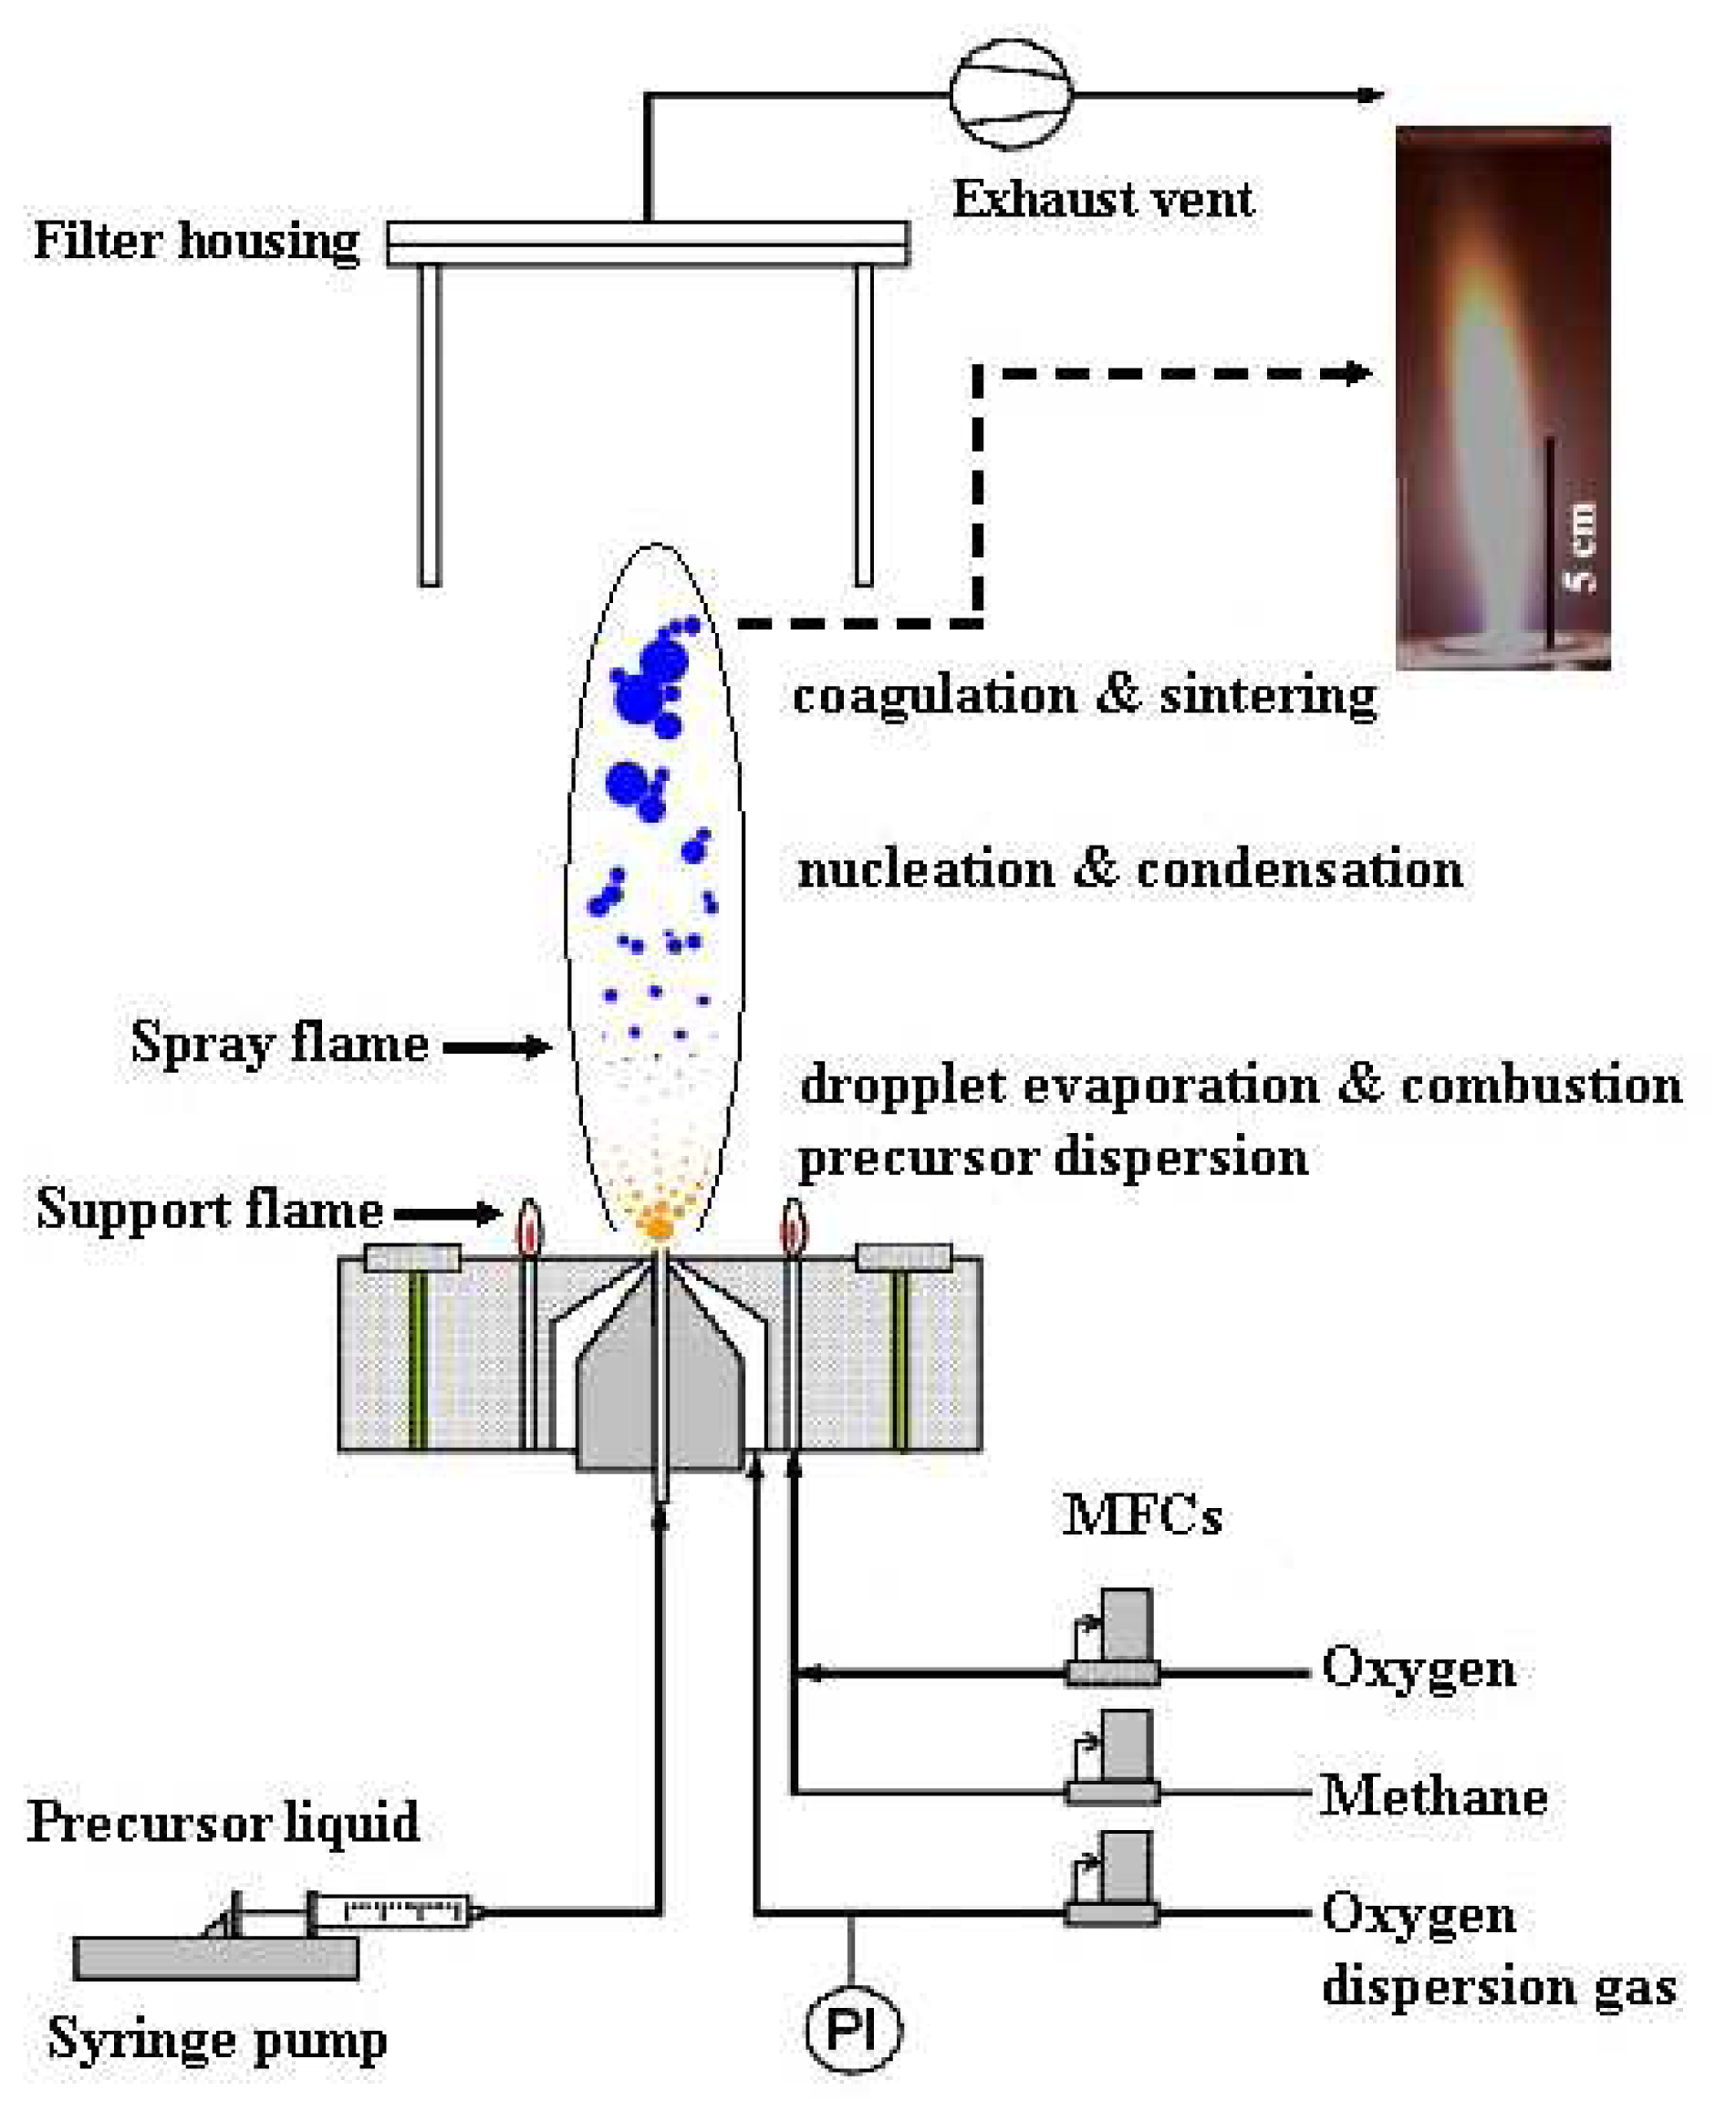
2.1. Particle Synthesis

Zinc naphtenate (Strem, 10 wt% Zn) was used as zinc precursor. The precursor was dissolved in toluene (Riedel deHaen, 99.5%)/acetonitrile (Fluka, 99.5%) mixtures with ratio of 80/20 vol% to obtain a 0.5 mol/l precursor solution for the synthesis via FSP experiments. Fig. 1 shows the experimental set up of FSP. In a typical run, the precursor was fed into a FSP reactor by a syringe pump with a rate of 5 ml/min and dispersed of 5 l/min O2. This flame conditions will be depicted as 5/5 flame. The gas flow rates of methane and O2 supporting flamelets were 1.13, and 2.40 l/min, respectively. The pressure drop at the capillary tip was kept constant at 1.5 bars by adjusting the orifice gap area at the nozzle. The liquid precursor mixture was rapidly dispersed by a gas stream and ignited by a premixed methane/oxygen flame. The flame height was 10 cm and showed a yellowish-orange flame appearance as shown in the inset. After evaporation and combustion of precursor droplets, particles are formed by nucleation, condensation, coagulation and coalescence. Finally, the nanoparticles were collected on a glass microfibre filters (Whatmann GF/A, 25.7 cm in diameter) with the aid of a vacuum pump. The flame made (5/5) ZnO as-prepared nanopowders were designated as P0.

2.2. Particle Characterization

The phase and crystallinity of flame-made nanopowders and sensor samples were also analyzed by XRD (Bruker D8 advance diffractometer, operated at 40 kV, 40 mA) using CuKα radiation at 2θ = 20-80° with a step size of 0.06° and a scanning speed of 0.72°/minute. Using the fundamental parameter approach and Rietveld method [57], the crystalline phase and the size of the particles were confirmed. The phase and the corresponding sizes were calculated using the software TOPAS-3. The specific surface areas of ZnO nanoparticles was determined with the 5-point nitrogen adsorption measurement applying the Bruneauer-Emmett-Teller (BET) method [58] at 77 K (Micromeritics Tristar 3000). All samples were degassed at 150°C for 1 h prior to analysis. The diameter of particles can be calculated by dBET = 6/SSABET * ρsample, where SSABET is the specific surface area (m2/g) and ρsamples is the density of ZnO (ρZnO = 5.61 * 103 kg/m3) [25]. The morphologies of nanoparticles of sample P0 were observed by the high-resolution transmission electron microscopy (HR-TEM) using the Tecanai 30F microscope (Philips; field emission cathode, operated at 300 kV). The HR-TEM bright-field images were obtained using a slow-scan CCD camera.

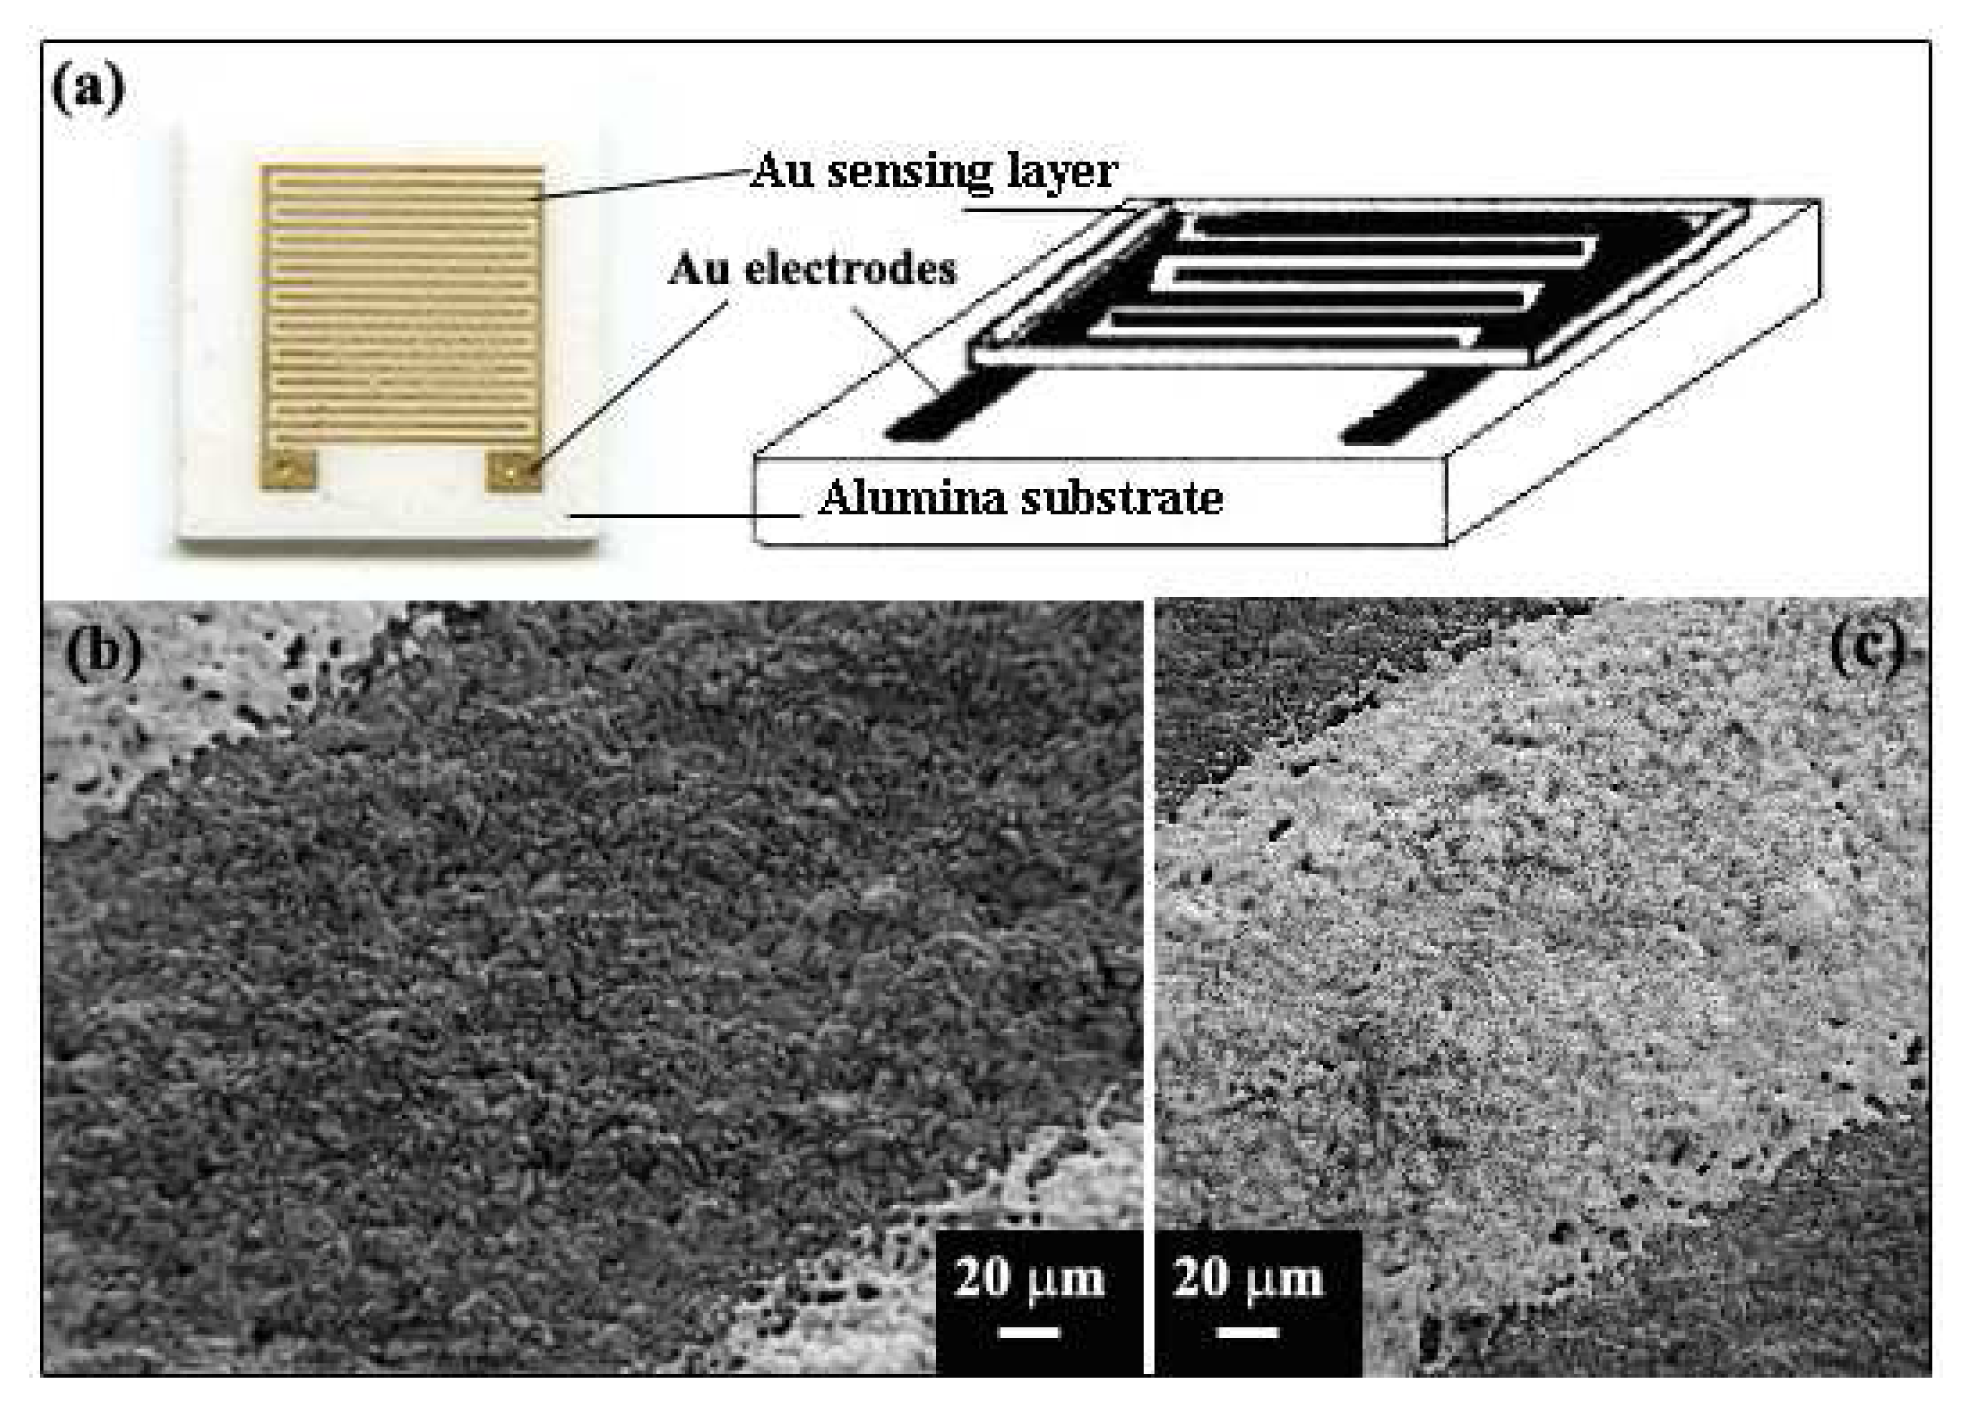
2.3. Preparation of Sensor

2.3.1 Paste Preparation

An Al2O3 substrates interdigitated with Au electrodes (Au/Al2O3; 10 x 10 x 0.1 mm; Electronics Design Center, MicroFabrication Lab, Case Western Reserve University) were used as a sensor substrates as shown in Fig. 2(a) and designated as A0. The substrate layout (Fig. 2(a)) and the SEM micrographs of morphology were observed with different magnifications of Al203 (dark view) substrate interdigitated with Au (bright view) electrodes were also observed using SEM analysis (Fig. 2(b-c)). An appropriate quantity of 0.28 ml homogeneous mixed solution was prepared by stirring of ethyl cellulose (Fluka, 30-60 mPa.s) as the temporary binder and terpineol (Aldrich, 90%) as a solvent with a mixing ratio of 480 mg to 18 g. The viscous mixture was combined with 70 mg of samples P0 and mixed to form a paste for 30 min prior to doctor-blade.

2.3.2 Doctor-bladed Thick Film Preparation

The resulting paste doctor-bladed on the Al2O3 substrates interdigitated with Au electrodes were prepared [55, 56]. For the film thickness variance, all substrates were taped (Scotch Magic™ tape; Art. Nr.11110300, Ethilux,Germany) upon the edges for 1, 2, 3 tapes which control the film thickness to be approximately 5, 10, 15 μm, respectively, prior to doctor-blade. We believe that the tape plays an important role in controlling the thick films layer by providing a template for film thickness formation (1 tape can control thickness approximately 5 μm). The resulting substrates were heated in an oven at 400°C for 2h with a heating rate of 2°C/min for binder removal [59] and cooled down to 20°C with the heating rate of 5°C/min prior to sensing test. Finally, the gold bonding was fabricated using pure gold wires (Alfa Aesar, 0.2 mm (0.008in) dia, 99.9% (metal basis)) that were put through the tiny holes of gold electrodes by soldering.

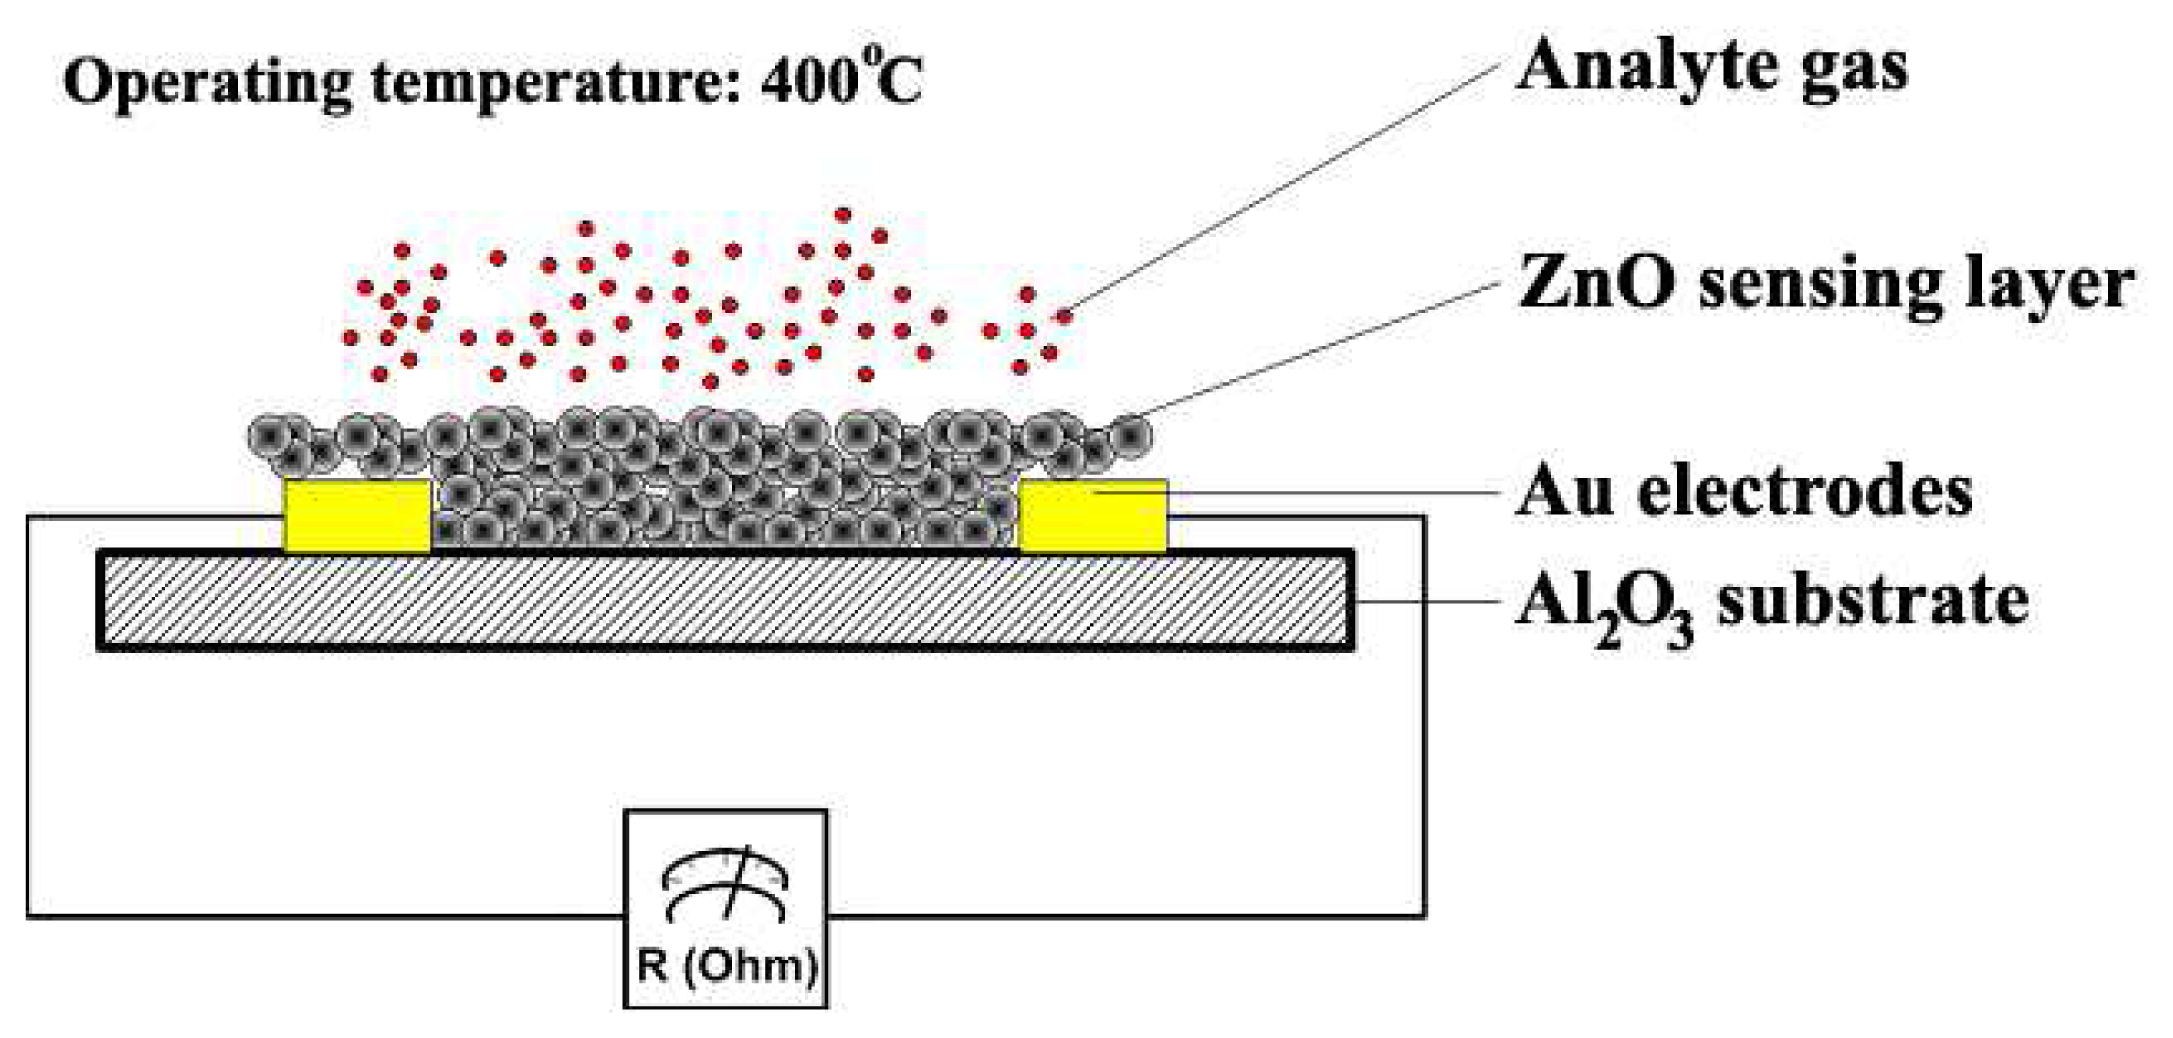
2.4. Characterization of Gas Sensing Characteristics

The sensor samples to be measure were placed in the center of quartz tube (3 cm diameter and 60 cm length). The tube was put in a tubular oven (Nabertherm Controller P320, Germany). Gold wires were soldered to the sensor Au electrodes externally connected with a digital multimeter (KEITHLEY model 2700 DMM, Germany) to record the sensor resistance. The sensors were tested for ethanol vapor at the operating temperature of 400°C. The sensors were certainly exposed to ethanol vapor at various concentrations ranging from 25-250 ppm. A total gas flow rate of 2 l/min was passed through the quartz tube and controlled by mass flow controllers (Bronkhorst HITEC, Germany). By monitoring the output voltage across the sensor, as the operating temperature increased up to 400°C, the resistances of the sensor in dry air and in test gas were alternately increased and decreased, which can be measured. The sensing mechanism of material was shown in Fig. 3. The analyte ethanol gas adsorbs on the ZnO sensing layer and causes a change in resistance depending on the gas concentration. This is monitored by a digital multimeter connected to the sensor substrate with Au wires. The corresponding resistance and time showed the sensing characteristics in terms of sensitivity, response, and recovery time. The sensitivity, S is defined as the ratio Ra/Rg, where Ra is the resistance in dry air, and Rg is the resistance in test gas. The response time, Tres is defined as the time required until 90 % of the response signal is reached. The recovery times, Trec denotes the time needed until 90 % of the original baseline signal is recovered. After annealing and sensing test of sensor fabricated using samples P0 with controlled a various film thicknesses of 5, 10, and 15 μm, they were designated as S1, S2, and S3, respectively. Finally, the film thickness sensing layers were analyzed by SEM and EDS analyses.

3. Results and Discussion

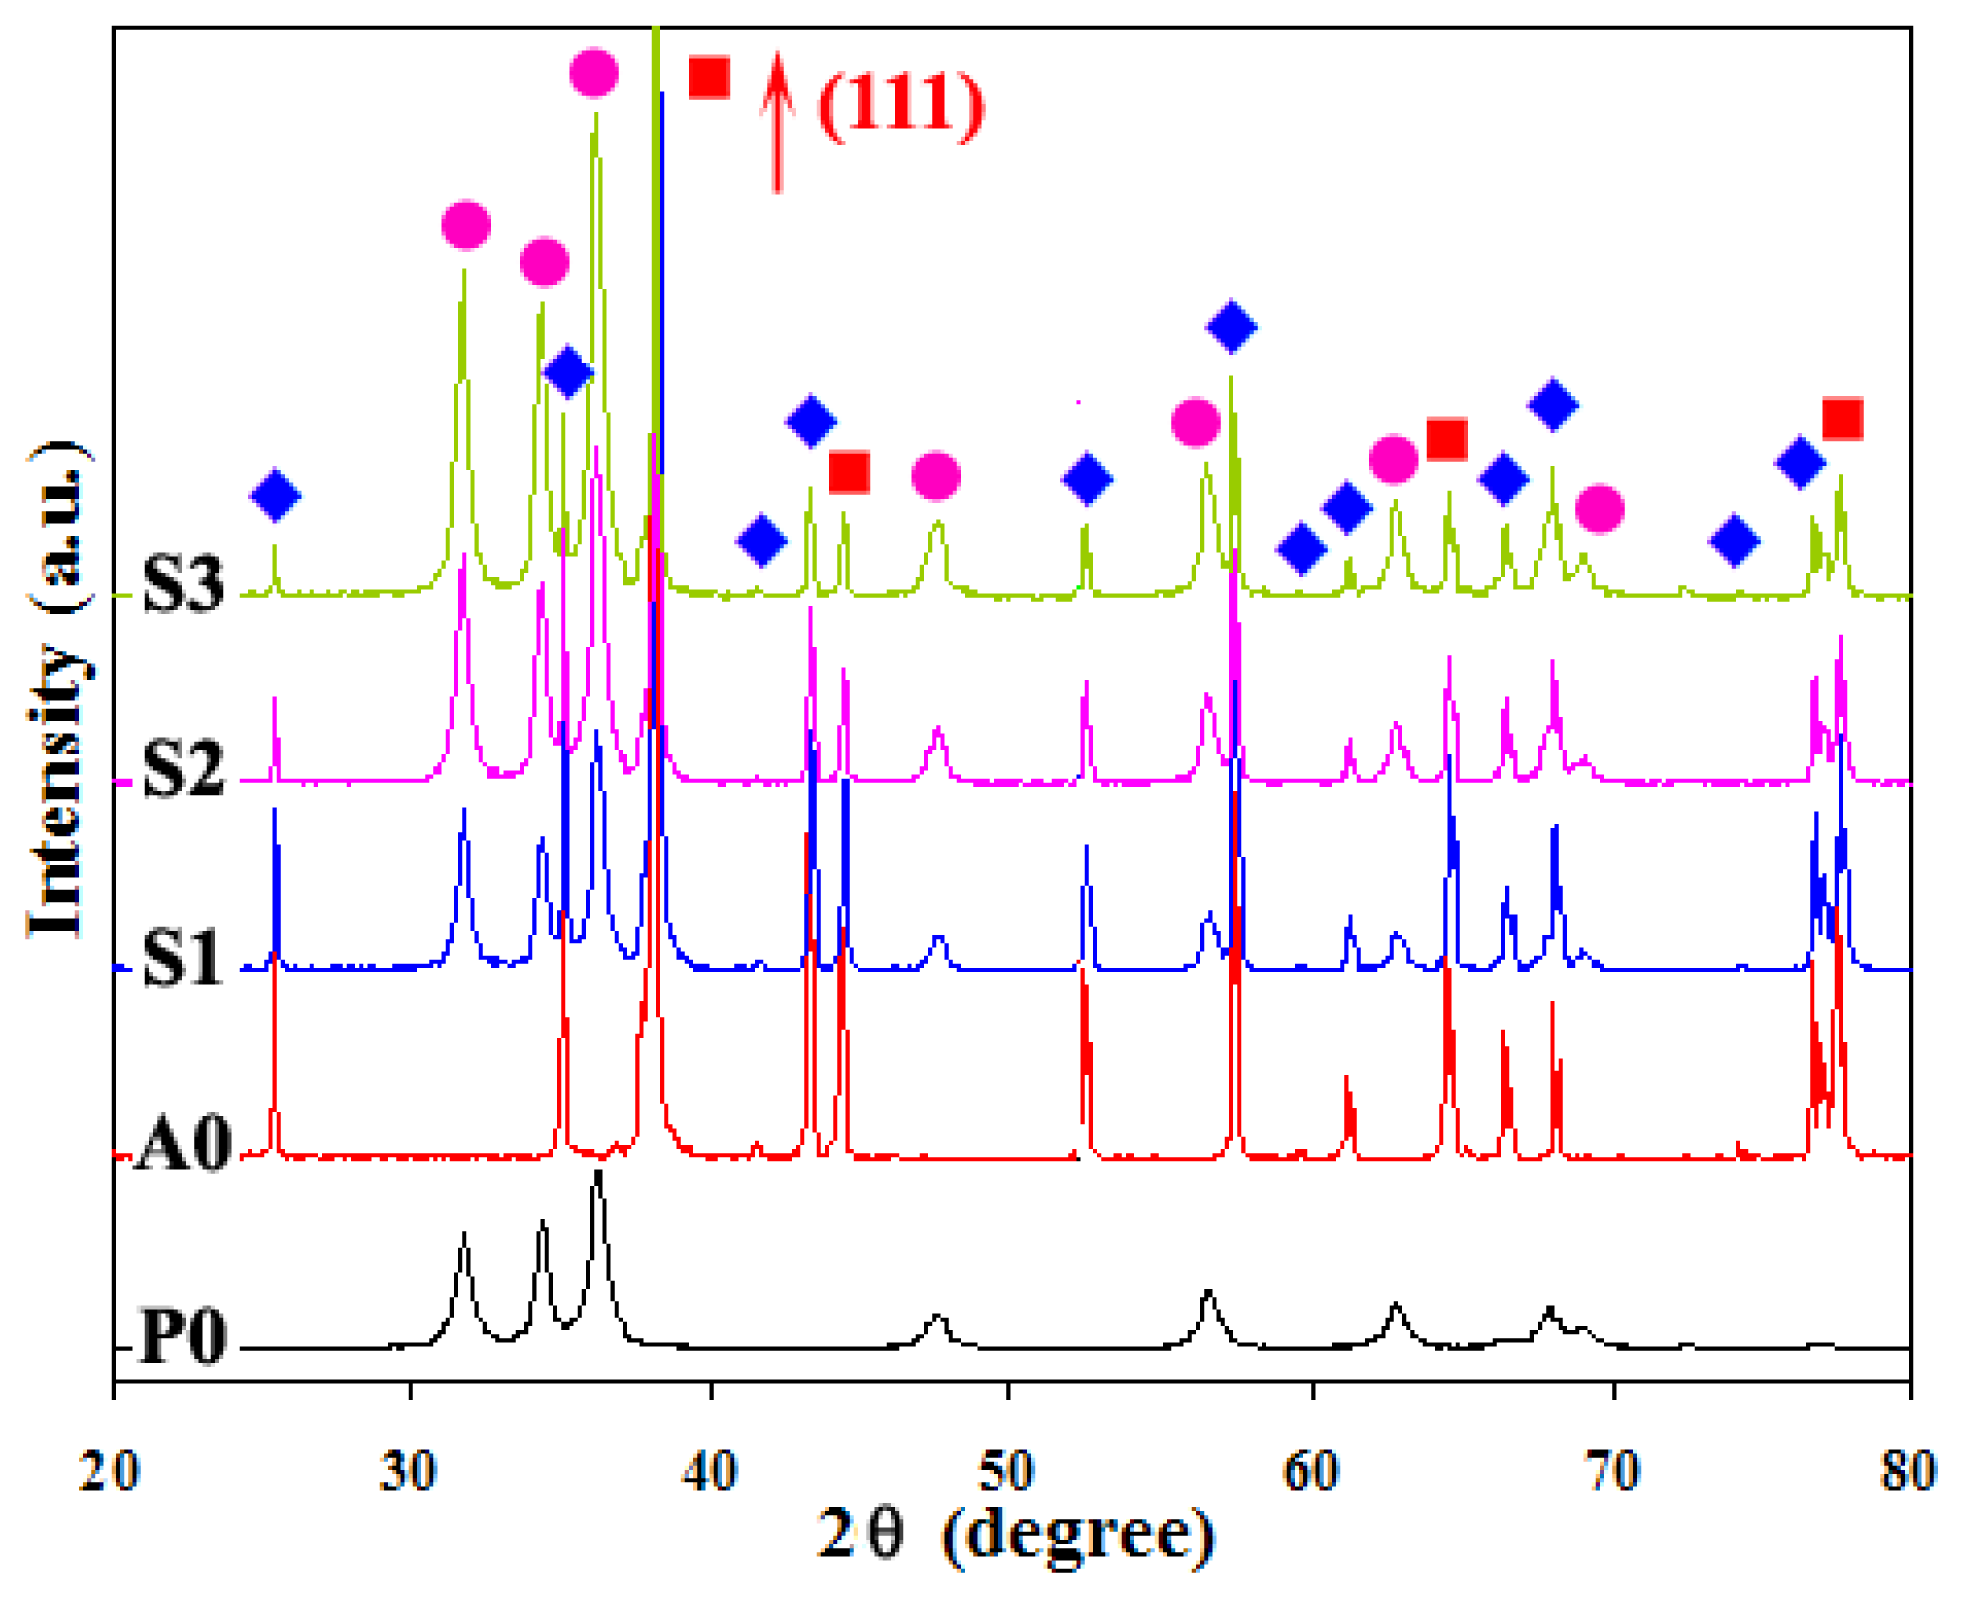
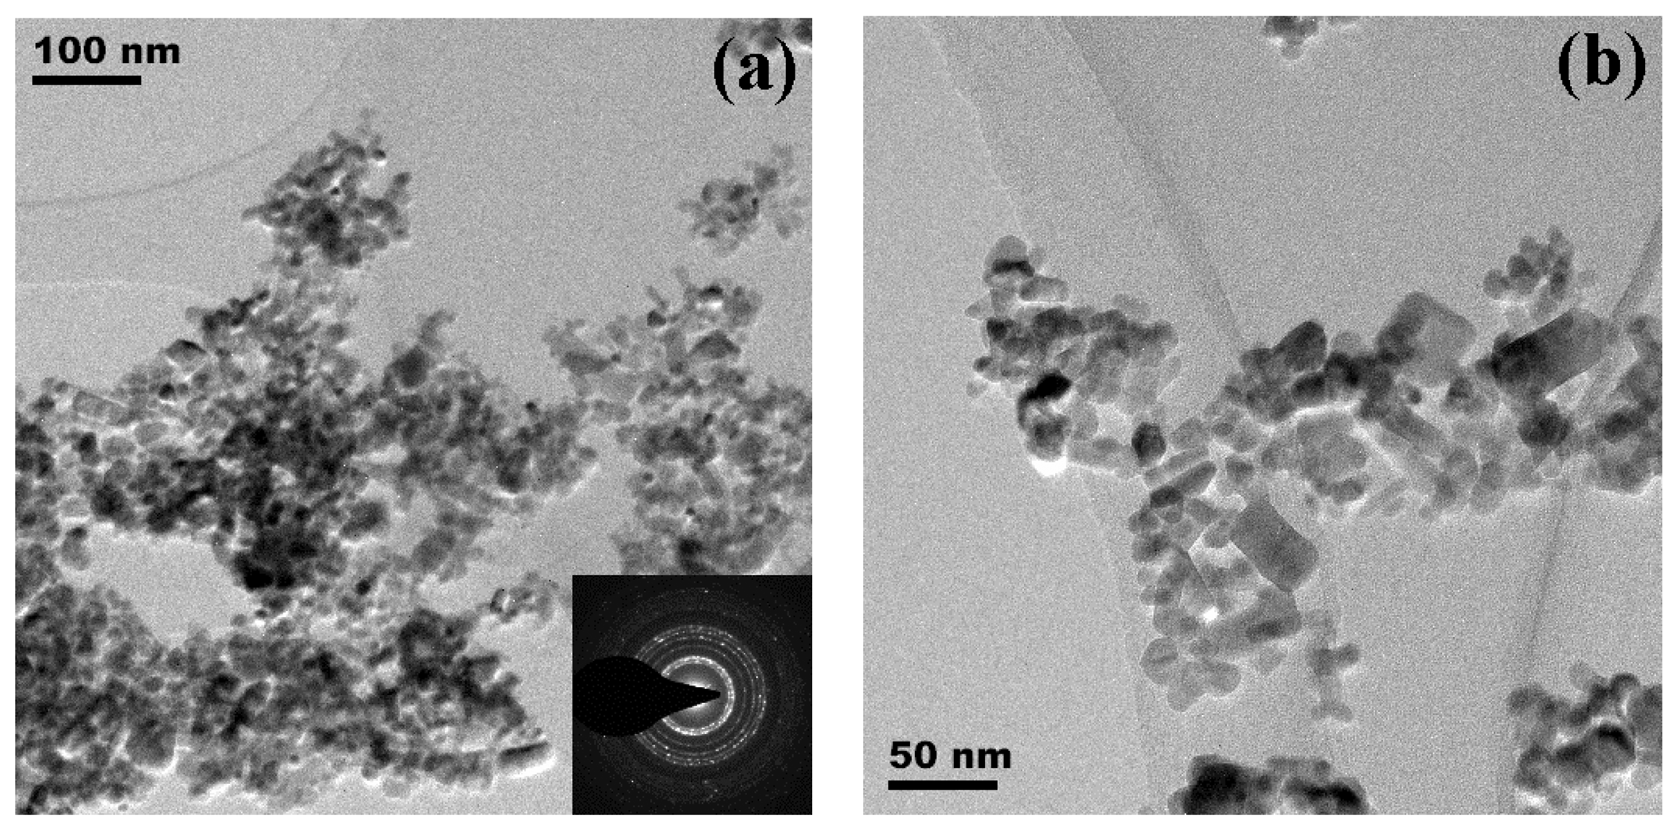
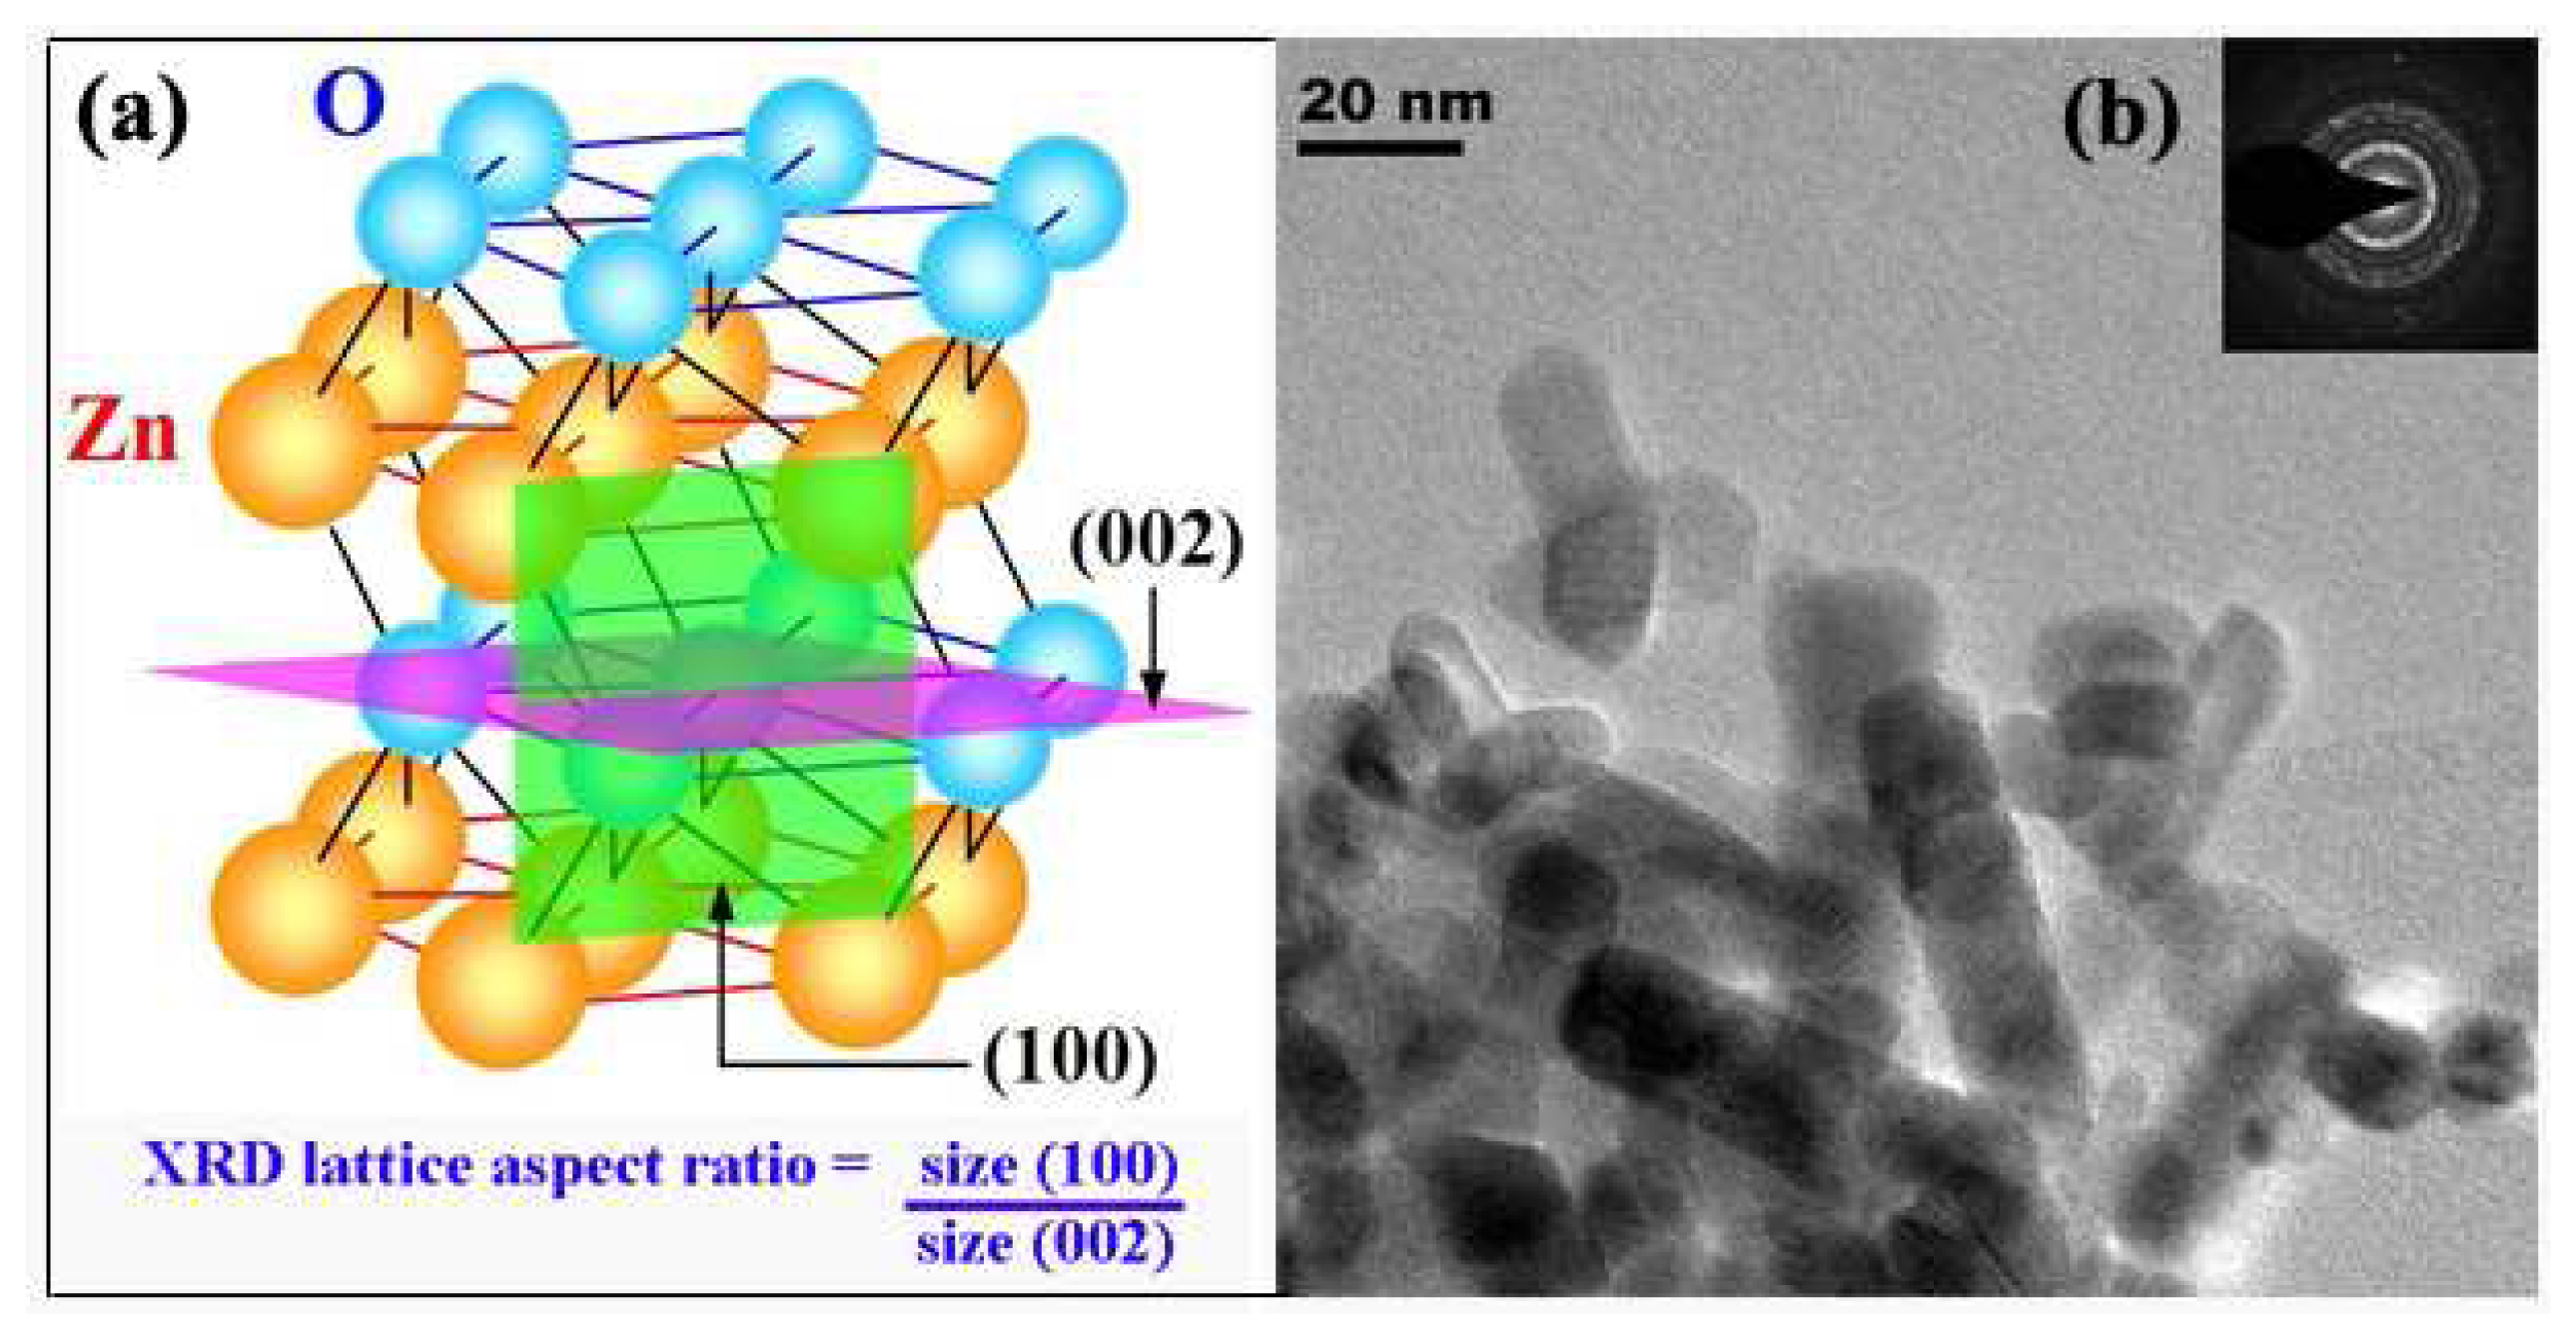
3.1. Particles Properties

Fig. 4 shows the XRD patterns of samples as-prepared (P0), Au/Al2O3 substrate (A0), and sensors after annealing and sensing test at 400°C (S1, S2, and S3). The samples P0 were highly crystalline, and all peaks can be confirmed to be the hexagonal structure of ZnO (Inorganic Crystal Structure Database [ICSD] Coll. Code: 067454 [60]), which also match well with the model by Abrahams et al. [61]. The diffraction peaks were slightly sharp for sensor samples S1, S2, and S3 as compared to sample P0, suggesting relatively larger particles. The diffraction patterns of Al2O3 (modified structural parameters of ICSD Coll. Code: No. 085137 [62]) (filled diamonds) and Au (modified structural parameters of ICSD Coll. CAS No. 7440-57-5 [63]) (filled rectangular) from the substrates are also visible in the A0, S1, S2, and S3, especially, the sensors S1, S2, and S3 showed ZnO peaks (filled circles) which confirm the ZnO thick film sensing layer doctor-bladed on Au/Al2O3 substrates, and also the Au (111) peak showed the strongest peak in terms of intensity. The average crystal sizes (dXRD ave.) were calculated by the fundamental parameter approach Rietveld method [57] based on the half-maximum widths of Sherrer's equation [64] using the TOPAS-3 software, which compared with the average BET- equivalent particle diameter (dBET). The small particles sizes can be predicted from the diffraction broad peaks. The diffraction peaks were slightly sharp for sensor S1, S2, and S3 after sensing at 400°C as compared to sample P1 (P1, SSA=63.8 m2/g, dBET=16.8 nm, dXRD ave.=18.3 nm). Nevertheless, accurate particles size and the morphology of nanoparticles can be confirmed by TEM bright-field images.
Fig. 5 (a, b) show bright-field TEM images of samples P0 were observed at the different magnifications. The corresponding diffraction patterns are shown in the insets. The diffraction patterns illustrating spot patterns of the hexagonal structure of ZnO, indicated that the ZnO nanoparticles are highly crystalline, which is in good agreement with the XRD data. The flame made ZnO nanoparticles can be observed as particles having the clear rod-like, hexagonal, and spheroidal shape. Fig. 5 (b) shows the morphologies of flame made (5/5) ZnO nanoparticle contains mainly spheroidal particles typically with diameters ranging from 10-20 nm with occasional hexagonal and rod-like particles. The crystalline sizes of ZnO hexagonal particles were in the range of 10-20 nm, and nanorod-like particles were in the range of 10-20 nm in width, 20-50 nm in length. The morphology can be clearly seen the ZnO nanorods particles as shown in Fig. 6 (b). This is consistent with Tani et al. [25] and Height et al. [26, 27].
ZnO nanorods formation can be described by XRD lattice aspect ratio [26] based on the ZnO wurtzite hexagonal structure. ZnO wurtzite hexagonal structure consists of the alternating planes of Zn and O stacking and the corresponding nanorods morphology as also shown in Fig. 6 (a) and (b). The (002) plane lies in parallel to the O and Zn planes, while the (100) plane lies in perpendicular to the (002) plane, intersecting alternating layers of Zn and O. The crystallite sizes calculated by (100) and (002) planes from XRD peak fitting were used to roughly calculate the XRD lattice aspect ratio, which essentially considered as a metrics of “Length” (L), and “Diameter” (D), respectively. The crystallite sizes ratio (L/D) can be designated as an aspect ratio.

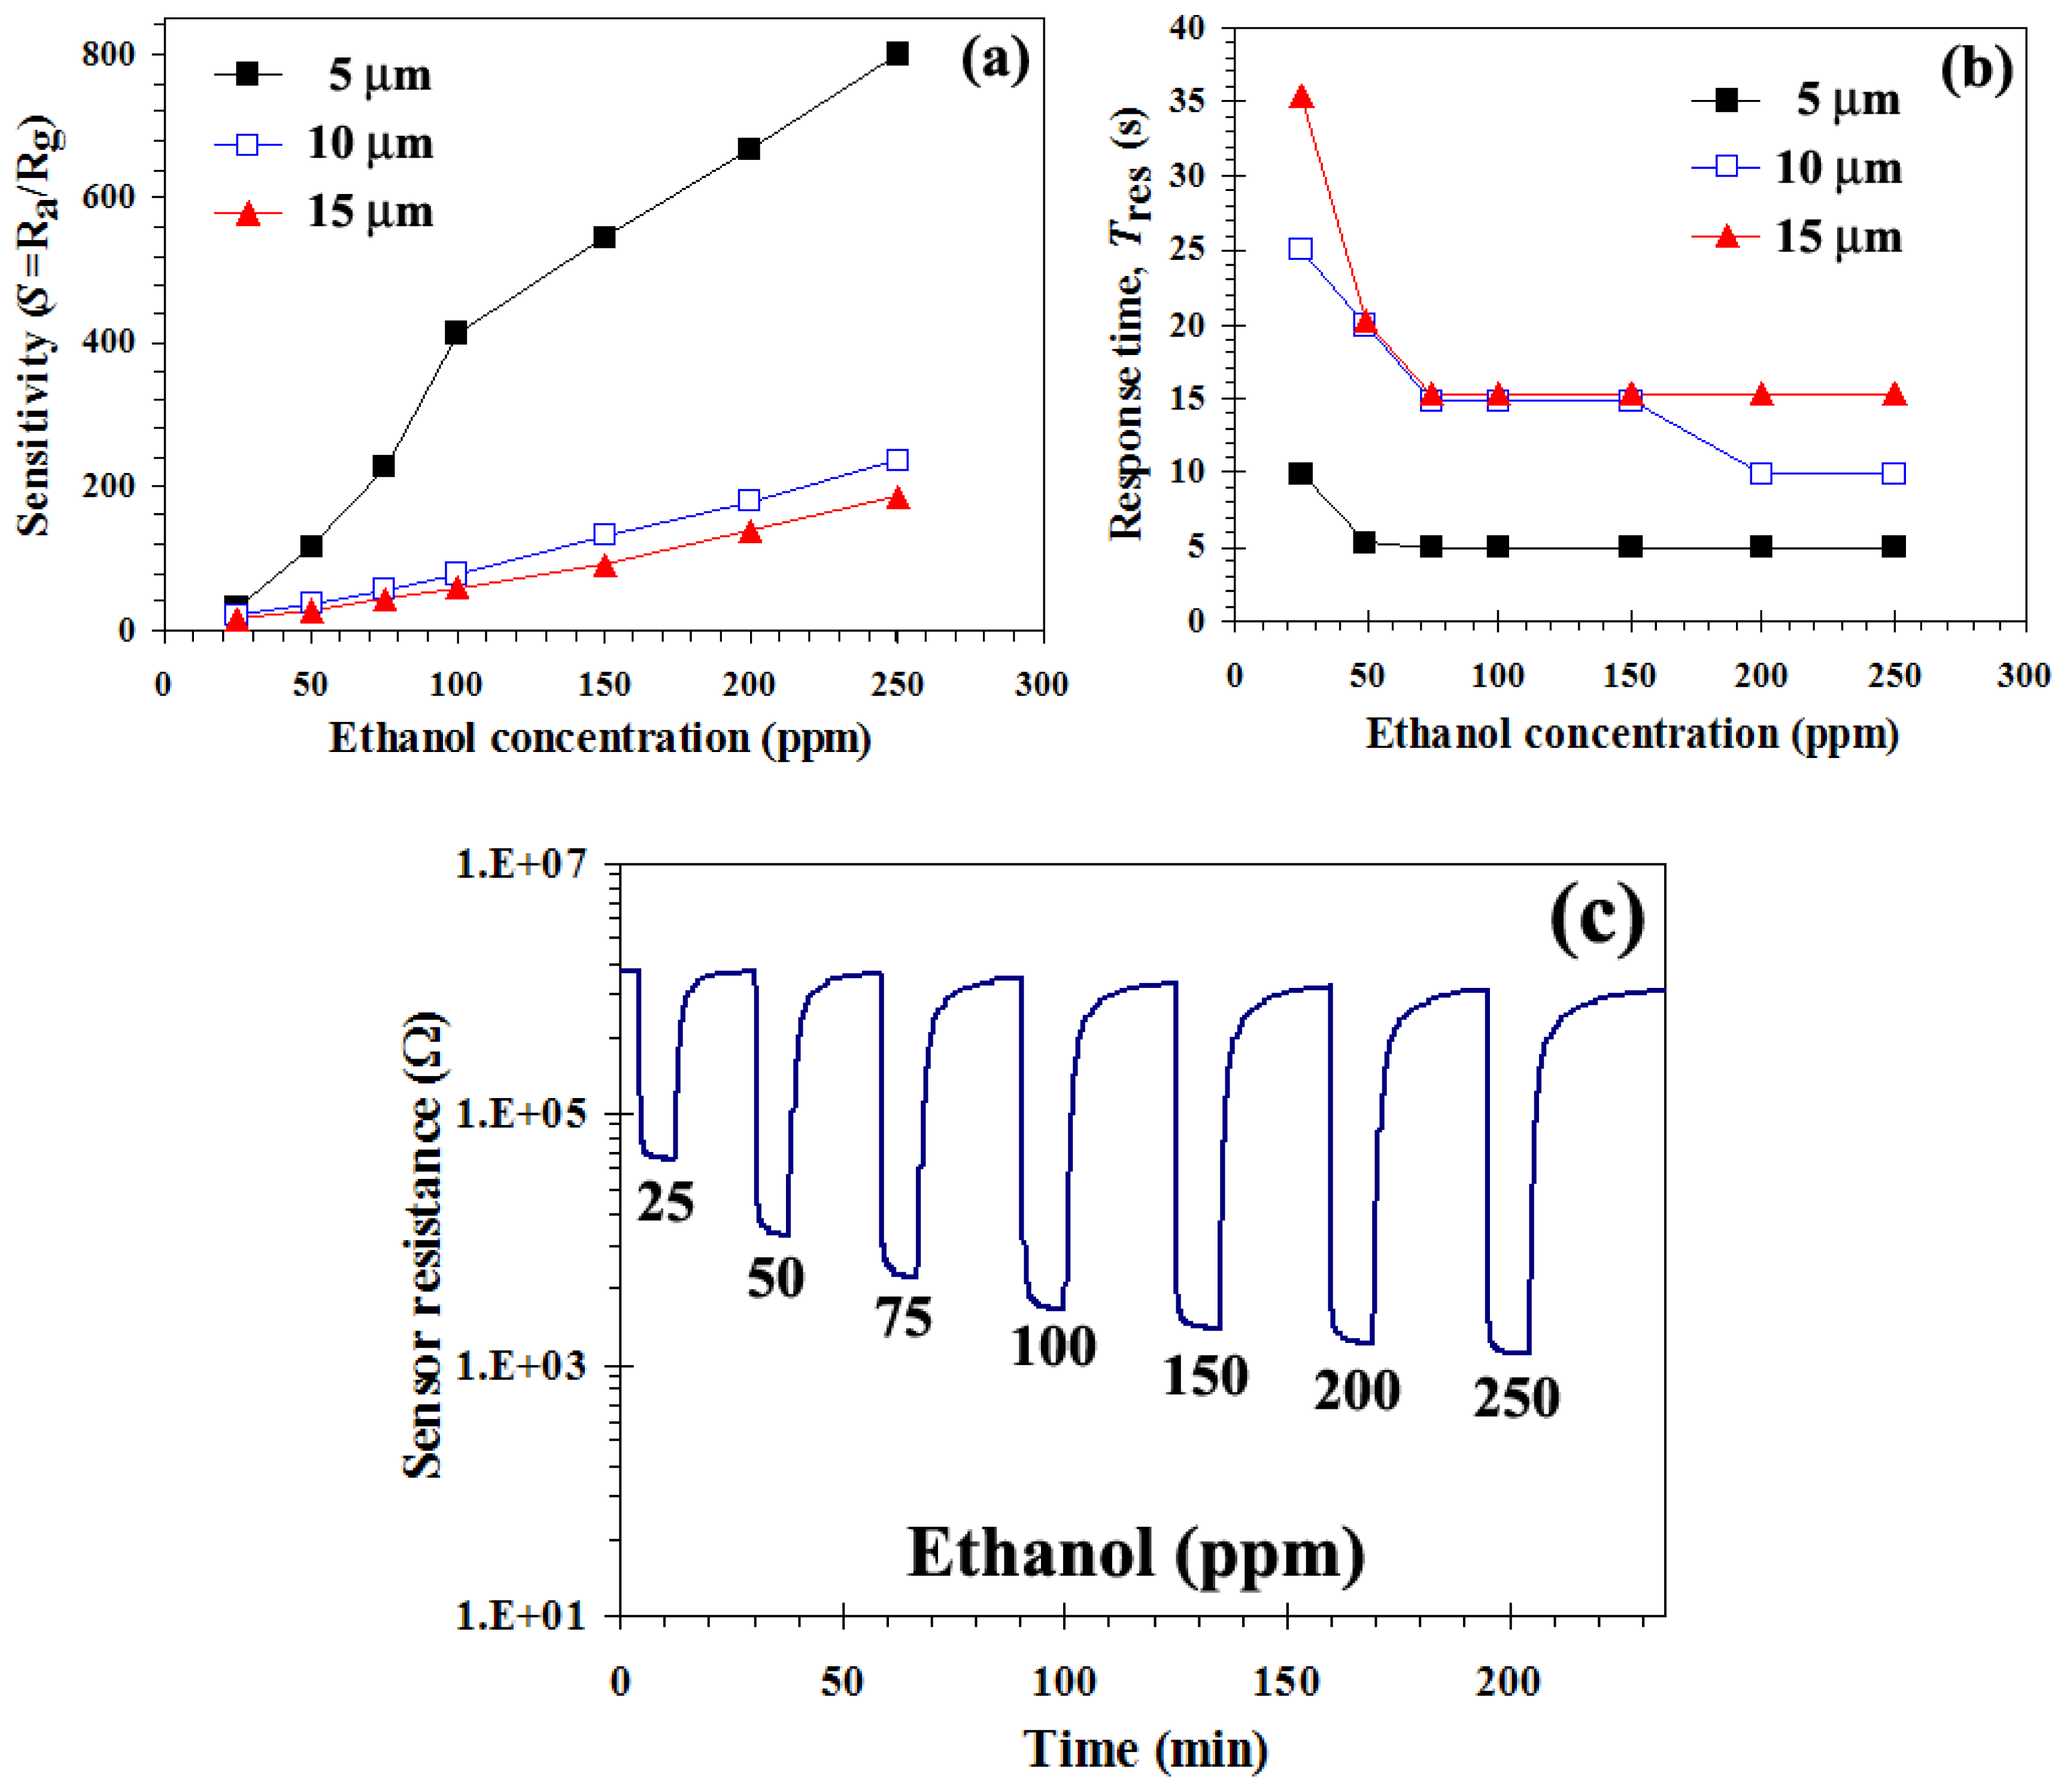
3.2. Gas Sensing Properties

Fig. 7 (a) and (b) shows the sensitivity (S) and response time (Tres) versus the ethanol concentration ranging from 25-250 ppm plot for the sensors S1 (filled triangles), S2 (open rectangles), and S3 (filled triangles) with various film thicknesses during forward cycle towards reducing gas ethanol at sensing operating temperature of 400°C. The sensitivities of all sensors were found to increase rather linearly with increasing ethanol concentrations. As the film thickness increases from 5 to 15 μm, it can be clearly seen that at the thinnest sensing film (S1) can improve the sensor behaviors in terms of sensitivity and response times, which evidently shown better than S2, and S3. Better response should be expected for larger concentration of reducing gas adsorbed, because the reaction between the adsorbed reducing gas and oxygen species becomes more favorable. The sensor S1 has the best sensitivity (to 250 ppm, S=801). Further increase of the film thicknesses deteriorates the sensitivity (Fig. 7 (a)) and response time (Fig. 7 (b)). The sensor S1 showing the fastest response to ethanol vapor, whereas a thicker sensing films affected to the response of the sensors were slightly sluggish. For sensor S1, the response time, Tres, was within a few seconds and rather constantly responded with increasing ethanol concentration (in the order of 5 s). The response time: Tres was 10 and 5 s at 25 and 250 ppm, respectively. The trend of Trec was so long within minutes. Comparing with the same material references which reported by Liu et al. [3], these sensors produced from flame-made ZnO nanoparticles have higher sensitivity and shorter response times than those made from ZnO single crystal flakes with different sizes and morphology of particles (to 300 ppm, S=14.3, Tres=62 s). Also Zhu et al. [11] reported that ZnO nanorods and needle-shaped had a sensor response to 100 ppm of ethanol at 420°C of 12. For the comparison with doping material, Zhu et al. [10] reported that the highest sensing behaviors to ethanol was at 370°C of pure ZnO (to 100 ppm, S=15) and ZnO incorporated with 10 wt%TiO2 (to 100 ppm, S=50, and to 200 ppm, S= 80) sensor. It can be clearly seen that high purity of flame made ZnO nanoparticles show very high sensitivity and also fast response time at the highest ethanol concentration.

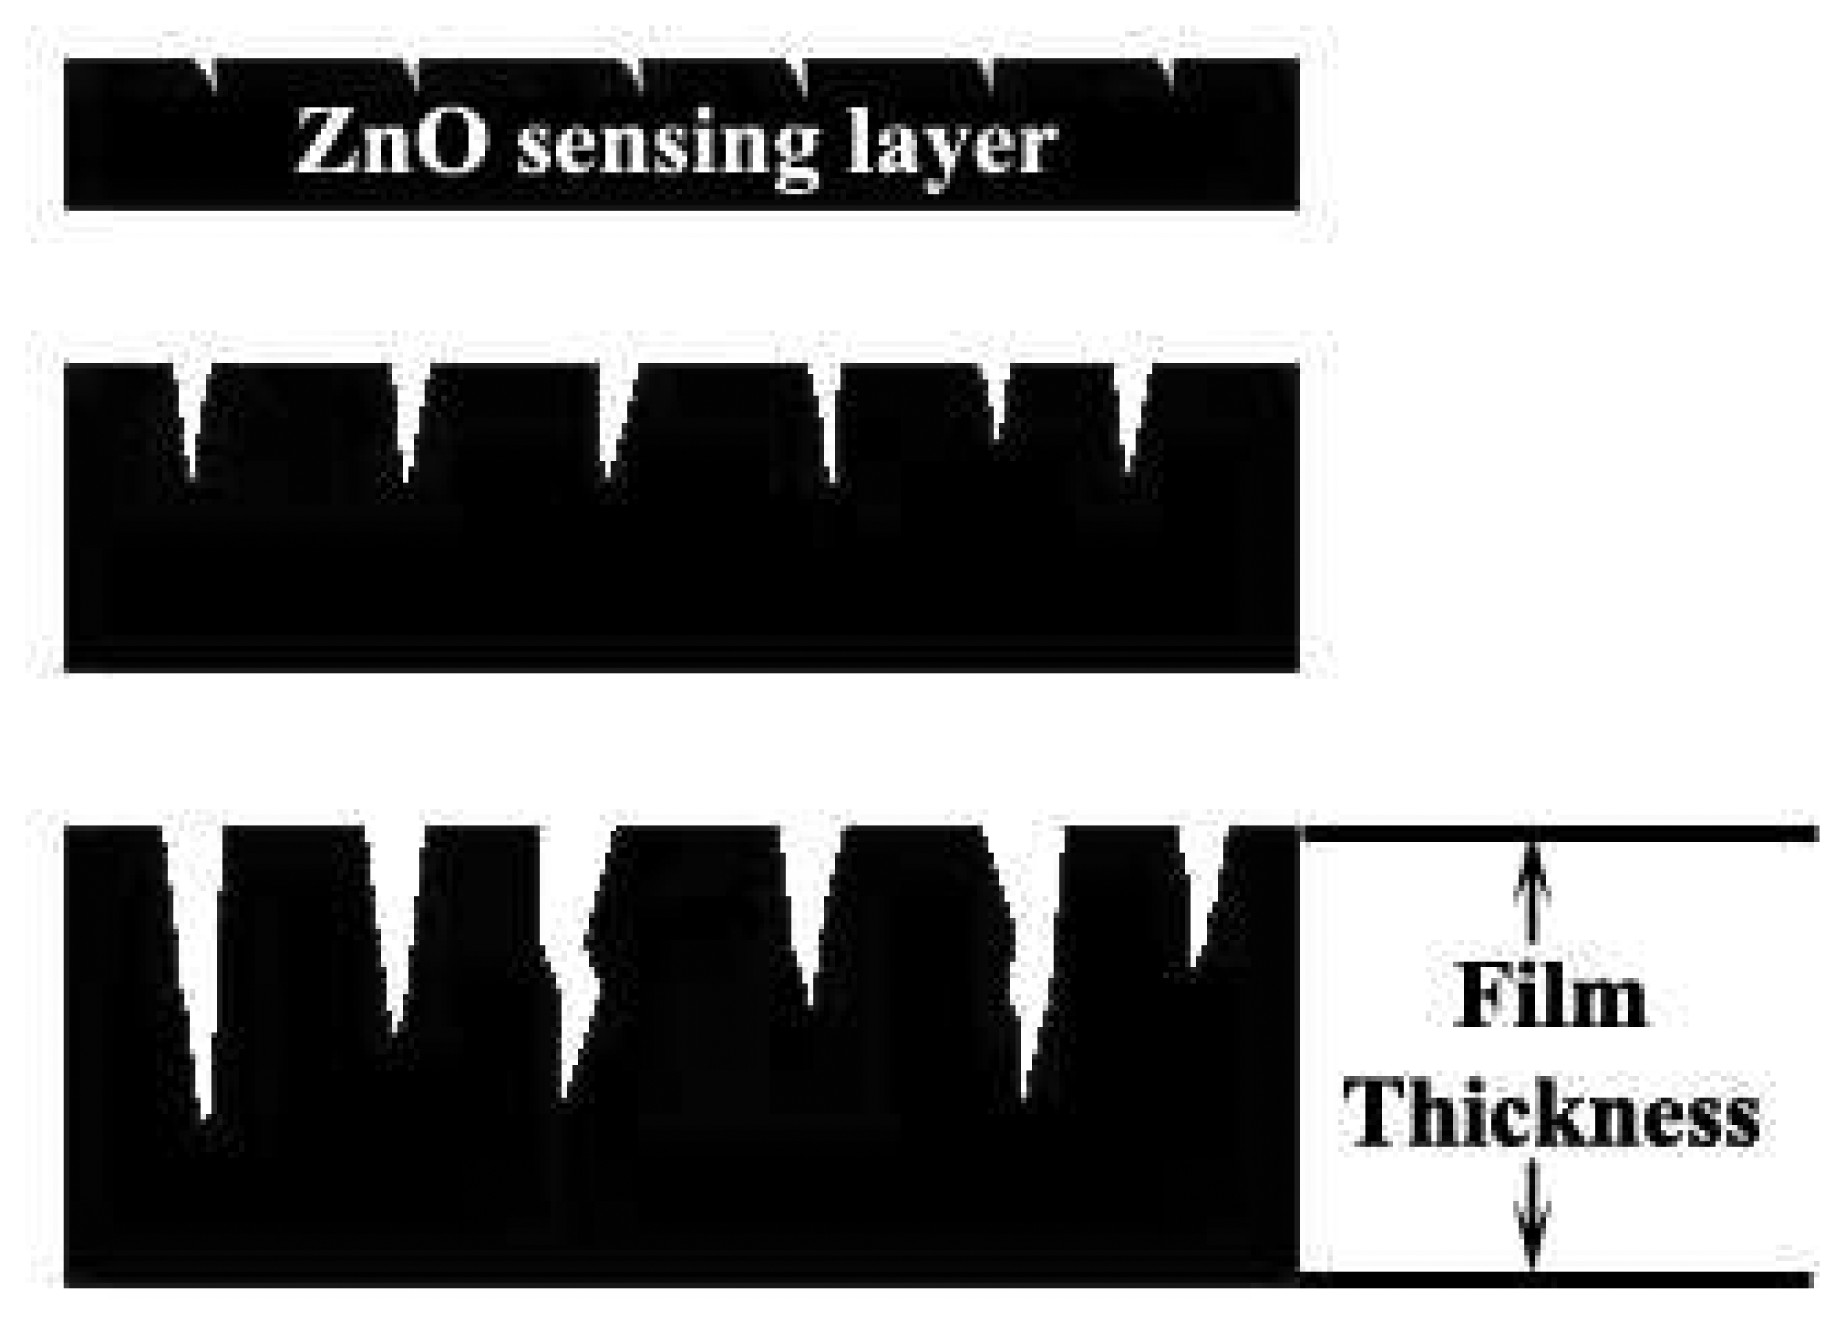
3.4. Film Thickness Sensing Layer

The cracking formation depended on film thickness sensing layer with rough controlling of sensor S1, S2, and S3. It was found that the film thicknesses increased with increasing crack widths. This is because of several cracking phenomena assumptions, such as the cracks between large grains formed as the small grains became closer and agglomerated at the heating temperature, and got shrinkage while undergoing the cooling process. Cracks increased with increasing film thickness because large grains or crack gaps caused the decreasing in the surface area, connectivity of films and deteriorating film properties of the electronic materials. Fig. 8 shows a speculation on how the morphology changes with increasing film thickness. Cracks showed up when the films shrank as a result of grain growth in the annealing process. It is suspected that the cracks do not penetrate through the film down to the bottom. Cracking formation can be formed with the difference in the thermal expansion coefficient mismatch between substrate, materials. Thicker sensing films caused these cracks, were related directly to tensile stress caused in the film thicker than the critical thickness. It has been found that a thicker film showed more cracks phenomena than thinner film.
The cross-section, film thickness, and surface morphology of the sensing film layer (S1, S2, S3) after sensing test at 400°C were observed using SEM analysis with different magnifications as shown in Fig. 9. The film thickness of sensing film was approximately 5, 10, and 15 μm as shown in Fig. 9 (a), (b), and (c), respectively, which benefited tremendously to ethanol gas sensing properties. The high density Al2O3 substrate interdigitated with Au electrodes was also visible. After annealing process, a denser film layer was formed.
Fig. 10 (a) shows SEM images of sample S3. The image shows the selected regions of ZnO sensing layer (region 1) together with Au electrodes (region 2). Insets give the EDS elemental composition signal associated which each of regions as indicated. Region 1 and 2 emphasized clearly yield a signal corresponding to Zn, O, and Au. It can be clearly seen that the ZnO sensing layer doctor-bladed on the sensor substrate.

4. Conclusions

The flame-made (5/5) ZnO nanoparticles used as the ethanol gas sensors were successfully produced by flame spray pyrolysis. The XRD patterns show that the particles correspond to hexagonal phase of ZnO, and also the corresponding Al2O3, Au, and ZnO peak were evidently seen from the flame made ZnO nanoparticles printed on Al2O3 substrate interdigitated with Au electrodes after annealing and sensing test at 400°C used as an ethanol sensor. The dXRD average sizes calculated using conspicuous peaks based on XRD fitting of flame made ZnO as-prepared and after annealing and sensing test at 400°C were found to slightly change. The morphologies of ZnO nanoparticles was observed to be mainly spheroidal particles typically with diameters ranging from 10-20 nm with occasional hexagonal and rod-like particles. The crystalline sizes of ZnO hexagonal particles were found to be in the range of 10-20 nm, and nanorod-like particles were found to be ranging from 10-20 nm in width and 20-50 nm in length. ZnO thick sensing films were prepared by doctor-blade technique in film thickness ranging from 5 to 15 μm. The sensor characteristics to reducing ethanol gas showed remarkable dependence on the film thickness. The film thickness has effects on the sensor characteristics. The sensitivity and response time drastically increased and decreased with decreasing the film thicknesses. It can be observed the film thickness increased with increasing crack width which decrease the surface area and connectivity of films and deteriorate film properties of electronic materials. For the sensor test, the thinnest sensing film (5 μm) ZnO films showed tremendous sensing characteristics such as the highest sensitivity and the fastest response times (to 250 ppm, S=801, Tres = 5 s). The sensing characteristics were deteriorated evidently with increasing film thicknesses. The recovery times were quite long within minutes.

Acknowledgments

The authors gratefully acknowledge the financial support from the Commission on Higher Education, Ministry of Education; the Graduate School, Chiang Mai University, Thailand, and the Particles Technology Laboratory (PTL), Department of Mechanical and Process Engineering, ETH Zentrum, Switzerland for experimental facilities.

References

  1. Liewhiran, C.; Seraphin, S.; Phanichphant, S. Synthesis of nano-sized ZnO powders by thermal decomposition of zinc acetate using Broussonetia papyrifera (L.) Vent pulp as a dispersant. Curr. Appl. Phys. 2006, 6, 499–502. [Google Scholar]
  2. Purica, M.; Budianu, E.; Rusu, E.; Danila, M.; Gavrila, R. Optical and structural investigation of ZnO thin films prepared by chemical vapor deposition (CVD). Thin Solid Films 2002. [Google Scholar]
  3. Liu, Y.; Dong, J.; Hesketh, P.J.; Liu, M. Synthesis and gas sensing properties of ZnO single crystal flakes. J. Mater. Chem. 2005, 15, 2316–2320. [Google Scholar]
  4. Xiangfeng, C.; Dongli, J.; Djurišic, A.B.; Leung, Y.H. Gas-sensing properties of thick film based on ZnO nano-tetrapods. Chem. Phys. Lett. 2005, 401, 426–429. [Google Scholar]
  5. Sahay, P.P.; Tewari, S.; Jha, S.; Shamsuddin, M. Sprayed ZnO thin films for ethanol sensor. J. Mater. Sci. 2005, 40, 4791–4793. [Google Scholar]
  6. Xu, J.; Chen, Y.; Li, Y.; Shen, J. Gas sensing properties of ZnO nanorods prepared by hydrothermal method. J. Mater. Sci. 2005, 40, 2919–2921. [Google Scholar]
  7. Wan, Q.; Li, Q.H.; Chen, Y.J.; He, X.L.; Li, J.P.; Lin, C.L.; Wang, T.H. Fabrication and ethanol sensing characteristics of ZnO nanowire gas sensors. Appl. Phys. Lett. 2004, 84, 3654–3656. [Google Scholar]
  8. Xu, J.; Pan, Q.; Shun, Y.; Tian, Z. Grain size control and gas sensing properties of ZnO gas sensor. Sens. Actuators B 2000, 66, 277–279. [Google Scholar]
  9. Xu, H.; Liu, X.; Cui, D.; Li, M.; Jiang, M. A novel method for improving the performance of ZnO gas sensors. Sens. Actuators B 2006, 114, 301–307. [Google Scholar]
  10. Zhu, B.L.; Xie, C.S.; Wang, W.Y.; Huang, K.J.; Hu, J.H. Improvement in gas sensitivity of ZnO thick film to volatile organic compounds (VOCs) by adding TiO2. Mater. Lett. 2004, 58, 624–629. [Google Scholar]
  11. Zhu, B.L.; Zeng, D.W.; Wu, J.; Song, W.L.; Xie, C.S. Synthesis and gas sensitivity of In-doped ZnO nanoparticles. J. Mater. Sci. - Mater. Electron. 2003, 14, 521–526. [Google Scholar]
  12. Rao, B.B. Zinc oxide ceramic semi-conductor gas sensor for ethanol vapour. Mater. Chem. Phys. 2000, 64, 62–65. [Google Scholar]
  13. Baruwati, B.; Kumar, D.K.; Manorama, S.V. Hydrothermal synthesis of highly crystalline ZnO nanoparticles: A competitive sensor for LPG and EtOH. Sens. Actuators B 2006, 119, 676–682. [Google Scholar]
  14. Stambolova, I.; Konstantinov, K.; Vassilev, S.; Peshev, P.; Tsacheva, Ts. Lanthanum doped SnO2 and ZnO thin films sensitive to ethanol and humidity. Mater. Chem. Phys. 2000, 63, 104–108. [Google Scholar]
  15. Rout, C.S.; Krishna, S.H.; Vivekchand, S.R.C.; Govindaraj, A.; Rao, C.N.R. Hydrogen and ethanol sensors based on ZnO nanorods, nanowires and nanotubes. Chem. Phys. Lett. 2005, 418, 582–586. [Google Scholar]
  16. Paraguay, F.D.; Yoshida, M.M.; Morales, J.; Solis, J.; Estrada, W.L. Influence of Al, In, Cu, Fe and Sn dopants on the response of thin films ZnO gas sensor to ethanol vapour. Thin Solid Films 2000, 373, 137–140. [Google Scholar]
  17. Raju, A.R.; Rao, C.N.R. Gas-sensing characteristics of ZnO and copper-impregnated ZnO. Sens. Actuators B 1991, 3, 305–310. [Google Scholar]
  18. Shen, W.; Zhao, Y.; Zhang, C. The preparation of ZnO based gas-sensing thin films by ink-jet printing method. Thin Solid Films 2005, 483, 382–387. [Google Scholar]
  19. Xu, J.; Chen, Y.; Chen, D.; Shen, J. Hydrothermal synthesis and gas sensing characters of ZnO nanorods. Sens. Actuators B 2006, 113, 526–531. [Google Scholar]
  20. Mueller, R.; Mädler, L.; Pratsinis, S.E. Nanoparticle synthesis at high production rates by flame spray pyrolysis. Chem. Eng. Sci. 2003, 58, 1969–1976. [Google Scholar]
  21. Mädler, L. Liquid-fed aerosol reactors for one-step synthesis of nano-structured particles. KONA 2004, 22, 107–120. [Google Scholar]
  22. Mädler, L.; Kammler, H.K.; Mueller, R.; Pratsinis, S.E. Controlled synthesis of nanostructured particles by flame spray pyrolysis. J. Aeros. Sci. 2002, 33, 369–389. [Google Scholar]
  23. Kammler, H.K.; Mädler, L.; Pratsinis, S.E. Flame synthesis of nanoparticles. Chem. Eng. Tech. 2001, 24, 583–596. [Google Scholar]
  24. Mädler, L.; Stark, W.J.; Pratsinis, S.E. Rapid synthesis of stable ZnO quantum dots. J. Appl. Phys. 2002, 92, 6537–6540. [Google Scholar]
  25. Tani, T.; Mädler, L.; Pratsinis, S.E. Homogeneous ZnO nanoparticles by flame spray pyrolysis. J. Nanopart. Res. 2002, 4, 337–343. [Google Scholar]
  26. Height, M.J.; Mädler, L.; Krumeich, F.; Pratsinis, S.E. Nanorods of ZnO made by flame spray pyrolysis. Chem. Mater. 2006, 18, 572–578. [Google Scholar]
  27. Height, M.J.; Pratsinis, S.E.; Mekasuwandumrong, O.; Praserthdam, P. Ag-ZnO catalysts for UV-photodegradation of methylene blue. Appl. Catal., B 2005, 63, 305–312. [Google Scholar]
  28. Sahm, T.; Mädler, L.; Gurlo, A.; Barsan, N.; Pratsinis, S.E.; Weimar, U. Flame spray synthesis of tin dioxide nanoparticles for gas sensing. Sens. Actuators B 2004, 98, 148–153. [Google Scholar]
  29. Neri, G.; Bonavita, A.; Micali, G.; Donato, N.; Deorsola, F.A.; Mossino, P.; Amato, I.; Benedetti, B.D. Ethanol sensors based on Pt-doped tin oxide nanopowders synthesised by gel-combustion. Sens. Actuators B 2006, 117, 196–204. [Google Scholar]
  30. Li, F.; Xu, J.; Yu, X.; Chen, L.; Zhu., J.; Yang, Z.; Xin, X. One-step solid-state reaction synthesis and gas sensing property of tin oxide nanoparticles. Sens. Actuators B 2002, 81, 165–169. [Google Scholar]
  31. Rella, R.; Serra, A.; Siciliano, P.; Vasanelli, L.; De, G.; Licciulli, A.; Quirini, A. Tin oxide-based gas sensors prepared by the sol-gel process. Sens. Actuators B 1997, 44, 462–467. [Google Scholar]
  32. Maekawa, T.; Tamaki, J.; Miura, N.; Yamazoe, N. Development of SnO2-based ethanol gas sensor. Sens. Actuators B 1992, 9, 63–69. [Google Scholar]
  33. Gautheron, B.; Labeau, M.; Delabouglise, G.; Schmatz, U. Undoped and Pd-doped SnO2thin films for gas sensors. Sens. Actuators B 1993, 15-16, 357–362. [Google Scholar]
  34. Ivanov, P.; Hubalek, J.; Prášek, K.; Vilanova, X.; Llobet, E.; Correig, X. A route toward more selective and less humidity sensitive screen-printed SnO2 and WO3 gas sensitive layers. Sens. Actuators B 2004, 100, 221–227. [Google Scholar]
  35. Tan, O.K.; Cao, W.; Zhu, W.; Chai, J.W.; Pan, J.S. Ethanol sensors based on nano-sized α-Fe2O3 with SnO2, ZrO2, TiO2 solid solutions. Sens. Actuators B 2003, 93, 396–401. [Google Scholar]
  36. Xiangfeng, C.; Caihong, W.; Dongli, J.; Chenmou, Z. Ethanol sensor based on indium oxide nanowires prepared by carbothermal reduction reaction. Chem. Phys. Lett. 2004, 399, 461–464. [Google Scholar]
  37. Makhija, K.K.; Ray, A.; Patel, R.M.; Trivedi, U.B.; Kapse, H.N. Indium oxide thin film based ammonia gas and ethanol vapour sensor. Bull. Mater. Sci. 2005, 28, 9–17. [Google Scholar]
  38. Teleki, A.; Pratsinis, S.E.; Kalyanasundaram, K.; Gouma, P.I. Sensing of organic vapors by flame-made TiO2 nanoparticles. Sens. Actuators B 2006, 119, 683–690. [Google Scholar]
  39. Sberveglieri, G.; Comini, E.; Faglia, G.; Atashbar, M.Z.; Wlodarski, W. Titanium dioxide thin films prepared for alcohol microsensor applications. Sens. Actuators B 2000, 66, 139–141. [Google Scholar]
  40. Mabrook, M.; Hawkins, P. A rapidly-responding sensor for benzene, methanol and ethanol vapours based on films of titanium dioxide dispersed in a polymer operating at room temperature. Sens. Actuators B 2001, 75, 197–202. [Google Scholar]
  41. Ruiz, A.M.; Cornet, A.; Morante, J.R. Performances of La-TiO2nanoparticles as gas sensing material. Sens. Actuators B 2005, 111-112, 7–12. [Google Scholar]
  42. Galatsis, K.; Li, Y.X.; Wlodarski, W.; Comini, E.; Sberveglieri, G.; Cantalini, C.; Santucci, S.; Passacantando, M. Comparison of single and binary oxide MoO3, TiO2 and WO3 sol-gel gas sensors. Sens. Actuators B 2002, 83, 276–280. [Google Scholar]
  43. Zhang, J.; Liu, J.; Peng, Q.; Wang, X.; Li, Y. Nearly monodisperse Cu2O and CuO nanospheres: Preparation and applications for sensitive gas sensors. Chem. Mater. 2006, 18, 867–871. [Google Scholar]
  44. Dayan, N.J.; Karekar, R.N.; Aiyer, R.C.; Sainkar, S.R. Effect of film thickness and curing temperature on the sensitivity of ZnO:Sb thick-film hydrogen sensor. J. Mater. Sci. - Mater. Electron. 1997, 8, 277–279. [Google Scholar]
  45. Zheng, L.; Xu, T.; Li, G.; Yin, Q. Influence of thickness on oxygen-sensing properties of TiO2 thin films on Al2O3. Jpn. J. Appl. Phys., Part 1 2002, 41, 4655–4658. [Google Scholar]
  46. Lee, Y.L.; Sheu, C.Y.; Hsiao, R.H. Gas sensing characteristics of copper phthalocyanine films; effects of film thickness and sensing temperature. Sens. Actuators B 2004, 99, 281–287. [Google Scholar]
  47. Cheng, X.L.; Zhao, H.; Huo, L.H.; Gao, S.; Zhao, J.G. ZnO nanoparticulate thin film: preparation, characterization and gas-sensing property. Sens. Actuators B 2004, 102, 248–252. [Google Scholar]
  48. Hossein-Babari, F.; Orvatinia, M. Analysis of thickness dependence of the sensitivity in thin film resistive gas sensors. Sens. Actuators B 2003, 89, 256–261. [Google Scholar]
  49. Geistlinger, H. Electron theory of thin-film gas sensors. Sens. Actuators B 1993, 17, 47–60. [Google Scholar]
  50. López, M.A.R.; Peiteado, M.; Fernández, J.F.; Caballero, A.C.; Holc, J.; Drnovsek, S.; Kuscer, D.; Macek, S.; Kosec, M. Thick film ZnO based varistors prepared by screen printing. J. Eur. Ceram. Soc. 2006, 26, 2985–2989. [Google Scholar]
  51. Chang, J.F.; Kuo, H.H.; Leu, I.C.; Hon, M.H. The effects of thickness and operation temperature on ZnO:Al thin film CO gas sensor. Sens. Actuators B 2002, 84, 258–264. [Google Scholar]
  52. Christoulakis, S.; Suchea, M.; Koudoumas, E.; Katharakis, M.; Katsarakis, N.; Kiriakidis, G. Thickness influence on surface morphology and ozone sensing properties of nanostructured ZnO transparent thin films grown by PLD. Appl. Surf. Sci. 2006, 252, 5351–5354. [Google Scholar]
  53. Sakai, G.; Baik, N.S.; Miura, N.; Yamazoe, N. Gas sensing properties of tin oxide thin films fabricated from hydrothermally treated nanoparticles dependence of CO and H2 response on film thickness. Sens. Actuators B 2001, 77, 116–121. [Google Scholar]
  54. Na, D.M.; Satyanarayana, L.; Choi, G.P.; Shin, Y.J.; Park, J.S. Surface morphology and sensing property of NiO-WO3 thin films prepared by thermal evaporation. Sensors 2005, 5, 519–528. [Google Scholar]
  55. Kaelin, M.; Zogg, H.; Tiwari, A.N.; Wilhelm, O.; Pratsinis, S.E.; Meyer, T.; Meyer, A. Electrosprayed and selenized Cu/In metal particles films. Thin Solid Films 2004, 457, 391–396. [Google Scholar]
  56. Kaelin, M.; Rudmann, D.; Tiwari, A.N. Low cost processing of CIGS thin film solar cells. Sol. Energy 2004, 77, 749–756. [Google Scholar]
  57. Cheary, R.W.; Coelho, A.A. Axial divergence in a conventional X-ray powder diffractometer. I. Theoretical foundations. J. Appl. Crystallogr. 1998, 31, 851–861. [Google Scholar]
  58. Brunauer, S.; Emmett, P.; Teller, P.H. Adsorption of gases in multimolecular layers. J. Am. Chem. Soc. 1938, 60, 309–319. [Google Scholar]
  59. Liu, Z.; Chung, D.D.L. Burnout of the organic vehicle in an electrically conductive thick-film paste. J. Elec. Mater. 2004, 33, 1316–1325. [Google Scholar]
  60. Kisi, E.H.; Elcombe, M.M. u Parameters for the wurtzite structure of ZnS and ZnO using powder neutron diffraction. Acta Crystallogr., Sect. C: Cryst. Struct. Commun. 1989, 45, 1867–1870. [Google Scholar]
  61. Abrahams, S.C.; Bernstein, J.L. Remeasurement of the structure of hexagonal ZnO. Acta Crystallogr., Sect. B: Struct. Sci. 1969, 25, 1233–1236. [Google Scholar]
  62. Liu, R.S.; Shi, W.C.; Cheng, Y.C.; Huang, C.Y. Crystal structures and peculiar magnetic properties of alpha- and gamma-(Al2O3) powders. Mod. Phys. Lett. B 1997, 11, 1169–1174. [Google Scholar]
  63. Swanson, H.E.; Tatge, E. Standard X-ray diffraction powder patterns. National Bureau of Standards 1953, 359, 1–1. [Google Scholar]Zeitschrift fuer Angewandte Physik; 1956; Volume 8, pp. 202–205.
  64. Cullity, B.D. Structure of polycrystalline aggregates; Elements of X-ray diffraction; Addison-Wesley: Massachusetts, 1978; Vol. 2, Chapter 9; p. 284. [Google Scholar]
Figure 1. Schematic of the FSP experimental set up for the synthesis of ZnO nanoparticles. The liquid precursor mixture is rapidly dispersed by a gas stream and ignited by a premixed methane/oxygen flame.
Sensors 07 00185f1
Figure 2. Substrate layout (a) Top view and schematic, (b-c) SEM images were observed with different magnifications of Al203 (dark view) substrate interdigitated with Au (bright view) electrodes.
Sensors 07 00185f2
Figure 3. Schematic of the sensing mechanism of semiconducting material doctor-bladed on Al2O3 substrate interdigitated with Au electrodes with the analyte gas exposure
Sensors 07 00185f3
Figure 4. XRD patterns of flame-made (5/5) ZnO as-prepared (P0), Al2O3 substrate interdigitated with Au electrodes (A0), and samples P0 doctor-bladed on Au/Al2O3 substrate with controlling a various film thicknesses of 5, 10, and 15 μm after annealing and sensing test at 400°C (S1, S2, and S3) (( Sensors 07 00185i1) ZnO; ( Sensors 07 00185i2) Au; ( Sensors 07 00185i3) Al2O3).
Sensors 07 00185f4
Figure 5. TEM bright-fields image of highly crystalline flame-made (5/5) ZnO nanoparticles at: (a) low and (b) high magnifications. The morphologies can be observed (b) mainly spheroidal particles typically with occasional hexagonal and rod-like particles. Insets (a) show the corresponding diffraction patterns of the particles.
Sensors 07 00185f5
Figure 6. ZnO hexagonal-close-packed wurtzite structure shows the ZnO lattice along with the calculation of XRD lattice aspect ratio (L/D) using the (100) and (002) crystallite size measurement. The morphology can be clearly observed as particles having the clear (b) rod-like shape.
Sensors 07 00185f6
Figure 7. (a) Sensitivity of S1, S2, and S3 (5, 10, and 15 μm) comparison dependence on ethanol concentration and various film thicknesses in dry air (O2/N2) at 400°C, (b) the response times (Tres) were within a few seconds, and (c) change in resistance of sensor S1 under exposure to reducing gas ethanol during forward cycle.
Sensors 07 00185f7
Figure 8. Model for the influence of film thickness on sensing film morphology
Sensors 07 00185f8
Figure 9. SEM micrographs of surface sensing morphology and cross-section of flame-made ZnO thick films. (a) 5 μm, (b) 10 μm, and (c) 15 μm thicknesses after annealing and sensing test at 400°C in dry air at the different magnifications.
Sensors 07 00185f9
Figure 10. SEM micrographs of the selected areas showing the corresponding ZnO sensing layer (region 1) together with Au electrodes (region 2).EDS spectra for both regions emphasized clearly yield a signal corresponding to Zn, O, and Au were also shown in the inset.
Sensors 07 00185f10

