Home-made Detection Device for a Mixture of Ethanol and Acetone
by
Amnat Reungchaiwat
1,
Teerapol Wongchanapiboon
1,
Saisunee Liawruangrath
2 and
Sukon Phanichphant
1,* 
1
Nanoscience Research Laboratory, Department of Chemistry, Faculty of Science, Chiang Mai University, Chiang Mai 50200, Thailand
2
Department of Chemistry, Faculty of Science, Chiang Mai University, Chiang Mai 50200, Thailand
*
Author to whom correspondence should be addressed.
Sensors 2007, 7(2), 202-213; https://doi.org/10.3390/s7020202
Submission received: 22 January 2007
/
Accepted: 27 February 2007
/
Published: 28 February 2007
Abstract
:A device for the detection and determination of ethanol and acetone was constructed, consisting of a packed column, a chamber with a sensor head, 2 dc power supplies, a multimeter and a computer. A commercially available TGS 822 detector head (Figaro Company Limited) was used as the sensor head. The TGS 822 detector consists of a SnO2 thick film deposited on the surface of an alumina ceramic tube which contains a heating element inside. An analytical column was coupled with the setup to enhance the separation of ethanol and acetone before they reached the sensor head. Optimum system conditions for detection of ethanol and acetone were achieved by varying the flow rate of the carrier gas, voltage of the heating coil (VH), voltage of the circuit sensor (VC), load resistance of the circuit sensor (RL) and the injector port temperature. The flow of the carrier gas was 15 mL/min; the circuit conditions were VH = 5.5 V, VC = 20 V, RL = 68 kΩ; and the injection port temperature was 150°C. Under these conditions the retention times (tR) for ethanol and acetone were 1.95 and 0.57 minutes, respectively. Calibration graphs were obtained for ethanol and acetone over the concentration range of 10 to 160 mg/L. The limits of detection (LOD) for ethanol and acetone were 9.25 mg/L and 4.41 mg/L respectively.
1. Introduction
Semiconductors are used as gas sensors based on the principle of the variability of electrical conductivity of metal oxides when exposed to these gases [1]. These properties can be utilized to detect NOx, H2, volatile organic compounds (VOCs), SOx, CO2 and O2, etc [2-11]. Metal oxide semiconductor (MOS) sensor technology is based on the change in resistance of a sensitive metal oxide layer which is induced by the interaction between a surface and ambient gases. Metal oxide semiconductors demonstrate good detection sensitivity, robustness and the ability to withstand high temperatures and the technique is commonly used to monitor a variety of toxic and inflammable gases in a variety of air pollution monitoring systems, the food industry, medical diagnosis equipment and gas leak alarms. A diversity of metal oxides such as SnO2[2-5, 16-18], TiO2[5, 12], WO3[9-11] and ZnO [12-15] can be used as sensor heads. Gong et al. [16] have tested the sensitivity of a thin-film tin oxide gas sensor to several organic vapors (methanol, ethanol, isopropanol, acetone and acetic acid) in a designed air flow system. Lee et al. [18] have studied the fabrication and characteristics of a SnO2 gas sensor array for many volatile organic compounds (VOCs). A voltage detecting method was used to calculate the sensitivity of the sensor, which was defined as:
where Rair and Rgas were the electrical resistances in VOCs and clear air, respectively.
Sensor arrays for testing alcohol vapors can be modified by integrating them with a gas chromatograph [19]. When the alcohol vapors came into contact with the sensor arrays, a decrease in conductivity of the sensor was observed. The conductivity increased when the alcohol was flushed out of the chamber by the carrier gas. Although many metal oxides are sensitive to volatile organic compounds (VOCs), in the present work the commercially available TGS 822 sensor from Figaro Company Limited was used for the detection of ethanol and acetone because of its low cost, durability and wide dynamic ranges. The TGS 822 sensor is a SnO2 thick film deposited on the surface of an alumina ceramic tube which contains a heating element inside. The TGS 822 cannot be used for the detection of the mixture of ethanol and acetone [20], so in the present work an analytical column was added into the detection system to separate ethanol and acetone before the gas reached the sensor head; the principle is the same as in gas chromatography. The present work represents an attempt to construct a home-made detection device for a mixture of organic volatile compounds. Ethanol and acetone were chosen to test the availability of the commercially available TGS 822 detector Later on the detector using metal oxides nanopowders synthesized by chemical processes such as sol-gel, hydrothermal, oxalate and especially flame spray pyrolysis which gives primary particles with size ranging from 5-10 nm in a single step. This simple home-made detection device was capable of separation of organic volatiles compounds with the aid of a used analytical column from a gas chromatograph. The response data could be collected by a written software program which converted the resistance signal into a chromatogram like those shown by expensive equipment, so the use of a simple detection device to detect the mixture of organic volatile compounds such as ethanol and acetone represents an achievement. We expect to test other organic volatile compounds in the future using this device.
2. Preparation of the stock standard solution
2.1 Ethanol stock solution (1000 mg/L)
Pipette 1.277 mL of AR grade ethanol (99.7%, Carlo Erba, France) into a 1-litre volumetric flask and make up to volume with reverse osmosis (RO) water. Mix well.
2.2 Stock standard solution of acetone (1000 mg/L)
Pipette 1.267 mL of AR grade acetone (99.8%, Carlo Erba, France) into a 1-litre volumetric flask and make up to volume with RO water. Mix well.
2.3 Preparation of the standard ethanol and acetone concentration of 10.00, 20.00, 40.00, 80.00 and 160.00 mg/L
Standard ethanol and acetone solutions with concentrations of 10.00, 20.00, 40.00, 80.00 and 160.00 mg/L were prepared by pipetting equal volumes of ethanol and acetone (50, 100, 200, 400 and 800 μL of 1000 mg/L ethanol and acetone stock solution) into a 5 mL volumetric flask, then adjusting the volume to 5 mL with RO water.
3. Construction of the detection device
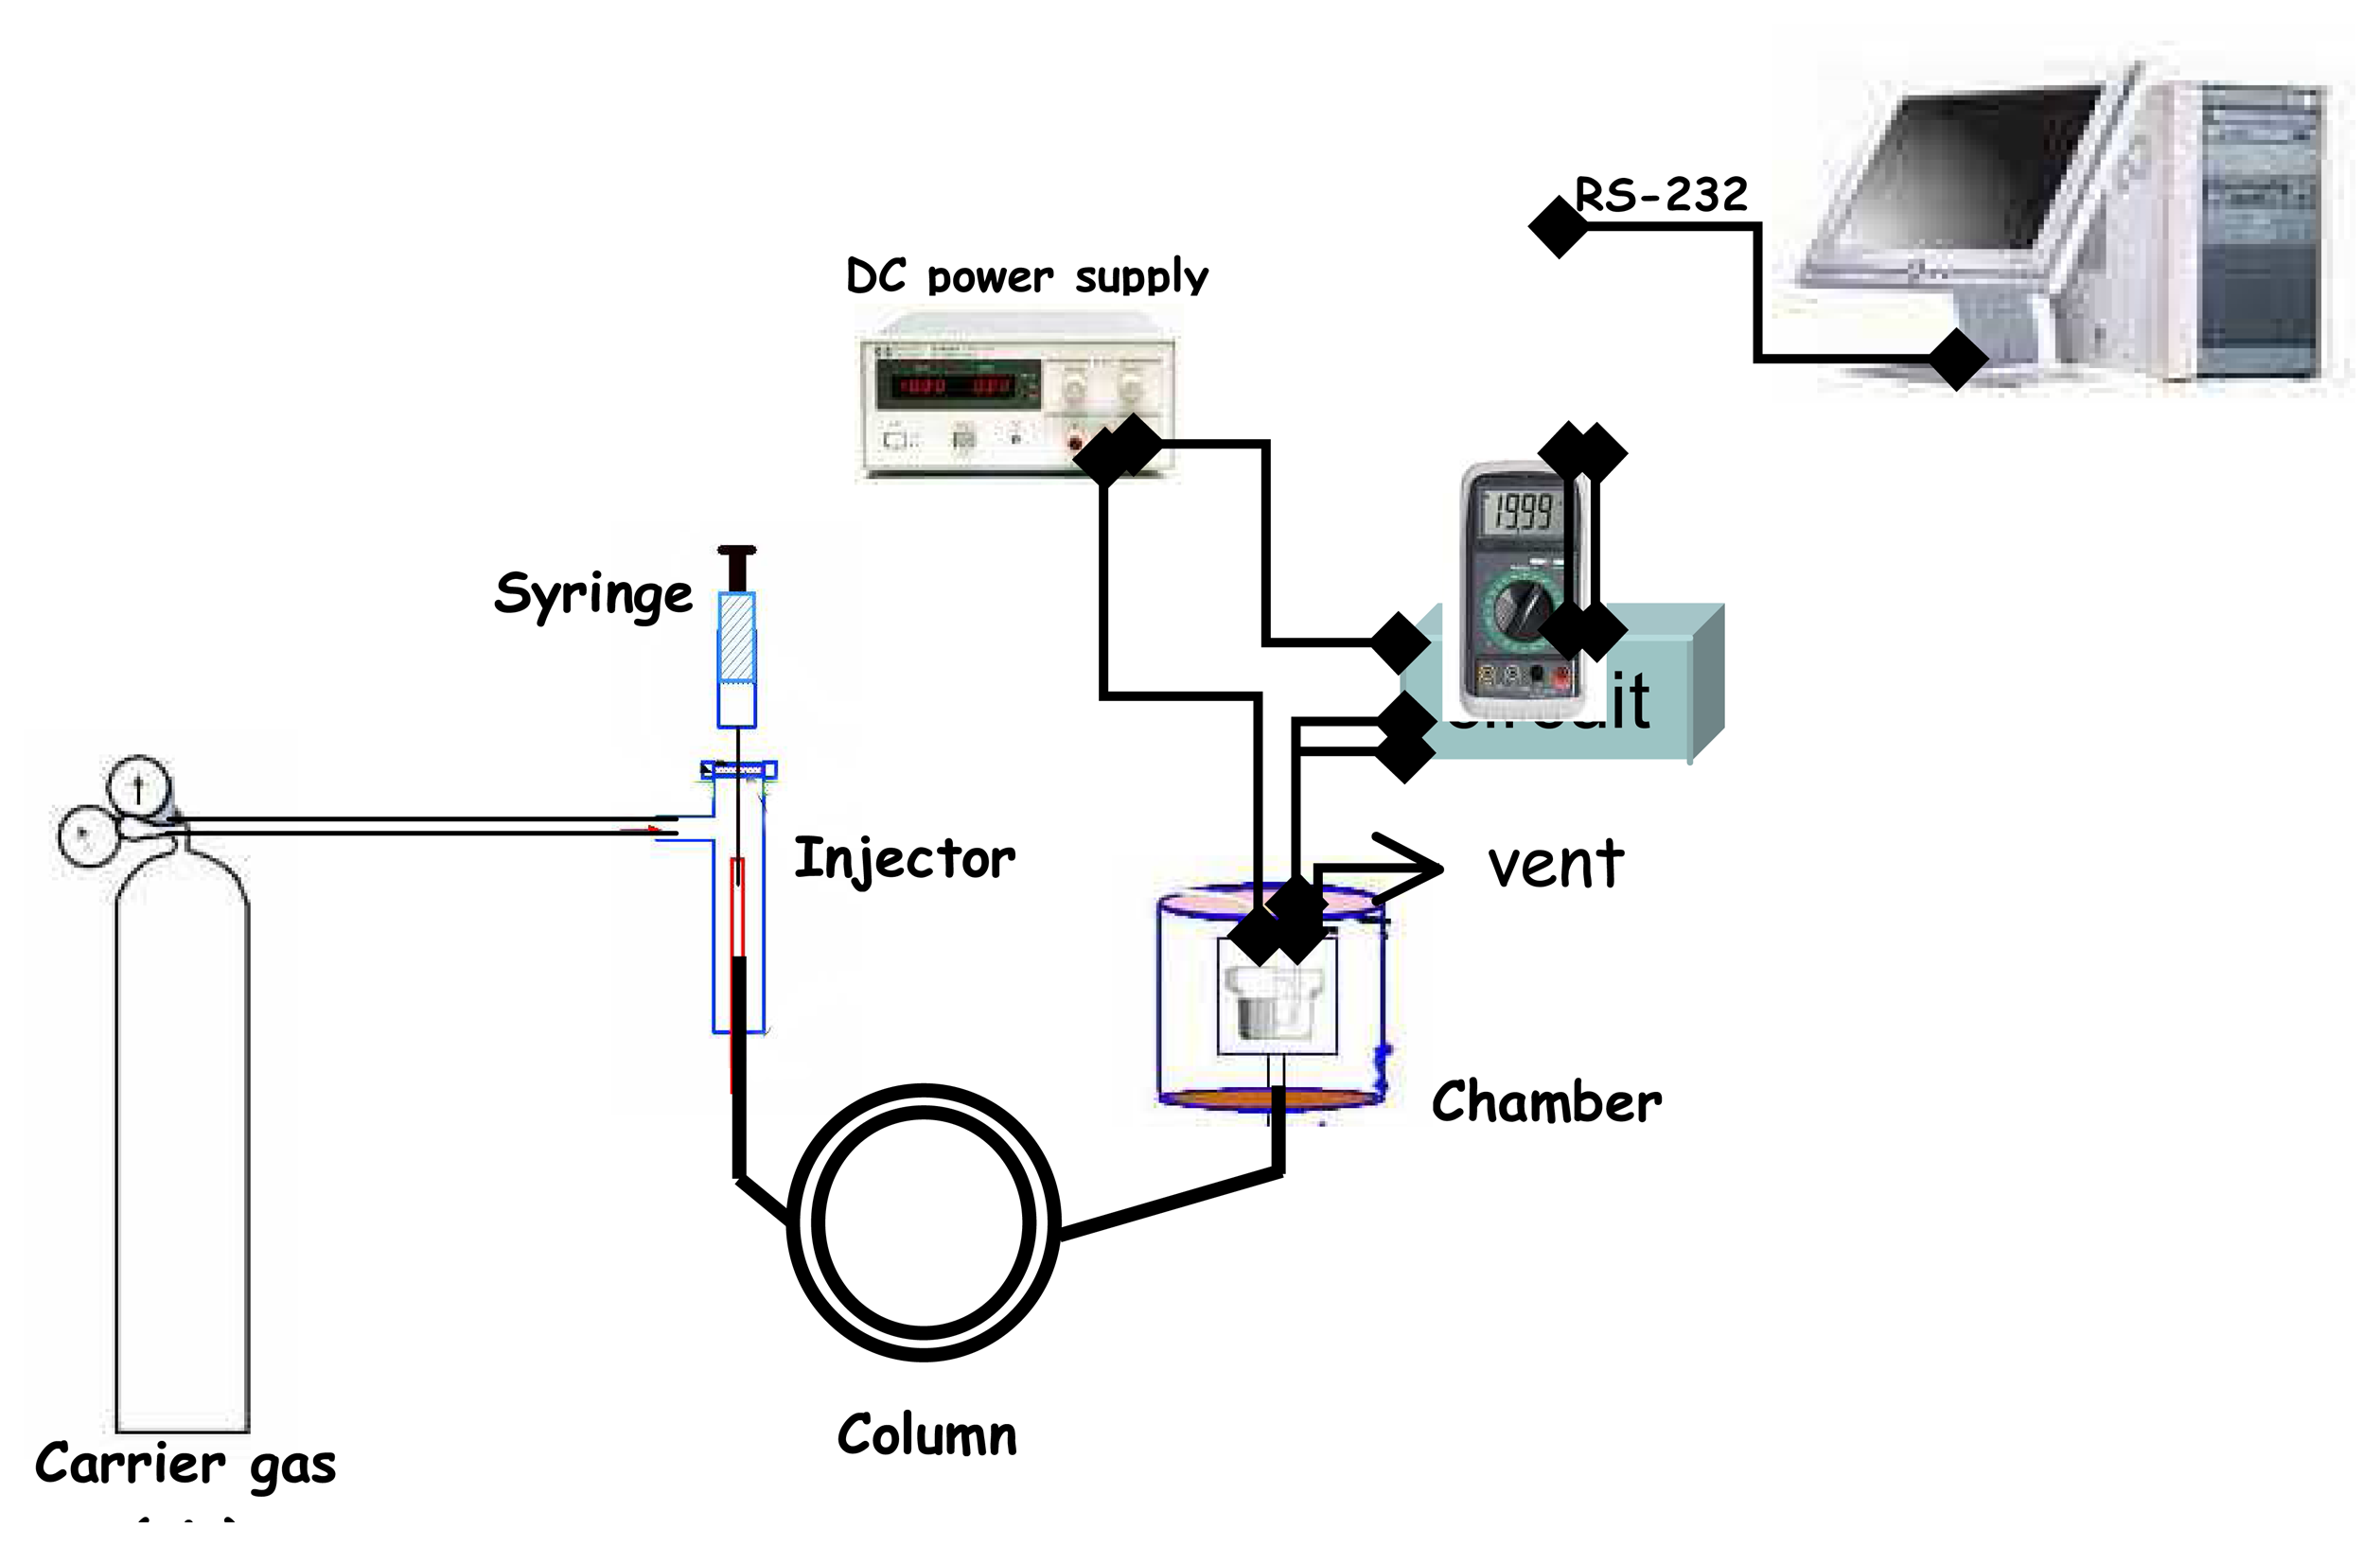
The schematic diagram for the device for detection of ethanol and acetone sensitivity measurements is shown in Figure 1. The system consists of a carrier gas, an injector port, an analytical column, a chamber with a sensor head, 2 dc power suppliers, a circuit sensor, a multimeter and a computer. The optimum conditions of the system for the detection of acetone and ethanol were determined by varying the flow rate of the carrier gas, voltage of the heating coil (VH), voltage of the circuit sensor (VC), load resistance of the circuit sensor (RL), and the injector port temperature.
In order to establish the optimum conditions, 1:1 solutions of ethanol and acetone with concentrations of 10 mg/L, 20 mg/L, 40 mg/L, 80 mg/L and 160 mg/L were mixed together. When the base line voltage (Vair) was stabilized, the mixture (1 μL) was injected into the injection port and the responses were measured. The chromatograms were dispalyed on the monitor and the peak areas were recorded. The optimum conditions for the detection of ethanol and acetone were as follows:
- (i)
- The carrier gas flow rate was 15 mL/min.
- (ii)
- Circuit conditions were VH = 5.5 V, VC = 20 V and RL = 68 kΩ.
- (iii)
- The temperature of the injection port was 150 °C.
3.1 Characteristics of the procedure
3.1.1 Linearity range
In order to determine the linearity range, standard mixtures of ethanol and acetone prepared by mixing proportions of equal volume in the range from 10-160 mg/L were prepared. Then these solutions (1 μL) were injected into the sensor system using the optimum conditions.
3.1.2 Limit of detection (LOD)
LOD was calculated from the linear regression line of the calibration curve by means of the blank signal plus three standard deviations of the blank [21]. Standard solutions of ethanol and acetone in the 10-60 mg/L and 5-40 mg/L range were prepared. One μL of each concentration was injected into the sensor system under the optimum conditions. The TGS 822 response values in term of peak area were plotted against concentration of the standard solution. The limits of detection of ethanol and acetone were evaluated from these plots.
4. Results and discussion
4.1 Optimization of the sensor system
The optimum conditions of the ethanol and acetone system in terms of 1) flow rate of carrier gas, 2) VH 3.VC 4.RL and 3) temperature of the injector port were determined as follows:
4.1.1 Effect of flow rate of carrier gas
The flow rate of the eluent was optimized by mixing equal volumes of ethanol and acetone standard solution (1000 mg/L). When 1 μL of these solutions was injected into the heated injection port, the vapors of acetone and ethanol reach the column together with the carrier gas. Ethanol and acetone were swept further through the column by the carrier gas. The flow rate of the carrier gas passing through the column and chamber were calibrated at room temperature with a soap-bubble flowmeter. The separation process began as the ethanol and acetone components moved along in the same direction of the gas flow with different velocities depending on their respective partition coefficients between the carrier gas and the stationary phase.
The flow rate of the carrier gas was adjusted to 15, 26, 42, 80 and 112 mL/min. Figure 2 shows the chromatograms of the mixed standard solution with different carrier gas flow rates. A carrier gas flow rate of 15 mL/min was found to be the optimum one, since as shown in Figure 2a, it shows a larger peak area of ethanol and acetone. If the carrier gas has a high flow rate the responses of ethanol and acetone will give smaller peak areas because the ethanol and acetone vapors have a shorter reaction time at the sensor head. Viceversa, if the flow rate of the carrier gas is low the ethanol and acetone vapors have a longer reaction time at the sensor head and give larger peak areas.
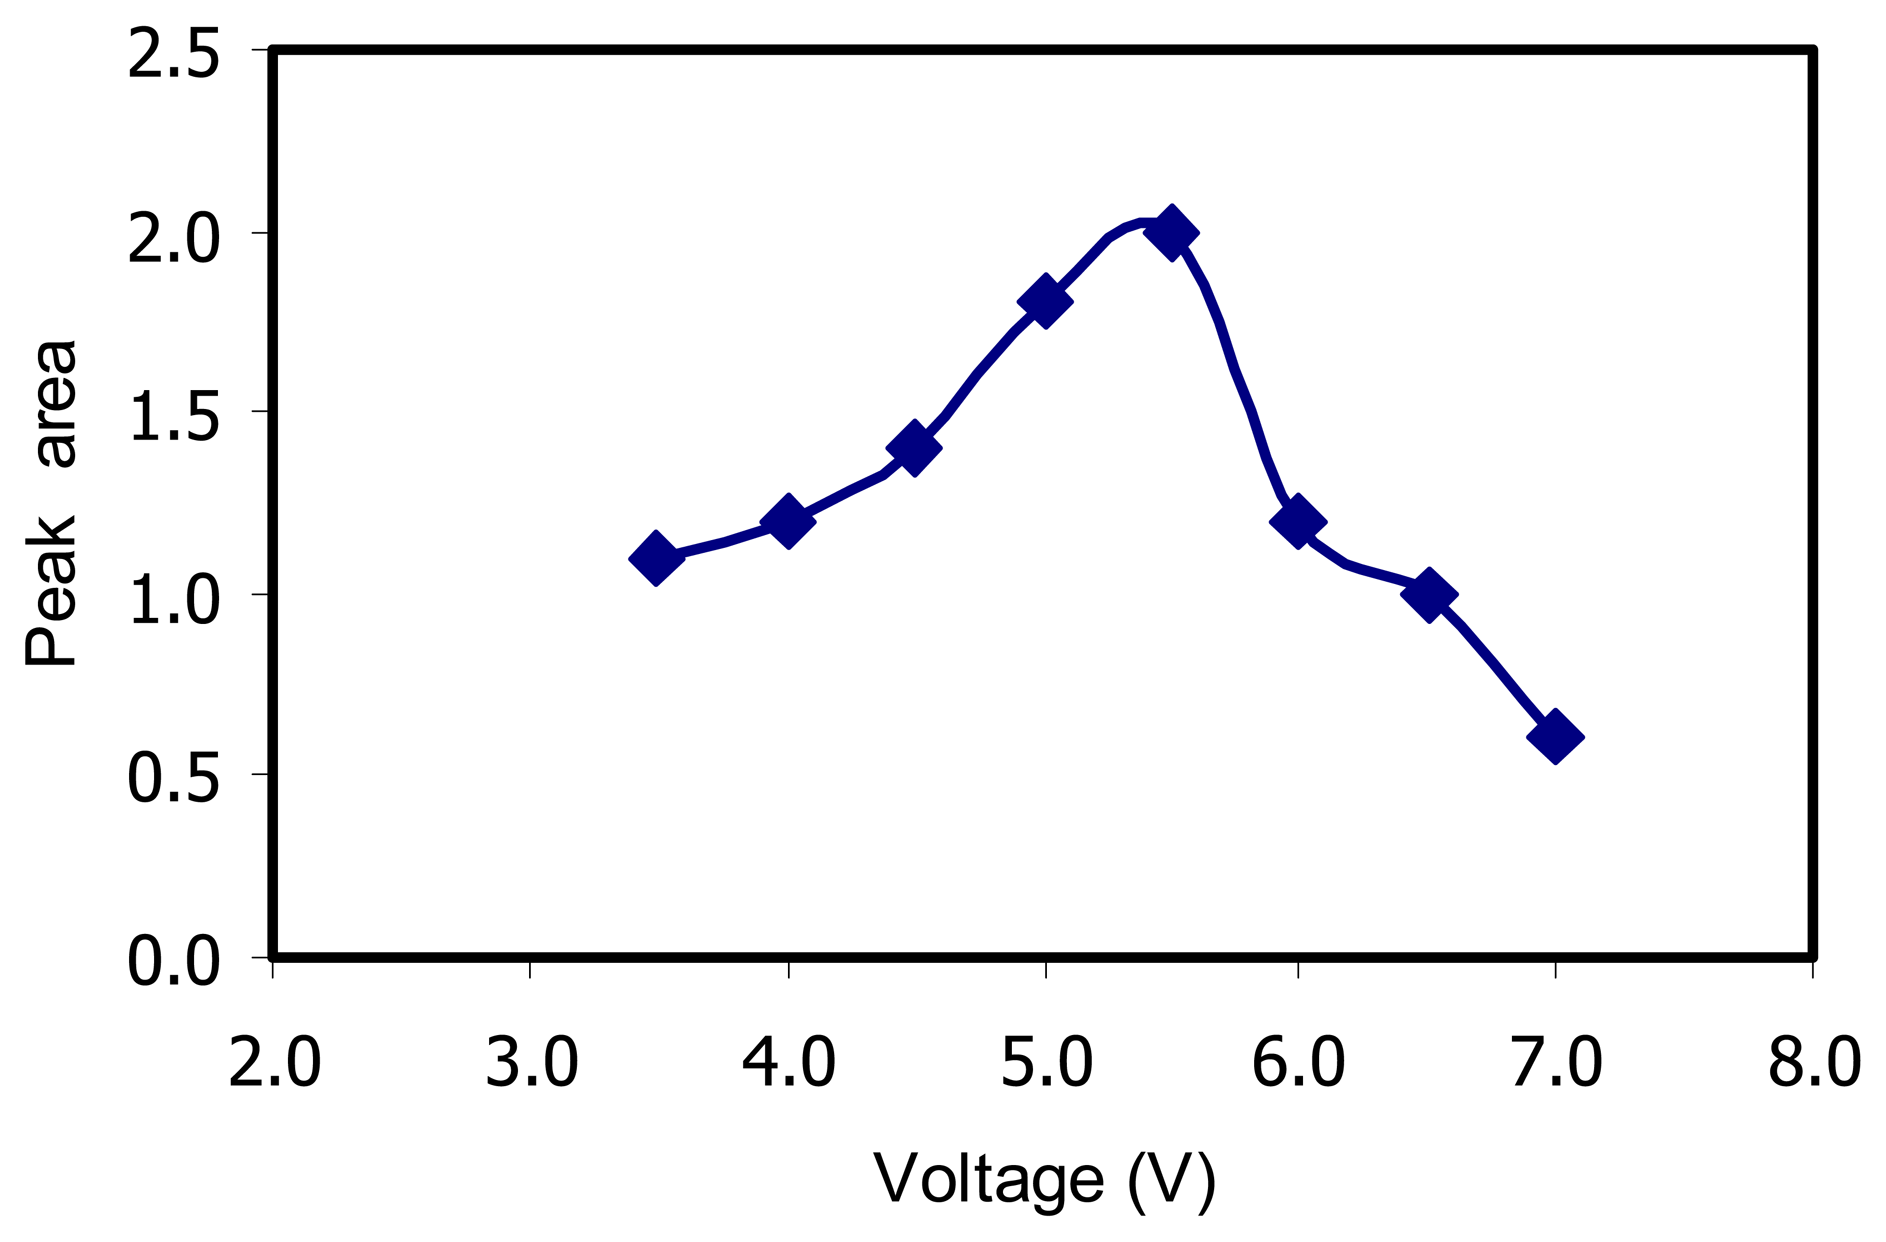
4.1.2 Optimization of the heating coil VH
The best operating temperature of the TGS 822 sensor was determined by applying a voltage from a dc source to the heating coil by varying the voltage between 3.5-7.0 V. When 1 μL of ethanol solution was injected into the sensor system, the peak areas were measured. The plot of the peak area vs voltage is shown in Figure 3. The optimum heating coil voltage, VH, which gave the largest peak area, was found to be 5.5 V. When a voltage greater than 5.5 V was applied, the response from the TGS 822 sensor head showed a smaller peak area because the sensitivity of the SnO2 thick film depended on the change of chemisorbed oxygen ion on the SnO2 surface [22].
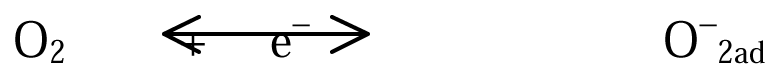
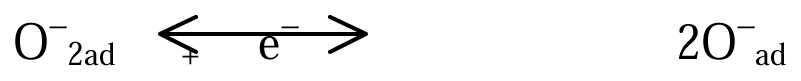
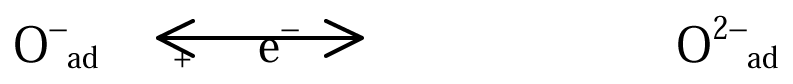
Jiao et al. [22] have reported that the atmospheric chemisorbed oxygen ion species such as O2−, O− and O2− presented on the surface of the oxide semiconductor are represented by the following reactions:
![Sensors 07 00202e1]()
![Sensors 07 00202e2]()
![Sensors 07 00202e3]()
![Sensors 07 00202f1]()
![Sensors 07 00202f2]()
![Sensors 07 00202f3]()
![Sensors 07 00202f4]()
![Sensors 07 00202f5]()
![Sensors 07 00202f6]()
![Sensors 07 00202f7]()
![Sensors 07 00202f8]()
![Sensors 07 00202f9]()


According to Ho et al. [23] the type of chemisorbed oxygen ion on the SnO2 surface is O−. When the resistance is measured in air, the oxygen ions adsorbed on the SnO2 surface are negatively charged; the density of the adsorbed oxygen ions are then determined. When the ethanol vapour passes through the SnO2 surface, the O− species density is lower at sensor head and the change in the response at the sensor head is recorded by the PC system. If VH is more than 5.5 V, the heating coil temperature is higher, and the oxygen ions are then deadsorbed from the SnO2 surface. Thus the response of ethanol gives a smaller peak area.
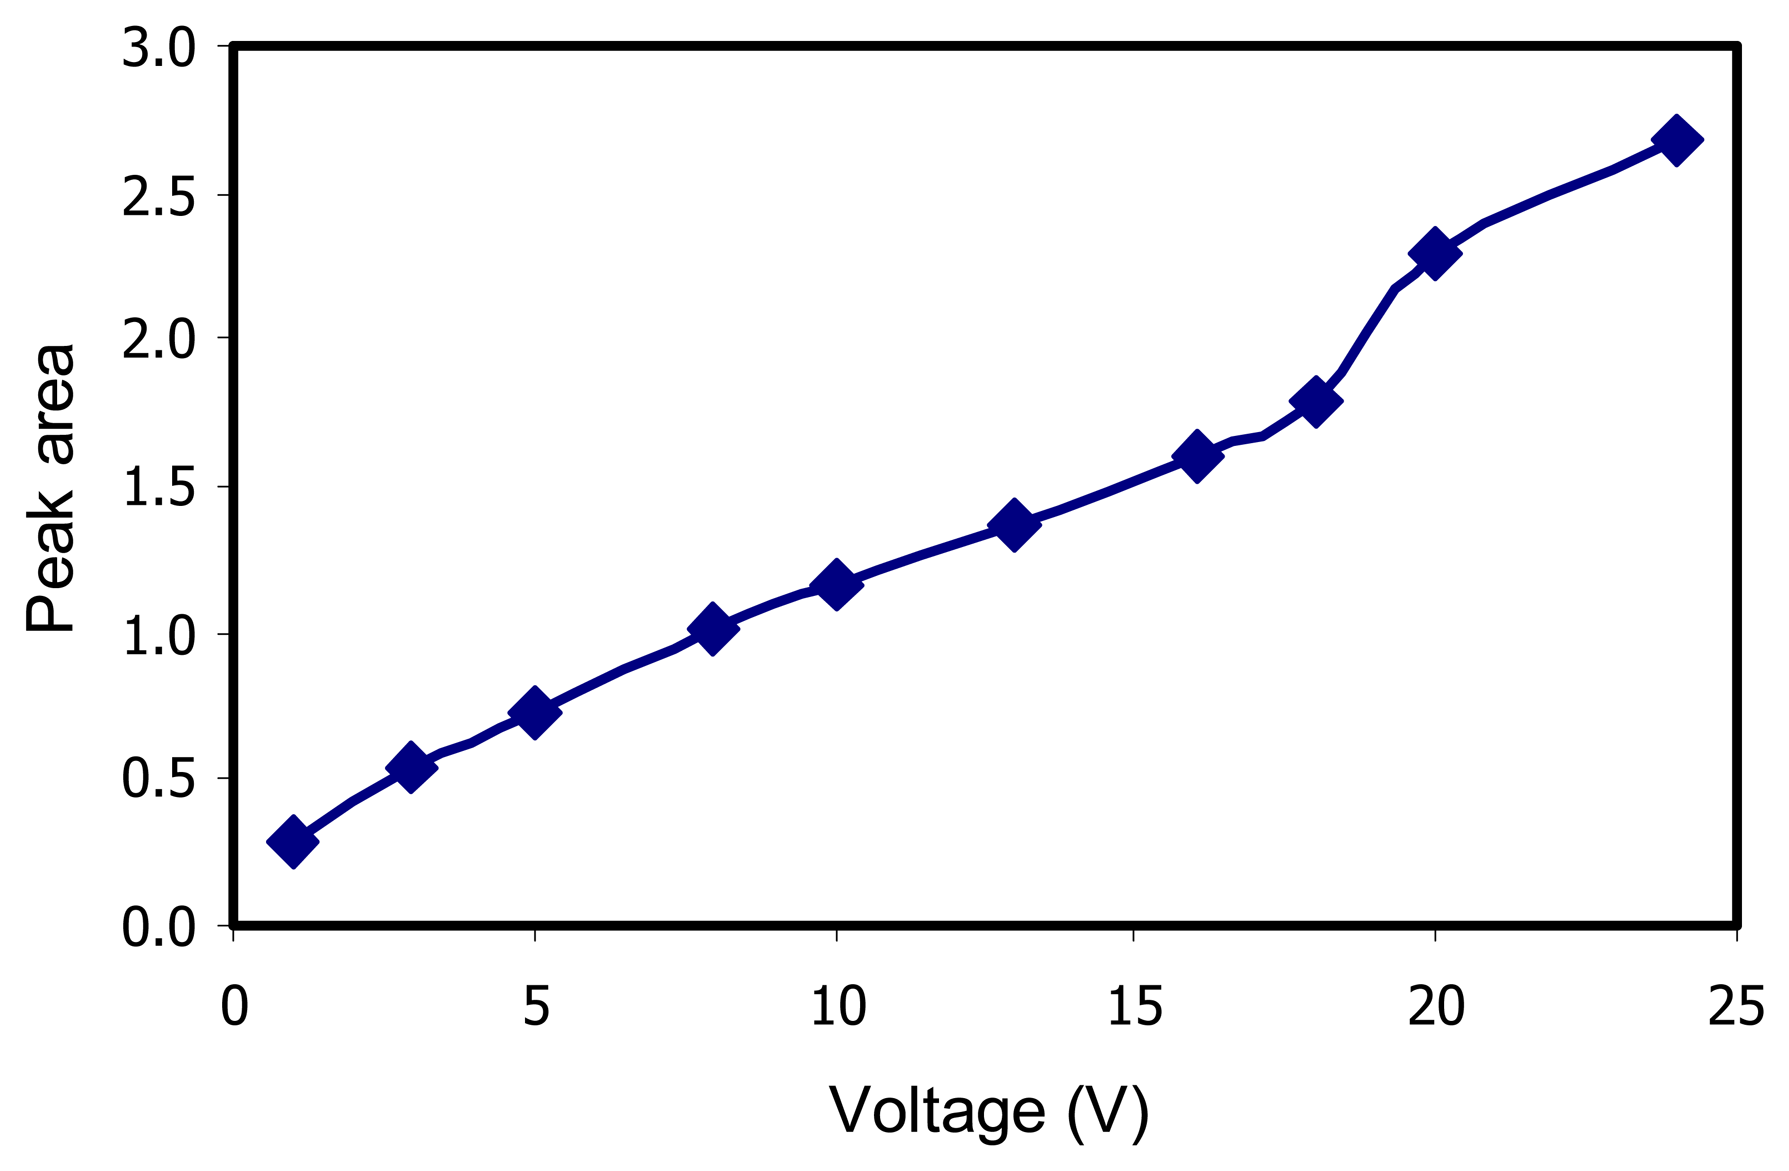
4.1.3 Optimization of VC of the circuit sensor
VC is the circuit voltage that was applied across RS and RL by a dc power supply operating between 1-24 V. The VH at the heating coil was fixed at 5.5 V. When 1 μL of 1000 mg/L of ethanol solution was injected into the sensor system, the ethanol responses in terms of peak areas were measured. The peak areas were then plotted against the voltage of the circuit sensor, as shown in Figure 4. It was found that the optimum voltage VC was 24 V. Nevertheless, VC = 20 V was selected because the standard specifications of TGS 822 sensor head specify a maximum VC of 24 V. If a VC ≥ 24 V were selected the TGS 822 might have a shorter half-life.
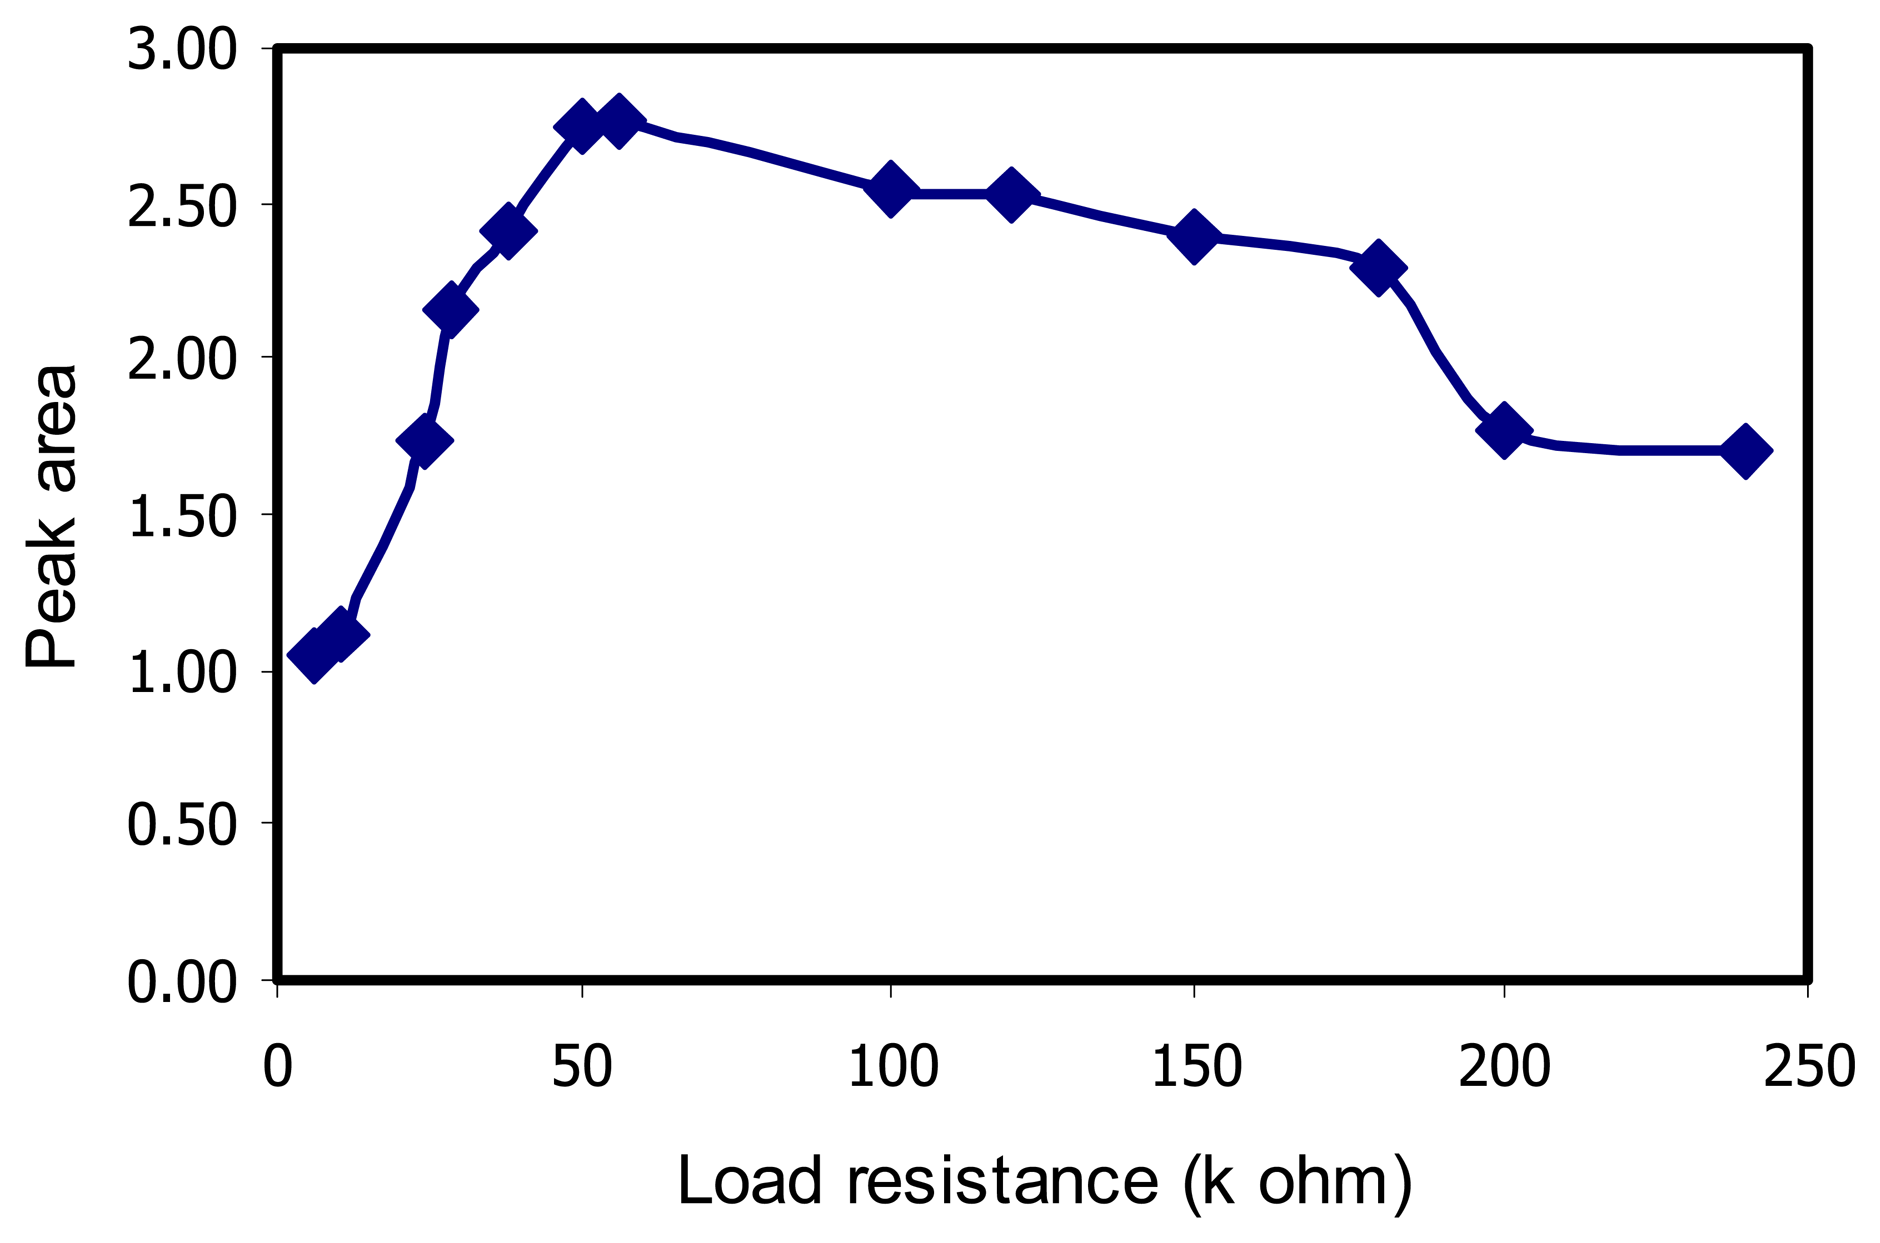
4.1.4 Optimization of RL of the circuit sensor
After fixing VH = 5.5 V on the heating coil and VC = 20 V on the circuit sensor, the peak areas when 1 μL ethanol solution (1000 mg/L) was injected into the sensor system were measured by varying RL between 6– 240 kΩ . The relationship between peak area and resistance of RL is shown in Figure 5. It was found that the optimum RL was 68 kΩ .
Normally, RL is the load resistance of the circuit sensor which is used to calculate RS of the TGS 822 sensor head by Ohm's Law as in the following equation:
| where | RS is the resistance of sensor |
| VC is the voltage of the circuit sensor | |
| RL is the load resistance of the circuit sensor | |
| VRL is the output voltage in the resistance |
In pure air RS is high. In the presence of a detectable gas, RS changes proportionally with the gas concentration. The load resistance on the resistor (RL) is measured by a multimeter. The output voltage (VRL) increases as RS decreases, therefore the change in the RS depends on the concentration of ethanol and acetone.
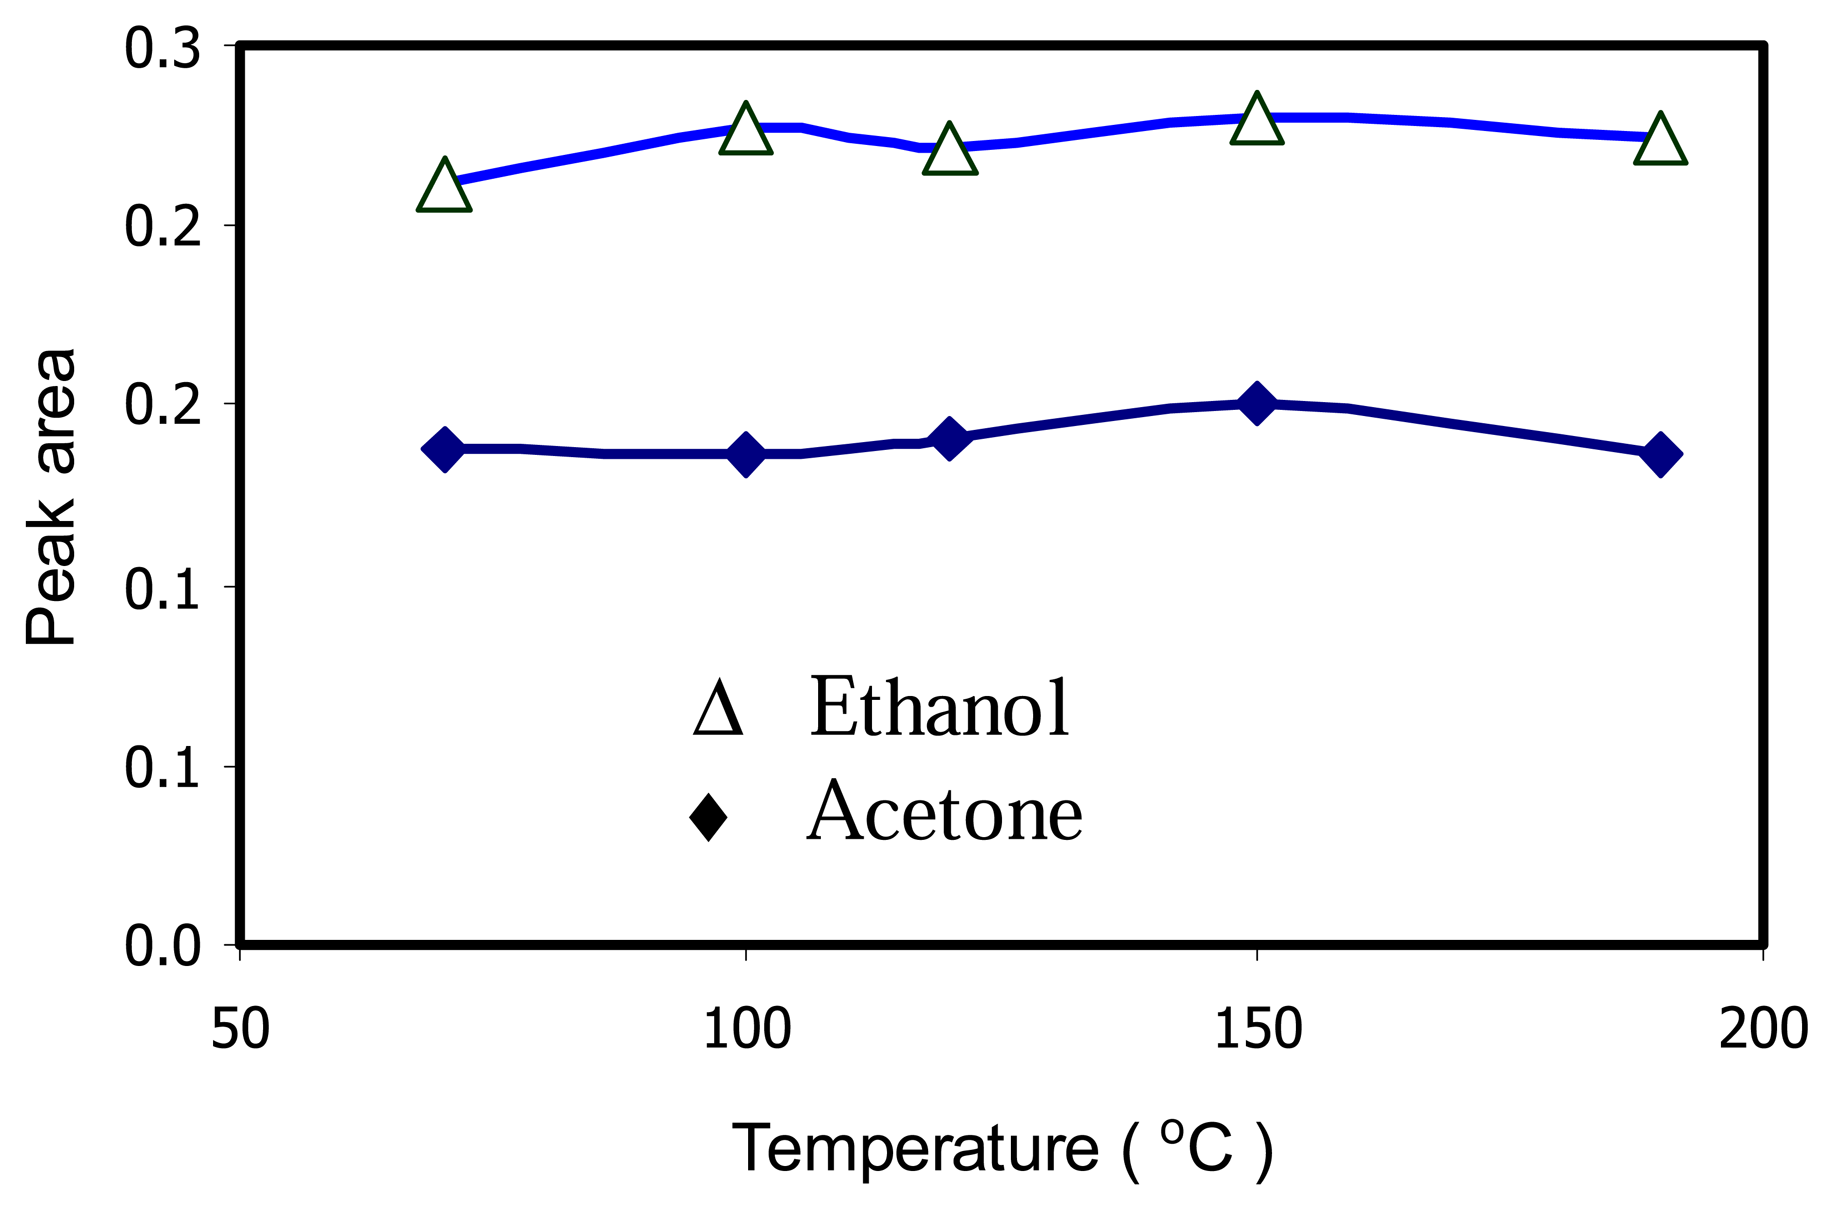
4.1.5 Optimization of the injection port temperature
A mixture with equal volumes of ethanol and acetone was injected into the sensor system after fixing the following parameters, VH = 5.5 V of the heating coil, VC = 20 V of the circuit sensor, RL = 68 kΩ. The injection port temperature was varied between 70 and 190 °C. The injection port temperature was operated at a temperature high enough to ensure rapid volatilization of the liquid mixtures in order to avoid the condensation of acetone and ethanol. The relationship between peak area and of the injection port temperature is shown in Figure 6. A temperature of 150 °C was selected for the entire testing of ethanol and acetone with the TGS 822 sensor head.
4.2 Characteristics of the procedure
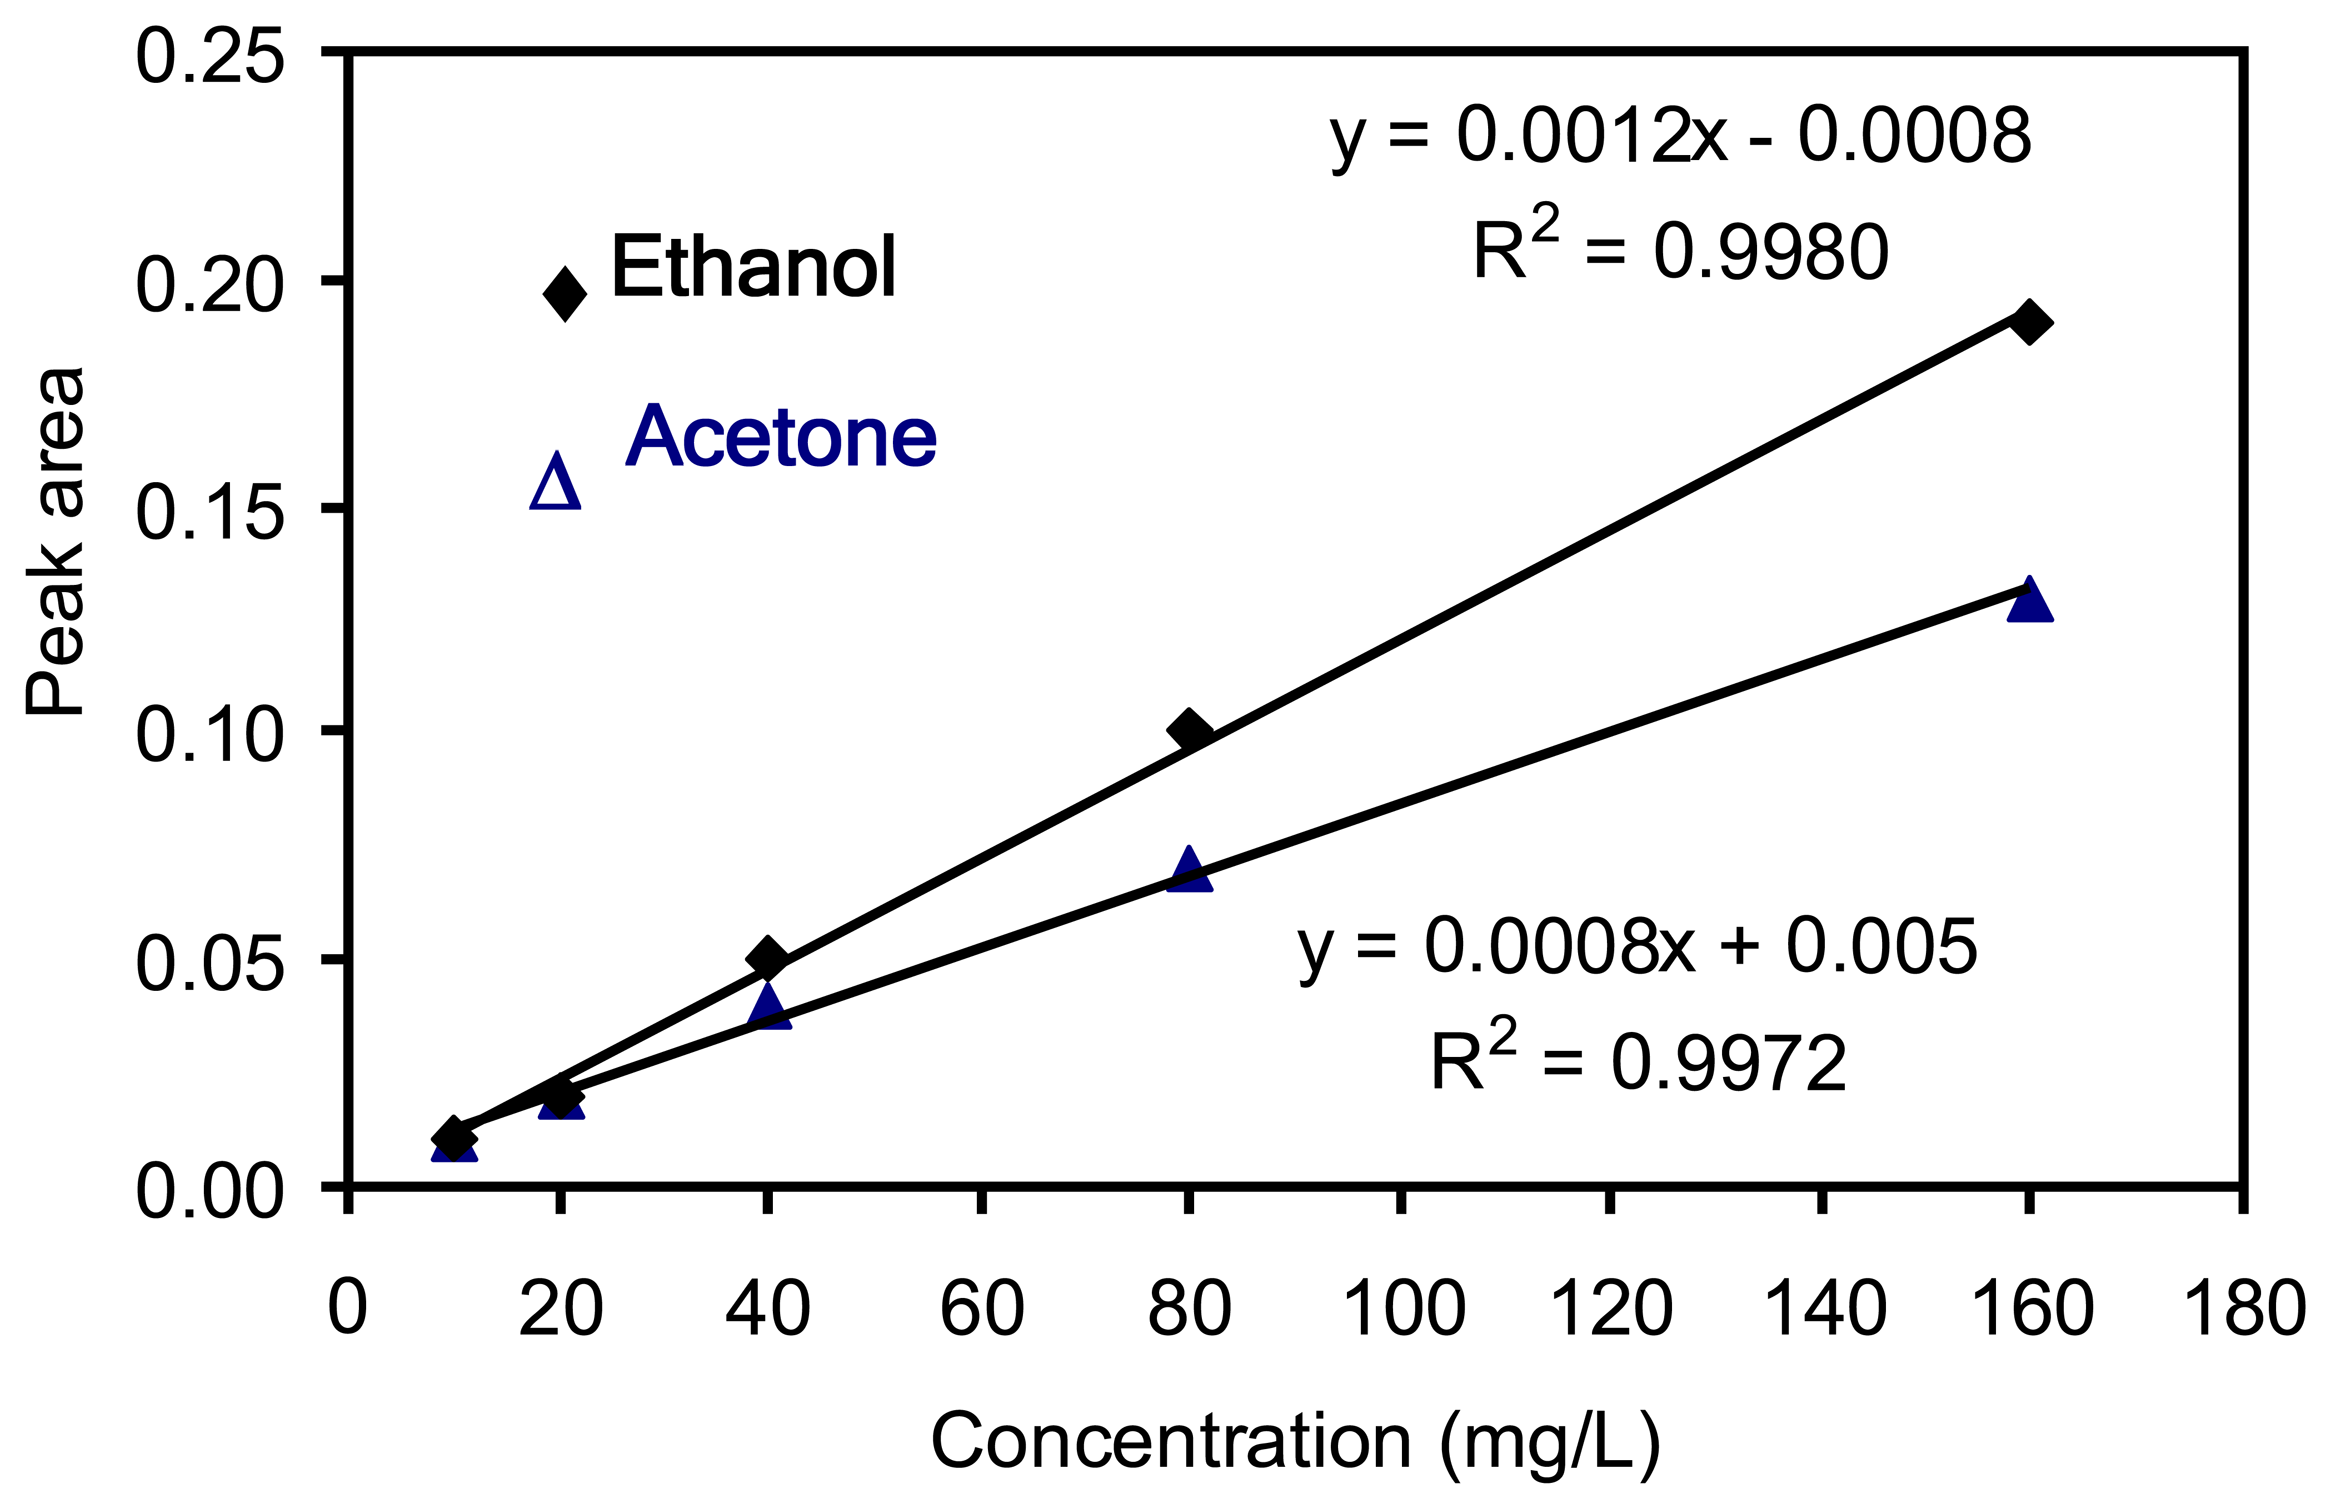
4.2.1 Linearity range
Standard mixtures of equal volumes of ethanol and acetone used were in the range from 10-160 mg/L. When 1 μL of each concentration was injected into the sensor system under the optimum conditions of VH = 5.5 V on the heating coil, VC = 20 V on the circuit sensor, RL = 68 kΩ, injection port temperature = 150 °C, the peak areas of ethanol and acetone were plotted versus the concentrations as shown in Figure 7.
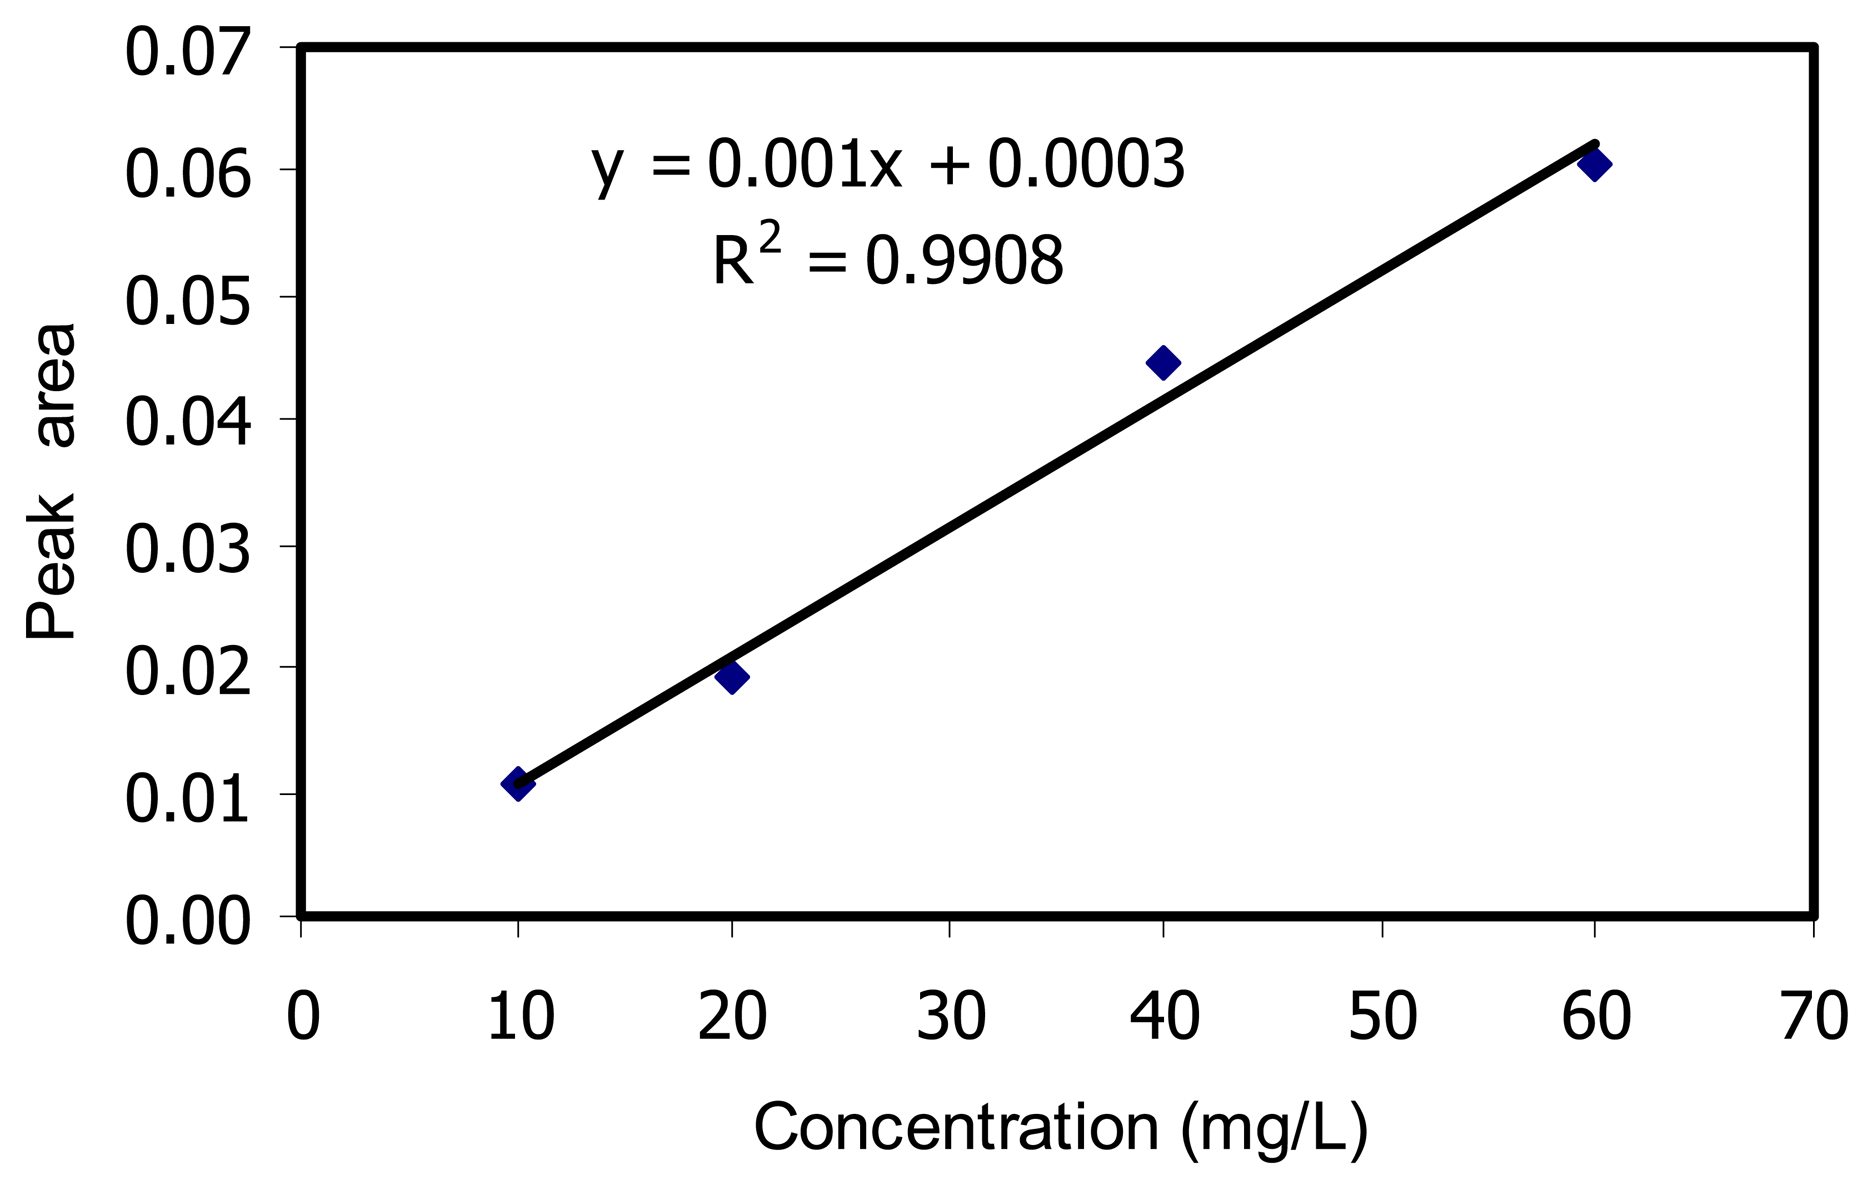
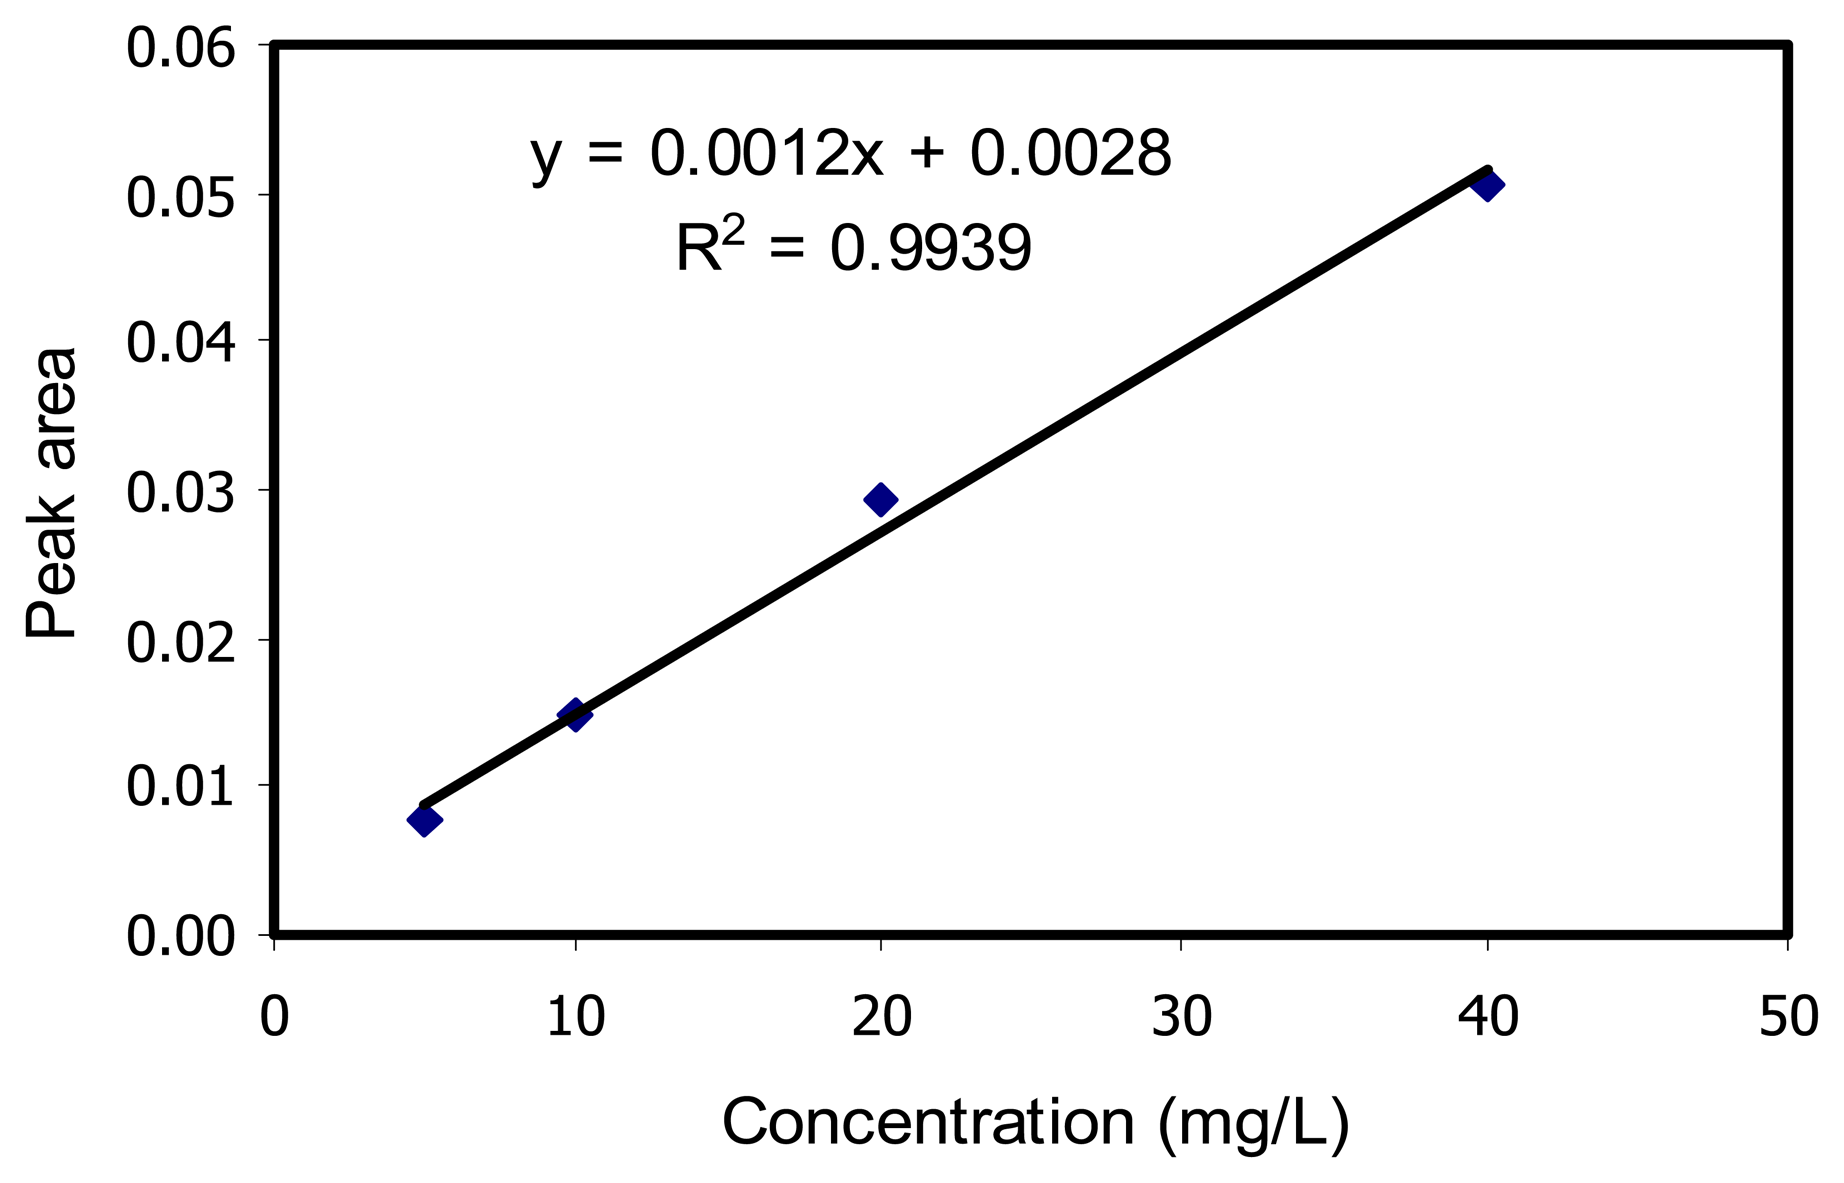
4.2.2 Limit of detection (LOD)
Standard solutions of ethanol and acetone the range from 10-60 ppm and 5-40 ppm, respectively, were prepared. 1 μL of each concentration was injected into the sensor system under the optimum conditions. The TGS 822 response values in terms of peak areas were plotted against concentration of standard solution for construction of the calibration graphs as shown in Figures 8 and 9 for ethanol and acetone, respectively. The limits of detection were 9.27 mg/L and 4.41 mg/L for ethanol and acetone, respectively, as shown in Table 1.
5. Conclusions
Although many metal oxides are sensitive towards ethanol and acetone, the commercially available TGS 822 sensor head from Figaro Company Limited was selected for the detection of these substances. TGS 822 by itself cannot be used for the detection of the mixture of acetone and ethanol, therefore an analytical column was added into the detection system to separate ethanol and acetone before they reached the sensor head. The response data can be collected by a software program on the PC system.
The optimum conditions of the system for the detection of acetone and ethanol were achieved by varying the flow rate of the carrier gas, VH, VC, RL and the injection port temperature. It was found that the best flow rate of the carrier gas was 15 mL/min, with circuit settings of VH = 5.5 V, VC = 20 V, RL = 68 kΩ and an injection port temperature of 150 °C.
The oxide semiconductor sensor detection principle is based on the chemical adsorption and desorption of gas on the sensor surface. Under normal atmospheric condition, the types of chemisorbed oxygen ion on the surface of the oxide semiconductor are O2−, O−, and O2−. The type of chemisorbed oxygen ion on the SnO2 surface is found to be O− . Therefore, the change in density of the oxygen negative ion on the SnO2 surface is used to determine the amount of ethanol and acetone quantitatively while the retention times (tR) of ethanol and acetone were 1.95 and 0.57 min respectively. The limits of detection were 9.27 mg/L for ethanol and 4.41 mg/L for acetone.
Acknowledgments
The authors would like to thank the Postgraduate Education and Research Program in Chemistry (PERCH) and the Graduate School, Chiang Mai University, Thailand for financial supports and Nanoscience Research Laboratory, Department of Chemistry, Faculty of Science, Chiang Mai University for research facilities.
Referentes
- Capone, S.; Forleo, A.; Francioso, L.; Rella, R.; Siciliano, P.; Spadavecchia, J.; Presicce, D. S.; Taurino, A. M. Solid State Gas Sensors: State of the Art and Future Activities. J. Electron. Mater. 2003, 5, 1335–1348. [Google Scholar]
- Jie, Z.; Huo, L.-H.; Gao, S.; Zhao, H.; Zhao, J.-G. Alcohols and acetone sensing properties of SnO2 thin films deposited by dip-coating. Sens. Actuators B: Chem. 2006, 115, 460–466. [Google Scholar]
- Tianshu, Z.; Hing, P.; Li, Y.; Jiancheng, Z. Selective detection of ethanol vapor and hydrogen using Cd-doped SnO2-based sensors. Sens. Actuators B: Chem. 1999, 60, 208–215. [Google Scholar]
- Mandayo, G. G.; Castano, E.; Gracia, F. J.; Cirera, A.; Cornet, A.; Morante, J. R. Strategies to enhance the carbon monoxide sensitivity of tin oxide thin films. Sens. Actuators B: Chem. 2003, 95, 90–96. [Google Scholar]
- Tan, O. K.; Cao, W.; Zhu, W.; Chai, J. W.; Pan, J. S. Ethanol sensors based on nano-sized α-Fe2O3 with SnO2, ZrO2, TiO2 solid solutions. Sens. Actuators B: Chem. 2003, 93, 396–401. [Google Scholar]
- Yoon, J. W.; Grilli, M. L.; Bartolomeo, E. D.; Polini, R.; Traversa, E. The NO2 response of solid electrolyte sensors made using nano-sized LaFeO3 electrodes. Sens. Actuators B: Chem. 2001, 76, 483–488. [Google Scholar]
- Korotcenkov, G.; Brinzari, V.; Cerneavschi, A.; Ivanov, M.; Cornet, A.; Morante, J.; Cabot, A.; Arbiol, J. In2O3 films deposited by spray pyrolysis: gas response to reducing (CO, H2) gases. Sens. Actuators B: Chem. 2004, 98, 122–129. [Google Scholar]
- Korotcenkov, G.; Brinzari, V.; Cerneavschi, A.; Ivanov, M.; Cornet, A.; Morante, J.; Cabot, A.; Arbiol, J. In2O3 films deposited by spray pyrolysis as a material for ozone gas sensors. Sens. Actuators B: Chem. 2004, 99, 297–303. [Google Scholar]
- Ionescu, R.; Hoel, A.; Granqvist, C. G.; Llobet, E.; Heszler, P. Low-level detection of ethanol and H2S with temperature-modulated WO3 nanoparticle gas sensors. Sens, Actuators B: Chem. 2005, 104, 132–139. [Google Scholar]
- Guérin, J.; Aguir, K.; Bendahan, M.; Lambert-Mauriat, C. L. Thermal modelling of a WO3 ozone sensor response. Sens. Actuators B: Chem. 2005, 104, 289–293. [Google Scholar]
- Blo, M.; Carotta, M. C.; Galliera, S.; Gherardi, S.; Giberti, A.; Guidi, V.; Malagù, C.; Martinelli, G.; Sacerdoti, M.; Vendemiati B.; Zanni, A. Synthesis of pure and loaded powders of WO3 for NO2 detection through thick film technology. Sens. Actuators B: Chem. 2004, 103, 213–218. [Google Scholar]
- Zhu, B. L.; Xie, C. S.; Wang, W. Y.; Huang, K. J.; Hu, J. H. Improvement in gas sensitivity of ZnO thick film to volatile organic compounds (VOCs) by adding TiO2. Mater. Lett 2004, 58, 624–629. [Google Scholar]
- Anno, Y.; Maekawa, T.; Tamaki, J.; Asano, Y.; Hayashi, K.; Miura, N.; Yamazoe, N. Zinc-oxide-based semiconductor sensors for detecting acetone and capronaldehyde in the vapour of consommk soup. Sens. Actuators B: Chem. 1995, 25, 623–627. [Google Scholar]
- Cheng, X. L.; Zhao, H.; Huo, L. H.; Gao, S.; Zhao, J. G. ZnO nanoparticulate thin film: preparation, characterization and gas-sensing property. Sens. Actuator B: Chem. 2004, 102, 248–252. [Google Scholar]
- Zhu, B. L.; Xie, C. S.; Wang, A. H.; Zeng, D. W.; Song, W. L.; Zhao, X. Z. The gas-sensing properties of thick film based on tetrapod-shaped ZnO nanopowders. Mater. Lett. 2005, 59, 1004–1007. [Google Scholar]
- Gong, H.; Wang, Y. J.; Teo, S. C.; Huang, L. Interaction between thin-film tin oxide gas sensor and five organic vapors. Sens. Actuators B: Chem. 1999, 54, 232–235. [Google Scholar]
- Varghese, O. K.; Malhotra, L. K.; Sharma, G. L. High ethanol sensitive in sol -gel derived SnO2 thin films. Sens. Actuators B: Chem. 1999, 55, 161–165. [Google Scholar]
- Lee, D.-S.; Kim, Y. T.; Huh, J.-S.; Lee, D.-D. Fabrication and characteristics of SnO2 gas sensor array for volatile organic compounds recognition. Thin Solid Films 2002, 416, 271–278. [Google Scholar]
- Wanekaya, A. K.; Uematsu, M.; Breimer, M.; Sadik, O. A. Multicomponent analysis of alcohol vapors using integrated gas chromatography with sensor arrays. Sens. Actuators B: Chem. 2005, 110, 41–48. [Google Scholar]
- TGS 822 for the detection of Organic Solvent Vapors; Figaro Company Limited: USA.
- Miller, J. C.; Miller, J. N. Statistics for Analytical Chemistry, 3rd ed.; Simon & Schuster: New York, 1993; pp. 115–118. [Google Scholar]
- Jiao, Z.; Gang, Y.; Chen, F.; Li, M.; Liu, J. The preparation of ZnGa2O4 nanocrystals by spray coprecipitaton and its gas sensitive characteristics. Sensors 2002, 2, 71–78. [Google Scholar]
- Ho, J. J.; Fang, Y. K.; Wu, K. H.; Hsieh, W. T.; Chen, C. H.; Chen, G. S.; Ju, M. S.; Lin, J.-J.; Hwang, S. B. High sensitivity ethanol gas sensor integrated with a solid-state heater and thermal isolation improvement structure for legal drink-drive limit detecting. Sens. Actuators B: Chem. 1998, 50, 227–233. [Google Scholar]
Figure 1.
Schematic diagram for the detection device of ethanol and acetone

Figure 2.
Chromatograms of mixed standard solution show the effect of the flow rate; a) 15 mL/min, b) 26 mL/min, c) 42 mL/min, d) 80 mL/min, and e) 112 mL/min
Figure 2.
Chromatograms of mixed standard solution show the effect of the flow rate; a) 15 mL/min, b) 26 mL/min, c) 42 mL/min, d) 80 mL/min, and e) 112 mL/min
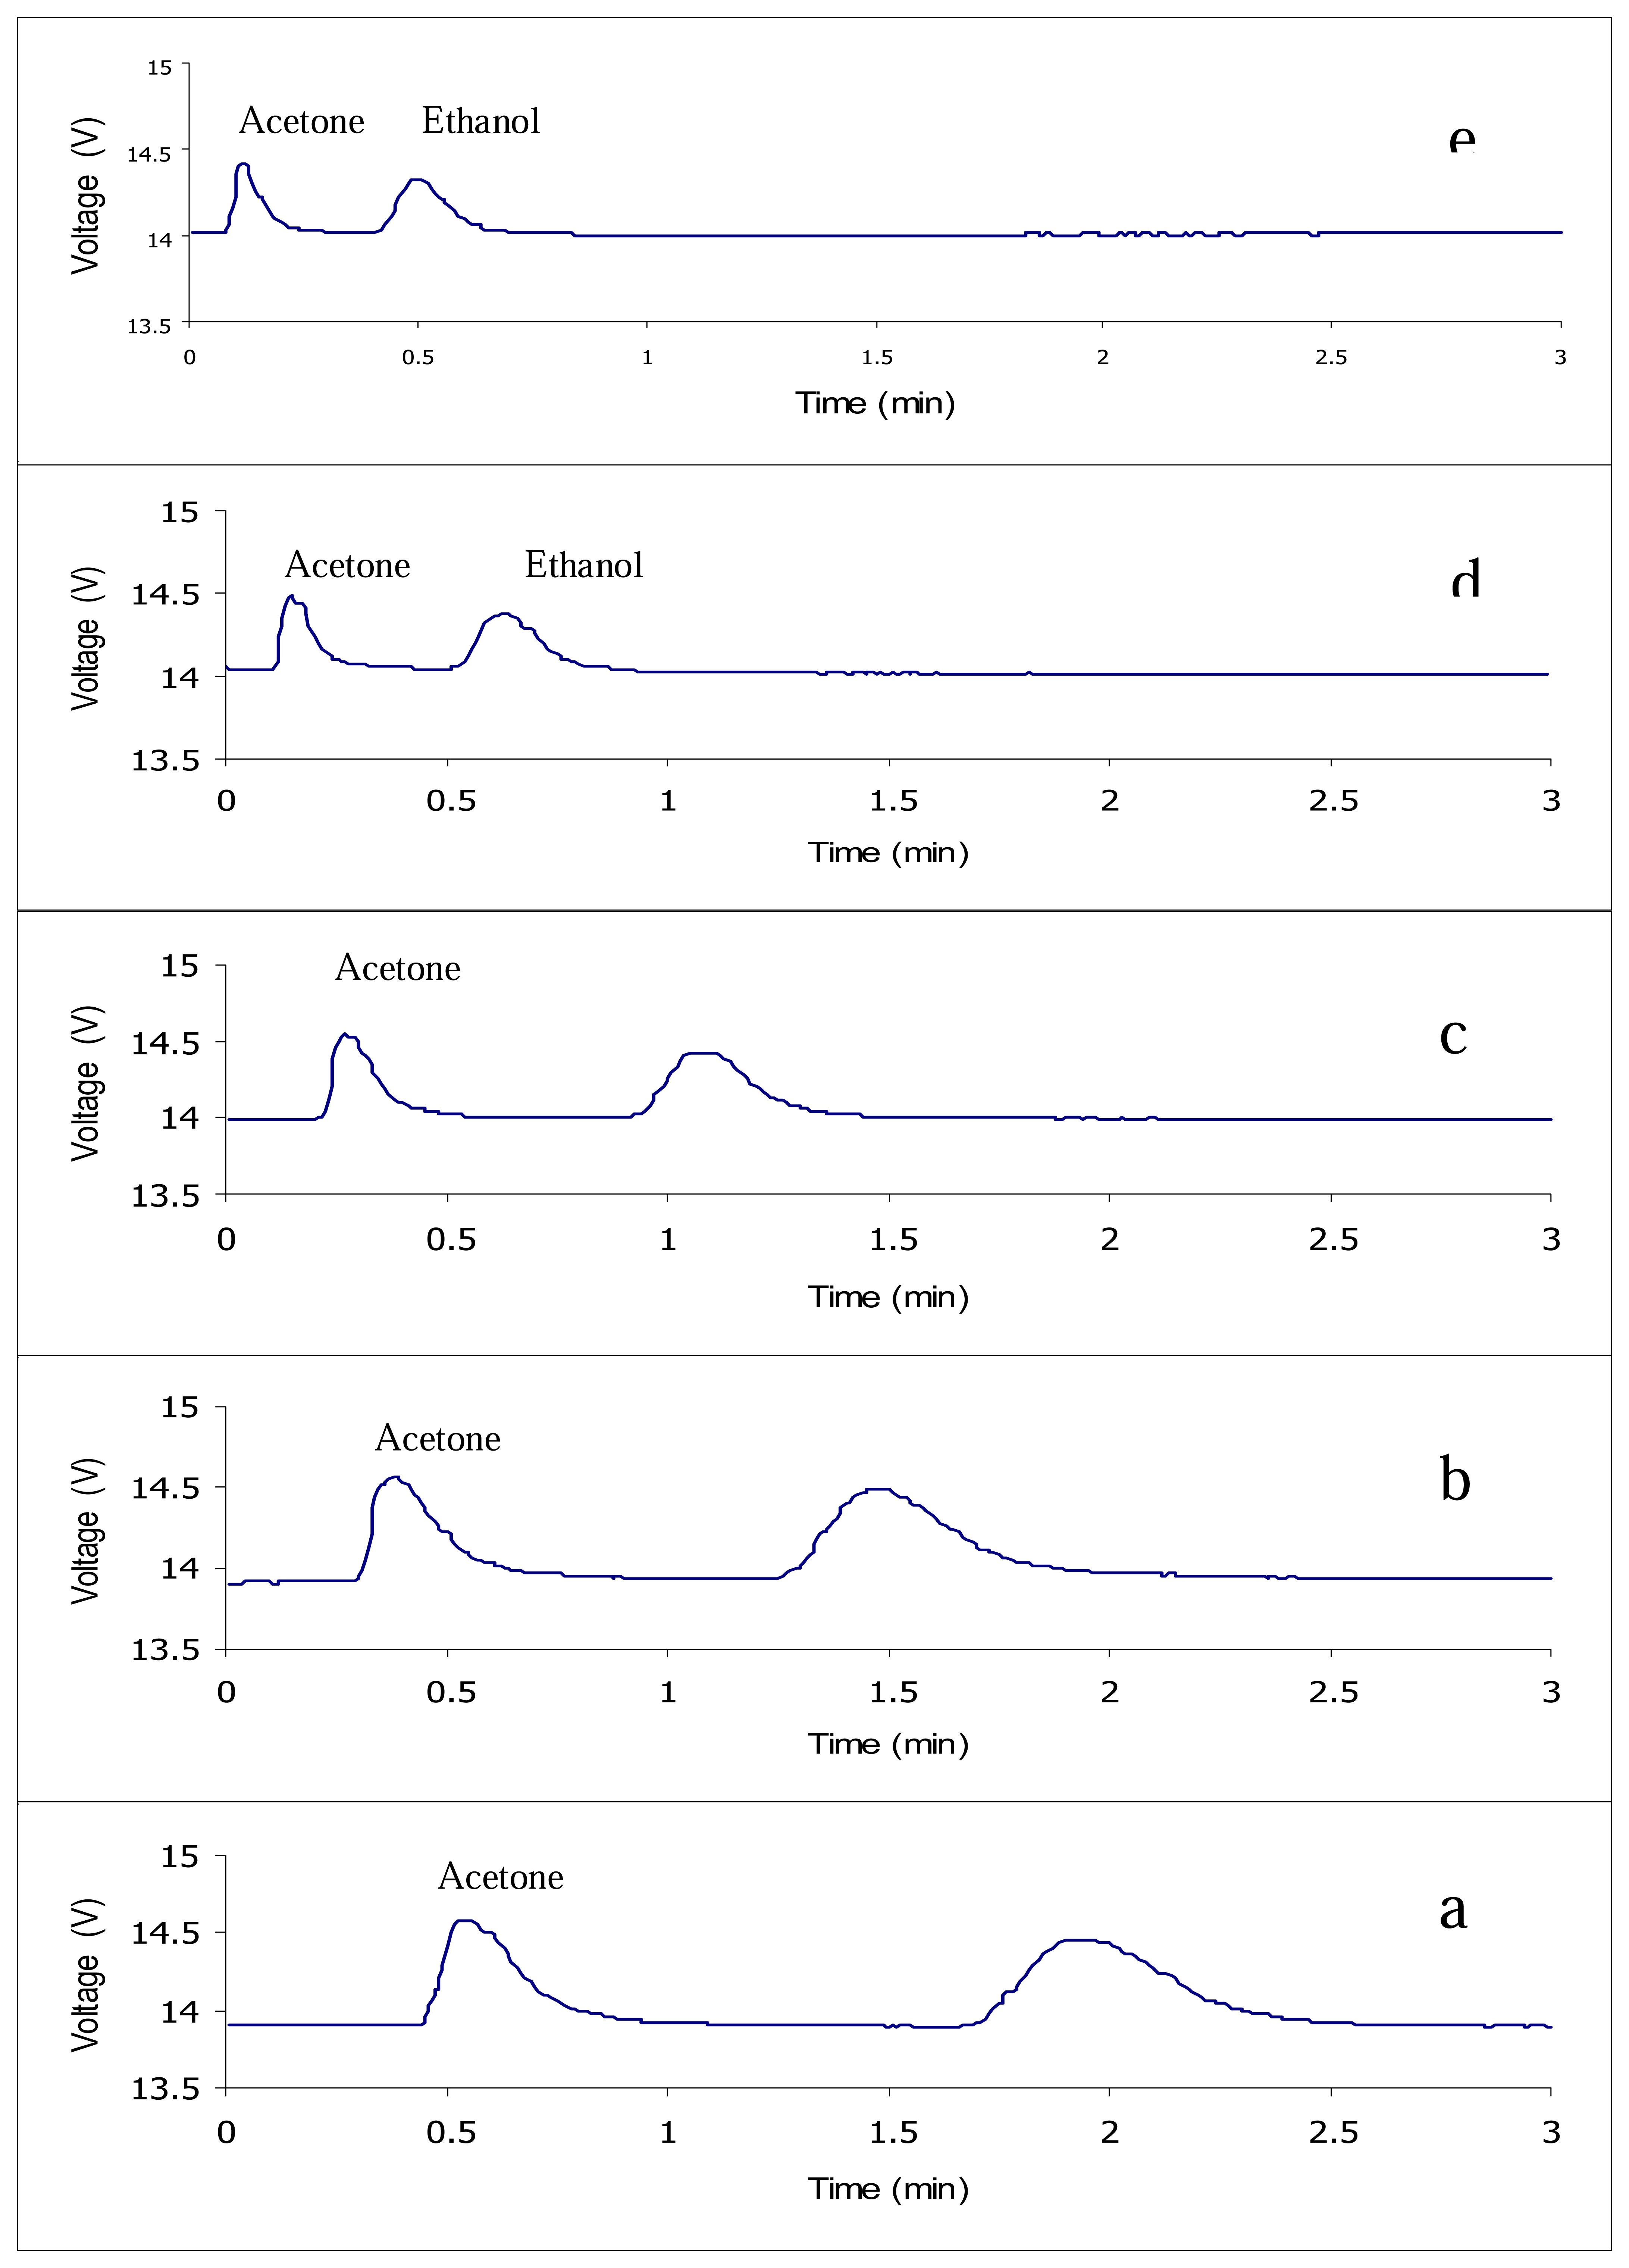
Figure 3.
Relationship between peak area and voltage of the heating coil

Figure 4.
Relationship between peak area and voltage at circuit of VC (the circuit of VC)

Figure 5.
Relationship between peak area and load resistance of circuit sensor (the circuit of RL).

Figure 6.
Relationship between peak areas of ethanol and acetone and the injection port temperature.
Figure 6.
Relationship between peak areas of ethanol and acetone and the injection port temperature.

Figure 7.
Calibration graphs of ethanol and acetone with injection volume of 1.0 μL

Figure 8.
Ethanol calibration curve in the 10-60 mg/L concentration range

Figure 9.
Acetone calibration curve in the 5-40 mg/L concentration range


| Standard | Detection limit (mg/L) | Correlation coefficient (r2) |
|---|---|---|
| Acetone | 4.41 | 0.9938 |
| Ethanol | 9.27 | 0.9908 |
© 2007 by MDPI ( http://www.mdpi.org). Reproduction is permitted for noncommercial purposes.
Share and Cite
MDPI and ACS Style
Reungchaiwat, A.; Wongchanapiboon, T.; Liawruangrath, S.; Phanichphant, S. Home-made Detection Device for a Mixture of Ethanol and Acetone. Sensors 2007, 7, 202-213. https://doi.org/10.3390/s7020202
AMA Style
Reungchaiwat A, Wongchanapiboon T, Liawruangrath S, Phanichphant S. Home-made Detection Device for a Mixture of Ethanol and Acetone. Sensors. 2007; 7(2):202-213. https://doi.org/10.3390/s7020202
Chicago/Turabian StyleReungchaiwat, Amnat, Teerapol Wongchanapiboon, Saisunee Liawruangrath, and Sukon Phanichphant. 2007. "Home-made Detection Device for a Mixture of Ethanol and Acetone" Sensors 7, no. 2: 202-213. https://doi.org/10.3390/s7020202