1. Introduction
Industries using advanced technologies - telecommunications, media, etc. - need innovative materials which can be integrated into intelligent and communicative textile structures. These materials in turn, require electronics and sensors which allow the transformation of physical phenomena, such as a strain deformation, into a measurable electrical signal.
A new generation of smart sensors has been designed for such flexible materials, because conventional sensors and gauges were not suitable as their general mechanical characteristics were incompatible with those of textile structures. Indeed, textile materials are very flexible and easily deformable in all directions, and the sensors used should be able to support, often all at the same time, tensile, shear, bending and even compression deformations. The sensors should thus be intimately integrated in the textile structure to be able to follow all these mechanical deformations, without affecting the original textile characteristics such as softness, feel, etc. Optical fibres [
1,
2], piezoelectric polymer fibres [
3], conductive polymers used in coating or spinning [
4-
7], and Conductive Polymer Composites (CPC) [
8] are some of the developments which seem to respond to these specifications.
The optical fibre solution uses the Fibre Bragg Grating principle, and the various physical parameters usually measured are strain deformations, pressure, stress, temperature, or refractive index. The main advantages of this system include flexibility, stability, lightweightness, potential low cost, lifetime, and higher temperature capacity [
9]. They can also be easily embedded in a variety of composite materials without compromising the host structures, and they provide an effective means for monitoring physical parameters along a single fibre path. This ability to determine quantitatively internal distributions of physical parameters within a textile structural composite integrated with such sensors has been demonstrated by a number of researchers [
10-
11].
Another class of sensors that may be integrated into textile structures in order to measure different physical values is based on conductive polymers. Two sub-classes can be identified: intrinsically conductive polymers (ICP) and conductive polymer composites (CPC). ICP are composed of polymer chains containing long conjugated double bonds which give rise to highly conducting properties, and they have been considered as promising materials [
12-
13]. They can be simply prepared using electrochemical or chemical oxidative methods but most ICP are infusible or insoluble in common organic solvents. However, advanced solution processing of ICP has been developed significantly over the last decade to improve their low solubility. For example, chemical modification of monomers with dopants has enhanced the solubility in the case of polythiophene and polyaniline [
14-
15].
For their part, CPC are obtained by blending - generally by melt mixing - an insulating polymer matrix (thermoplastic or thermosetting plastic) with conductive fillers like carbon black (CB), carbon fibres or nanotubes, metallic particles or conductive polymers. However, the presence of filler particles in the matrix may have a negative impact on the mechanical properties of the final composite [
16-
17], and this should be taken into account in the design of the sensor system.
An example of application of CPC can be found in electrically conductive elastomer sensors with piezoresistive properties which are integrated into fabrics to obtain wearable kinesthetic garments: used as strain sensors, they are able to detect the posture and movement of the user [
18-
20].
The advantage of conductive polymer-based sensors is that they have potentially the flexibility and elasticity which are compatible with textile structures. Moreover, it was found that the variation of electrical conductivity of these materials under stress, temperature variation, UV radiation, moisture or other vapour [
21-
22] is observable and can therefore be used as a measuring parameter. The main issue for researchers in this field is to define a mathematical model giving the most accurate relationship between this conductivity variation and the physical parameter inducing this variation.
The development in the field of CPC, also used because of its simplicity and low cost, seems therefore to be a promising approach for creating textile based sensors and has been chosen in this work. The aim is to obtain a flexible, lightweight and strong sensor for a specific application in the aeronautical field which consists in measuring the fabric deformations in a parachute canopy, especially during the opening phase when the mechanical stresses are most critical. However, this sensor also offers a great potential for use in many other applications where there is a need to measure force or strain levels in light and flexible materials. Possible applications are numerous and varied and can be found in: sportswear, airbags or other inflatable structures, safety belts, car seats, light-planes, wind sailing, medical applications, etc.
The sensor developed and presented in this paper is based on a thermoplastic elastomer/carbon black nanoparticle composite which, when integrated into a measuring system, provides an electrical signal that varies with the strain deformation of the structure. Carbon black has been used because among the available inorganic particles, it seems to offer the best compromise between electrical conductivity and price compared to metal particles such as gold, silver and copper [
23]. Furthermore, contrarily to its metallic counterparts, carbon black is not sensitive to oxidation, and is thus less problematic during processing. The use of a thermoplastic elastomer as matrix ensues from the combination of its two characteristics: this material presents the good elastic properties of a vulcanized rubber, and has the advantage of being easily processed like most thermoplastics [
24]. The most common method usually employed for processing CPC is melt-mixing which however leads directly to a solid material. This form is not adapted for application on a flexible substrate because it would be necessary to transform the composite first. The other possible technique for obtaining CPC is via the solvent-process. This is indeed the originality of the sensors developed in this work: their primary form is liquid or gel, and can hence be easily and directly deposited on any flexible textile substrate or structure, without affecting these structures' form or primary characteristics.
One of the main parameters which influence the electrical properties of the CPC sensor is the filler concentration. It is well established that the sensor sensitivity at the percolation concentration threshold is optimal [
25-
26]. However, the resistance of the sensor in the percolation range is often too high to be measured by conventional electrical apparatus, and it is necessary to find a good compromise between the sensitivity and the global conductivity leading to a sufficiently low resistance. This means that the optimal filler concentration has to be determined for a given sensor geometry and dimensions so as to obtain a measurable resistance value with the best possible sensitivity. This will constitute the initial phase of this work, before the validation of the adaptability of the sensor on a textile structure. For this second phase, a Nylon fabric is used. The sensor performance as a strain gauge for the fabric is characterized through an electromechanical investigation.
The variation of electrical resistance in a CPC sensor can result from two phenomena: the first one is a transformation in the sensor geometry, and the second one, an intrinsic physico-chemical modification of the sensor material. The first case can be applied to a stress/strain measurement: the elongation of the sensor in one direction will cause a shrinking in the other two directions, resulting in a decrease in cross-section, and the electrical resistance will increase. In the second case, the intrinsic alteration of the sensor by an external phenomenon may be caused for example by a change in the electrical conduction of the conductive particles, or by a modification in the quality of the polymer/filler particle interface. One example is the adsorption of a solvent molecule on the conductive particle surface which will necessarily influence the conductivity of the system. The global resistance of the sensor may depend on the occurrence of both phenomena at the same time. For instance, a change in temperature will both contribute to a geometrical change of the sensor resulting from thermal expansion, and to a change in electrical conduction of the filler particles themselves.
For all these reasons, CPC sensors' electrical performance will be sensitive to external parameters such as temperature, or the presence of solvent vapour. Relative humidity for example may significantly affect the electrical properties [
25-
26]. If there is a simple relationship between electrical conductivity and these external parameters and if their influence can be individually identified and modelled, the CPC sensor can be engineered to fit specific applications taking into account the influential parameters.
The influence of the climatic conditions – temperature and relative humidity - on the electrical resistivity of the sensor-integrated textile structure has been investigated in order to better understand the different phenomena occurring in the sensor structure. This study is important in view of the considered application in a parachute where, during a drop from high altitude, the climatic conditions may often cover a very wide range.
3. Experimental
3.1. Design and optimization of the conductive polymer composite sensor
The possibility to use CPC as a strain sensor has already been demonstrated in our previous work [
27]. The aim of this preliminary study is to optimize the design process of the CPC sensor and to evaluate its performance by an electrical measurement before its integration onto a textile structure. For this purpose, two preparation methods were employed: the conventional melt-mixing method, and the solvent process. The CPC obtained by melt-mixing will serve as a reference for the CPC obtained by the solvent method which will be the process used to make the final flexible sensor. The main parameter which has been studied is the filler content. In both cases, the CPC is processed to obtain solid pellets which are then compression moulded into plates.
The melt mixing process uses a ThermoHaake Rheomix 600 apparatus. The two ingredients, Evoprene (EVO) and carbon black are used in proportional quantities to obtain the following loading concentrations (in % volume): 0, 3.6, 5.4, 7.3, 9.2, 11.1, 15.0, 19.1, 23.3, and 27.6 vol.-%. The polymer is first introduced and melted at 180°C for about 1 minute with a speed of 40 rpm to obtain a stable torque. The CB particles are added and mixing is continued for 14 more minutes at the same temperature. Upon cooling, a solid block of CPC is obtained, and the final quantity of each CPC sample was about 60 g.
The second process is a novel method using a solvent mixing medium at low temperature. It was developed in our laboratory as an alternative to the melt mixing process traditionally used to make CPC. Among the different solvents which have been tested, chloroform has given the best results with the EVO/CB mixture. Both the polymer and CB were introduced, in adapted quantities, into a closed vessel with the chloroform (Aldrich). The preparation parameters were as follows: the temperature was set at 55°C, and the time of mixing was 5 hours. The mixtures were then left to dry at room temperature until all the chloroform had evaporated (max. 24 hours): the final result was a homogeneous solid block of composite, which was then cut out in pellets. Five samples with different filler concentrations were prepared: 0, 7.3, 11.1, 19.1, and 27.6 vol.-%.
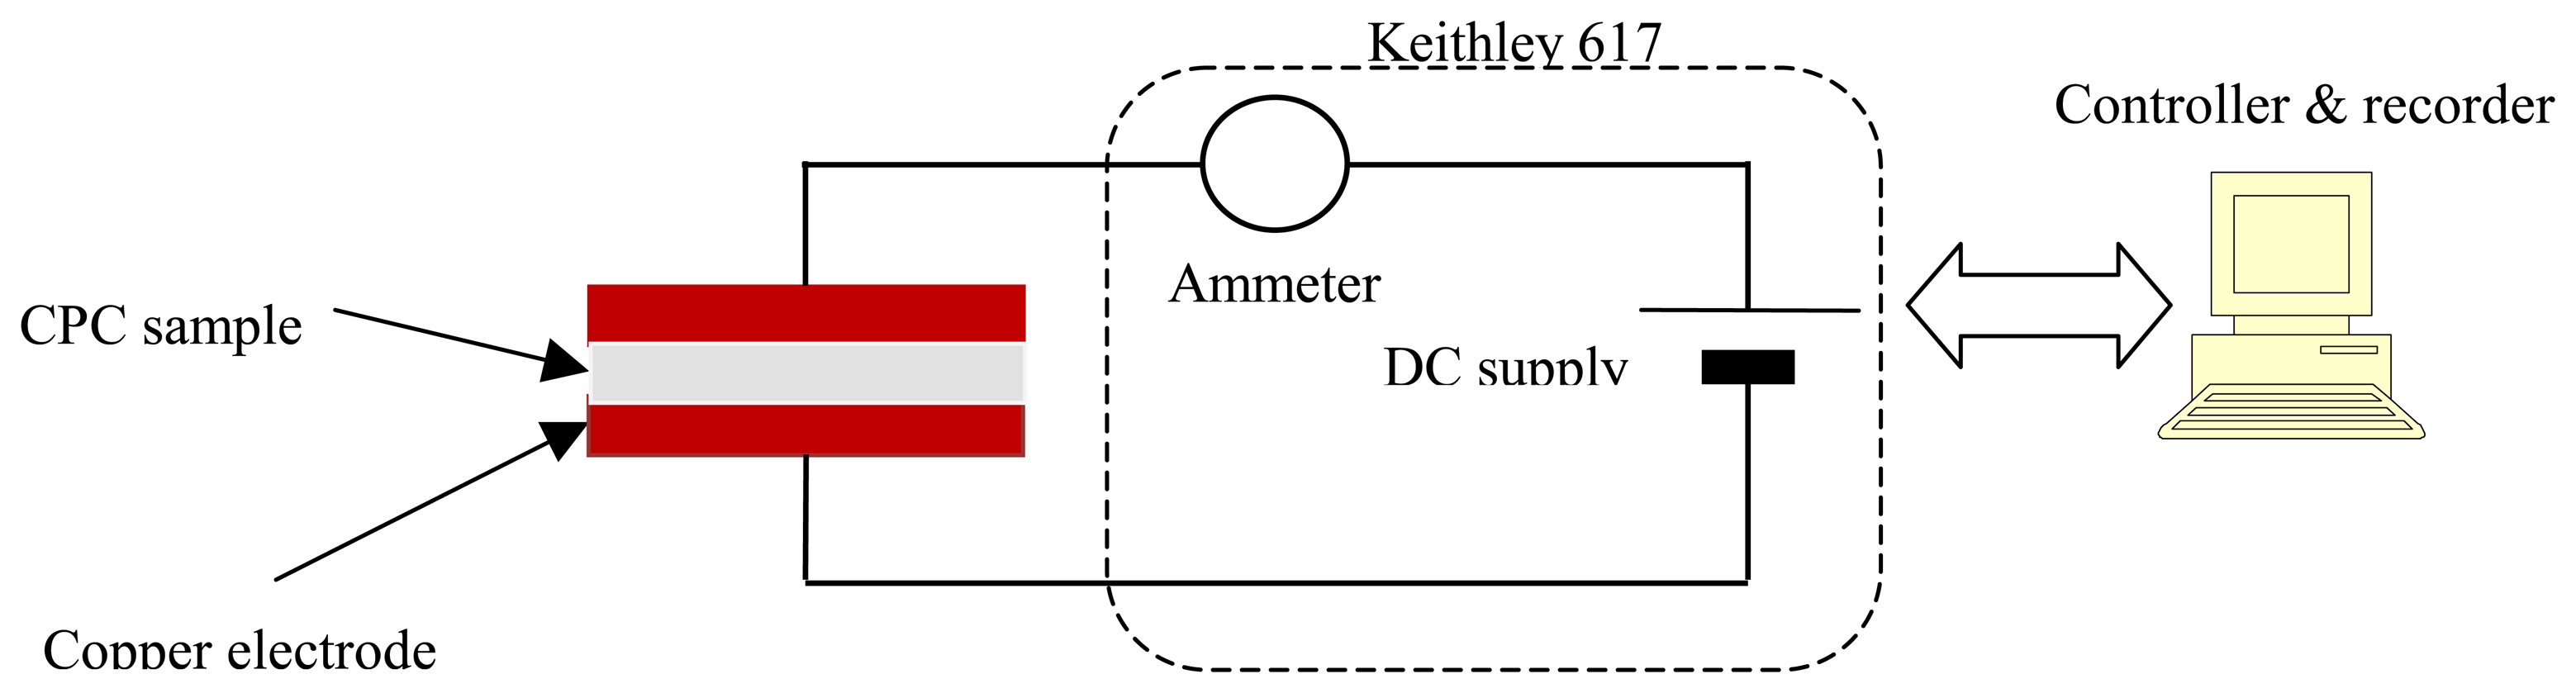
To evaluate the electrical performance of the different CPC blends and to determine the optimal filler loading level, compression moulded plates were prepared with a hot press. The CPC pellets were placed between Teflon platens heated at 200°C for 5 minutes without pressure, and a pressure of 70 bar was then applied. The platens, still under pressure, were then water-cooled to room temperature. The electrical resistance of the CPC plates was measured with a multimeter (Keithley 617). The experimental set-up is shown on
Fig. 2. Each CPC sample (20 mm × 19 mm, thickness ≈1 mm) cut from the compression moulded plates was placed between two copper electrodes. The measurement device was interfaced with a computer to record and process data.
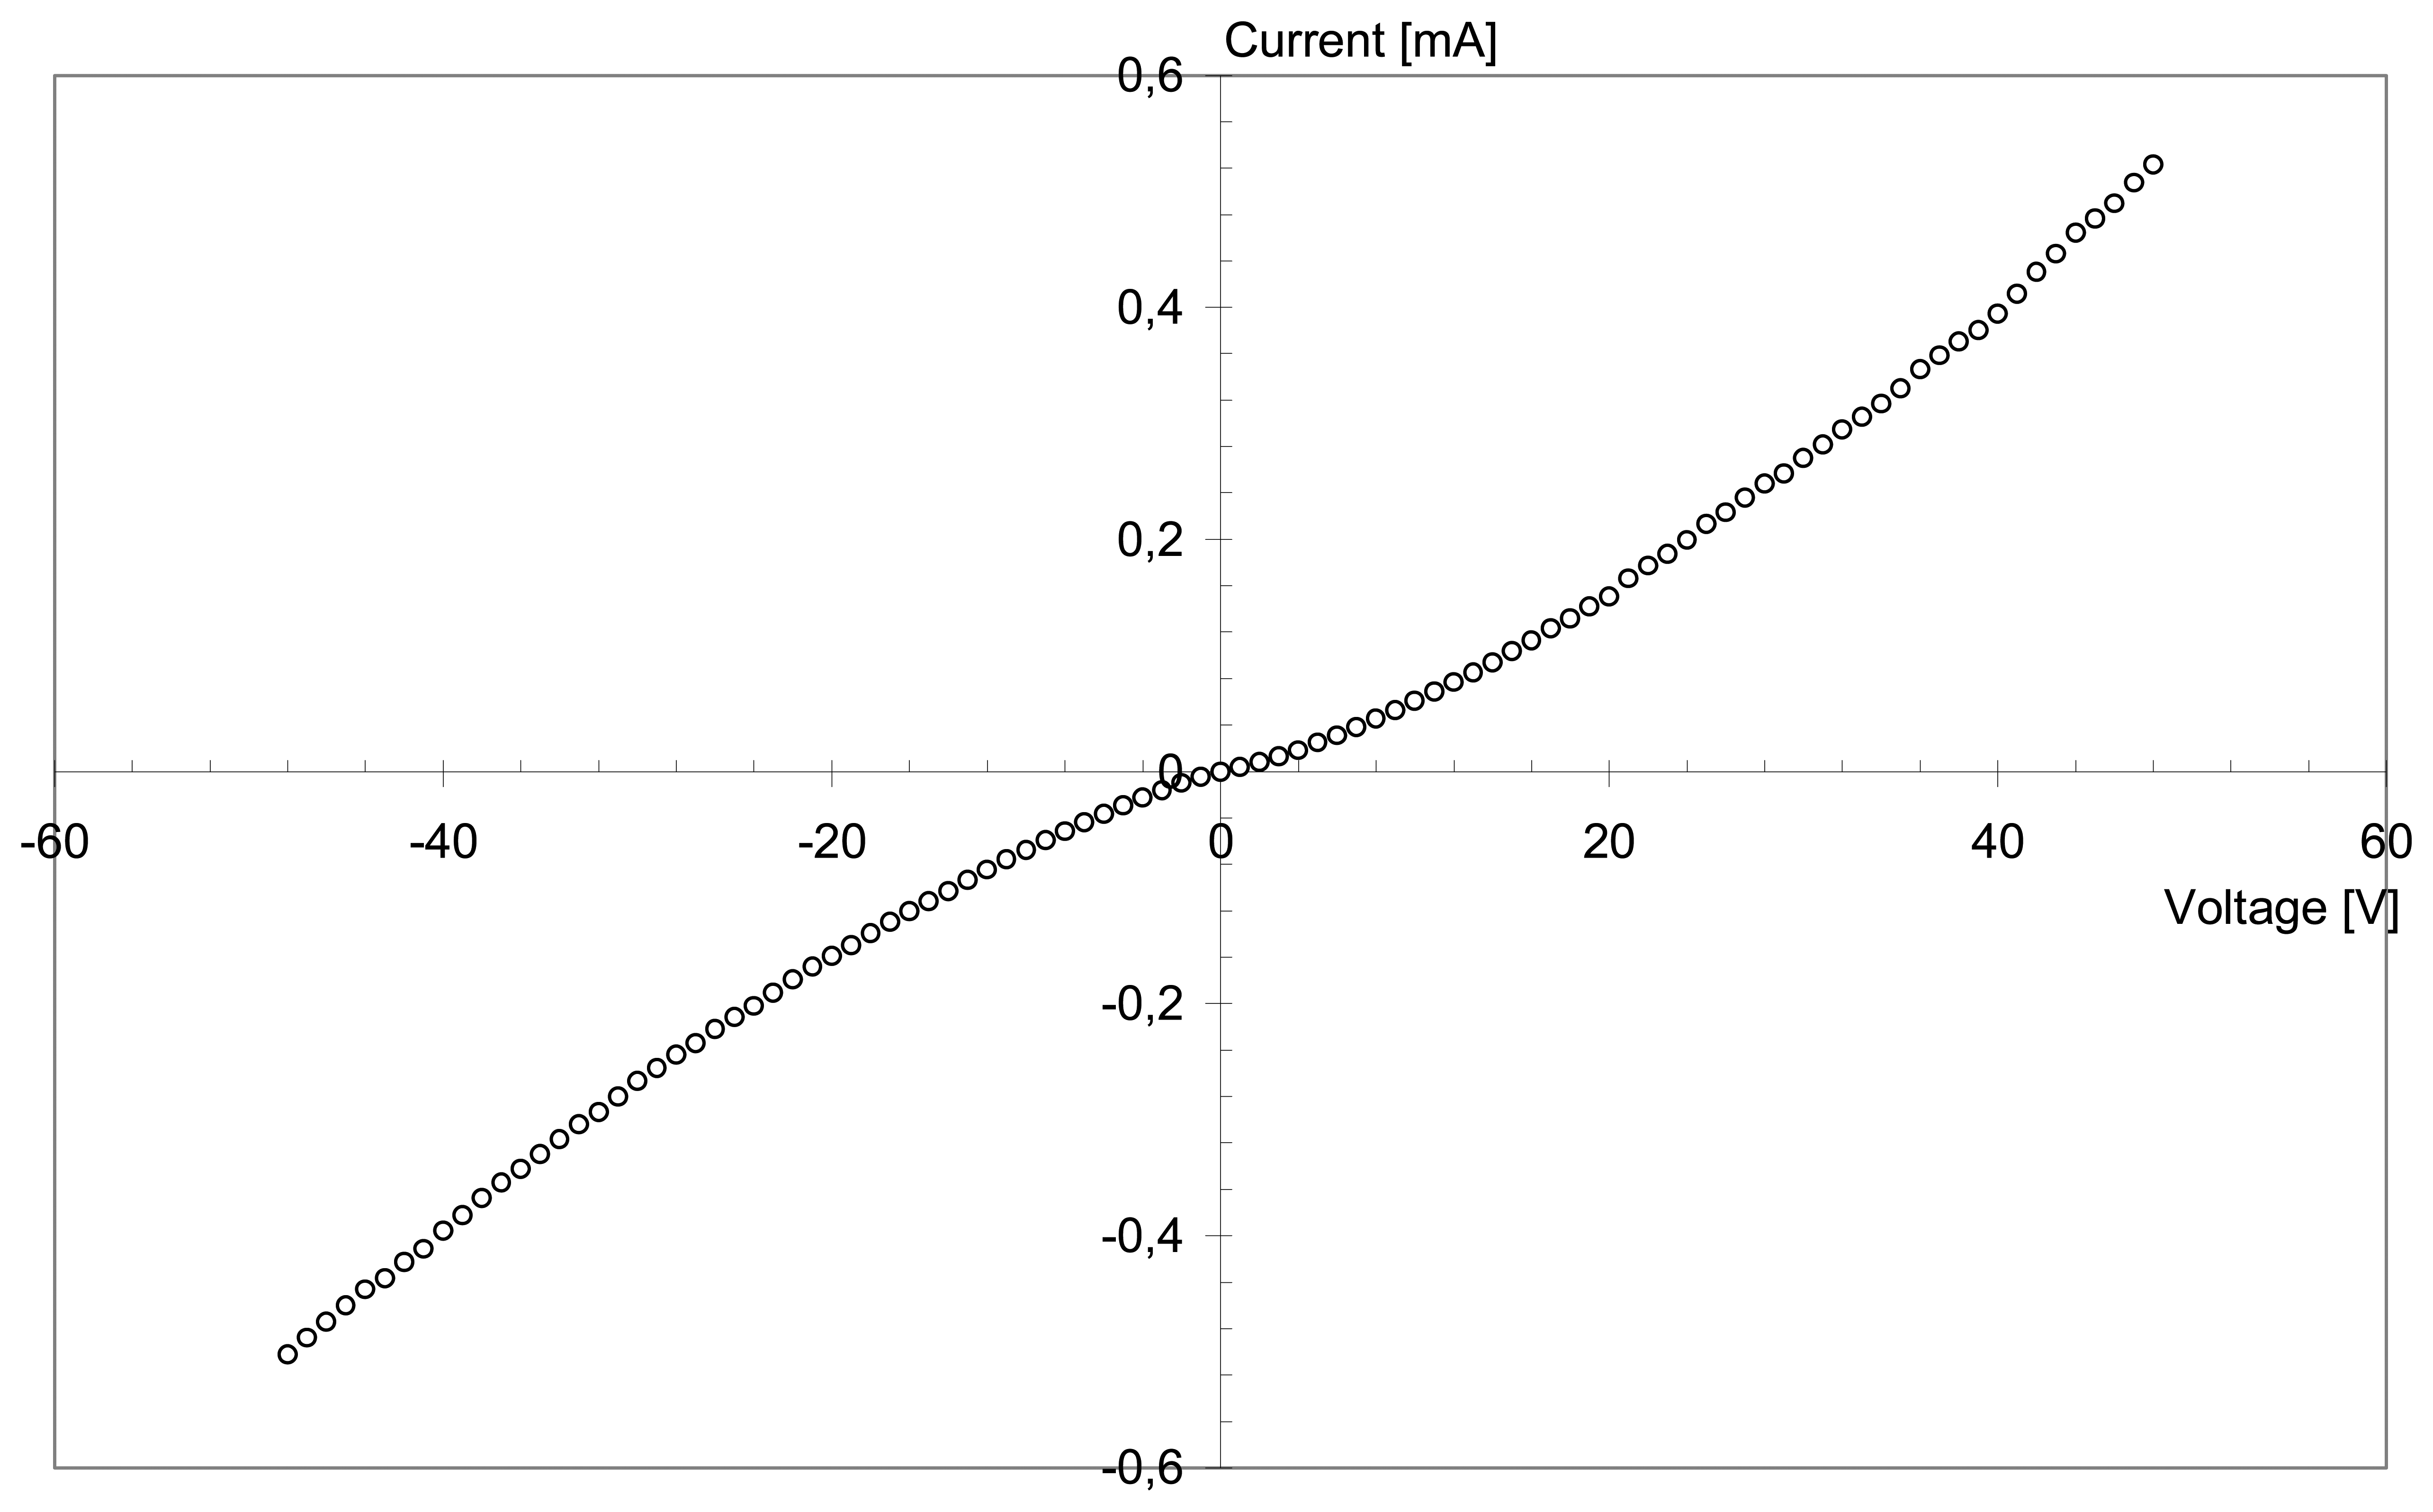
A voltage tension V is applied to the electrodes, and the current intensity I is measured. The voltage is varied from -50 to 50 V, with an automatic increment of 0.05 V. The I/V curve is plotted for each of the CPC sample, and the electrical resistance
R is deduced from the slope of the curve. The resistivity,
ρ in Ω.m, is computed with the exact sample thickness, and the results obtained are reported in
Table 3. Note that only five different filler concentrations were prepared for the solvent process (EVO/CB S).
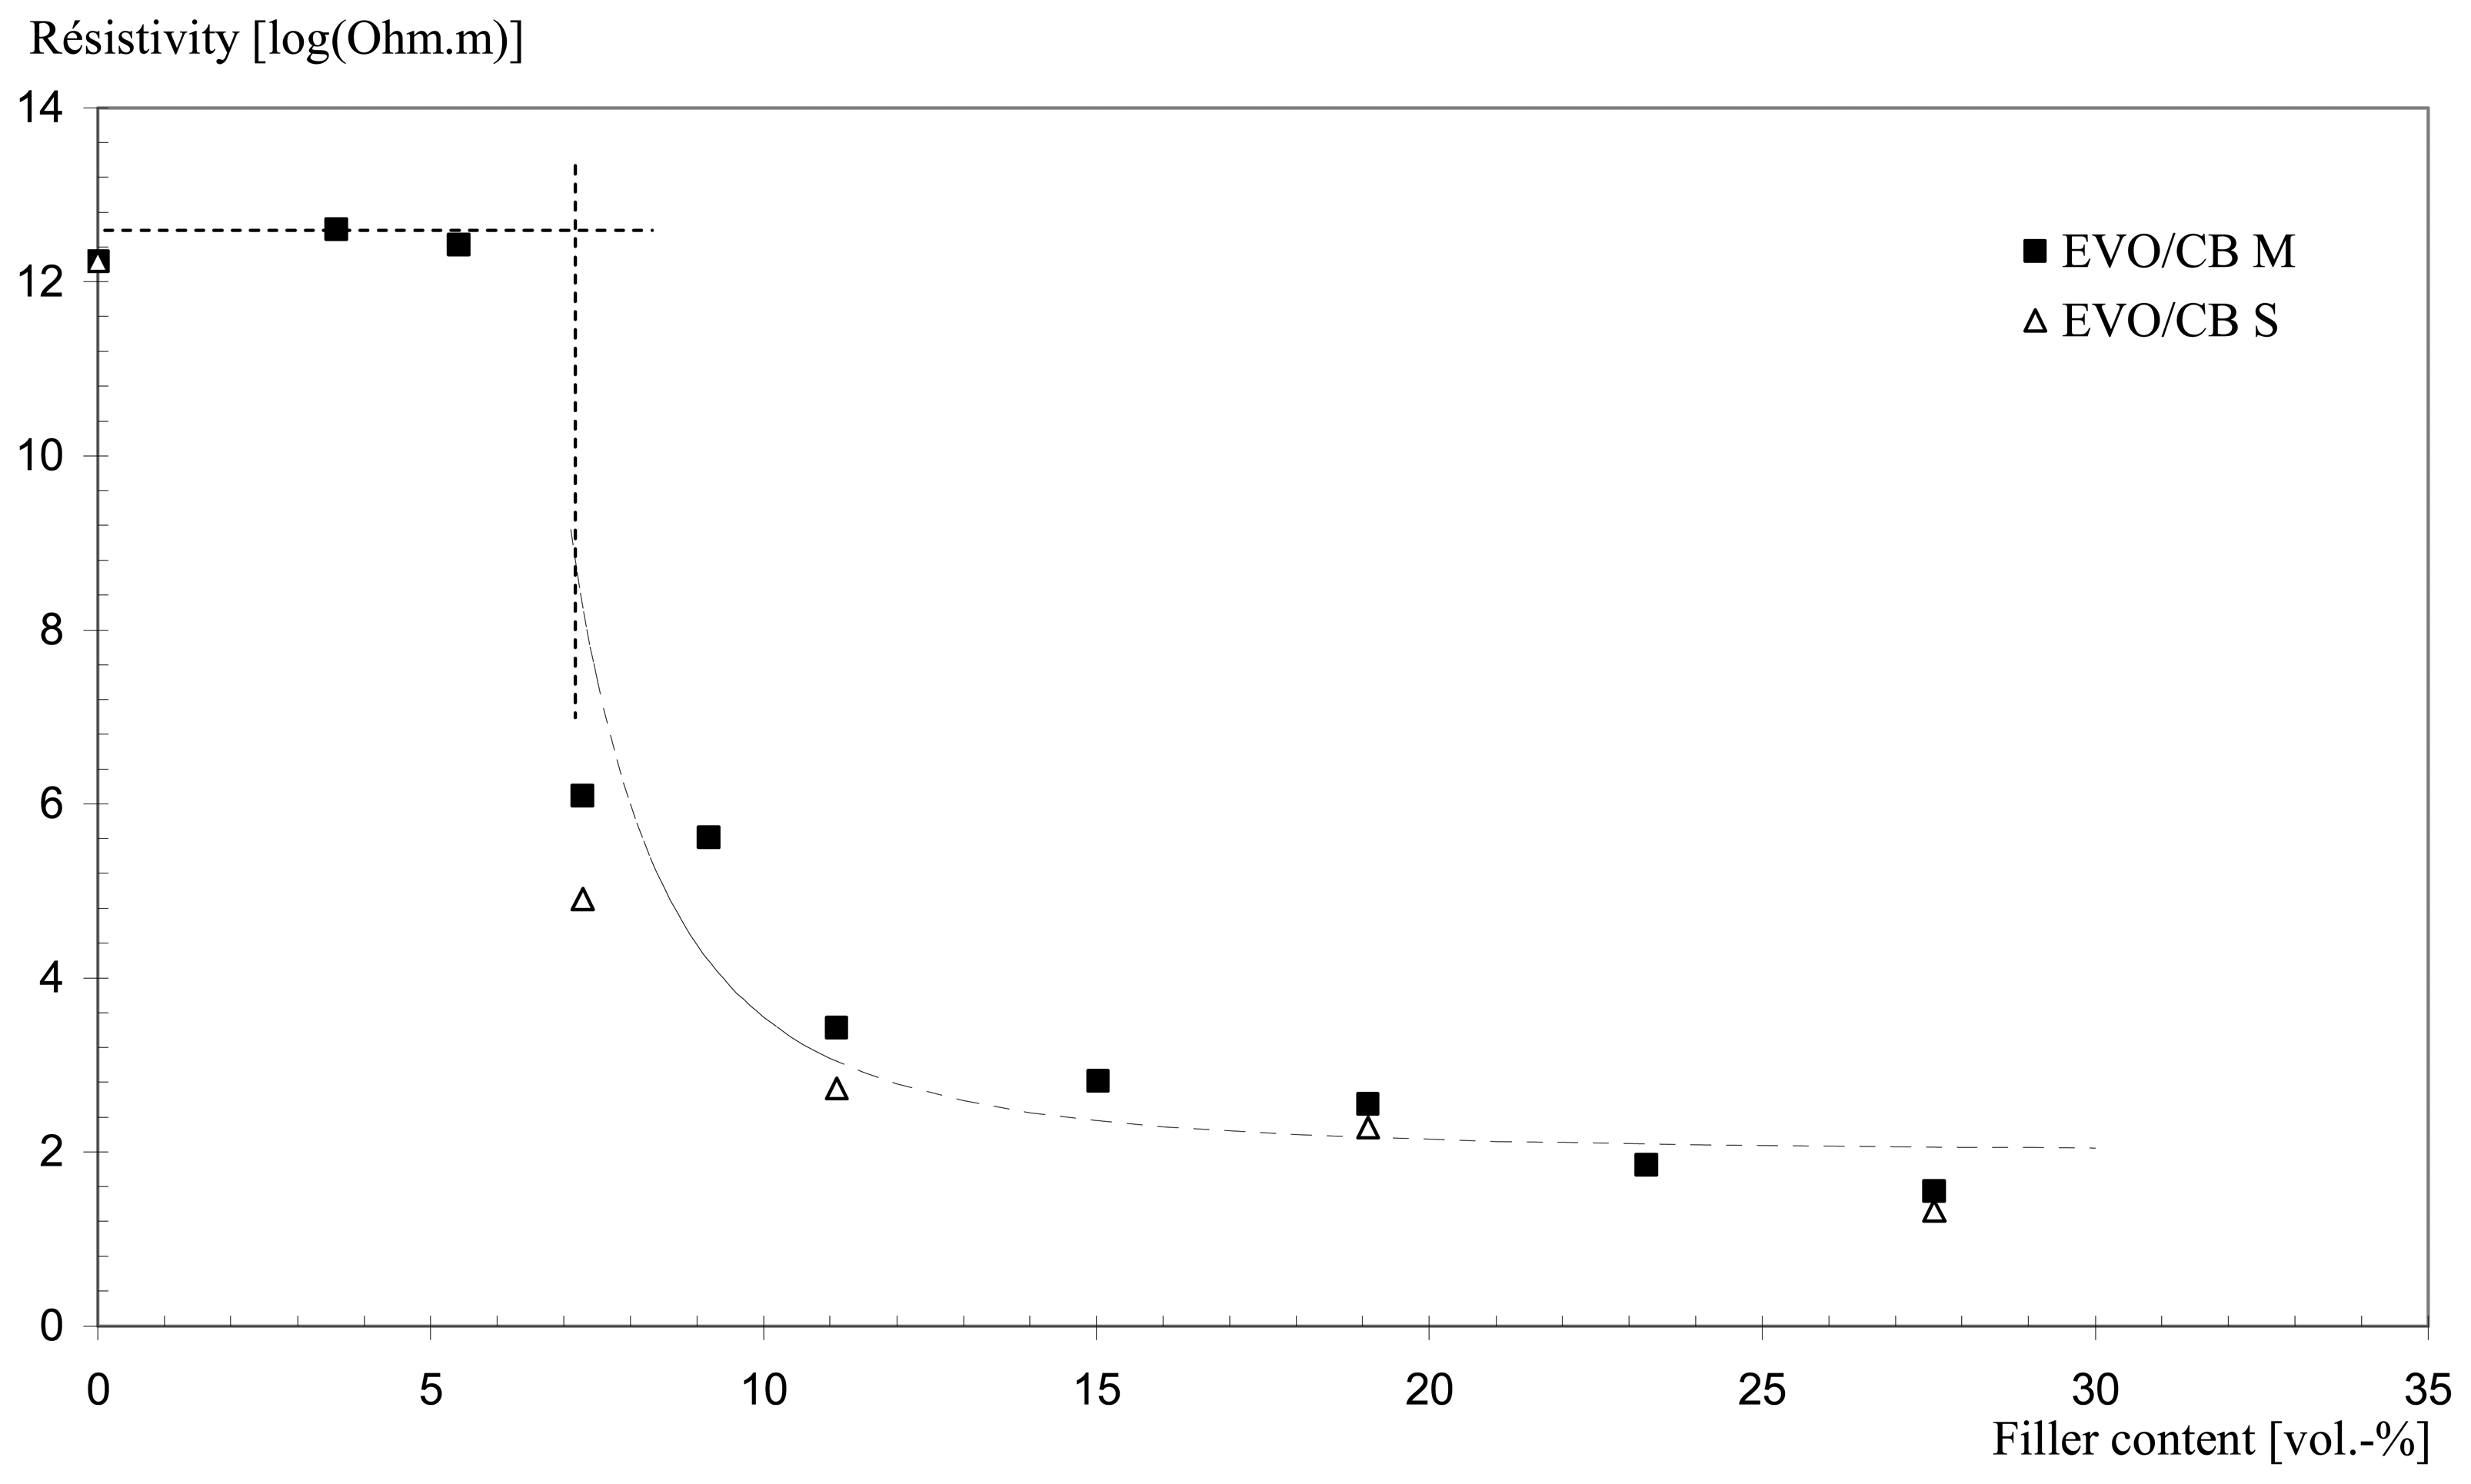
Fig. 3 shows the resistivity of the CPC plotted against the filler concentration, for both preparation methods, melt-mixing (EVO/CB M) and solvent-processing (EVO/CB S).
A dramatic decrease in resistivity, or threshold, is observed for the same given conductive filler content in both cases. This critical concentration corresponds to the percolation volume. At this point, the electric charges form electro-conductive channels, and there is a transition of the material from electrically insulating to conductive. This phenomenon is known as the percolation theory [
28]. For the two types of CPC, the same percolation threshold is obtained, and the percolation volume corresponding to a particle loading is evaluated at 7.3 vol.-%. In terms of conductivity, the solvent-processed blends seem to be better than the melt-processed ones near the percolation threshold, probably because of a better dispersion of the particles in the solvent process due to the lower viscosity of the solution.
An analogy of these CPC sensors can be found with ferro-electric thermodynamic systems. This would suggest that the sensitivity is maximal at the phase of transition. If the transition insulator ↔ conductor is assimilated to a phase transition, the electrical sensitivity of the CPC would be maximal at the percolation threshold. However, the electrical resistivity of the CPC systems at this threshold decreases over a range of ten decades of Ω.m (
Fig. 3), and conventional electrical apparatus cannot measure values over the whole range. If it is admitted that a resistivity value of 10
2 Ω.m is acceptable for an electronic application, this means that the filler content in the EVO/CB composites must be greater than 23 vol.-%.
Moreover, in most cases, the I/V curves obtained are close to linearity but for filler loadings around the percolation threshold, an inflexion is observed (
Fig. 4),
i.e. the electrical conduction is non-ohmic. Before the formation of a sufficient number of conductive paths in the CPC, the electrical conduction is partly based on a tunnel effect [
29]. When the conductive particle concentration increases, the number of ohmic conductive paths increases, and the I/V relationship becomes more linear.
The non-ohmic relationship (
Fig. 4) observed in the percolation range can be formulated by the following equation [
30]:
The power index
n translates the deviation from the ohmic conduction, and
n =1 corresponds to the ideal situation of perfect ohmic behaviour.
Table 4 shows the values of n obtained for the different CPC blends.
For given filler content, the n values for the blends obtained by the solvent process are closer to 1, compared to those of the melt-mixing process. The CPC from the solvent system thus seem to be closer to an ohmic system, especially for high filler concentrations, above 20 vol.-%.
For an electronic application of the CPC, it is better to have a sensor which presents a linear behaviour (n close to 1), to ensure a good quality electrical response. Considering also that the resistivity of the system should be in a measurable range (<100 Ω.m), the optimal CPC blend should contain at least 27 vol.-% of CB particles. However, this corresponds to a filler concentration far from the percolation threshold, meaning a lesser electrical sensitivity of the sensor system. It is therefore important to have a good compromise between sensor sensitivity and resistivity value.
3.2. Integration of CPC sensor on a textile substrate
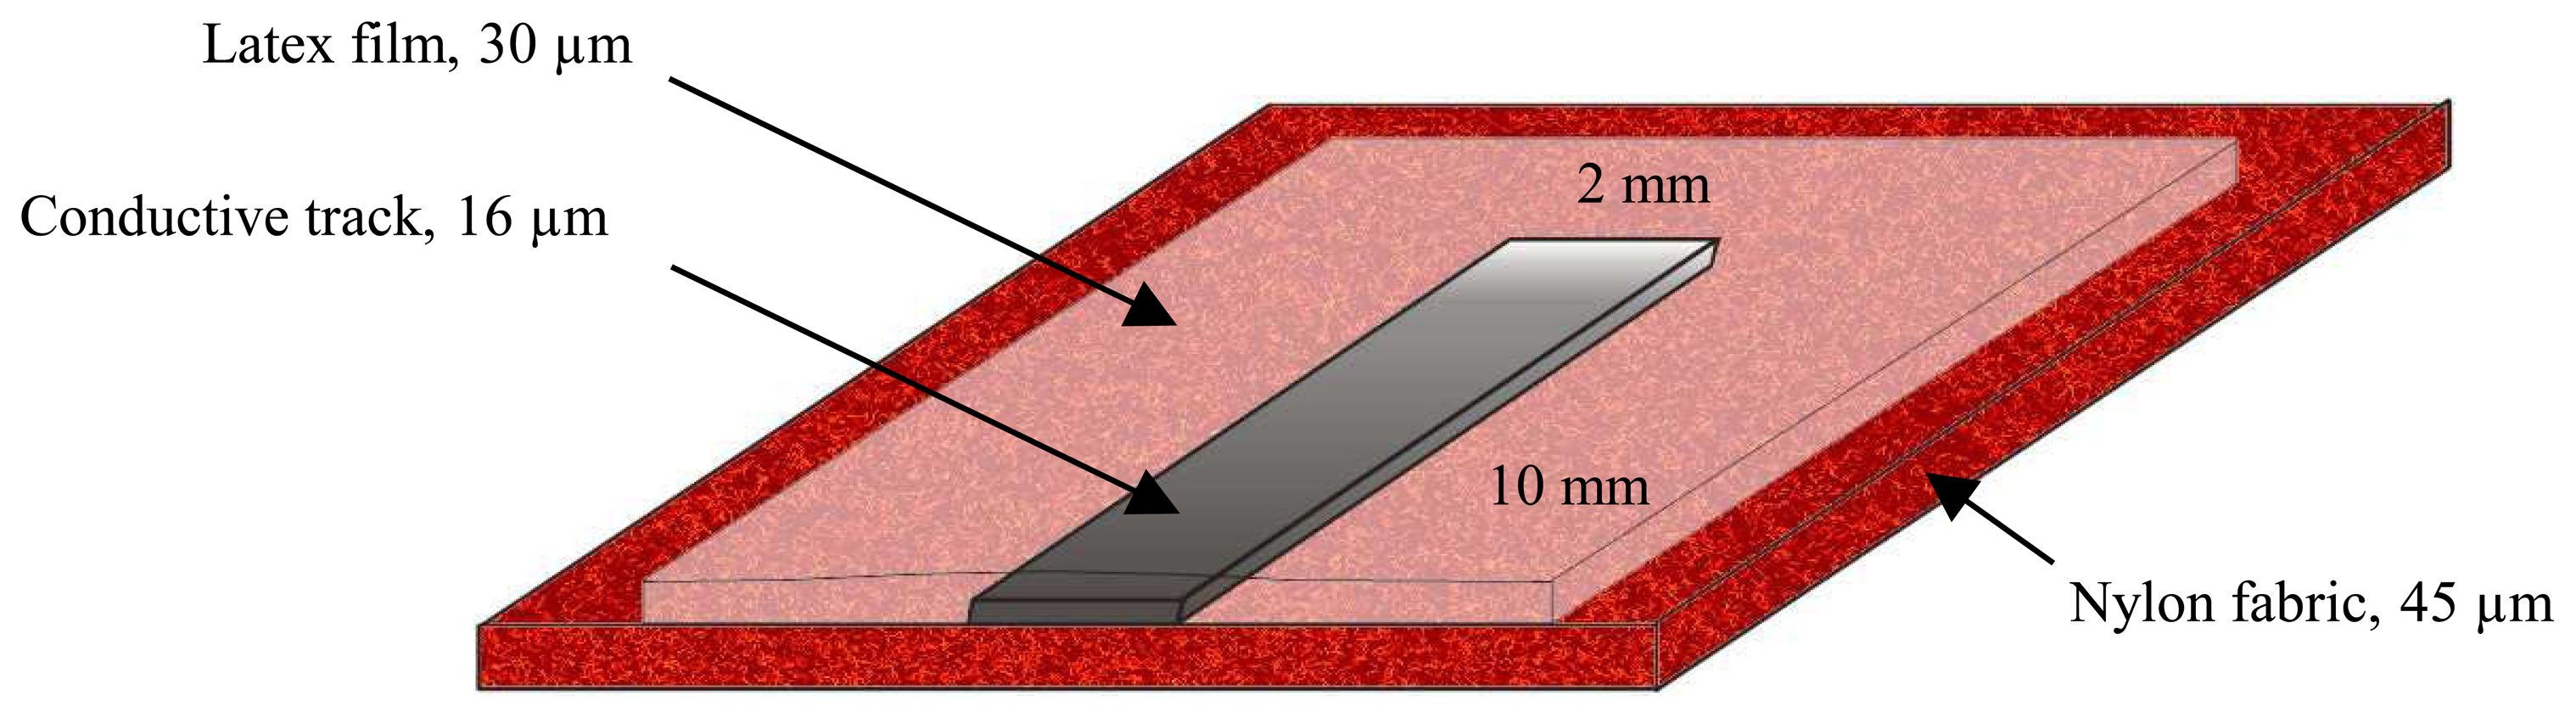
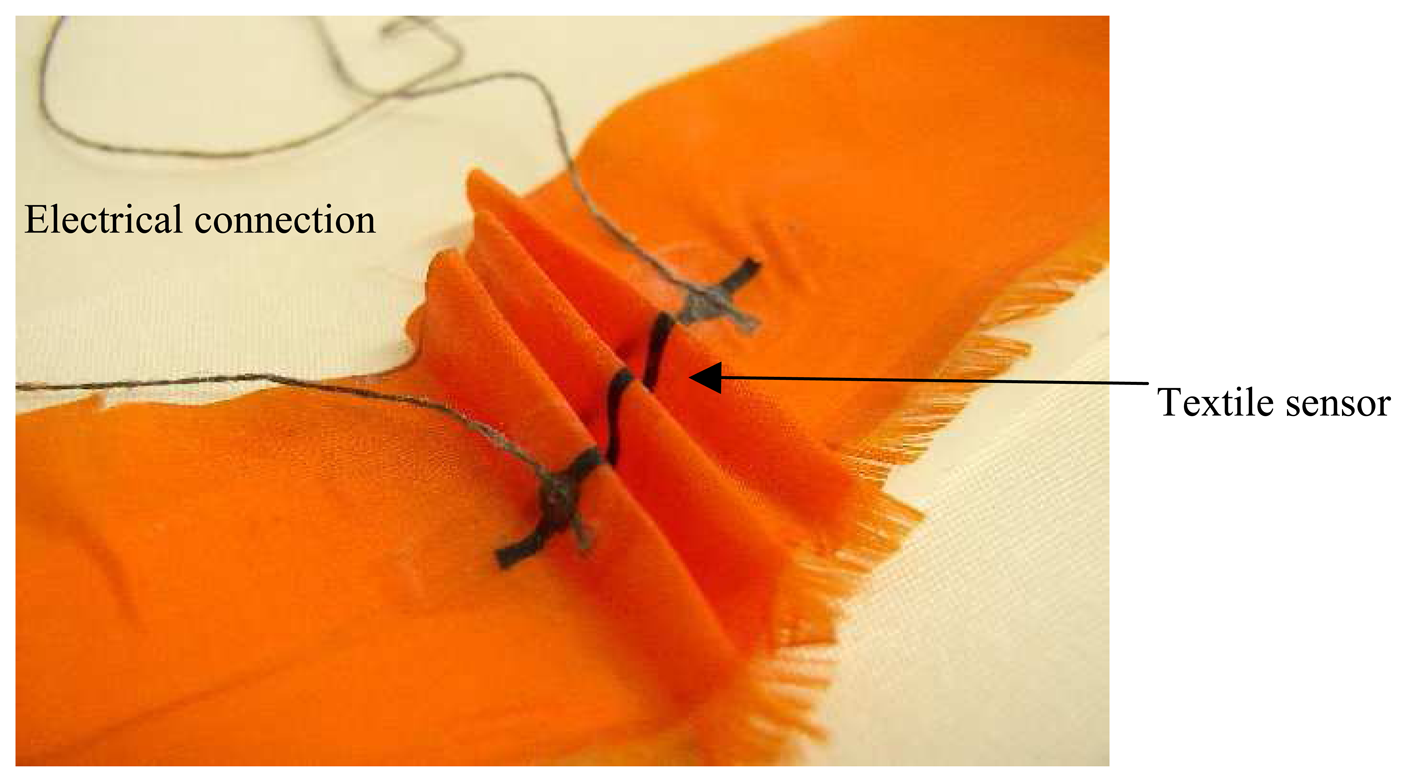
The CPC sensor is integrated on a Nylon fabric and electromechanical measurements are performed to test the adaptability of the system as a strain gauge on a fine and flexible structure. The preparation is carried out as follows: the fabric sample is stretched out on a flexible support, and a thin rectangular mask – 2 mm × 100 mm × 125 μm - cut out in a self-adhesive plasticized paper, is fixed on the fabric. The longer dimension is placed parallel to the weft. A small amount of the CPC solution (Evoprene/carbon black/chloroform) prepared by the solvent process method is deposited at one end of the mask, and scraped over the length of the mask to the other end with a blade. The mask is then removed, and after a time of drying at room temperature for 2 to 3 hours maximum, the evaporation of the chloroform solvent leaves a fine black track of Evoprene/carbon black conductive composite. The thickness of the track is measured with an optical profilometer (Altisurf 500, Coltec) and is found to be equal to 16 μm.
The next step is the setting up of the electrical connections on the sensor. Two stainless steel yarns (from Bekintex) are used, each composed of 2 × 175 filaments (individual diameter of 12 μm). Each one is connected to each extremity of the sensor track. The points of contact between the sensor and the steel yarns are covered with a small drop of CPC solution which upon drying ensures a good electrical connection. The final distance between the electrical contacts is 80 mm.
Finally, the whole sensor system is covered with a protective latex film. This is done by spraying the latex solution (Appretan® 96100) on the sensor, and a mask is used to confine the application of the film around the conductive track. A latex film of about 30 μm is obtained.
The final sensor system has the following dimensions: 10 mm wide, 110 mm long and only 46 μm thick.
Fig. 5 shows the schematic representation of the sensor structure. These geometry and dimensions have been chosen for two reasons: the first one is to obtain a good longitudinal sensitivity of the sensor, and the second, to have a good compatibility of the sensor to the common textile structures. A length/width ratio of 40 means that, when there is an isotropic deformation of the textile substrate, the change in electrical resistance will be 40 times greater in the longitudinal direction than in the transverse one. As for the dimensions, they have been chosen to fit the textile fabric used, which is composed of about 5.7 yarns/mm. Indeed, a too local measurement, on 1 to 4 yarns for example, will not give enough information on the global deformation of the structure. The sensor width used is of 2 mm and provides an average measurement over a dozen yarns, which is more representative of the structure's deformation. Moreover, the size of the textile structures employed in different applications such as nautical or aeronautical is very large (dozens of m
2) and the sensor size should therefore not be too small. Finally, the sensor system thickness is relatively small in order to preserve the flexibility of the textile structure, and hence to have the best “conformance” of the sensor to the substrate, or in other words, to obtain the most “invisible” possible sensor which will not affect the host structure's mechanical characteristics.
Fig. 6 illustrates the flexibility of the Nylon fabric with the integrated CPC sensor (black track), with the setting up of the electrical connections.
The sensor dimensions are also important in determining the range of deformation measurements resulting from mechanical vibrations. A strain sensor can account for dynamic deformations if the length
L of the strands constituting the sensor is very much lower than the wavelength
λ of the mechanical vibrations [
31]. Generally, the following rule applies:
L < 0,1×
λ, with :
where,
E: Young modulus of the material (equal to 200 MPa for the Nylon fabric used),
d: density of the material (1.14 for Nylon),
f: frequency of mechanical vibrations.
Hence, a strain gauge of 80 mm should theoretically be able to measure mechanical deformations up to a frequency of 16 kHz.
4. Results and Discussion
4.1. Electromechanical properties
The electrical properties under strain were measured on the Nylon samples prepared with the sensor as described above (Part 3.2). The conductive filler concentration used was 27.6 vol.-%. The sample was mounted on a tensile testing machine (MTS 2/M universal tester), with the sensor track positioned parallel to the direction of fabric extension, and at the centre of the test specimen. The rate of extension was 16 mm/min, and the electrical resistance of the sensor was recorded during this extension. Since the different sensor specimens will necessarily present slight variations in their intrinsic resistance values, a normalized relative electrical resistivity is defined to characterize the sensor's electrical property:
where
Ri is initial resistance of the sensor,
i.e. without any extension, and
R the resistance at a certain length
l of the sample.
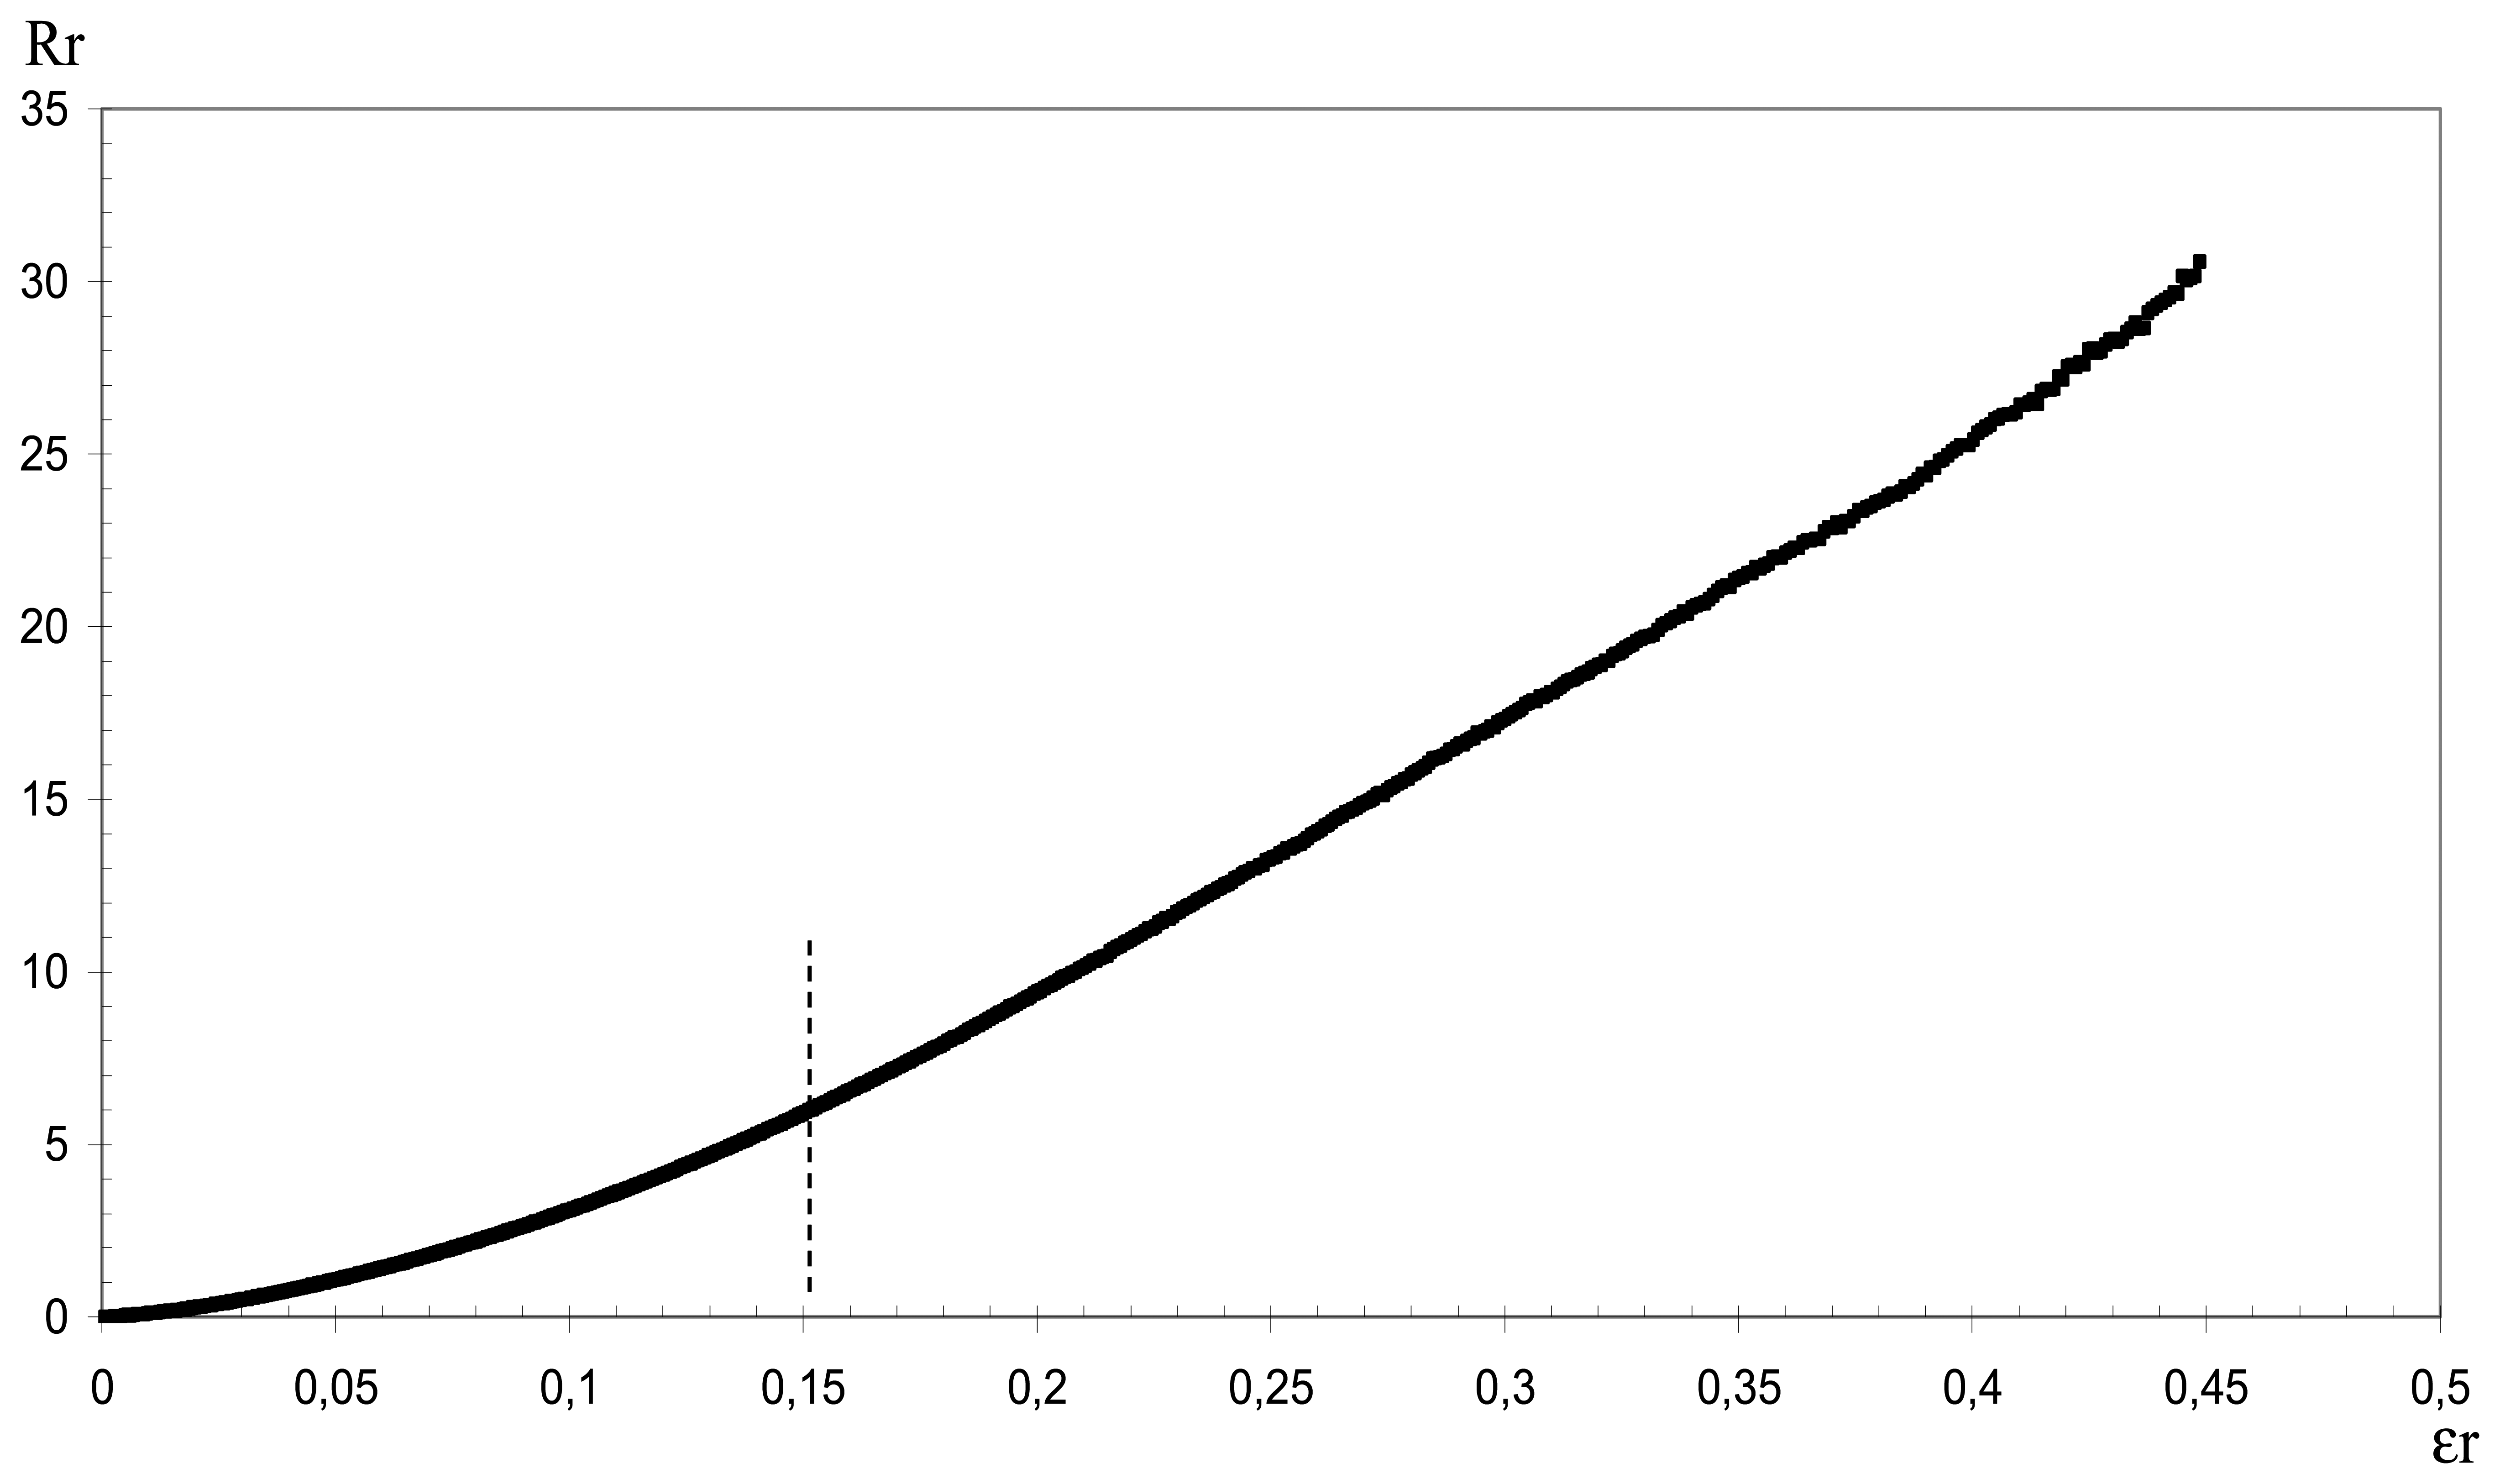
Fig. 7 shows the dependence of this parameter on the relative strain
εr (in mm/mm):
where
li represents the initial length (200 mm), and
l the extended length of the fabric sample.
The curve shows a very important slope,
i.e. resistivity increases rapidly with extension. The elongation at break of the fabric is 45% (
εr = 0.45), and it can be noted that the sensor has given an electrical resistance measurement over the whole range of elongation of the fabric until break. The curve obtained on
Fig. 7 can be divided in two regions: the first one corresponds to a strain below 15%, where the sensor response is not linear. In the second region, for strain values greater than 15%, the sensor response is practically linear (correlation coefficient R
2> 0.99). A gauge factor
K can hence be determined for this zone:
K was found to be equal to 80. For classical metallic conductors (copper, nickel), this factor is 2.1 at the maximum. However, the strain range covered by a classical metal gauge is between 0.1 and 0.5% [
31]. This exceptionally high value of
K for the CPC sensor can be explained by two factors: on one hand, the change of geometry of the sensor, and on the other, a change in the percolation network of the system.
The electrical resistance of a given material depends on its length
l, its cross-sectional area
S, and the intrinsic resistivity
ρ of the material:
The longitudinal extension of the sensor leads to a shrinking in the cross-section area
S, and according to
eq. 6, the resistance
R will increase. Moreover, an extension of the sensor length will cause a decrease in the number of electrical connections between the conductive particles in the CPC, and the resistance will thus increase. The combination of these two phenomena will therefore lead to an important increase of the resistance for a small strain deformation.
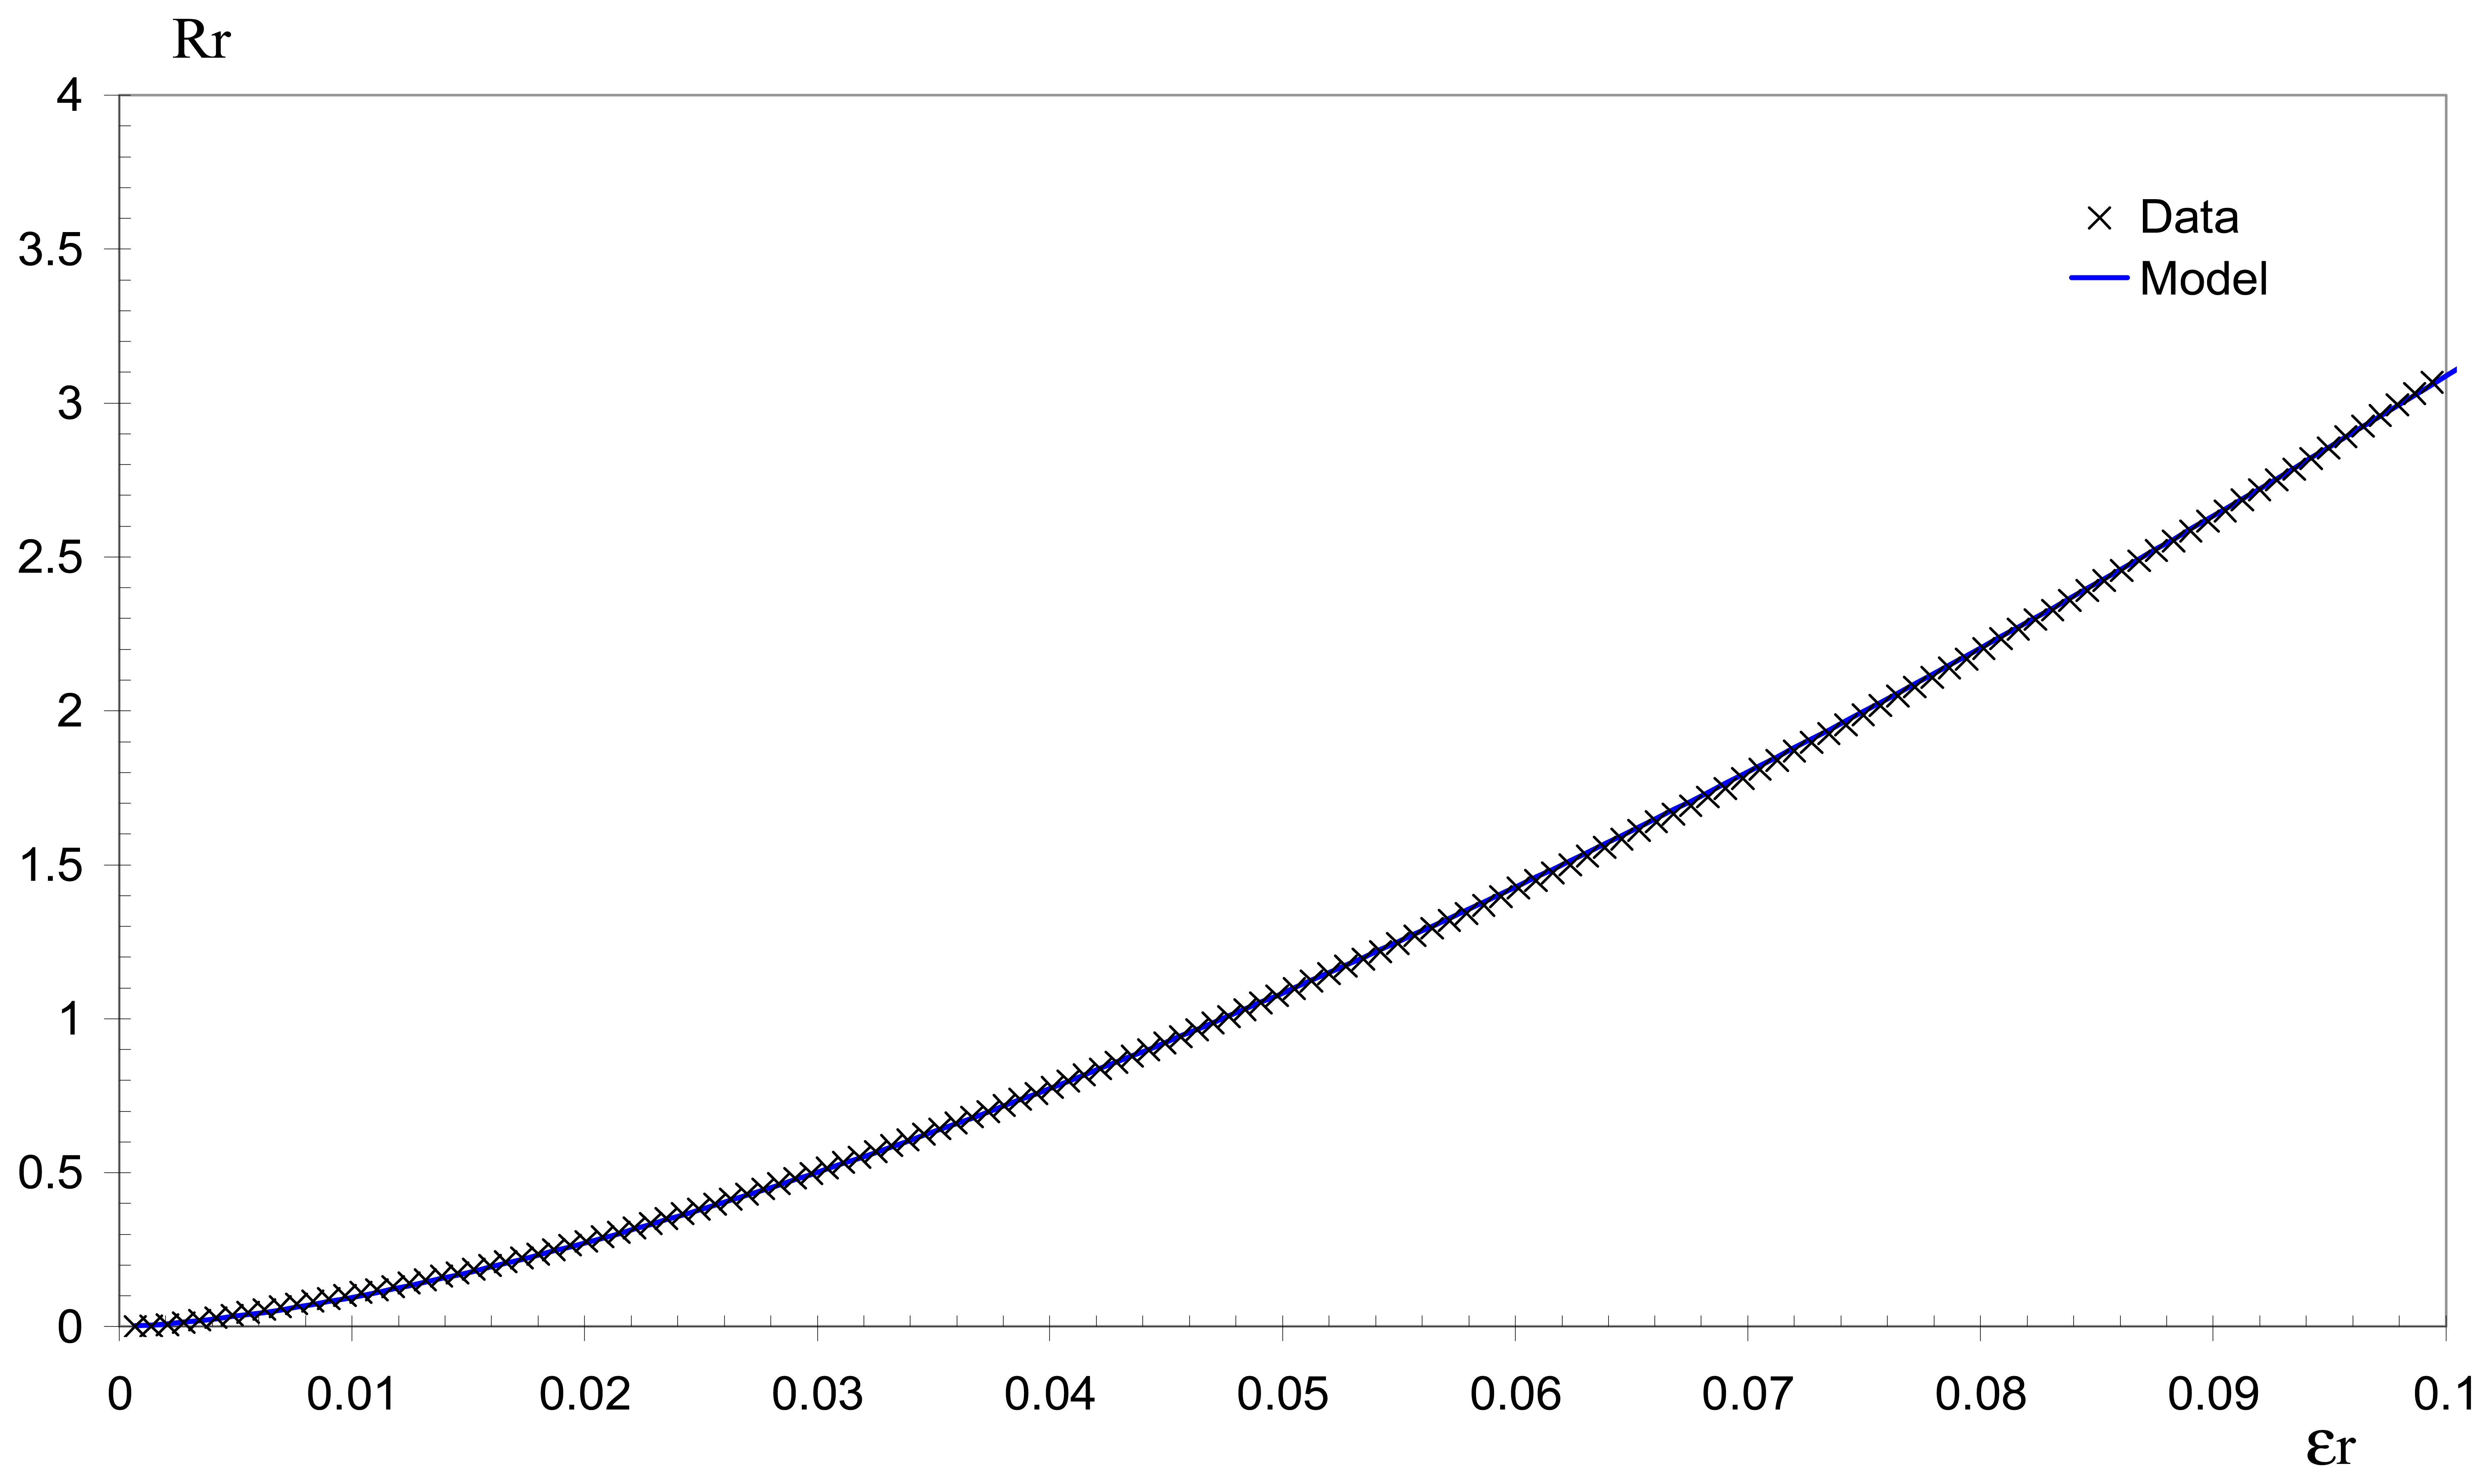
The first non-linear region (0 to 10% strain) is particularly interesting with regard to the sensor applications and the substrate used. Indeed, a textile fabric shows an elastic behaviour for strains below 3%. The electromechanical behaviour in this zone can be modelled by the following relationship:
The conformity of this model with experimental data is illustrated on
Fig. 8.
The average gauge factor K in this range is 31. The non-linearity of the behaviour may be explained by the competition between the geometrical influence, the change in the percolated system structure, and the re-arrangement of the system's network. The first two factors have been discussed previously for the linear region. The third point seems more complex. The composite structure is re-arranged by a slipping of the polymer chains, more precisely, the amorphous chains slip over each other while the rigid blocks stay in place. At the same time, the carbon black nanoparticles (or their agglomerates), which are under stress due to the applied strain, are in an unstable position, and they tend to move to a more favourable or stable position. This may result in an irreversible re-arrangement of the global structure, leading to a change in the electrical resistance of the composite system. Other types of rearrangement may also occur at the different interfaces (CPC / fabric, or CPC / latex). A small extension on the fabric may indeed cause a slipping, or rotation of the yarns one over another and these movements may locally induce stress overshoots which can affect the conductivity of the sensor.
4.2. Influence of climatic conditions on the electrical properties of sensors
The dependence of the electrical properties of the sensor on climatic conditions is investigated with a climatic chamber (Excal 2221-HA, Climats®). Fabric test samples are prepared in the same way as in the previous electromechanical measurement. The concentration of filler particle is kept at the same value, 27.6 vol.-%.
The fabric samples are mounted on a metallic grid which is placed at the centre of the chamber. Each sensor on its fabric sample is connected to an ohmmeter, placed outside the chamber and interfaced with a computer to record the electrical resistance (R) of the sensors during the experiment.
Two kinds of experimental cycles are applied: an isothermal cycle in which the temperature (T) is kept constant while the relative humidity (RH) is varied, and an iso-humidity cycle, in which the two parameters are inverted, i.e. RH is kept constant and T is varied. In each case, the varying parameter undergoes a complete cycle. The temperature cycle takes place between 10°C and 50°C, in successive steps of 10°C in both directions. The RH cycle is performed between 20 and 90%, in successive steps of 10%. The duration at the end of each increment step is 150 minutes in order to allow the samples to reach equilibrium with the climatic environment, and also to record enough experimental data.
As in the electromechanical characterization (
eq. 3), the resistance is expressed as a normalized relative resistance
Rrc, based on a reference value of resistance,
R0:
R0 is the resistance of the sensor at a temperature of 20°C and a relative humidity of 40%, and is determined before the beginning of each measuring cycle.
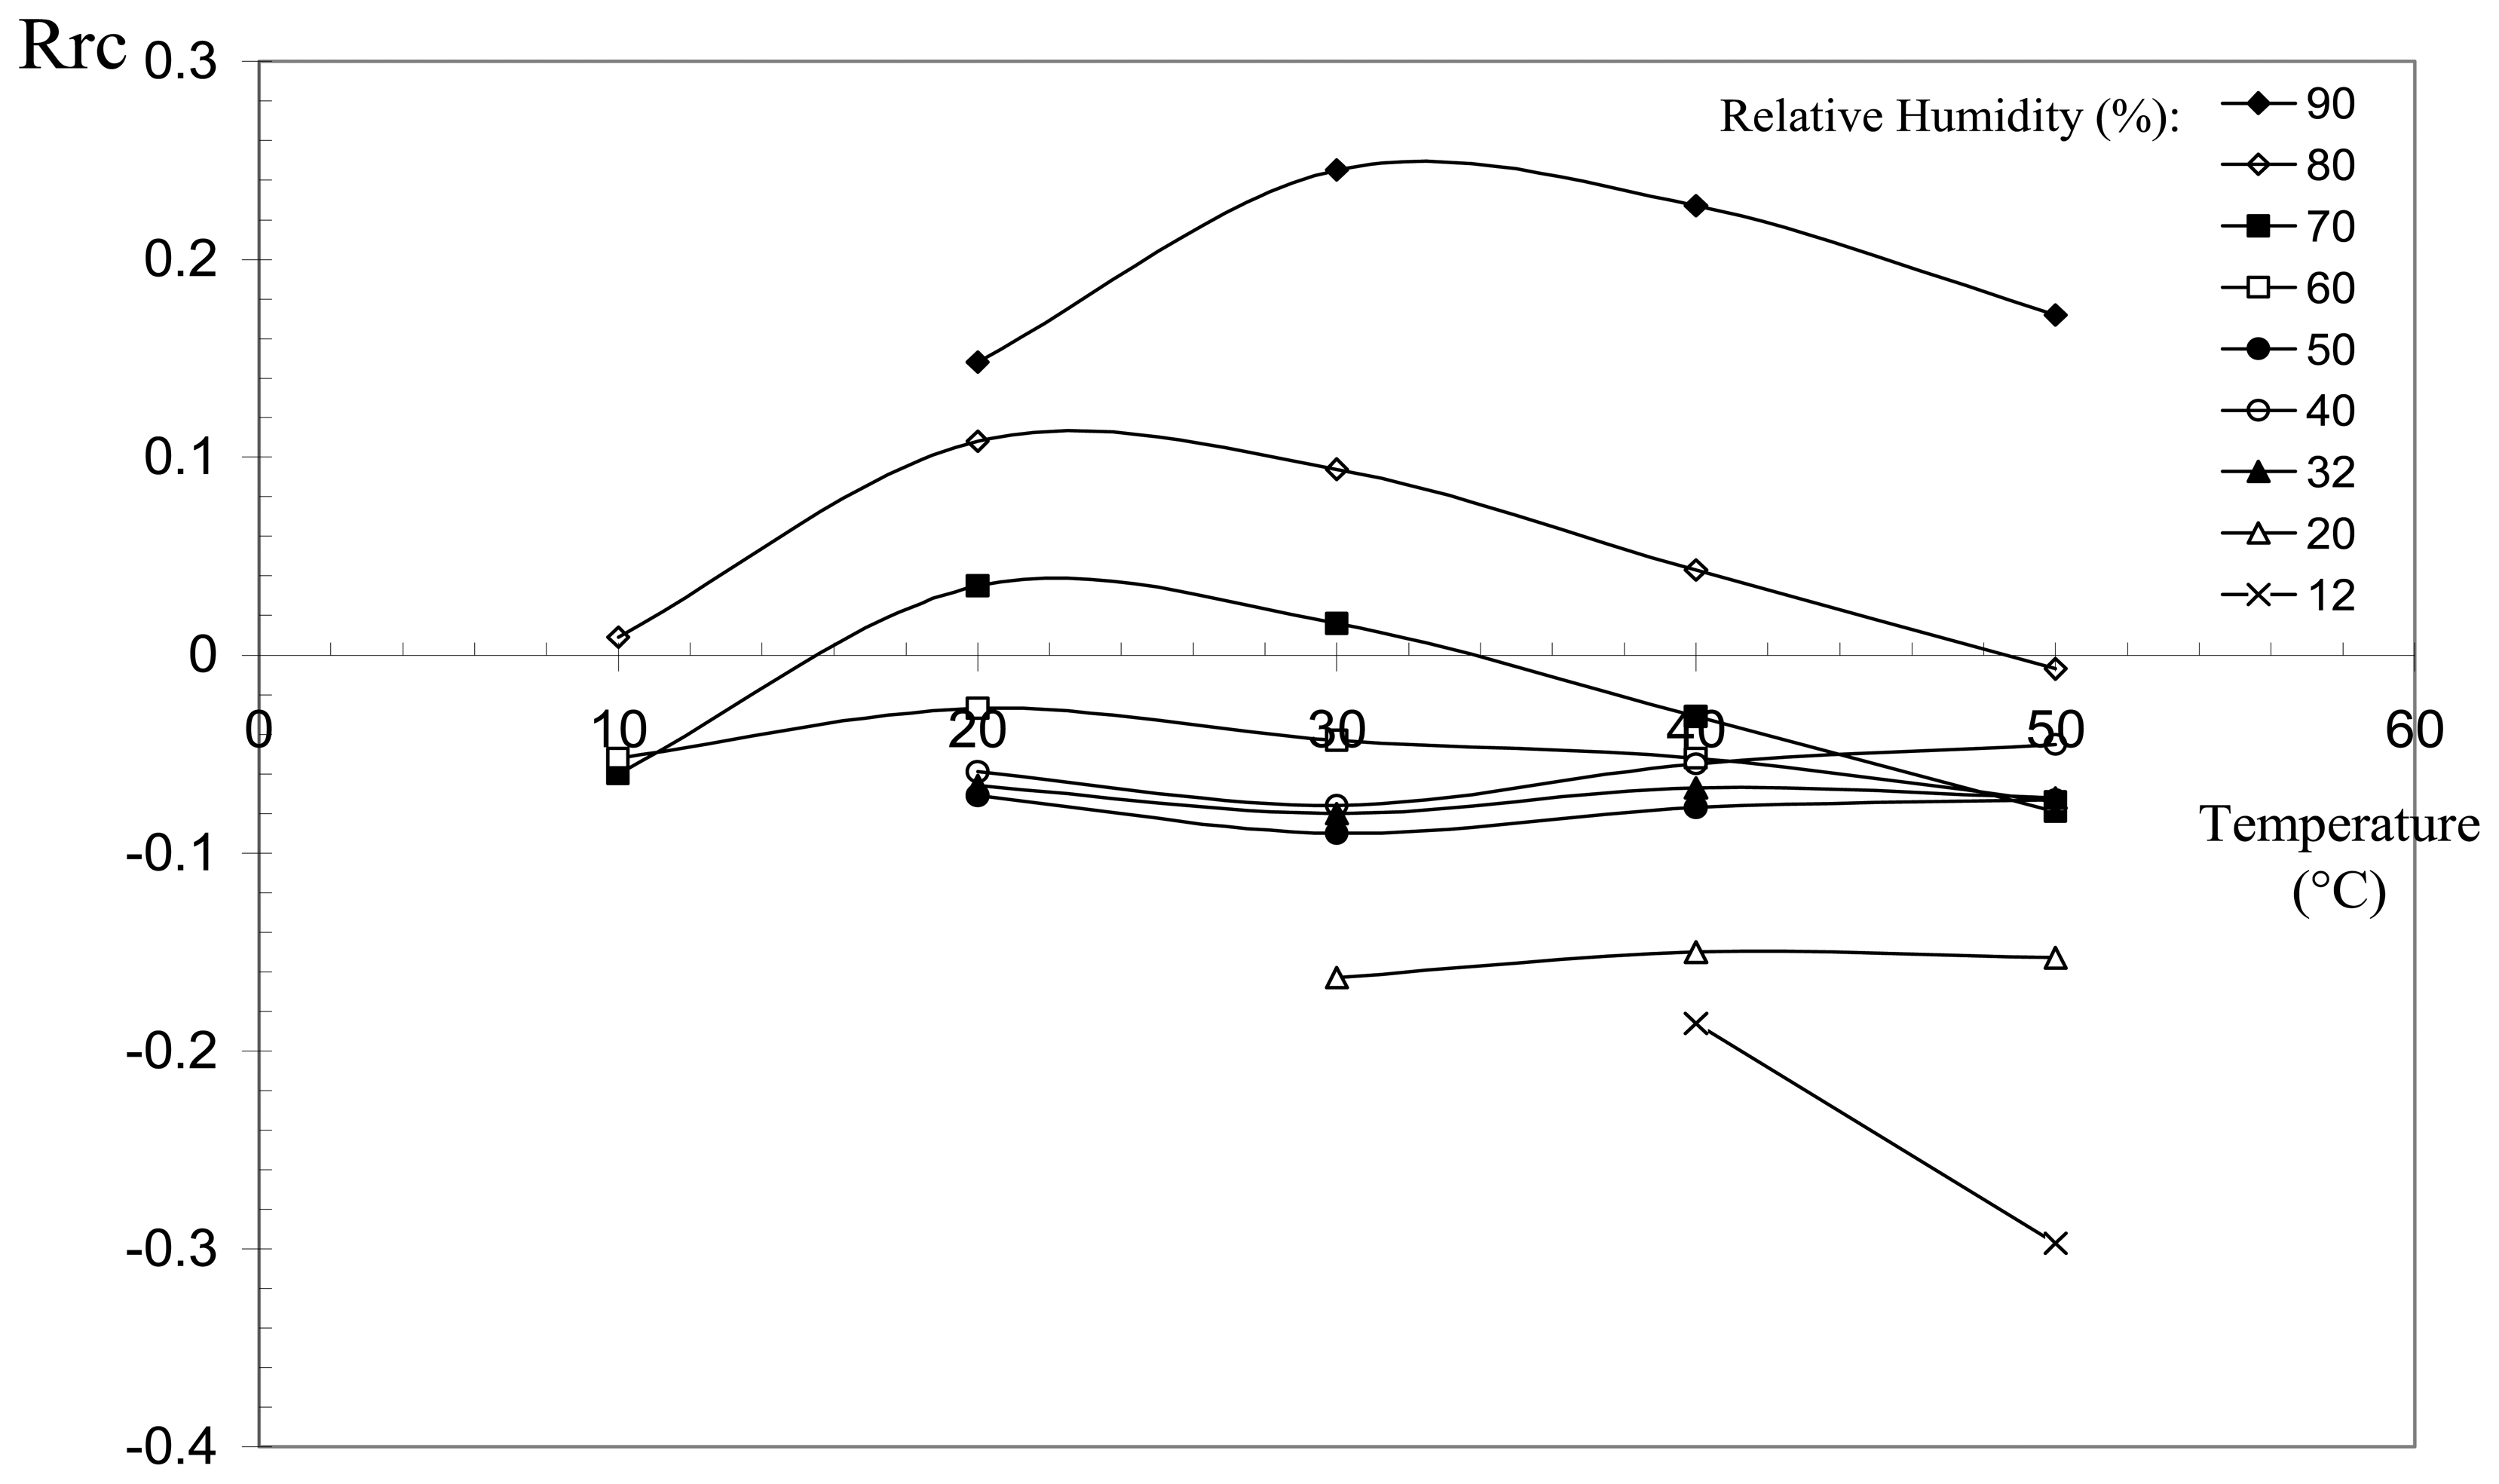
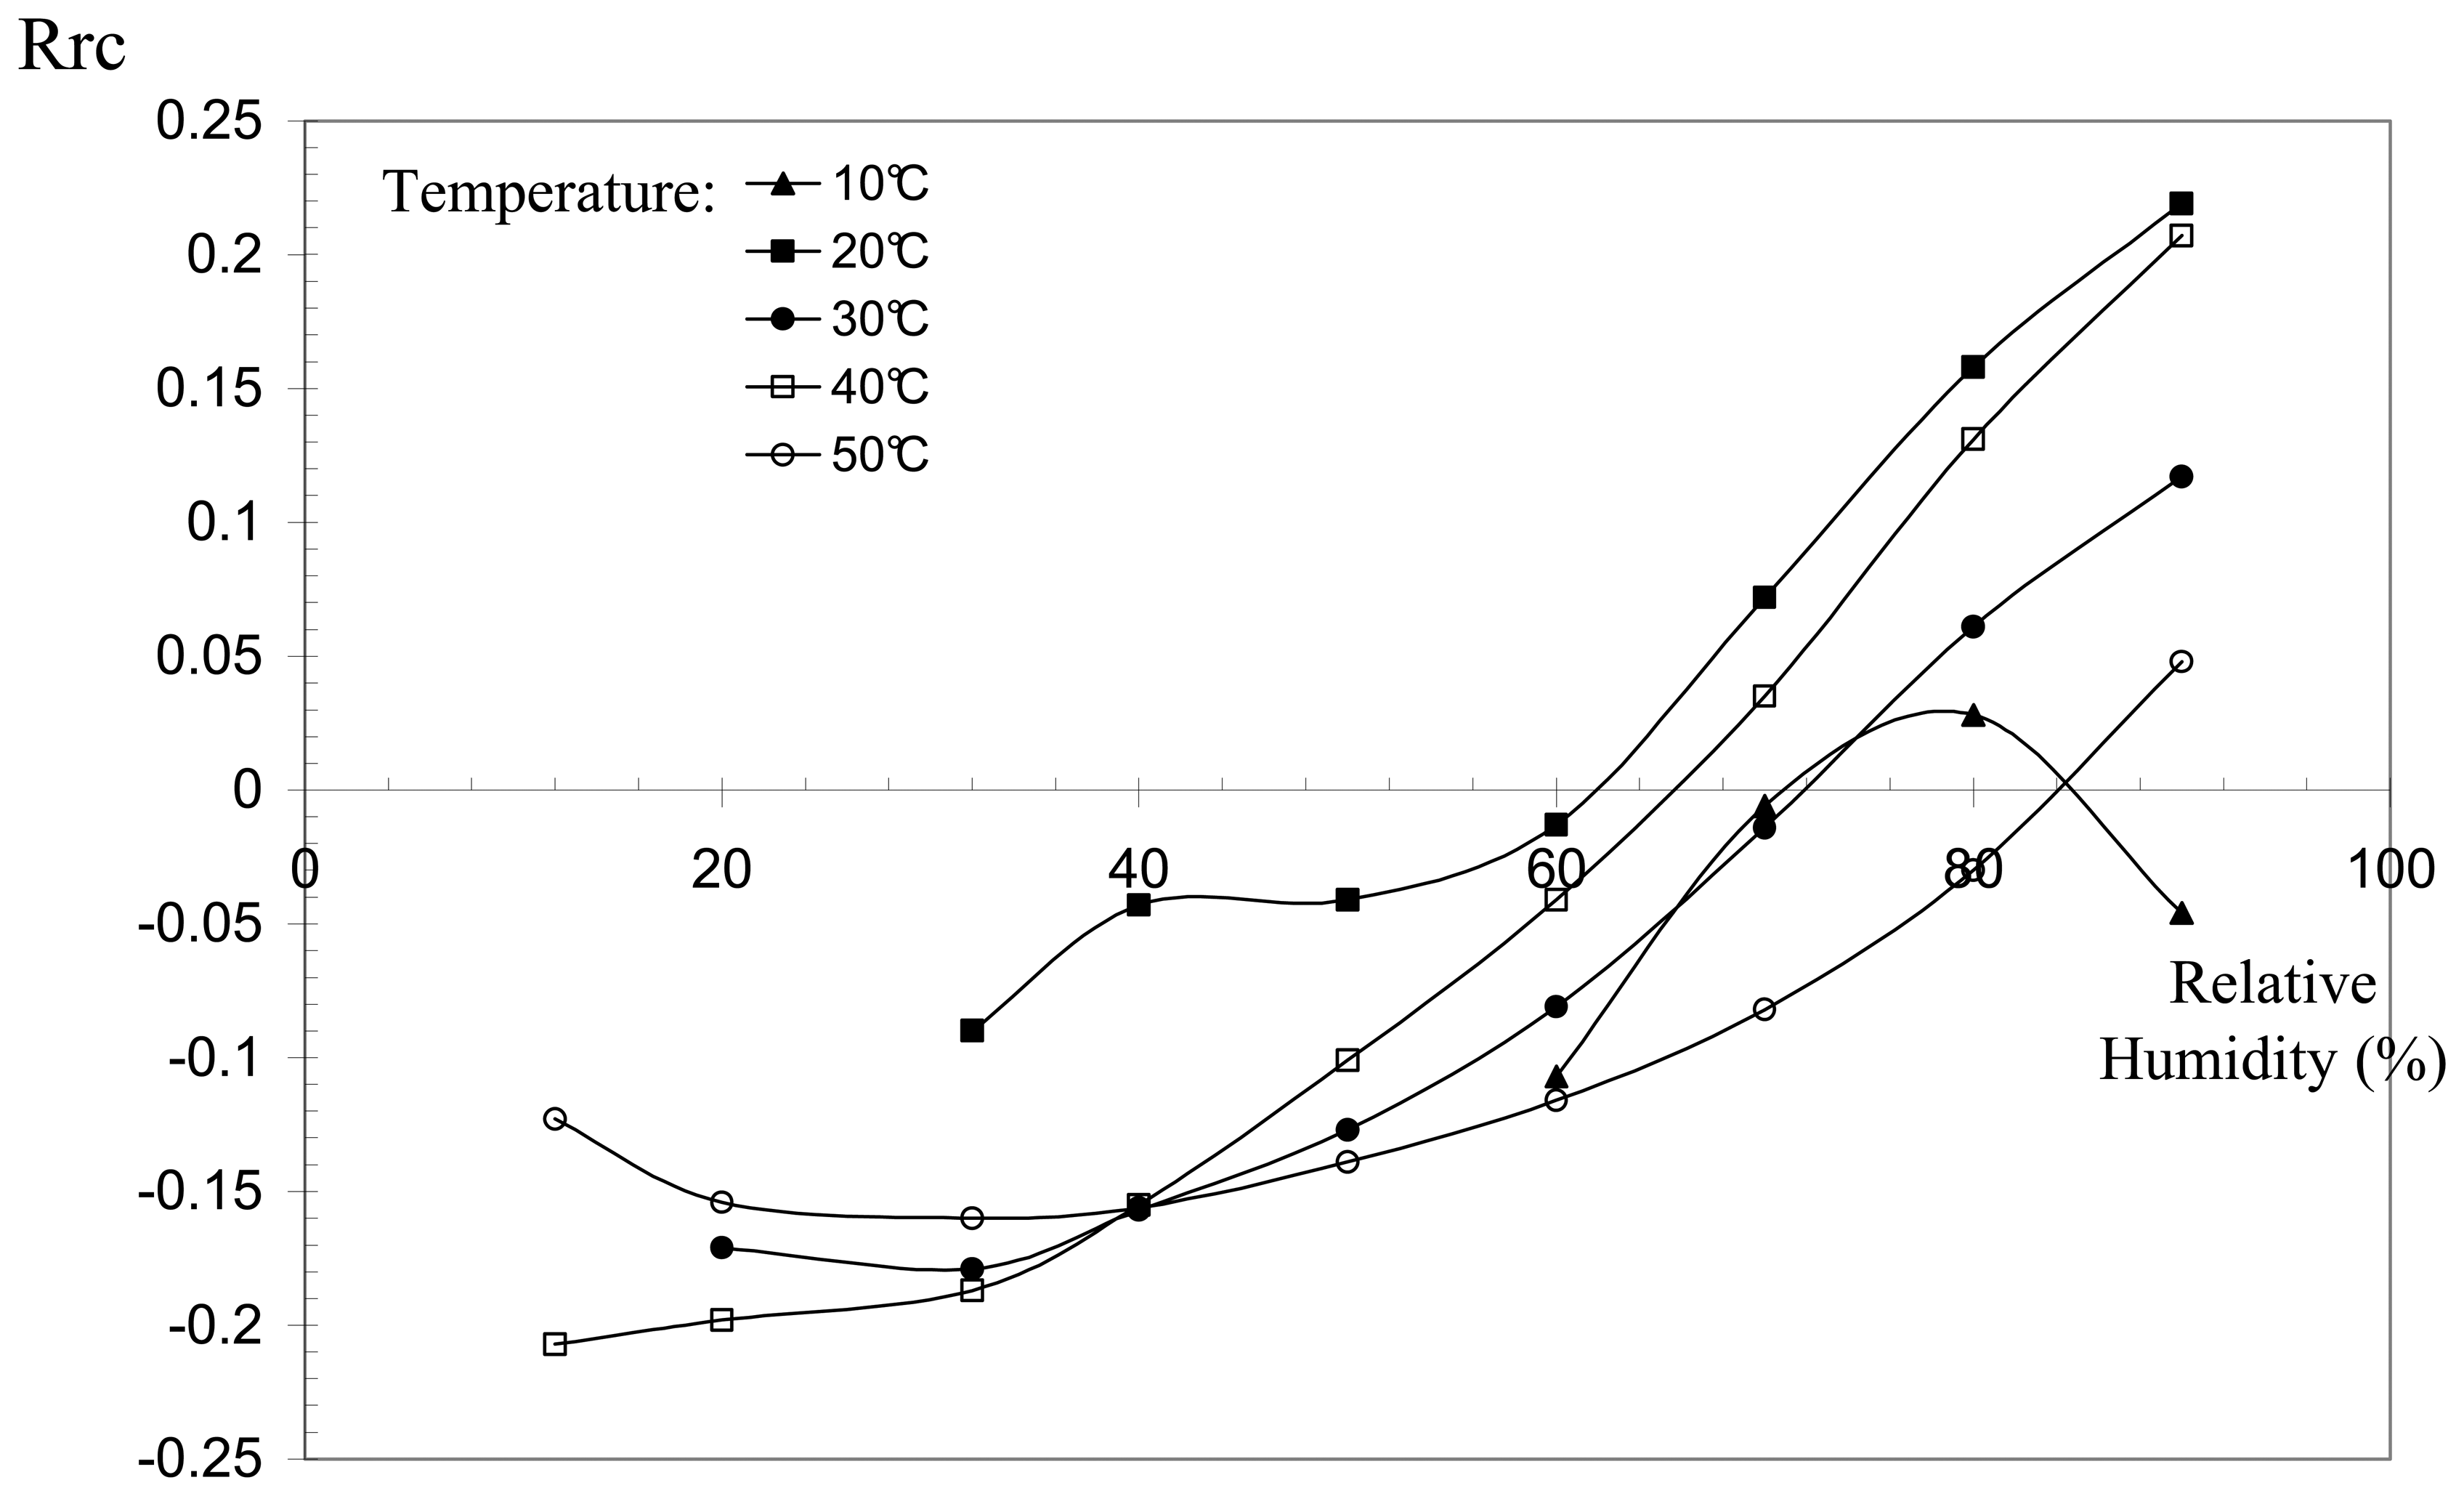
The results obtained in the iso-humidity experiments are shown on
Fig. 9, where only the experimental points corresponding to the rising temperature part of the cycle are presented. For the lower relative humidity (
RH < 70%), the electrical resistance does not vary much with respect to
R0 when the temperature increases, since
Rrc is at a maximum of 10% at 10°C for 60%
RH. For higher
RH (70 to 90%), the variations are a bit more important, but remain relatively small; the values of
Rrc registered being less than 20% at all temperatures. However, it can be noted that the highest decrease in resistance is obtained at the extreme values of the range of temperatures covered, 10 and 50°C, and this is true for all
RH greater than 60%.
Above 20°C, a negative temperature coefficient (NTC) effect is observed. This behaviour is taken into account by two theories, an increase in the number of conducting chains, and an increasing of the tunnel effect [
29]. These two phenomena probably compete in the present case. The polymer matrix will undergo an expansion following a temperature rise, and this may favour the number of electrical contacts between the conductive particles, and increase the effective section of electrical conductivity. On the other hand, the general change in the geometry of the sensor will tend to decrease the electrical resistance. In the case of disjoined particles, a temperature rise will increase the number of charge carriers, and hence favour conduction by tunnel effect.
Fig. 10 shows the results obtained in 5 isothermal measurements performed on the sensor, for
RH values varying between 10 and 90%. The sensor's electrical behaviour is similar in the 5 experiments, and two regions can be distinguished on the curves. The first one corresponds to
RH below 50%, where the relative resistance remains practically constant,
i.e. the resistance of the sensor does not change. The second region (
RH > 50%) shows that the resistance increases rapidly with
RH. This increase is evaluated to be approximately 0.6% change in
R per unit change in
RH.
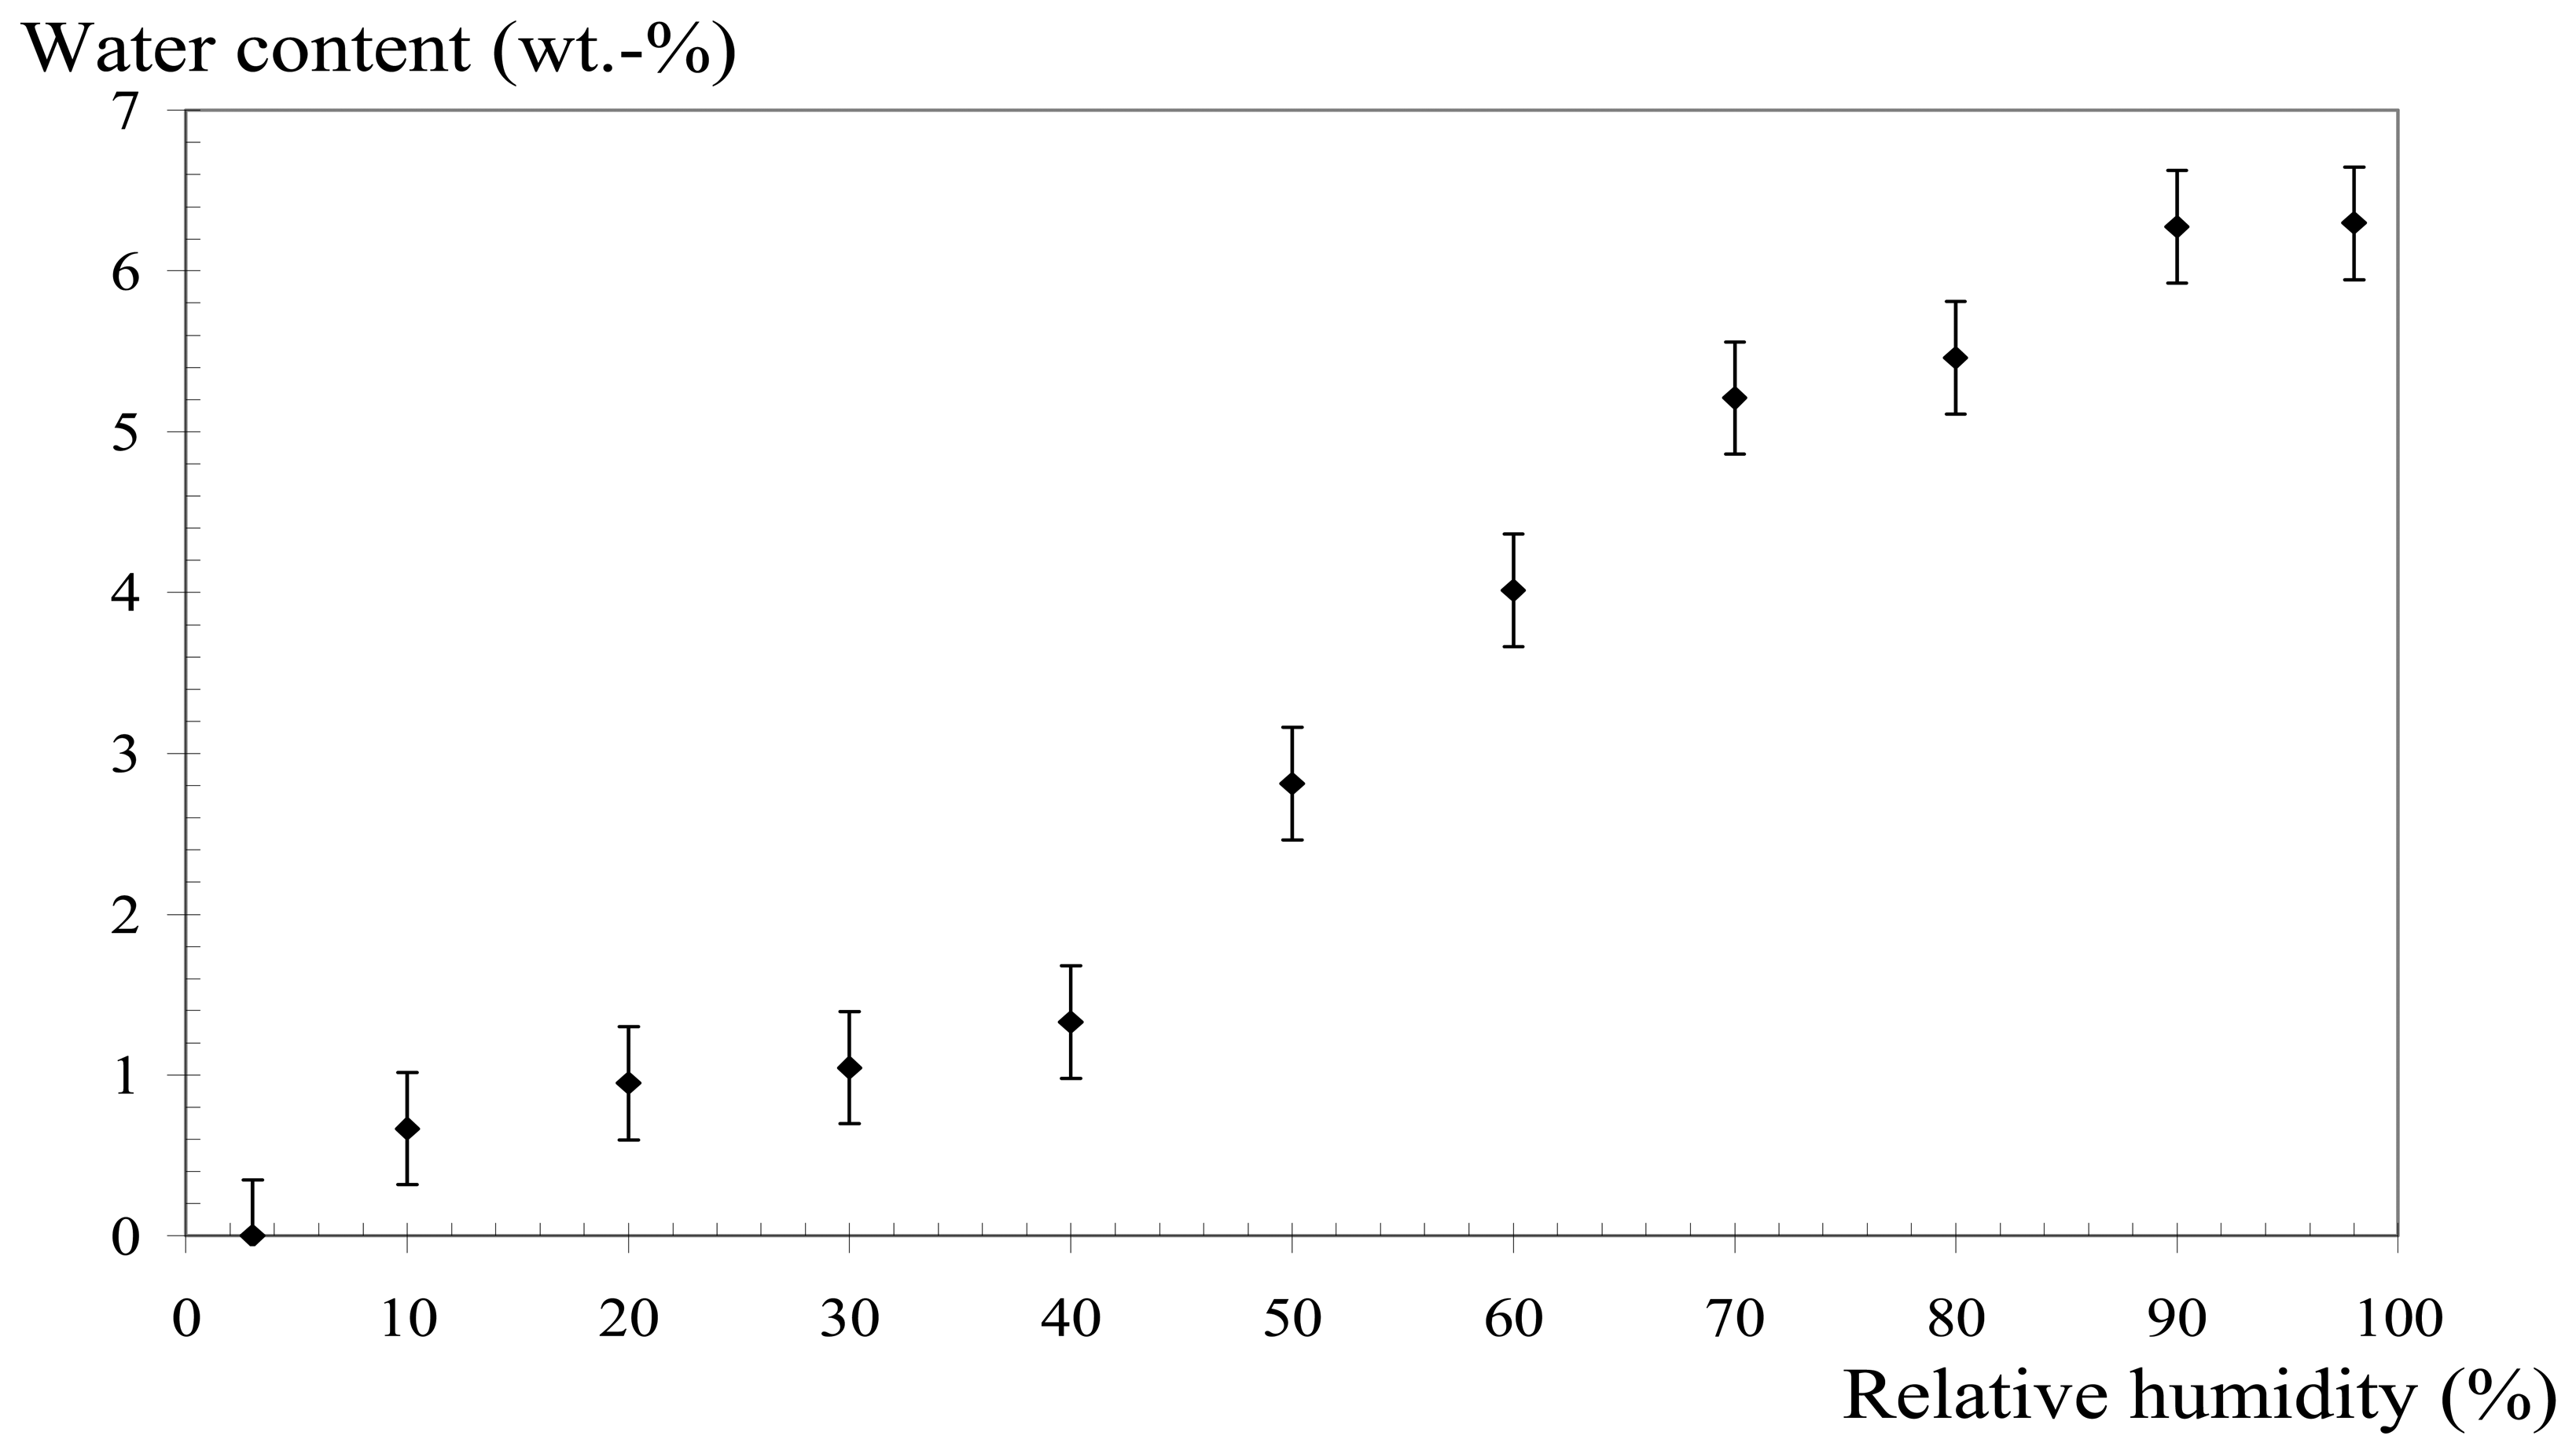
This particular dependence of the electrical resistance of the CPC sensor on humidity can be attributed to the behaviour of the carbon black filler particles in the presence of humidity. This behaviour is illustrated on
Fig. 11, where the percentage water content in the CB filler particles is plotted against relative humidity.
To obtain these results, a certain amount of CB particles is initially dried and weighed. The sample (approx. 2 g) is then brought into equilibrium for at least 15 hours in different atmospheres of varying
RH, at a fixed temperature of 80°C. The weight gain, corresponding to water adsorption, is determined. The measurements were found to be reversible,
i.e. the initial dry sample weight was again obtained when the sample was dried at the end of the whole experiment. This means that the weight gain can be effectively attributed to a water intake by the particles.
Fig. 11 shows that for
RH below 40 %, the water intake is very small, less than 1.5 wt.-%. For higher
RH values, the water adsorbed by the CB particles increases rapidly with
RH, and reaches a maximum value of 6.3 wt.-% for a 98 %
RH.
Up to a certain atmospheric humidity which corresponds to a given partial pressure of water vapour, water is physically adsorbed at the surface of the CB particles, and remains at the surface pores of the particle agglomerates. When the relative humidity increases, partial water vapour pressure also increases, forcing water to penetrate by capillarity inside the pore network structure, more and more into the heart of the CB particles as
RH increases, until the whole accessible internal pore volume is filled. This transition takes place at around 40% or 50%
RH for the CB particles tested, and a certain analogy can be found with the electrical behaviour of the CPC sensor of
Fig. 10, where a transition occurs in the same
RH range. The sensor contains 27.6 vol.-% of CB, a concentration much higher than the percolation threshold (
Fig. 3). This means that in the composite structure, the filler particles form a continuous network where the conductive particles are in contact, and a porosity network is also implemented. The electrical conductivity of the composite will change because the presence of water at the core of the conductive particles will affect the conductive particles network, either by modifying the interface between the conductive particles, and/or by the “de-percolation” of the conducting network.
Another factor which may account for the dependence of the sensor resistance on humidity is the initial loading particles present in the EVO polymer. It was found that this loading amounted to 29 wt.-%, a quite important quantity of inorganic particles composed of calcium carbonate, which will also present a high specific surface area for the adsorption of water molecules. The same consequences as with the CB particles can be expected, with a modification of the CB particle network which will affect the sensor's global electrical performance.
5. Conclusion
The design of a flexible strain sensor based on a conductive polymer composite has been realised in this work. The optimization of the sensor in terms of dimensions, geometry, preparation process, and filler concentration has led to a sensitive, reliable strain gauge which can be easily deposited on any flexible substrate such as a textile fabric. The filler loading in the composite which gave the best compromise between sensor sensitivity and measurable resistance values was found to be much higher than the concentration at the percolation threshold.
The elastomer-based composite sensor, tested on a thin and light Nylon fabric, proved to be compatible with the mechanical characteristics of the textile structure. Its electromechanical characterization showed that the sensor presented a classical ohmic linear behaviour for strains above 15%, while its non-linear behaviour observed for the lower strain levels has been successfully modelled through a power-law relationship.
It was found that the electrical performance of the sensor was particularly affected by the presence of high humidity, namely because of the sensitivity of the carbon black filler particles to water. The next phase of this study would thus be to calibrate the sensor in different climatic conditions, and to model precisely the influence of relative humidity on sensor response.


