A Sensitive Chemiluminescence Method for Determination of Hydroquinone and Catechol

1
College of chemistry, Sichuan University, Chengdu, 610064, P. R. China
2
College of chemical engineering, Sichuan University, Chengdu, 610064, P. R. China
*
Author to whom correspondence should be addressed.
Sensors 2007, 7(4), 578-588; https://doi.org/10.3390/s7040578
Published: 26 April 2007
Abstract
:A novel flow-injection chemiluminescence (CL) method has been developed for the determination of hydroquinone (HQ) and catechol (CT), based on their inhibition of the chemiluminescence reaction of luminol–KMnO4–β-cyclodextrin (β-CD). It was found that β-cyclodextrin could effectively enhance the chemiluminescence produced from the reaction of luminol with KMnO4 in basic media. The proposed method is simple, rapid, convenient and sensitive, has a linear range of 1–20 ng/mL for catechol with a detection limit of 0.4 ng/mL, and 1–10 ng/mL for hydroquinone with a detection limit of 0.1 ng/mL, respectively. The possible mechanism of the CL reaction is also discussed.
1. Introduction
Hydroquinone and catechol are phenolic compounds and are widely used in tanning, cosmetics, the pharmaceutical industry and in developing photo-graphs and thus are important environmental pollutants [1, 2]. It is also well documented that HQ and CT are among the most abundant organic constituents of mainstream tobacco smoke [3-5]. These compounds are harmful to humans and animals even in very low concentration. Therefore, it is very important to develop a highly sensitive and selective analytical method for the determination of hydroquinone and catechol in food, biological and environmental monitoring, etc. From the literature, several methods for the determination of hydroquinone and catechol are available, such as spectrophotometry [6,7], high performance liquid chromatography (HPLC) [2,8] and electrochemiluminescence [9] techniques. To explore an alternative method for the determination of hydroquinone and catechol, chemiluminescence coupled with flow injection system is developed.
Chemiluminescence (CL) is a high sensitive analytical technique that can be used in the determination of different compounds in various fields. In recent years, it has received much attention, especially with flow injection (FIA), due to its high sensitivity, wide linear range and simple instrumentation [10-17]. And some CL methods have been developed for the detection of hydroquinone and catechol [10,17,18]. He et al. [10] have proposed a CL method based on the enhancing effect of polyhydroxy phenols on the Fe3+–H2O2–Rh6G system. Du et al. [17] have developed another method for determination of pyrogallol, phlorglucinol, hydroquinone and resorcinol based on the ferricyanide/ferrocyanide–enhanced luminol–polyphenol CL.
In our work, we found that chemiluminescence generated by the reaction of luminol with KMnO4 in basic media could be significantly enhanced by β-CD. While the enhanced chemiluminescence was strongly inhibited in the presence of hydroquinone and catechol. Based on these observations, a new flow-injection CL method was proposed for the determination of hydroquinone and catechol, with detection limits of 0.1 ng/mL and 0.4 ng/mL, respectively. However, the proposed CL system was not suitable for the determination of dihydroxybenzene isomer-resorcinol. The peak of the CL became distorted irregularly for resorcinol, probably because the resorcinol could not be oxidized by singlet oxygen and hydroxyl radical formed in the reaction to produce corresponding quinone. Moreover, the presence of resorcinol affected the detection of hydroquinone and catechol. The actual effect of resorcinol on the CL reaction is still unknown, further study is being carried out. A possible mechanism of the CL reaction was also discussed.
2. Experimental
2.1. Reagents
All the chemicals were of analytical-reagent grade and were used as received. The double-distilled water was used throughout. The 1.0 mg/mL standard solutions of hydroquinone and catechol were freshly prepared by dissolving appropriate amount of each in water. A 0.01 mol/L luminol stock solution was prepared with 100mL of 0.1 mol/L NaOH solution. A 0.01 mol/L KMnO4 stock solution was prepared with double-distilled water. β-cyclodextrin (1.0 × 10⁻³ mol/L) stock standard solution was prepared by dissolving appropriate amount in 0.04 mol/L NaOH solution. These standard solutions were stored in the refrigerator and protected from light.
2.2. Apparatus
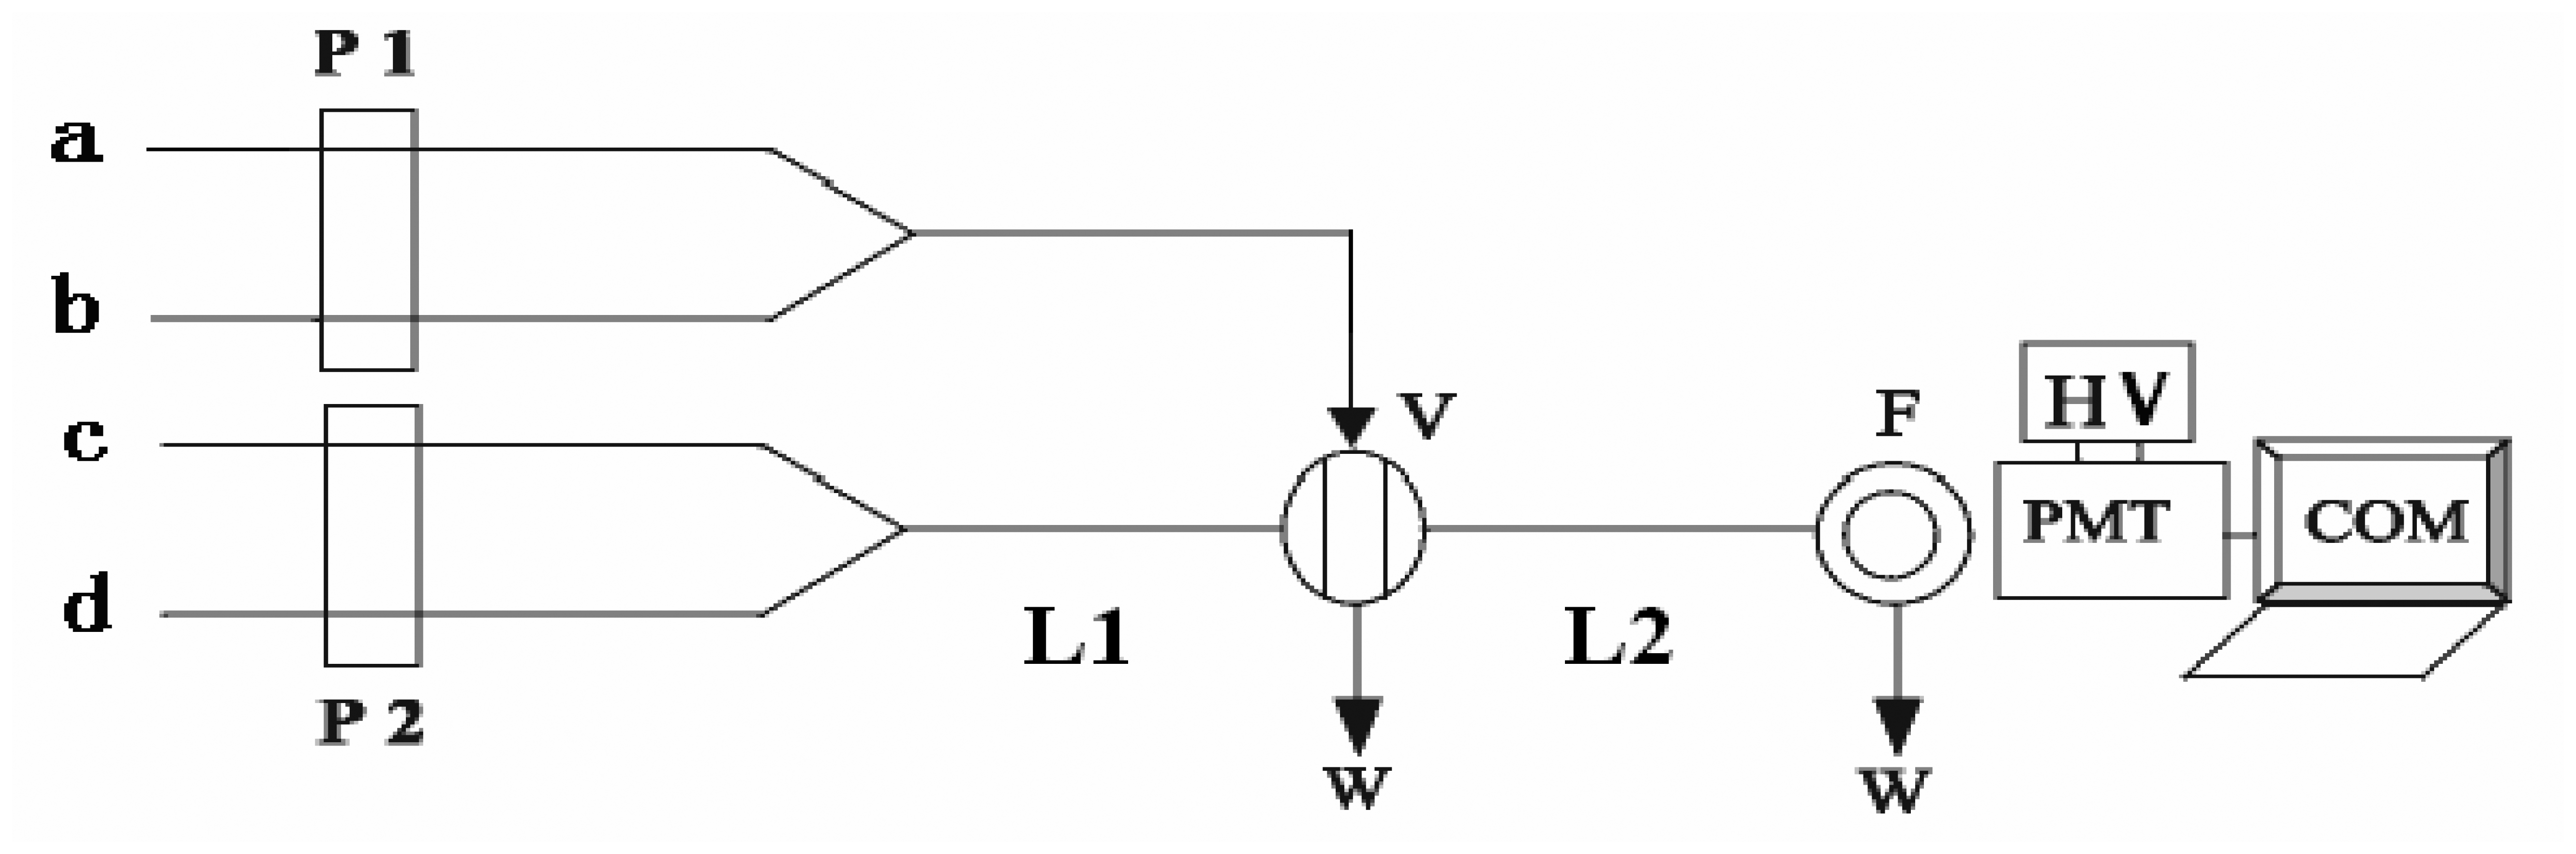
The flow-injection system used in this work is shown in Fig. 1. Two peristaltic pumps were used to deliver all solutions. PTFE tube (0.8 mm i.d.) was used to connect all components in the flow system. The streams of luminol, KMnO4, β-cyclodextrin and analyte were mixed in a flow cell. The CL signal produced in the flow cell was detected with a photomultiplier tube and recorded by an IBM-compatible computer using flow-injection CL analysis system (Xi'an Ruike Electronic Equipment Corporation, China). A model F-4500 fluorescence spectrophotometer (Hitachi, Japan) and a model UV-2300 spectrophotometer (Shanghai, China) were also used.
2.3. Procedures
As shown in Fig. 1, flow lines a–d, were inserted into KMnO4 solution, β-CD solution, sample solution and luminol solution, respectively. The mixture of KMnO4 and β-CD was merged through the eight-way injection valve into the mixture of sample solution and luminol solution. Then the mixed solution was pumped continuously into the flow cell located in front of the detection window of the photomultiplier tube (PMT). The CL emission was converted to current signal by PMT and the output was fed to luminescence analyzer, recorded with a computer via supplied software (REMEX CL Analysis System V 2.12). The concentration of sample solution was quantified by the relative CL intensity (ΔI).
3. Results and Discussions
3.1. The CL Characteristics of the Reaction System
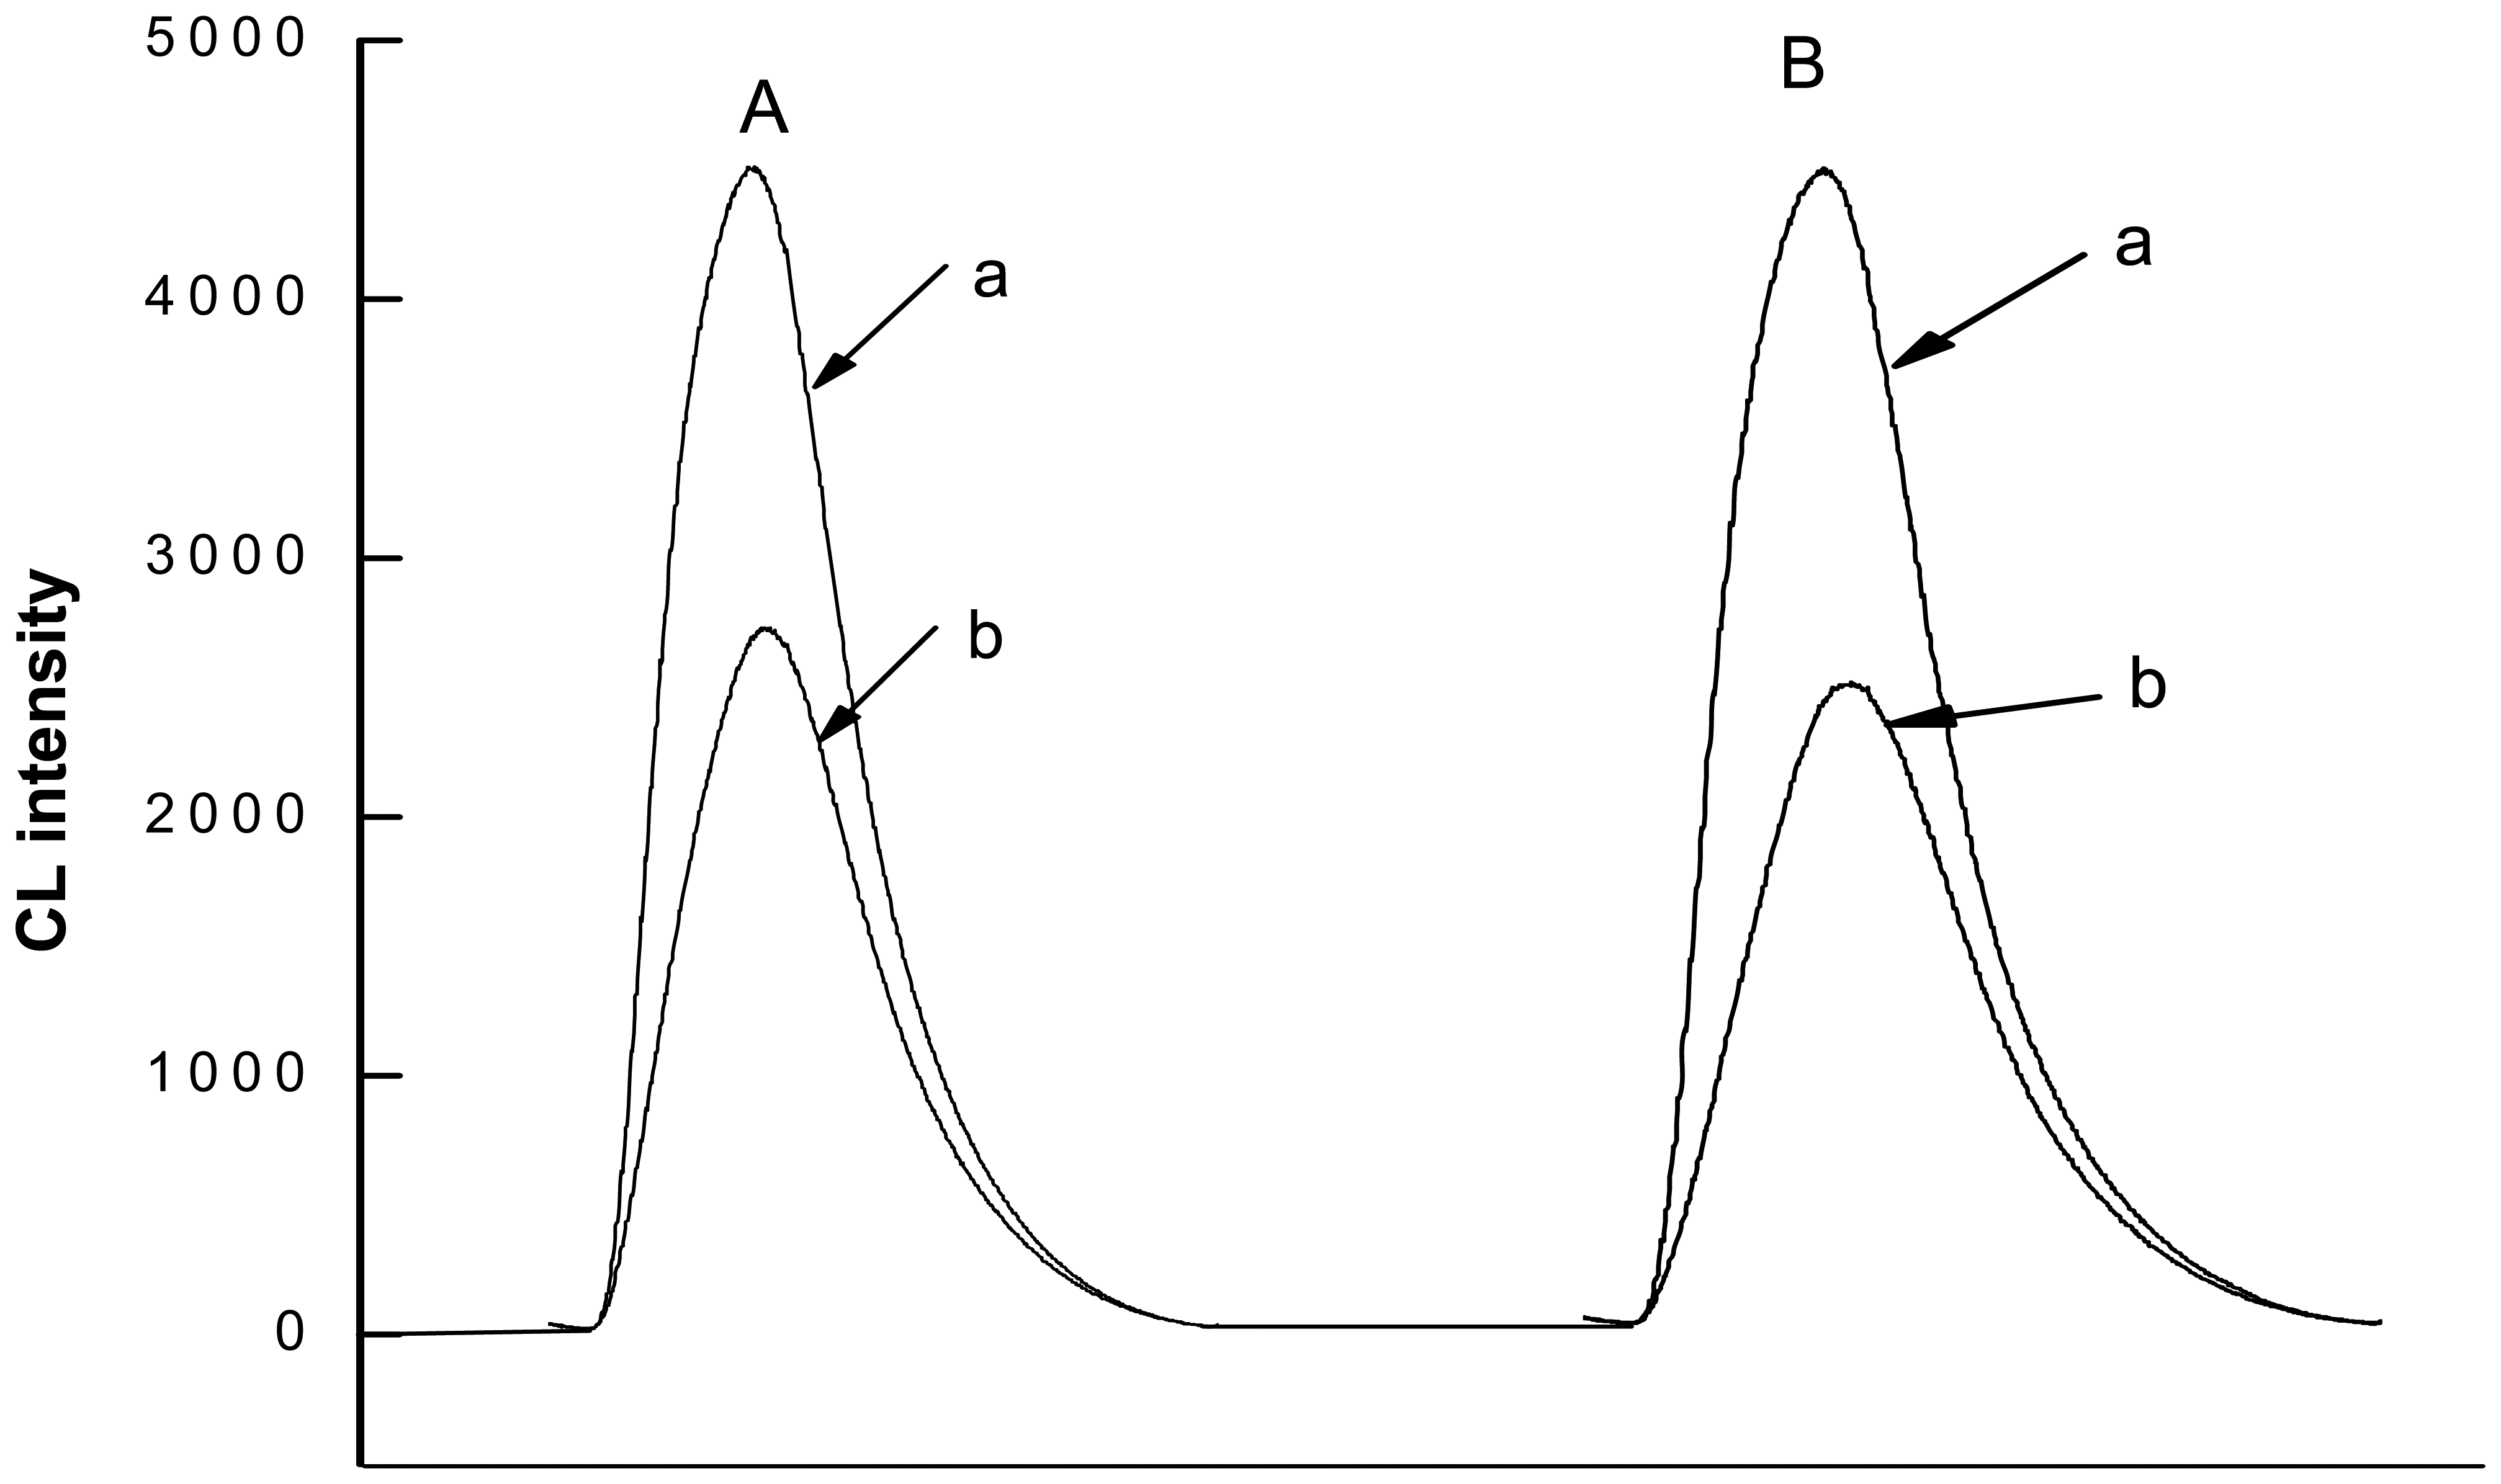
As shown in Fig. 2, the CL intensity reached a maximum in the absence of sample solution. With the injection of sample solution, a decreased CL signal appeared, and the CL intensity varied with concentration of sample solution. Therefore, the proposed CL system was suitable for detecting hydroquinone and catechol. To obtain the highest CL signal/noise, the flow rate of peristaltic pumps was also tested. The flow rate of pump 1 and 2 were all finally set at 30 turns/min as a suitable condition with superior sensitivity and reagent consumption. Six nanogram per milliliter hydroquinone solution was used to optimize the experimental conditions.
3.2. Effect of β-CD and NaOH Concentrations
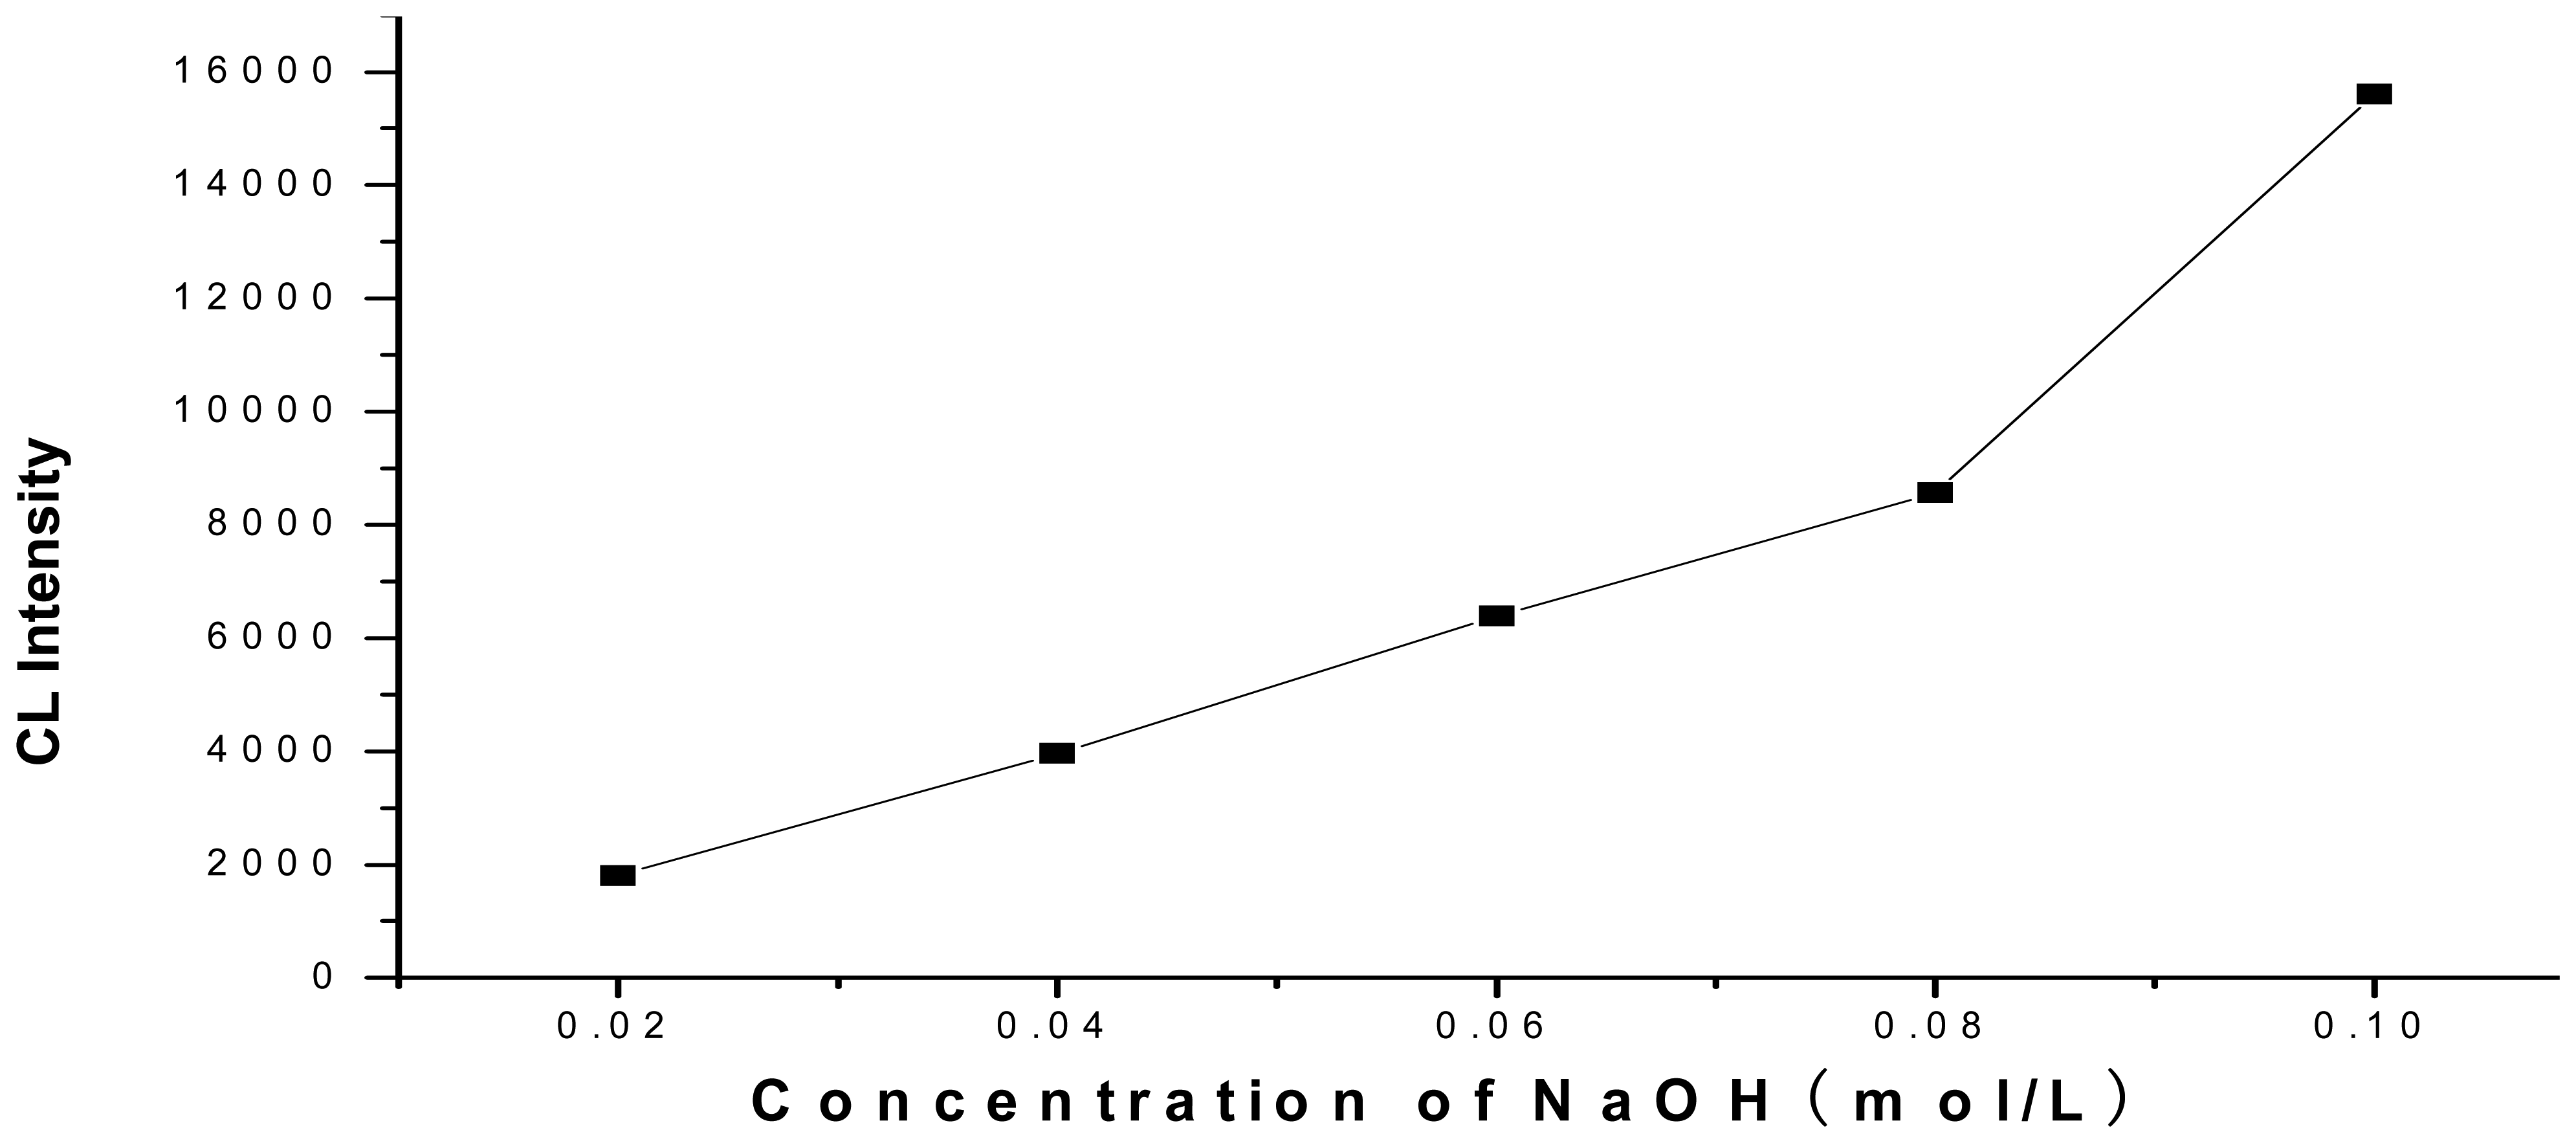
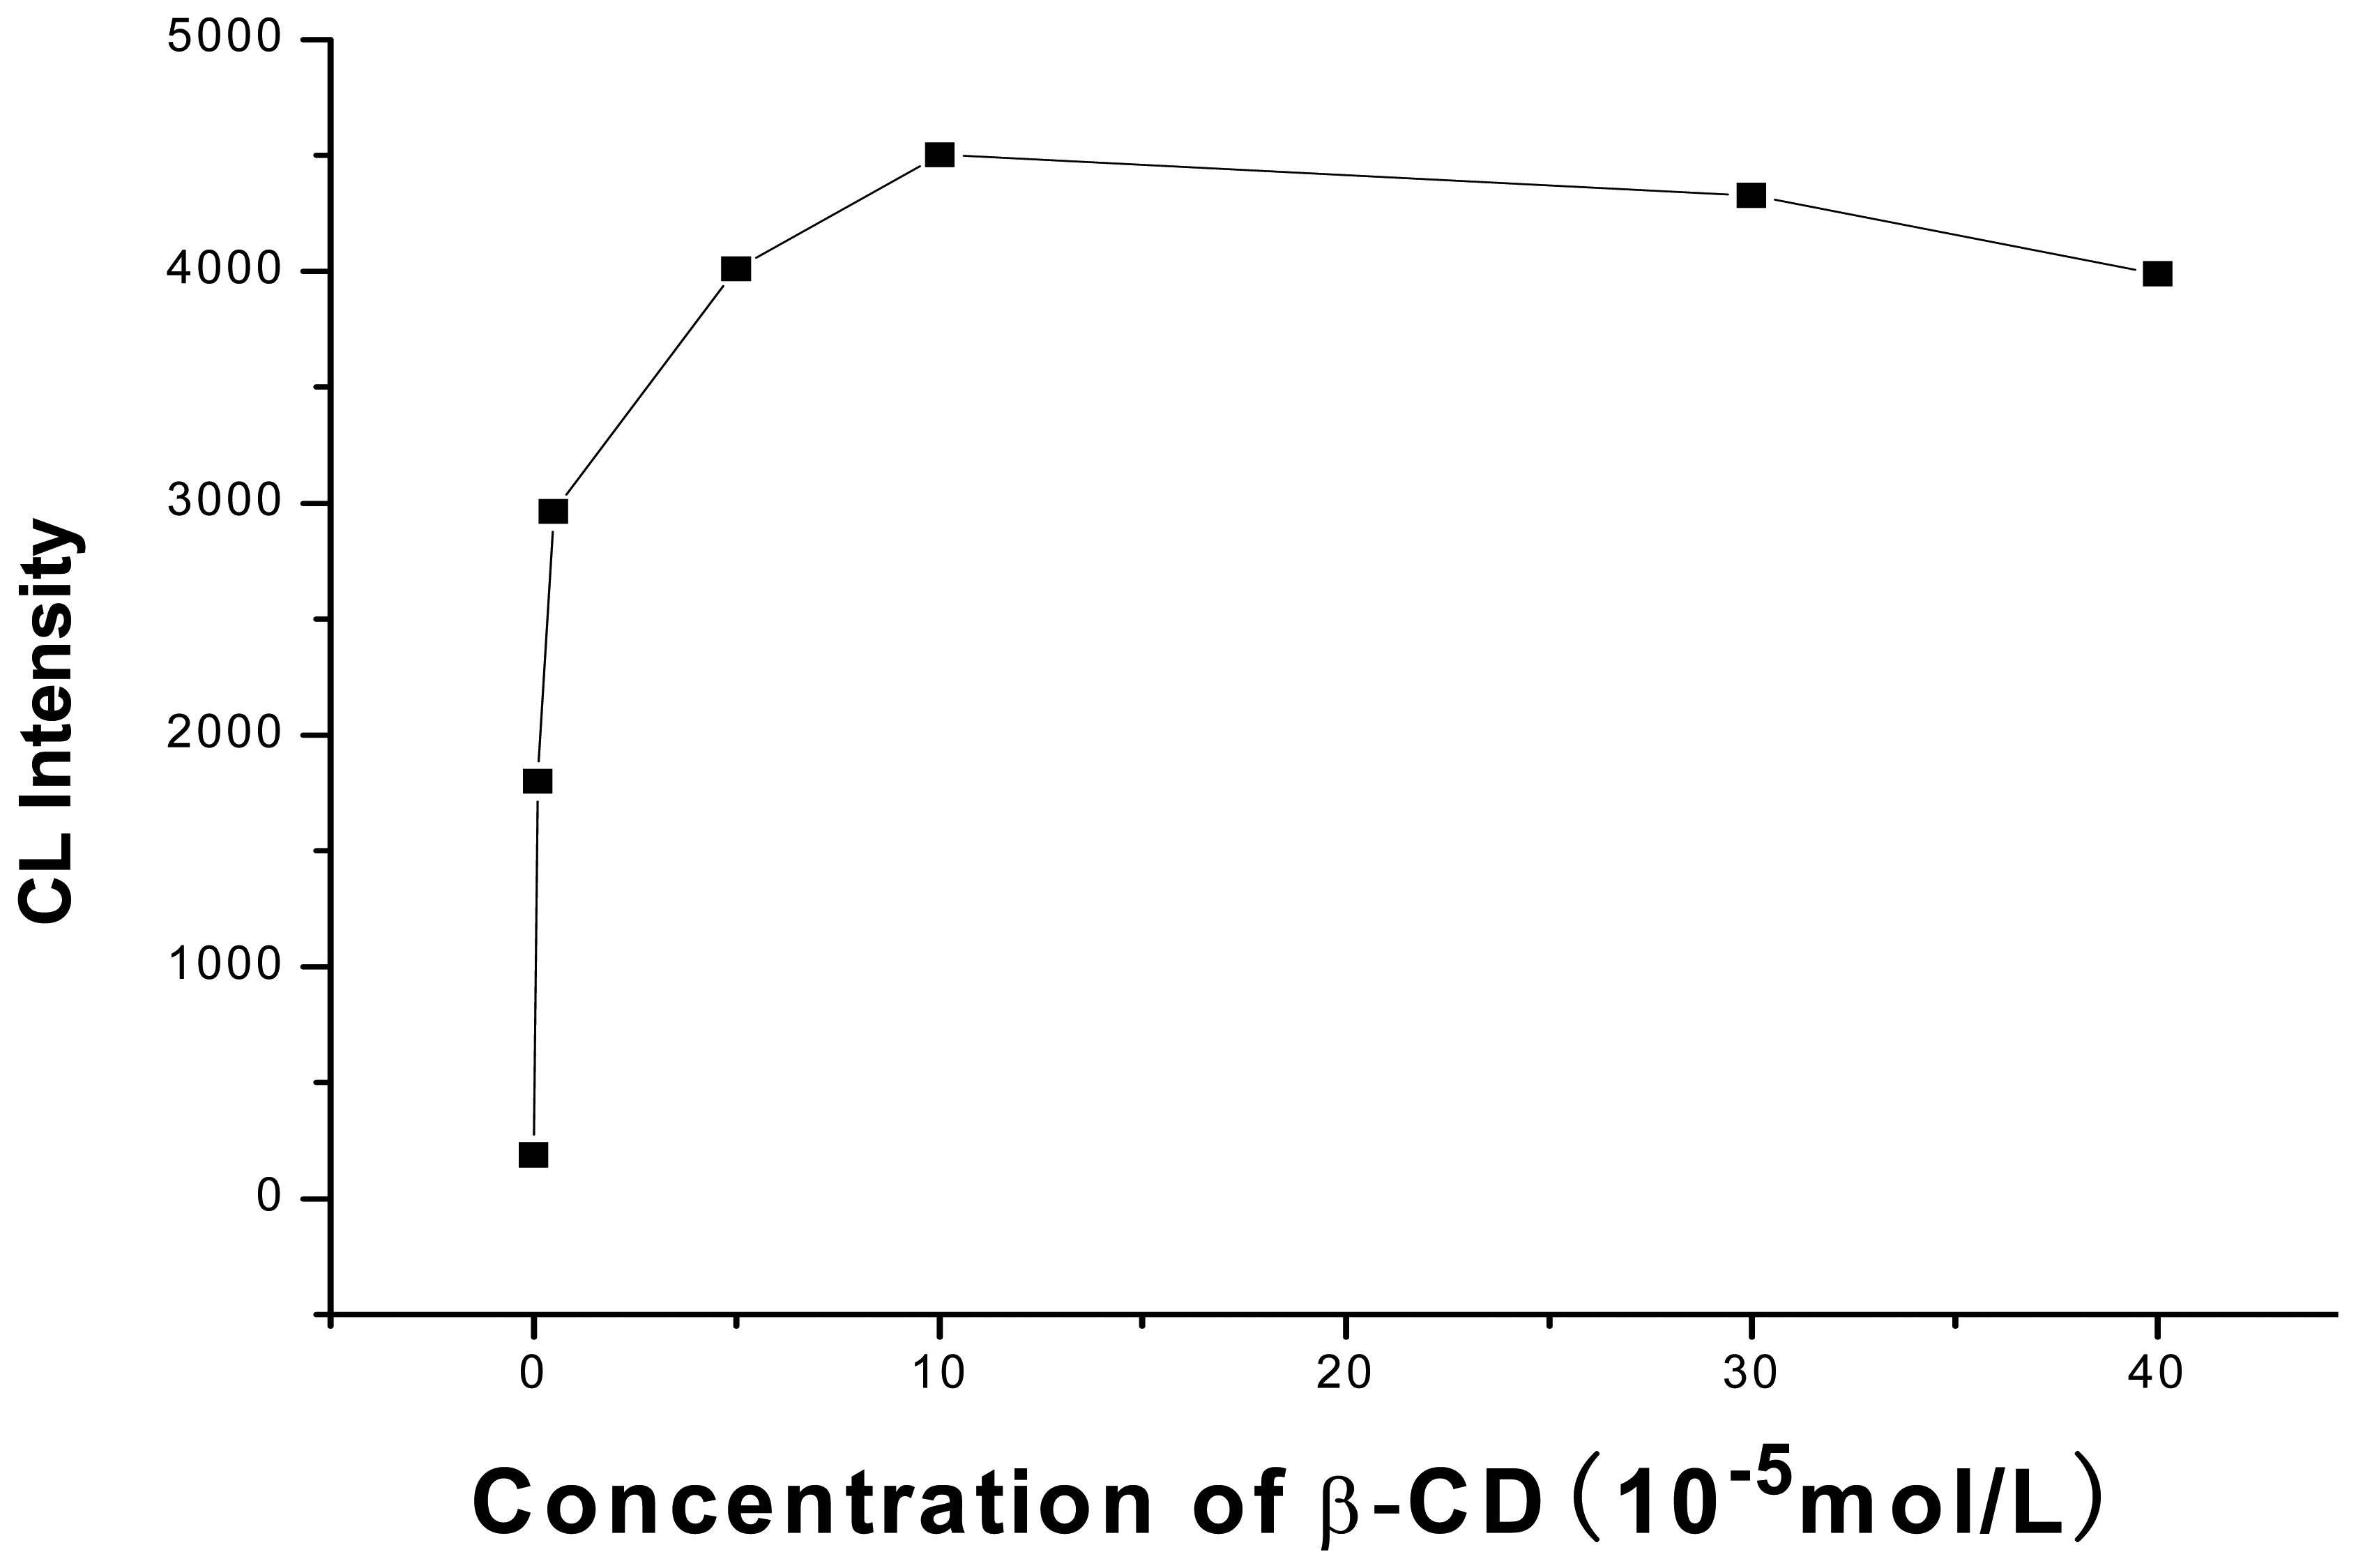
Due to a significant effect of the concentration of NaOH medium on the CL system, five different concentration solutions, i.e. 0.02 mol/L, 0.04 mol/L, 0.06 mol/L, 0.08 mol/L, 0.1 mol/L NaOH were tested. As shown in Fig. 3, the CL intensity was dramatically increased with the increase of NaOH concentration and the highest CL signal/noise was obtained in the 0.04 mol/L NaOH, above which the baseline of the system became higher. Therefore, 0.04 mol/L NaOH solution was selected for subsequent experiments. The concentration of β-CD was an important factor, because it was used as an enhancer in the reaction. The influence of β-CD concentration on CL intensity was initially examined from 1.0×10⁻⁶ to 4.0×10⁻⁴ mol/L (Fig. 4). The result indicated that 1.0×10⁻⁴ mol/L β-CD gave the highest relative CL intensity and the sensitivity decreased on either side of this value. Therefore, 1.0×10⁻⁴ mol/L β-CD was chosen for the subsequent studies.
3.3. Effect of Luminol Concentration
Luminol was not only the reducing agent for the reduction of KMnO4, but also the CL agent in the system. Hence, its concentration should be carefully optimized to ensure that the system was in good stability. The effect of luminol concentration was studied in the range 1.0×10⁻⁵ to 0.6×10⁻³ mol/L (Fig. 5). It was found that the CL intensity was significantly increased with the increase of luminol concentration below 1.0×10⁻⁴ mol/L, above which the background signal was also enhanced, leading to the decrease of signal/noise ratio. Thus, 1.0×10⁻⁴ mol/L luminol was selected for subsequent work.
3.4. Effect of KMnO4 Concentration
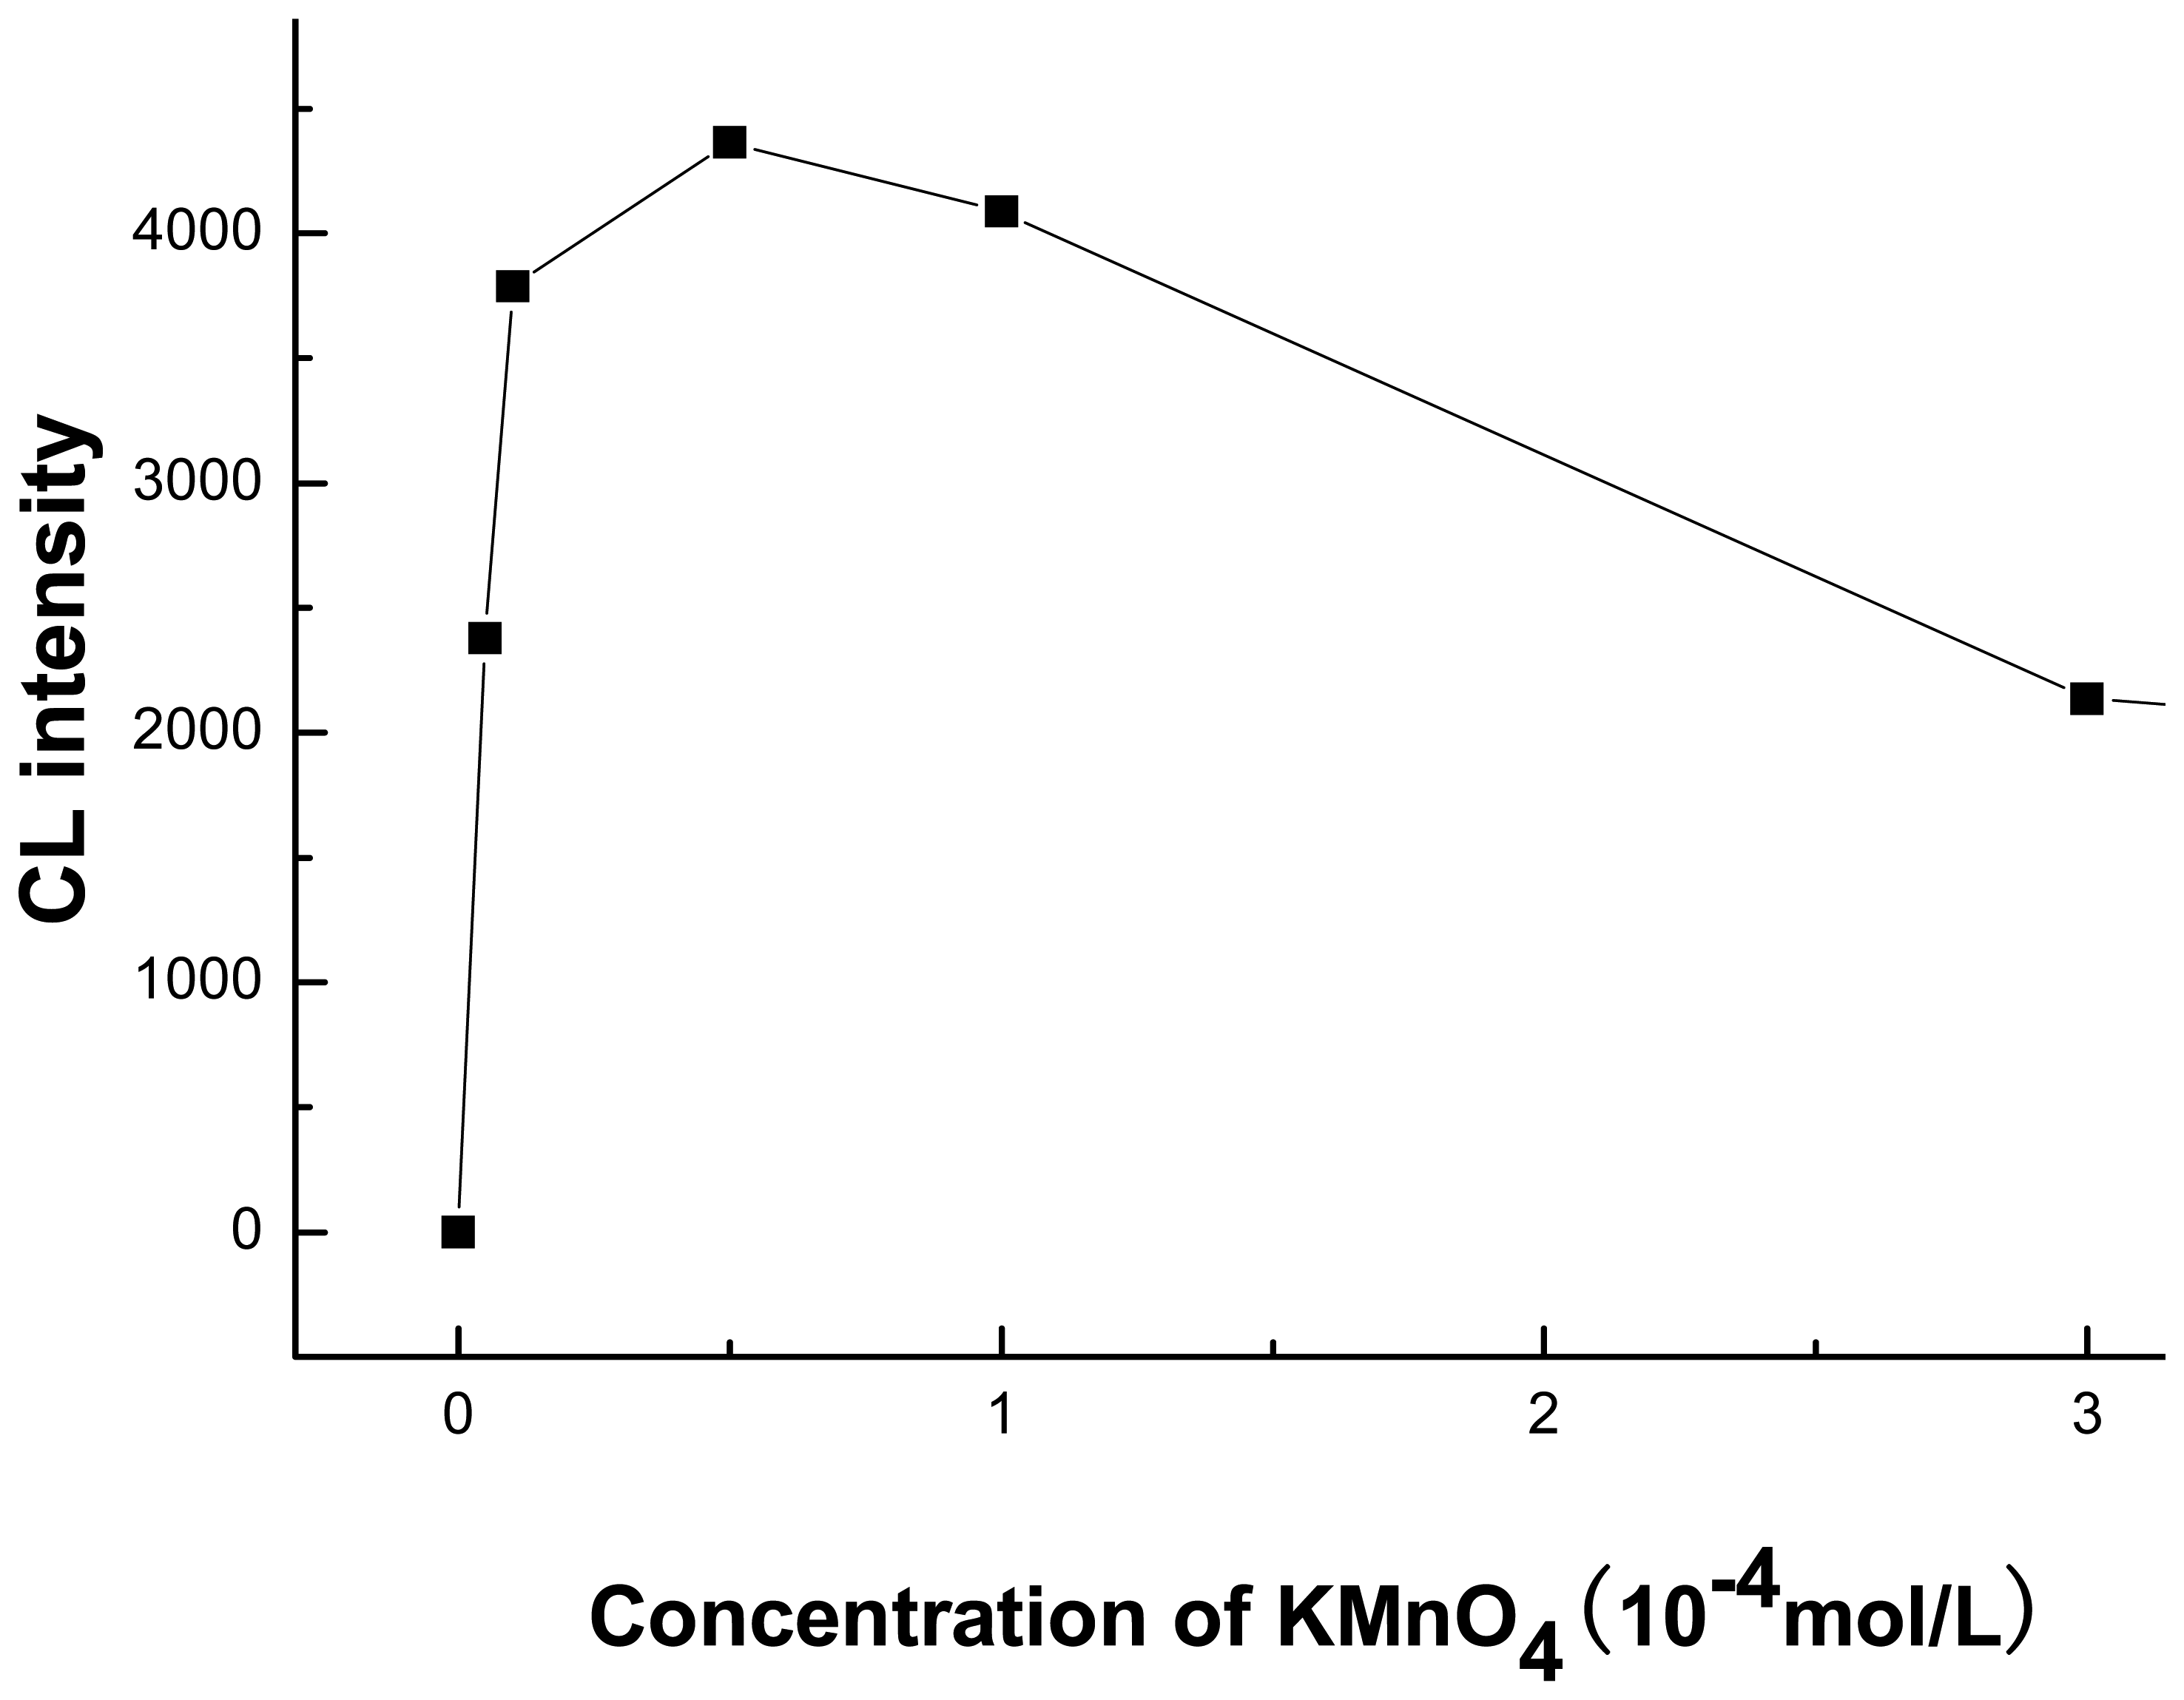
The influence of KMnO4 at different concentrations from 0.1×10⁻⁴ to 3.0×10⁻⁴ mol/L were tested (Fig. 6). The peak height increased gradually with raising KMnO4 concentration up to 0.5×10⁻⁴ mol/L, above which CL intensity decreased sharply probably because of self-absorption of the KMnO4. It was found that the stability of the CL signal fluctuated obviously as the concentration of KMnO4 became 0.5×10⁻⁴ mol/L and 0.2×10⁻⁴ mol/L. Therefore, 1.0×10⁻⁵ mol/L KMnO4 was used for the following studies.
3.5. Calibration Curves and Detection Limits
Under the optimum conditions described, the calibration curves were obtained for hydroquinone and catechol by plotting the graph of ΔI (relative CL intensity) vs. concentration. The measurable range of hydroquinone concentration was 1–10 ng/mL with a regression equation of ΔI = 187.49C + 194.97 (C, ng/mL; r = 0.9942) and the detection limit was 0.1 ng/mL. A series of 13 repetitive measurements of 6 ng/mL hydroquinone yielded a relative standard deviation of 1.1%. The system had a linear respond to catechol concentration in the range 1–20 ng/mL with a detection limit of 0.4 ng/mL and the regression equation was ΔI = 190.09C + 296.69 (C, ng/mL; r = 0.9939). The relative standard deviation for 6 ng/mL catechol was 1.6% (n = 13).
3.6 Interference studies
The influence of some common foreign species on the determination of 6 ng/mL hydroquinone was studied under the optimum experimental conditions stated above. The tolerable limit of a foreign species was taken as a relative error not greater than ±5% in the CL signal of hydroquinone. No interference has been found when including up to 1000-fold Na+, K+, SO42−, NO3−, Cl−, Br−, CO32− Ac−, NH4+; 500-fold PO43−, C2O42−, Ca2+, SO32−, Al3+, ethanol; 100-fold Mg2+, Zn2+, Ni2+, NO2−; fivefold S2−, Cu2+, Hg2+, Fe3+, and equal amount of resorcinol and catechol. Metal ions can be eliminated by EDTA [19] and an exchange resin [10].
3.7 Analytical applications
Because of the interference, the proposed method can only determine the hydroquinone or catechol concentration individually. When the system was used for industrial wastewater, the sample should be separated in advance. When the samples were river water and fishpond water, the mentioned substances were eliminated by filtration and ions were eliminated by adding an exchange resin [10]. In our work, the developed method was applied to the determination of catechol in river water. The determination results and recoveries are listed in Table 1. It can be seen that recovery varied from 96.0% to 107.0%, indicating that the method developed is suitable for determination of catechol. The system exhibited good stability and reproducibility, with relative standard deviation less than 3%. This is desirable for routine analysis.
3.8 Possible CL mechanism of the reaction
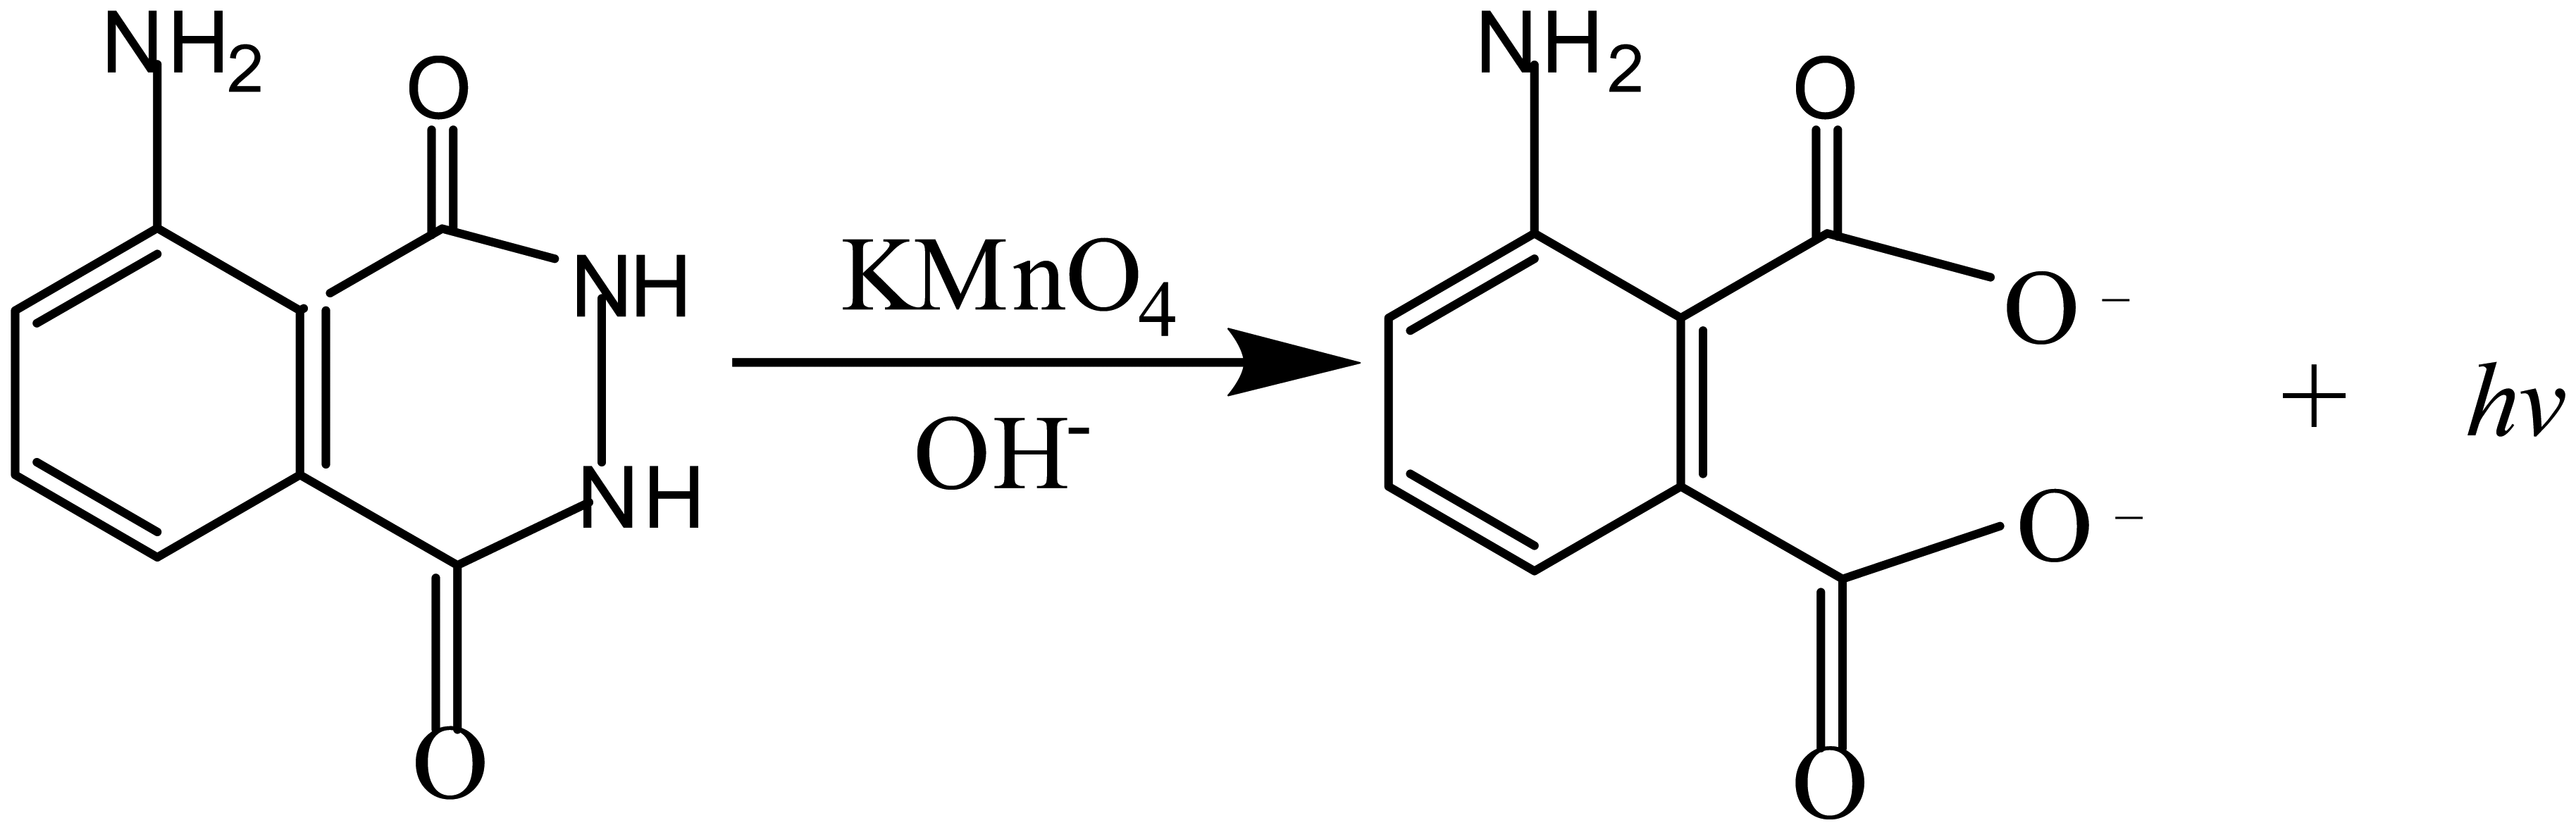
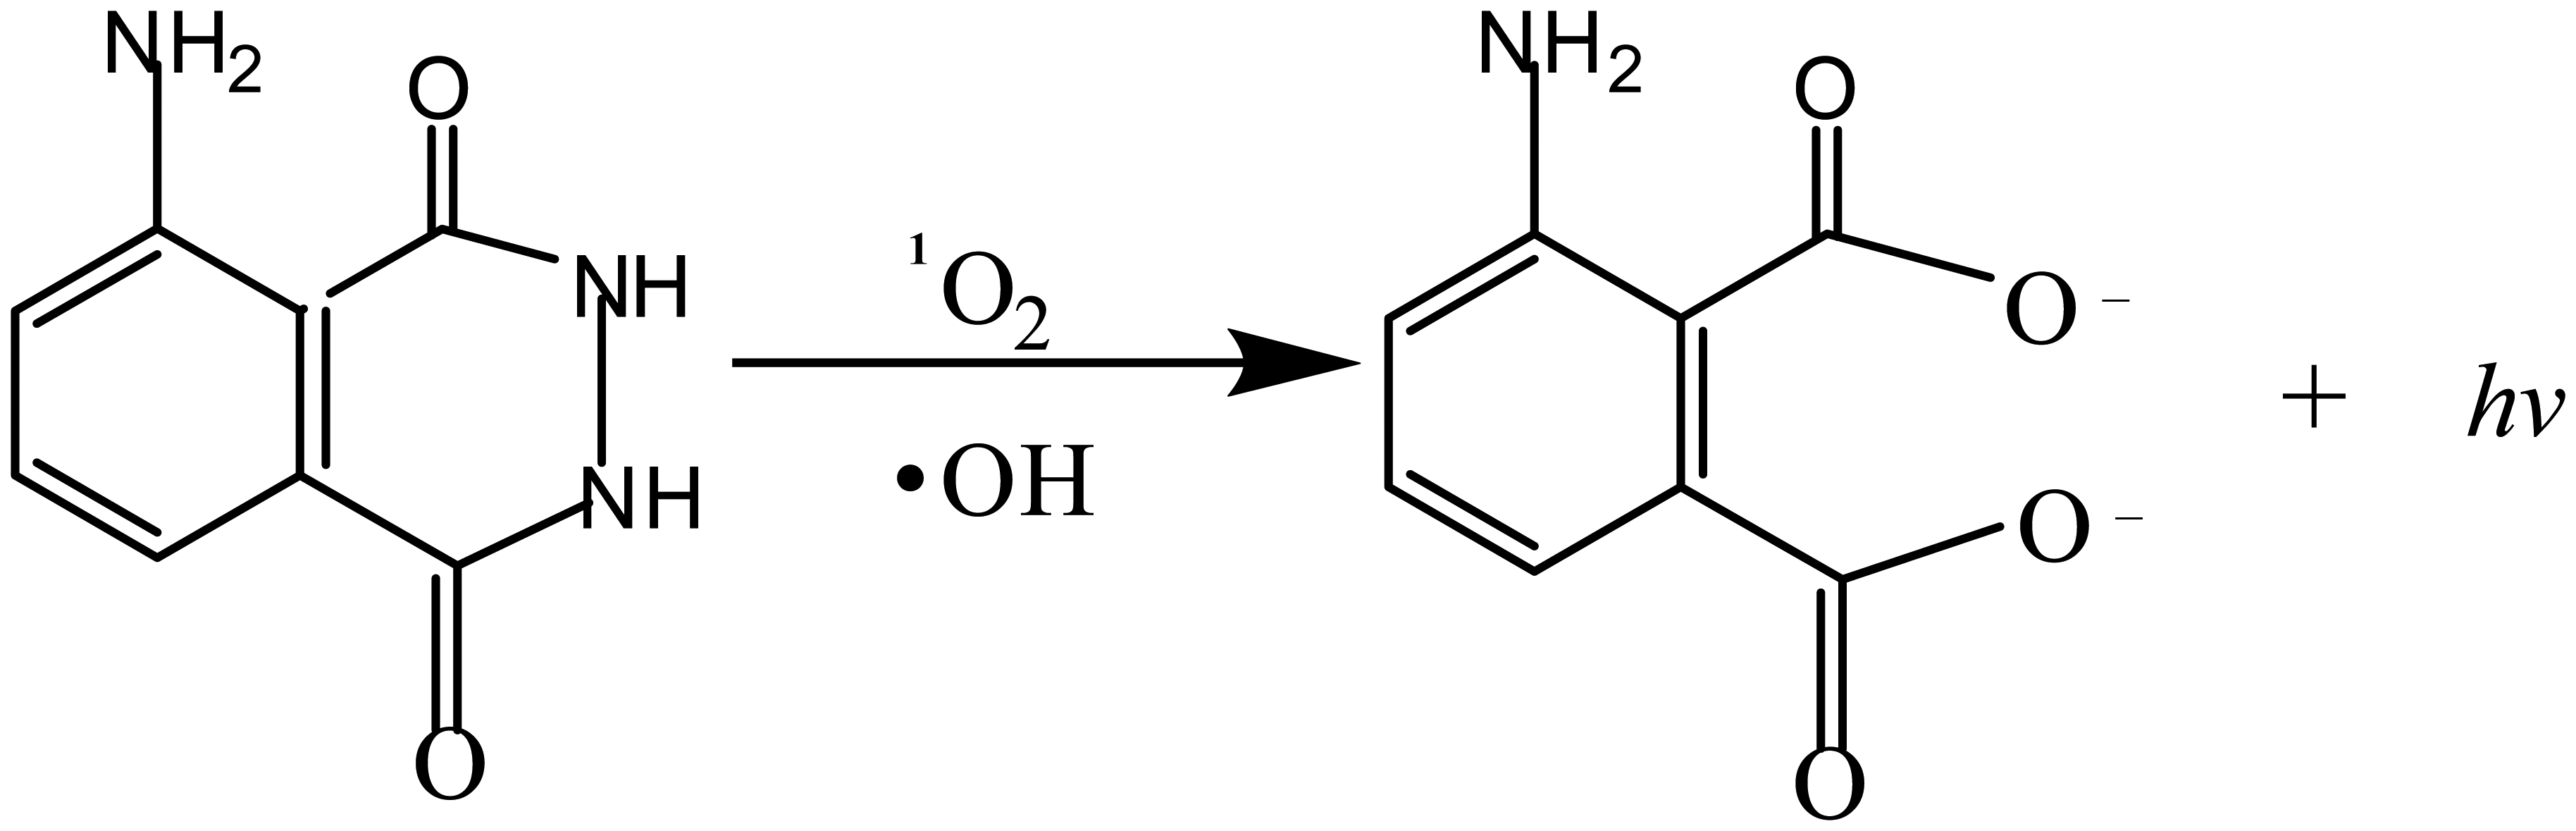
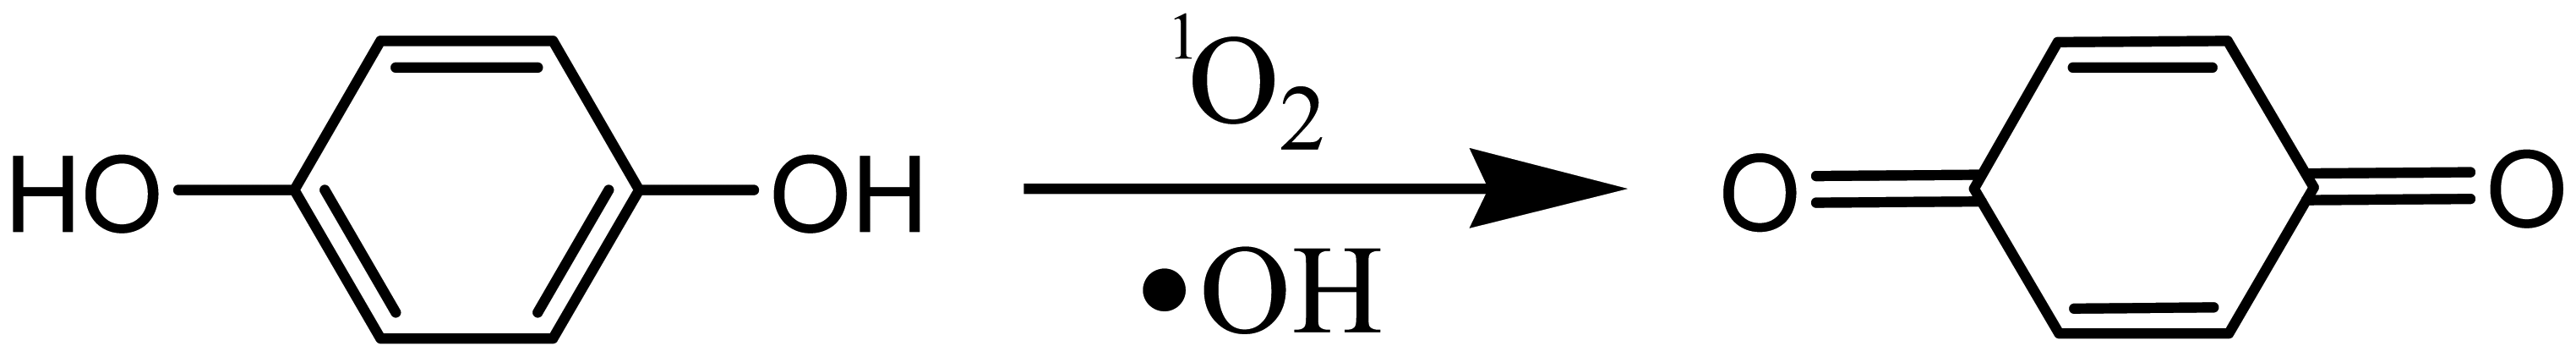
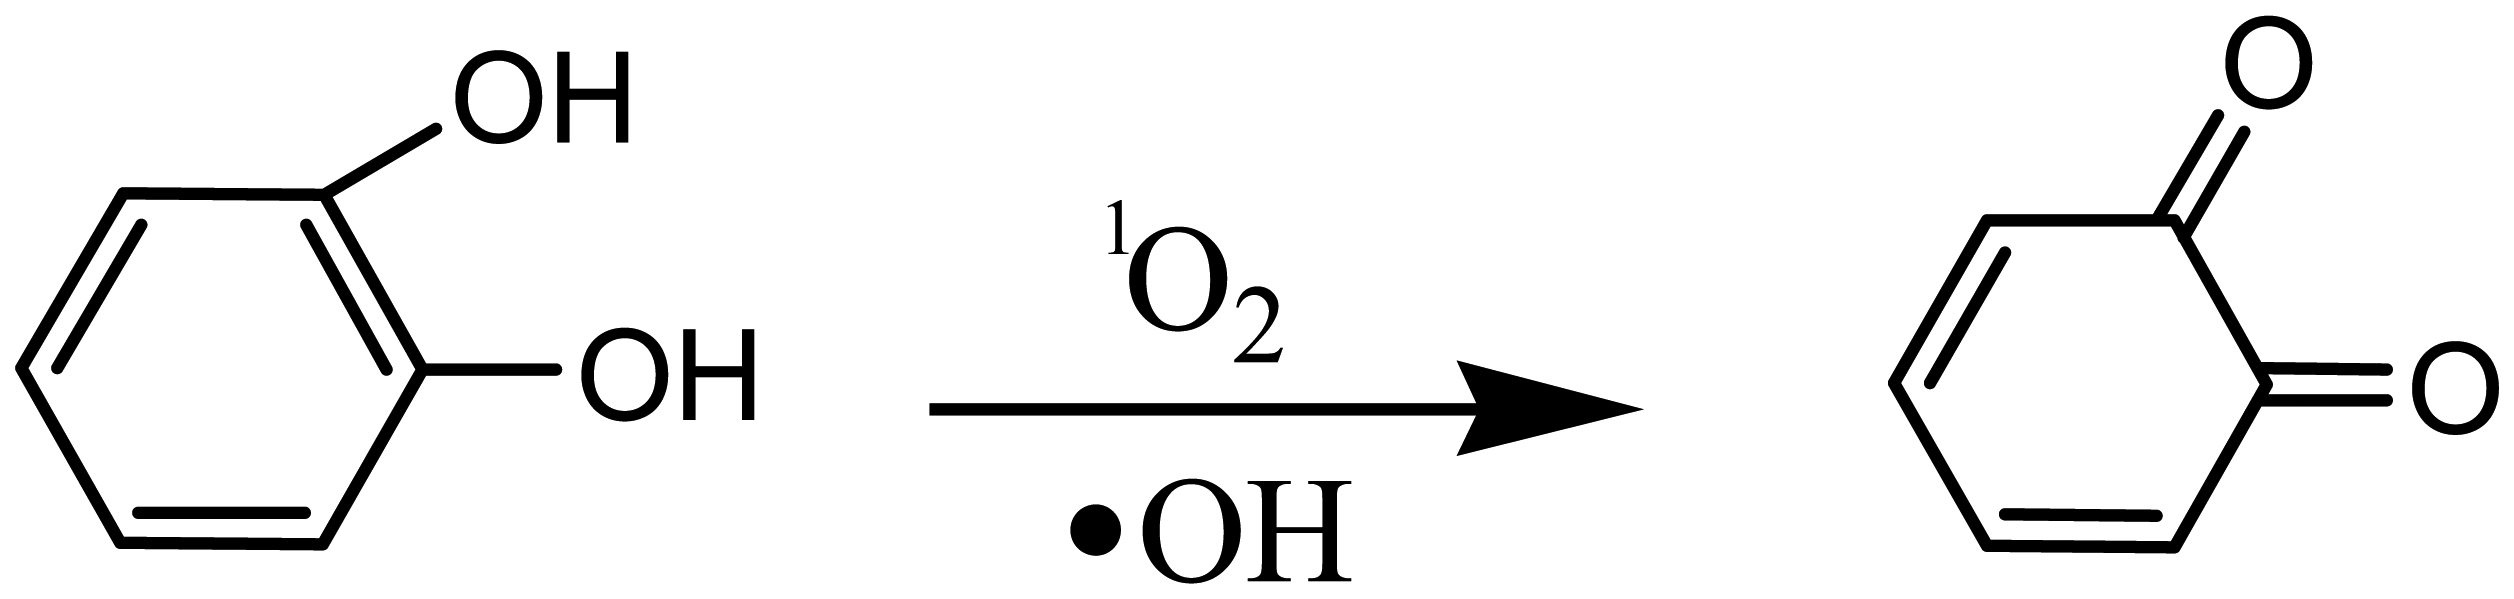
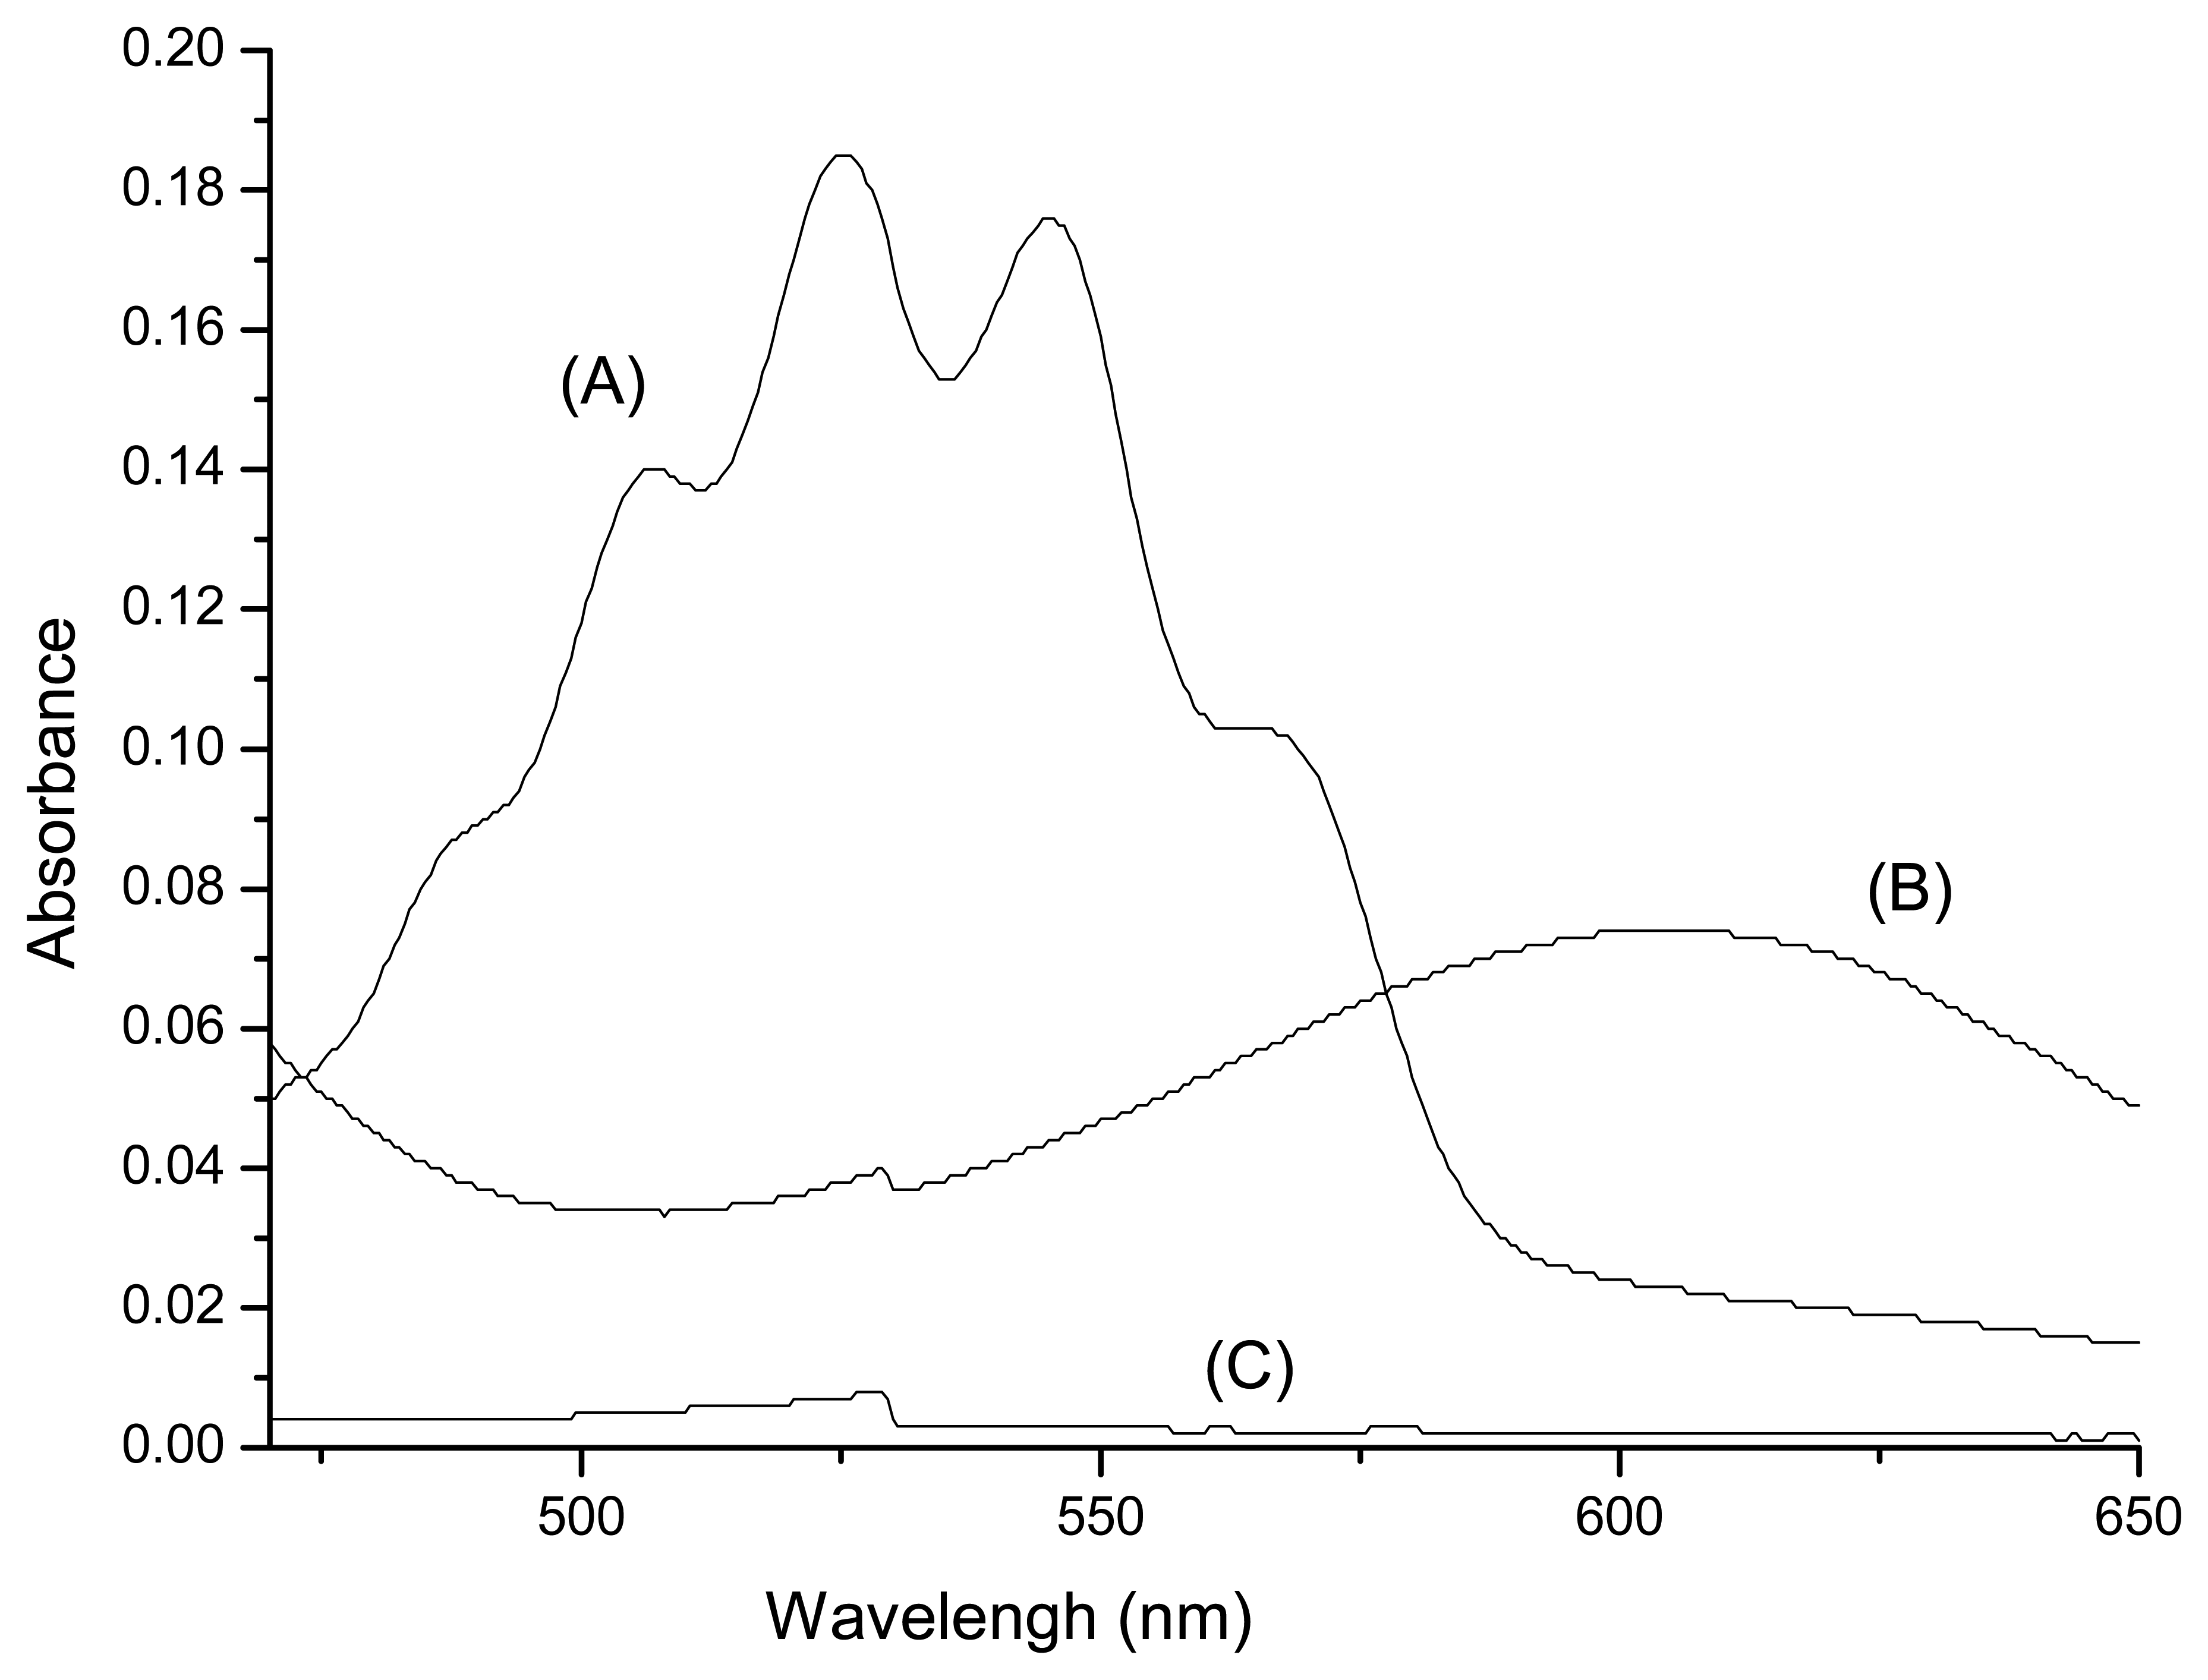
The possible mechanism of the reaction could be demonstrated in Scheme 1. CL is observed after mixing KMnO4 and luminol in a basic solution, which is described in equation 1[20]. The CL signal is greatly enhanced with the addition of β-CD. In order to explain the possible CL mechanism, the subsequent experiments were carried out with the sample solutions. Firstly, the spectra of CL reaction in the luminol–KMnO4–β-CD CL system in the presence and absence of sample solutions were measured by F-4500 fluorescence spectrophotometer, and compared with that of a conventional luminol–KMnO4 reaction [21,22]. The results showed that the maximum wavelength of CL spectra was identical with that of reported before (~425nm) [21,22]. It is suggested that the emission species is excited luminol. Secondly, the influence of dissolved oxygen on the CL reaction was investigated by purging solution with argon, the CL intensity was decreased by about 60%, this inferred that the dissolved oxygen possibly played a key role in this CL reaction [23]. Thirdly, the effect of ascorbic acid, a common scavenger of free radicals, on the system was studied to ascertain if free radical participated in the reaction. The striking quenching effect was obtained on the addition of ascorbic acid even at 1.0×10⁻⁵ mol/L level. The results indicated that free radical may be involved in the CL process (equation 2 and 3). Based on the above-described experimental results, we could conclude that the possible mechanism of the proposed system is a similar behavior as that described previously [10,23]. Singlet oxygen and hydroxyl radical are first formed in this reaction, which then reacts with luminol to produce excited luminol, thus light-emitting is produced. In order to further elucidate the possible CL mechanism, we study the possible products in the reaction via UV-visible absorption spectrum experiment. After adding 0.1g β-CD into the KMnO4 solution (6.0×10⁻⁵ mol/L) in 0.04mol/L NaOH media, the solution becomes green gradually as shown in Fig. 7. In Fig. 7, the two maxima peaks of KMnO4 at 525nm and 545nm disappear [20], with addition of 0.1g β-CD into the solution. And at about 605 nm, a new absorption peak appears, which is assigned to the MnO42- visible absorption [20]. Based on the above-described experimental results, KMnO4 seems to be reduced to K2MnO4 in the reaction. With the addition of sample solution, hydroquinone and catechol are oxidized by hydroxyl radical and singlet oxygen to produce corresponding quinones [10], hence a decreased CL signal is observed (equation 4 and 5).


4. Conclusions
A new flow-injection CL method is developed for the determination of hydroquinone and catechol, based upon the inhibitory effects on the luminol–KMnO4–β-cyclodextrin reaction in alkaline solution. The system exhibits good stability, reproducibility and satisfactory detection limit. After some pretreatments of industrial wastewater and river water mentioned above, the method can be applied to the determination of hydroquinone and catechol. The proposed method offers the advantages of simplicity, rapidity, and high sensitivity for the determination of hydroquinone and catechol, and can be adopted as an alternative to the existing methods. Further research work on this subject is still in progress, the CL reaction developed can be coupled with high performance liquid chromatography (HPLC) to simultaneously determine hydroquinone and catechol.
Acknowledgments
This study was supported by the National Natural Science Foundation of China (No. 20570542) and the Innovation Foundation of Sichuan University (No: 2006G006).
References
- Rueda, M. E.; Sarabia, L. A.; Herrero, A.; Ortiz, M.C. Optimisation of a flow injection system with electrochemical detection using the desirability function Application to the determination of hydroquinone in cosmetics. Anal. Chim. Acta. 2003, 479, 173–184. [Google Scholar]
- Cui, H.; He, C. X.; Zhao, G. W. Determination of polyphenols by high-performance liquid chromatography with inhibited chemiluminescence detection. J. Chromatogr. A. 1999, 855, 171–179. [Google Scholar]
- Lavrent, K.; Julien, A.; Zofia, M.; Barry, D. Formation of Cyclopentadienyl Radical from the Gas-Phase Pyrolysis of Hydroquinone, Catechol, and Phenol. Environ. Sci. Technol. 2006, 40, 5071–5076. [Google Scholar]
- William, S. S.; Robert, M. M.; Maurice, E. S.; Ralph, E. W. Pyrolytic Studies on the Contribution of Tobacco Leaf Constituents to the Formation of Smoke Catechols. J. Agric. Food Chem. 1982, 30, 372–374. [Google Scholar]
- Steven, G. C.; Stephen, S. H.; T, T. C.; Dietrich, H. Roles of Tobacco Cellulose, Sugars, and Chlorogenic Acid as Precursors to Catechol in Cigarette Smoke. J. Agric. Food Chem. 1984, 32, 267–273. [Google Scholar]
- Nagaraja, P.; Vasantha, R.A.; Sunitha, K. R. A new sensitive and selective spectrophotometric method for the determination of catechol derivatives and its pharmaceutical preparations. J. Pharm. Biomed. Anal. 2001, 25, 417–424. [Google Scholar]
- Parham, H.; Pourreza, N.; Cheraghi, S. Kinetic-spectrophotometric determination of trace amounts of resorcinol based on its inhibitory effect on the formaldehyde catalyzed reaction between bromate and neutral red. Anal. Lett. 1999, 32, 1917–1926. [Google Scholar]
- Wang, L. H.; Kuo, Y. P. Simultaneous quantitative determination of resorcinol and 1-naphthol in haircolor products by high-performance liquid chromatography. Chromatographia 1999, 49, 208–211. [Google Scholar]
- Sun, Y. G.; Cui, H.; Li, Y. H.; Lin, X. Q. Determination of some catechol derivatives by a flow injection electrochemiluminescent inhibition method. Talanta. 2000, 53, 661–666. [Google Scholar]
- He, D. Y.; Zhang, Z. J.; He, C. Investigation on the interaction between dihydroxybenzene and Fe3+-H2O2-Rh6G system based on enhancing chemiluminescence. Luminescence 2006, 21, 15. [Google Scholar]
- Kamil, M.; Antonije, O.; Pavel, M.; Zbyněk, V. Flow-injection chemiluminescence determination of formaldehyde in water. Talanta. 2007, 71, 900–905. [Google Scholar]
- Cao, W.; Yang, J. H.; Sun, C. X.; Zhang, Z. J.; Gao, Q. F. Flow-injection-chemiluminescence method for the determination of penicillin G potassium. Luminescence. 2005, 20, 238–242. [Google Scholar]
- Lv, Y.; Zhao, R.; Zhu, Z. L.; Xu, X.S.; Zhang, X. R. A novel chemiluminescence method for the determination of orciprenaline based on ferricyanide-rhodamine 6G. Luminescence. 2005, 20, 298–302. [Google Scholar]
- Yao, H.; Sun, Y. Y.; Lin, X. H.; Cheng, J. H.; Huang, L. Y. Flow-injection chemiluminescence determination of catecholamines based on their enhancing effects on the luminol–potassium periodate system. Luminescence. 2006, 21, 112–117. [Google Scholar]
- Cui, H.; Xie, C. G.; Lai, C. Z. A novel chemiluminescent method for determination of phloroglucinol. Luminescence. 2003, 18, 318–323. [Google Scholar]
- Liu, E. B.; Xue, B. C. Flow injection determination of adenine at trace level based on luminol– K2Cr2O7 chemiluminescence in a micellar medium. J. Pharm. Biomed. Anal. 2006, 41, 649–653. [Google Scholar]
- Du, J. X.; Li, Y. H.; Lu, J. R. Flow injection chemiluminescence determination of polyhydroxy phenols using luminol–ferricyanide/ferrocyanide system. Talanta 2001, 55, 1055–1058. [Google Scholar]
- Lu, Y.; Zhang, Z. J.; He, D. Y.; Hu, Y. F. Flow injection chemiluminescence determination of polyhydroxy phenols in the presence of Rhodamine B as a sensitiser. Chem. Anal. 2003, 48, 959–966. [Google Scholar]
- Song, Z. H.; Wang, L. Resorcinol chemosensor based on detection of chemiluminescence with immobilized reagents. Microchem. J. 2001, 68, 47–52. [Google Scholar]
- Du, J. X.; Liu, W. X.; Lu, J. R. Investigation on the chemiluminescence behavior of alkaline earth metal ions Mg2+, Ca2+, Sr2+ and Ba2+ in luminol-permanganate reaction. Acta Chimica Sinica. 2004, 14, 1323–1326. [Google Scholar]
- Li, Y. H.; Niu, W. F.; Lu, J. R. Sensitive determination of phenothiazines in pharmaceutical preparation and biological fluid by flow injection chemiluminescence method using luminol– KMnO4 system. Talanta 2007, 71, 1124–1129. [Google Scholar]
- Emil, H. W.; Oliver, Z.; Heinz, H. K.; John, H. M. H. Chemiluminescence of Luminol and Related Hydrazides : The Light Emission Step. J. Am. Chem.Soc. 1964, 86, 941–942. [Google Scholar]
- Cao, Z. J.; Choiwan, L.; Lu, J. Z. A general chemiluminescence method for the determination of surfactants based on its quenching effect on the luminol-NaIO4-cyclodextrin reaction. Analyst. 2004, 129, 1262–1266. [Google Scholar]
Figure 1.
Schematic of the flow system for determination of hydroquinone and catechol. a, KMnO4 solution; b, β-cyclodextrin solution; c, sample solution; d, luminol solution; P1 and P2, peristaltic pumps 1 and 2; L2 450 mm length; V, eight-way injection valve; F, flow cell; PMT, photomultiplier tube; HV, high voltage (operated at -600 V); COM, computer; W, waste solution.

Figure 2.
The CL characteristics of the reaction system. A. a, Blank: 1.0×10⁻⁵ mol/L KMnO4+1.0×10⁻⁴ mol/L β-cyclodextrin+1.0×10⁻⁴ mol/L luminol; b, a+ 10 ng/mL hydroquinone; B. a, Blank: 1.0×10⁻⁵ mol/L KMnO4+1.0×10⁻⁴ mol/L β-cyclodextrin+1.0×10⁻⁴ mol/L luminol; b, a+ 10 ng/mL catechol.
Figure 2.
The CL characteristics of the reaction system. A. a, Blank: 1.0×10⁻⁵ mol/L KMnO4+1.0×10⁻⁴ mol/L β-cyclodextrin+1.0×10⁻⁴ mol/L luminol; b, a+ 10 ng/mL hydroquinone; B. a, Blank: 1.0×10⁻⁵ mol/L KMnO4+1.0×10⁻⁴ mol/L β-cyclodextrin+1.0×10⁻⁴ mol/L luminol; b, a+ 10 ng/mL catechol.

Figure 3.
Effect of NaOH concentration on CL intensity (sample = 6 ng/mL).

Figure 4.
Effect of β-CD concentration on CL intensity (sample = 6 ng/mL).

Figure 5.
Effect of luminol concentration on CL intensity (sample = 6 ng/mL).
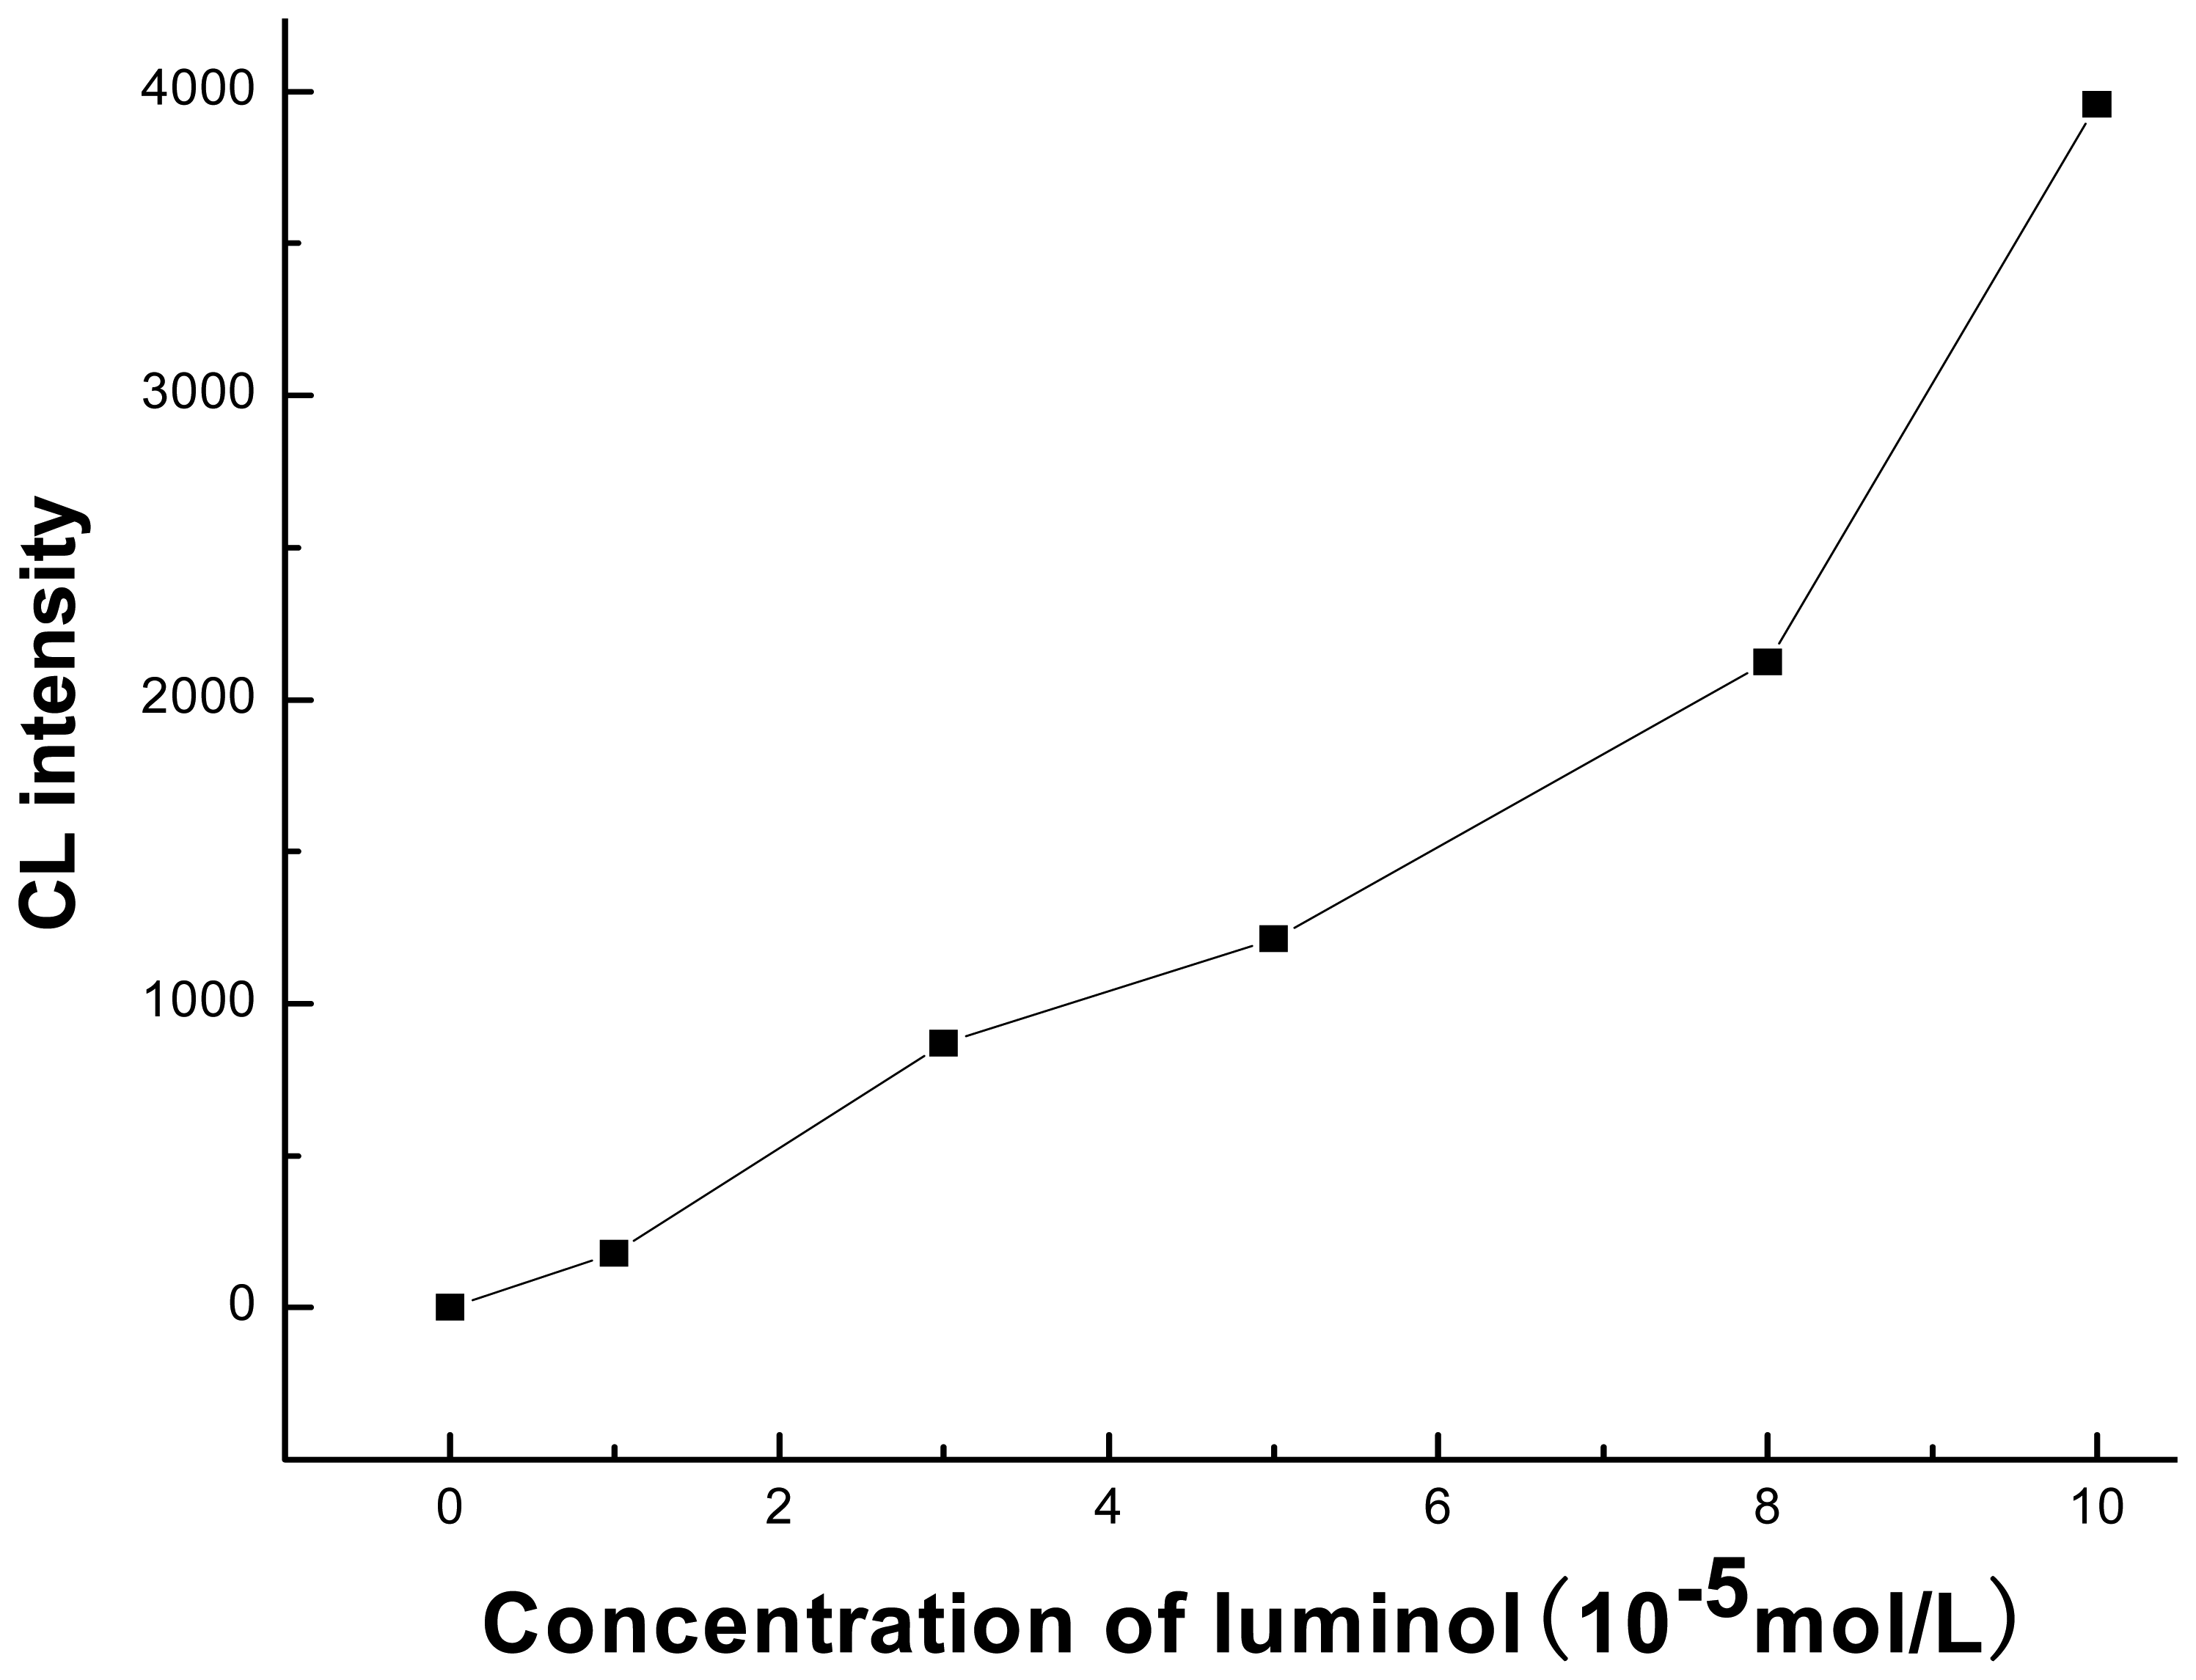
Figure 6.
Effect of KMnO4 concentration on CL intensity (sample = 6 ng/mL).

Figure 7.
UV–vis absorption spectra: (A) KMnO4 (B) KMnO4+β-CD (C) β-CD

Scheme 1.
Possible reaction process of the present system.

© 2007 by MDPI ( http://www.mdpi.org). Reproduction is permitted for noncommercial purposes.
Share and Cite
MDPI and ACS Style
Zhao, L.; Lv, B.; Yuan, H.; Zhou, Z.; Xiao, D. A Sensitive Chemiluminescence Method for Determination of Hydroquinone and Catechol. Sensors 2007, 7, 578-588. https://doi.org/10.3390/s7040578
AMA Style
Zhao L, Lv B, Yuan H, Zhou Z, Xiao D. A Sensitive Chemiluminescence Method for Determination of Hydroquinone and Catechol. Sensors. 2007; 7(4):578-588. https://doi.org/10.3390/s7040578
Chicago/Turabian StyleZhao, Lijun, Baoqiang Lv, Hongyan Yuan, Zaide Zhou, and Dan Xiao. 2007. "A Sensitive Chemiluminescence Method for Determination of Hydroquinone and Catechol" Sensors 7, no. 4: 578-588. https://doi.org/10.3390/s7040578