Piezoelectric Sensor for Determination of Genetically Modified Soybean Roundup Ready (R) in Samples not Amplified by PCR

Abstract
:1. Introduction
2. Materials and Methods
2.1. Reagents
2.2. Characterization of Probes and Target DNA
| The probes: | |
| (m.w. 6987) |
| (m.w. 6717) |
| The target DNA: | |
| (m.w. 6249) |
| (m.w. 6521) |
| (m.w. 6980) |
| |
| |
| |
| |
2.3. Composition of Buffers
- Immobilization buffer: 40 mM HEPES, 60 mM NaCl, pH = 7.5
- Hybridization buffer: 27 mM HEPES, 55mM NaCl, 2.5 mM MgCl2, pH = 7.5 (hybridization of 21-mer oligonucleotides 1 was carried out in the buffer without MgCl2)
- Denaturation buffer: 27 mM HEPES, 55 mM NaCl, 0.1 mM EDTA, pH = 8.0
2.4. Purification of PCR products
2.5. Extraction of Genomic DNA
2.6. Quartz Crystal Microbalance
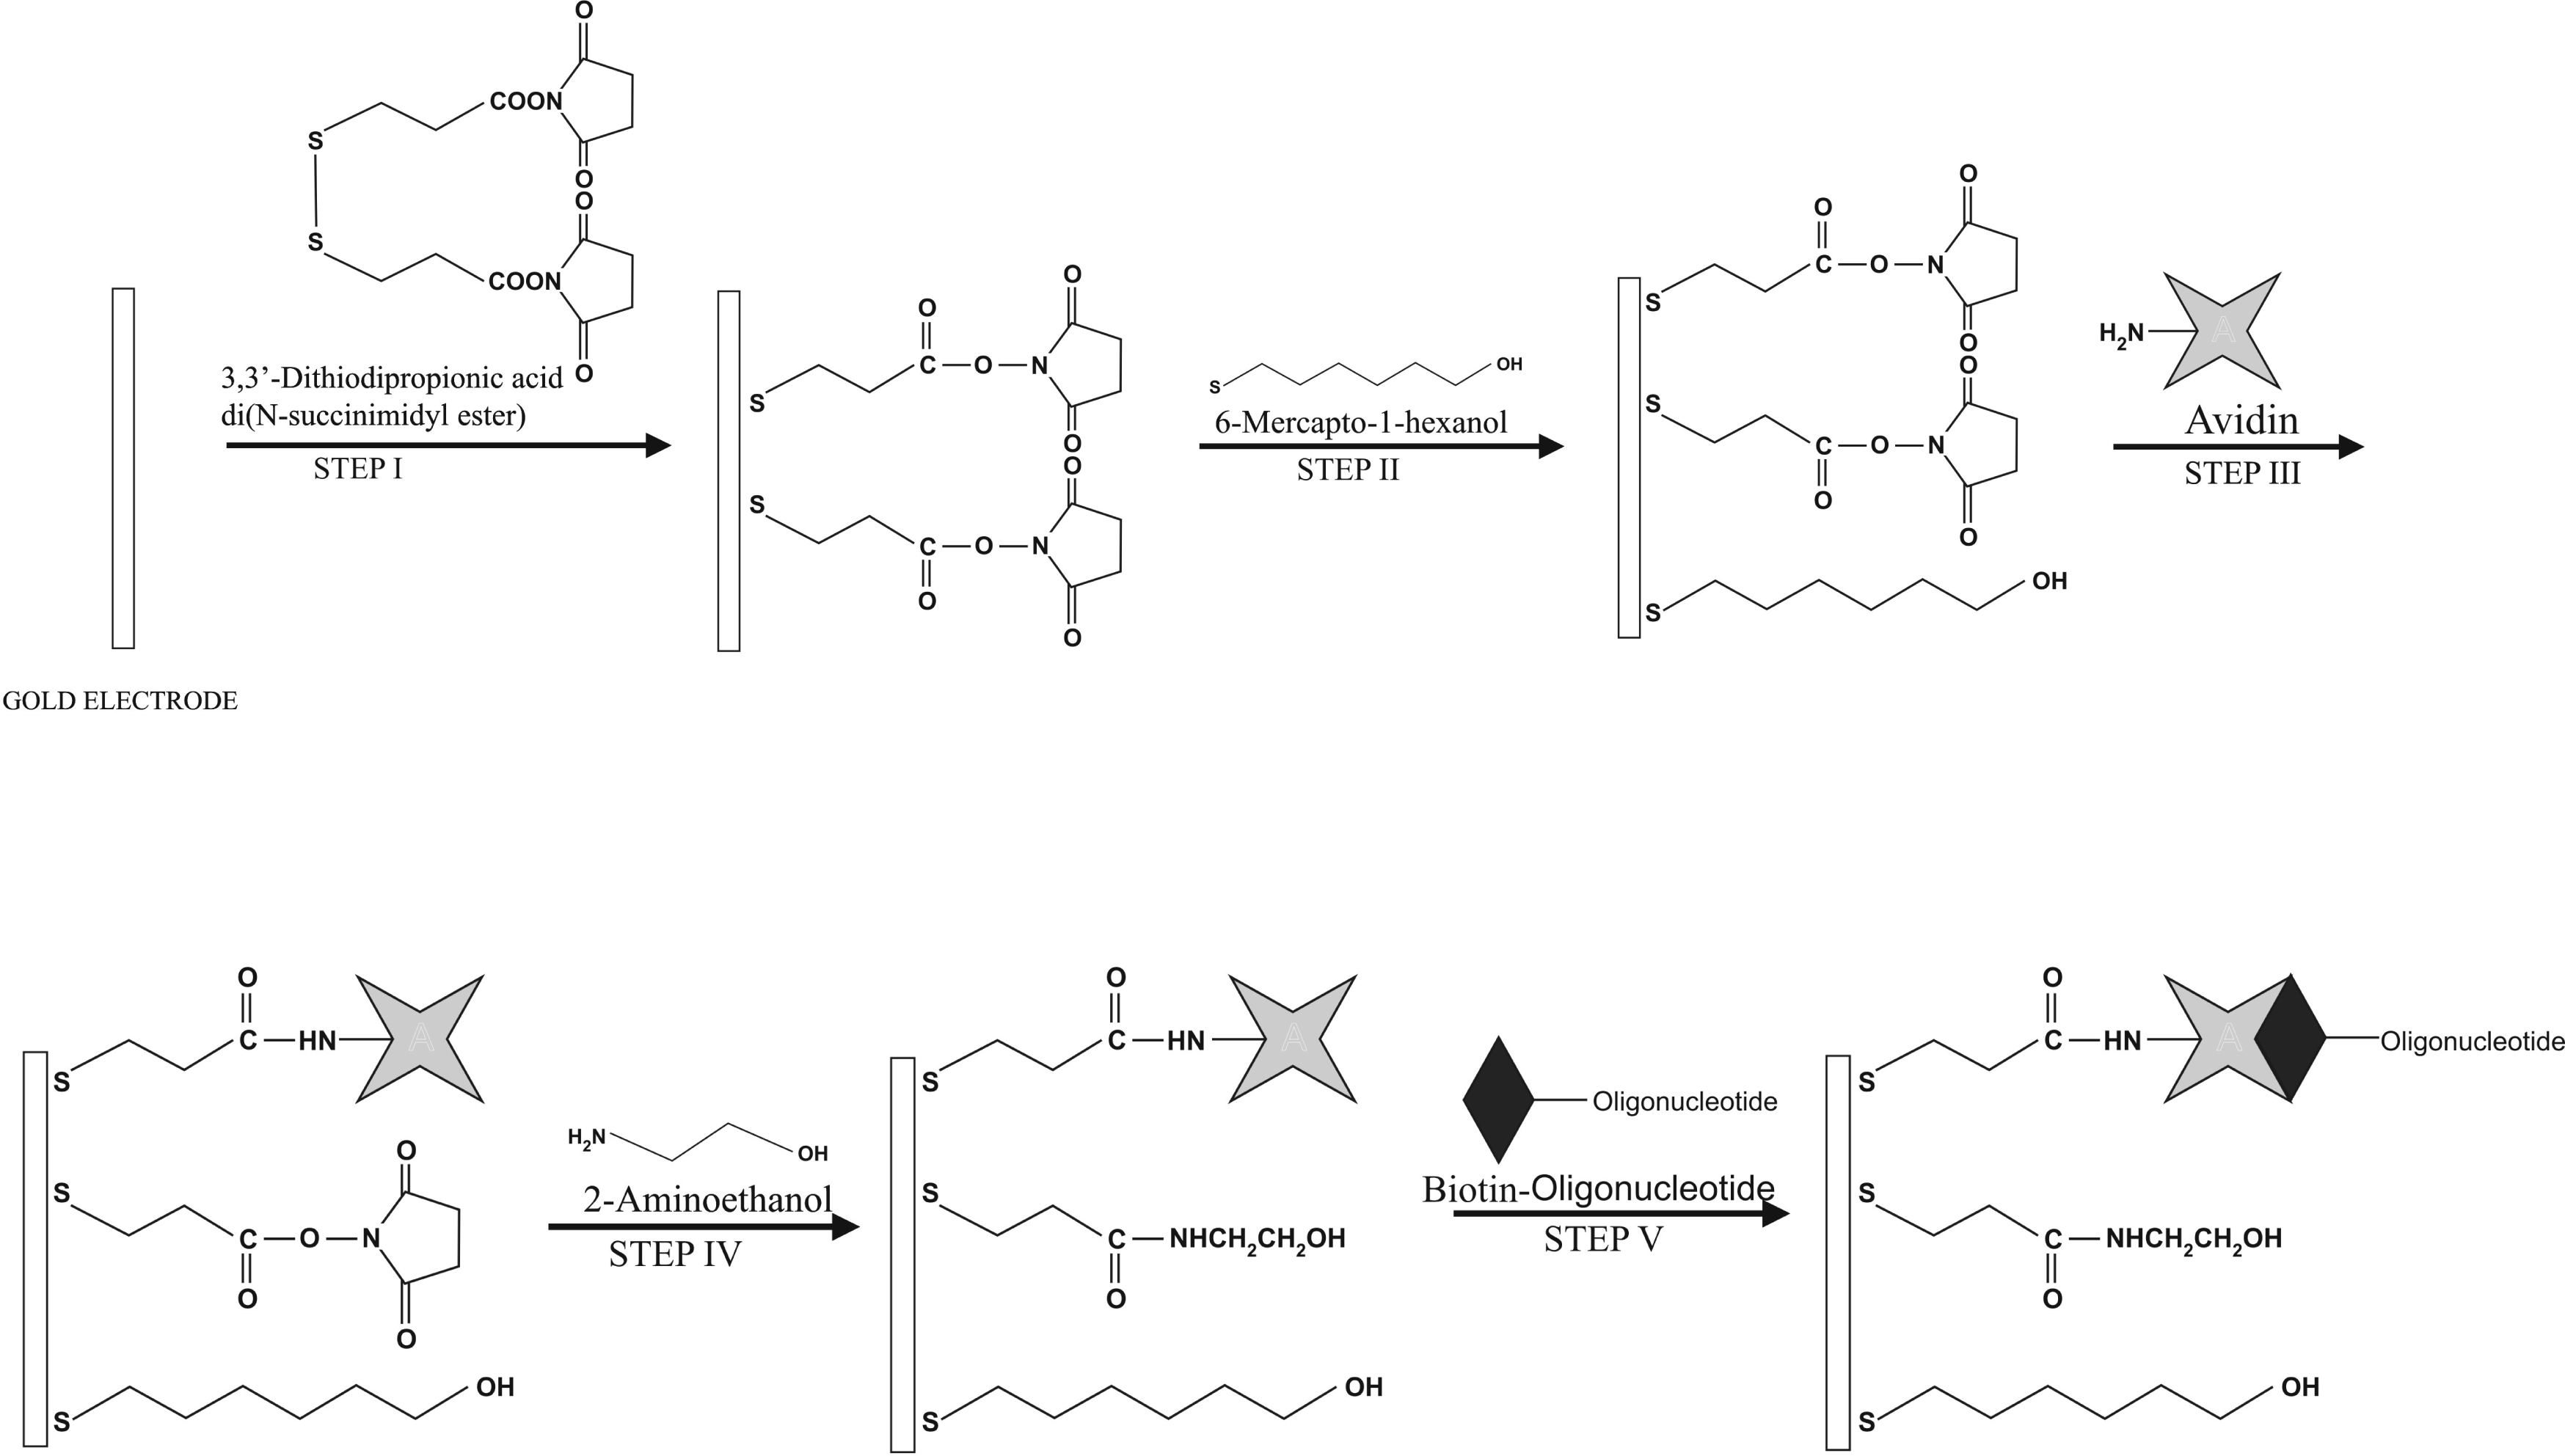
2.7. Modification of Gold Surface of QCM Electrodes
2.8. Hybridization Process Monitored by QCM Method
3. Results and Discussion
3.1. Modification of Gold Surface of QCM Electrodes
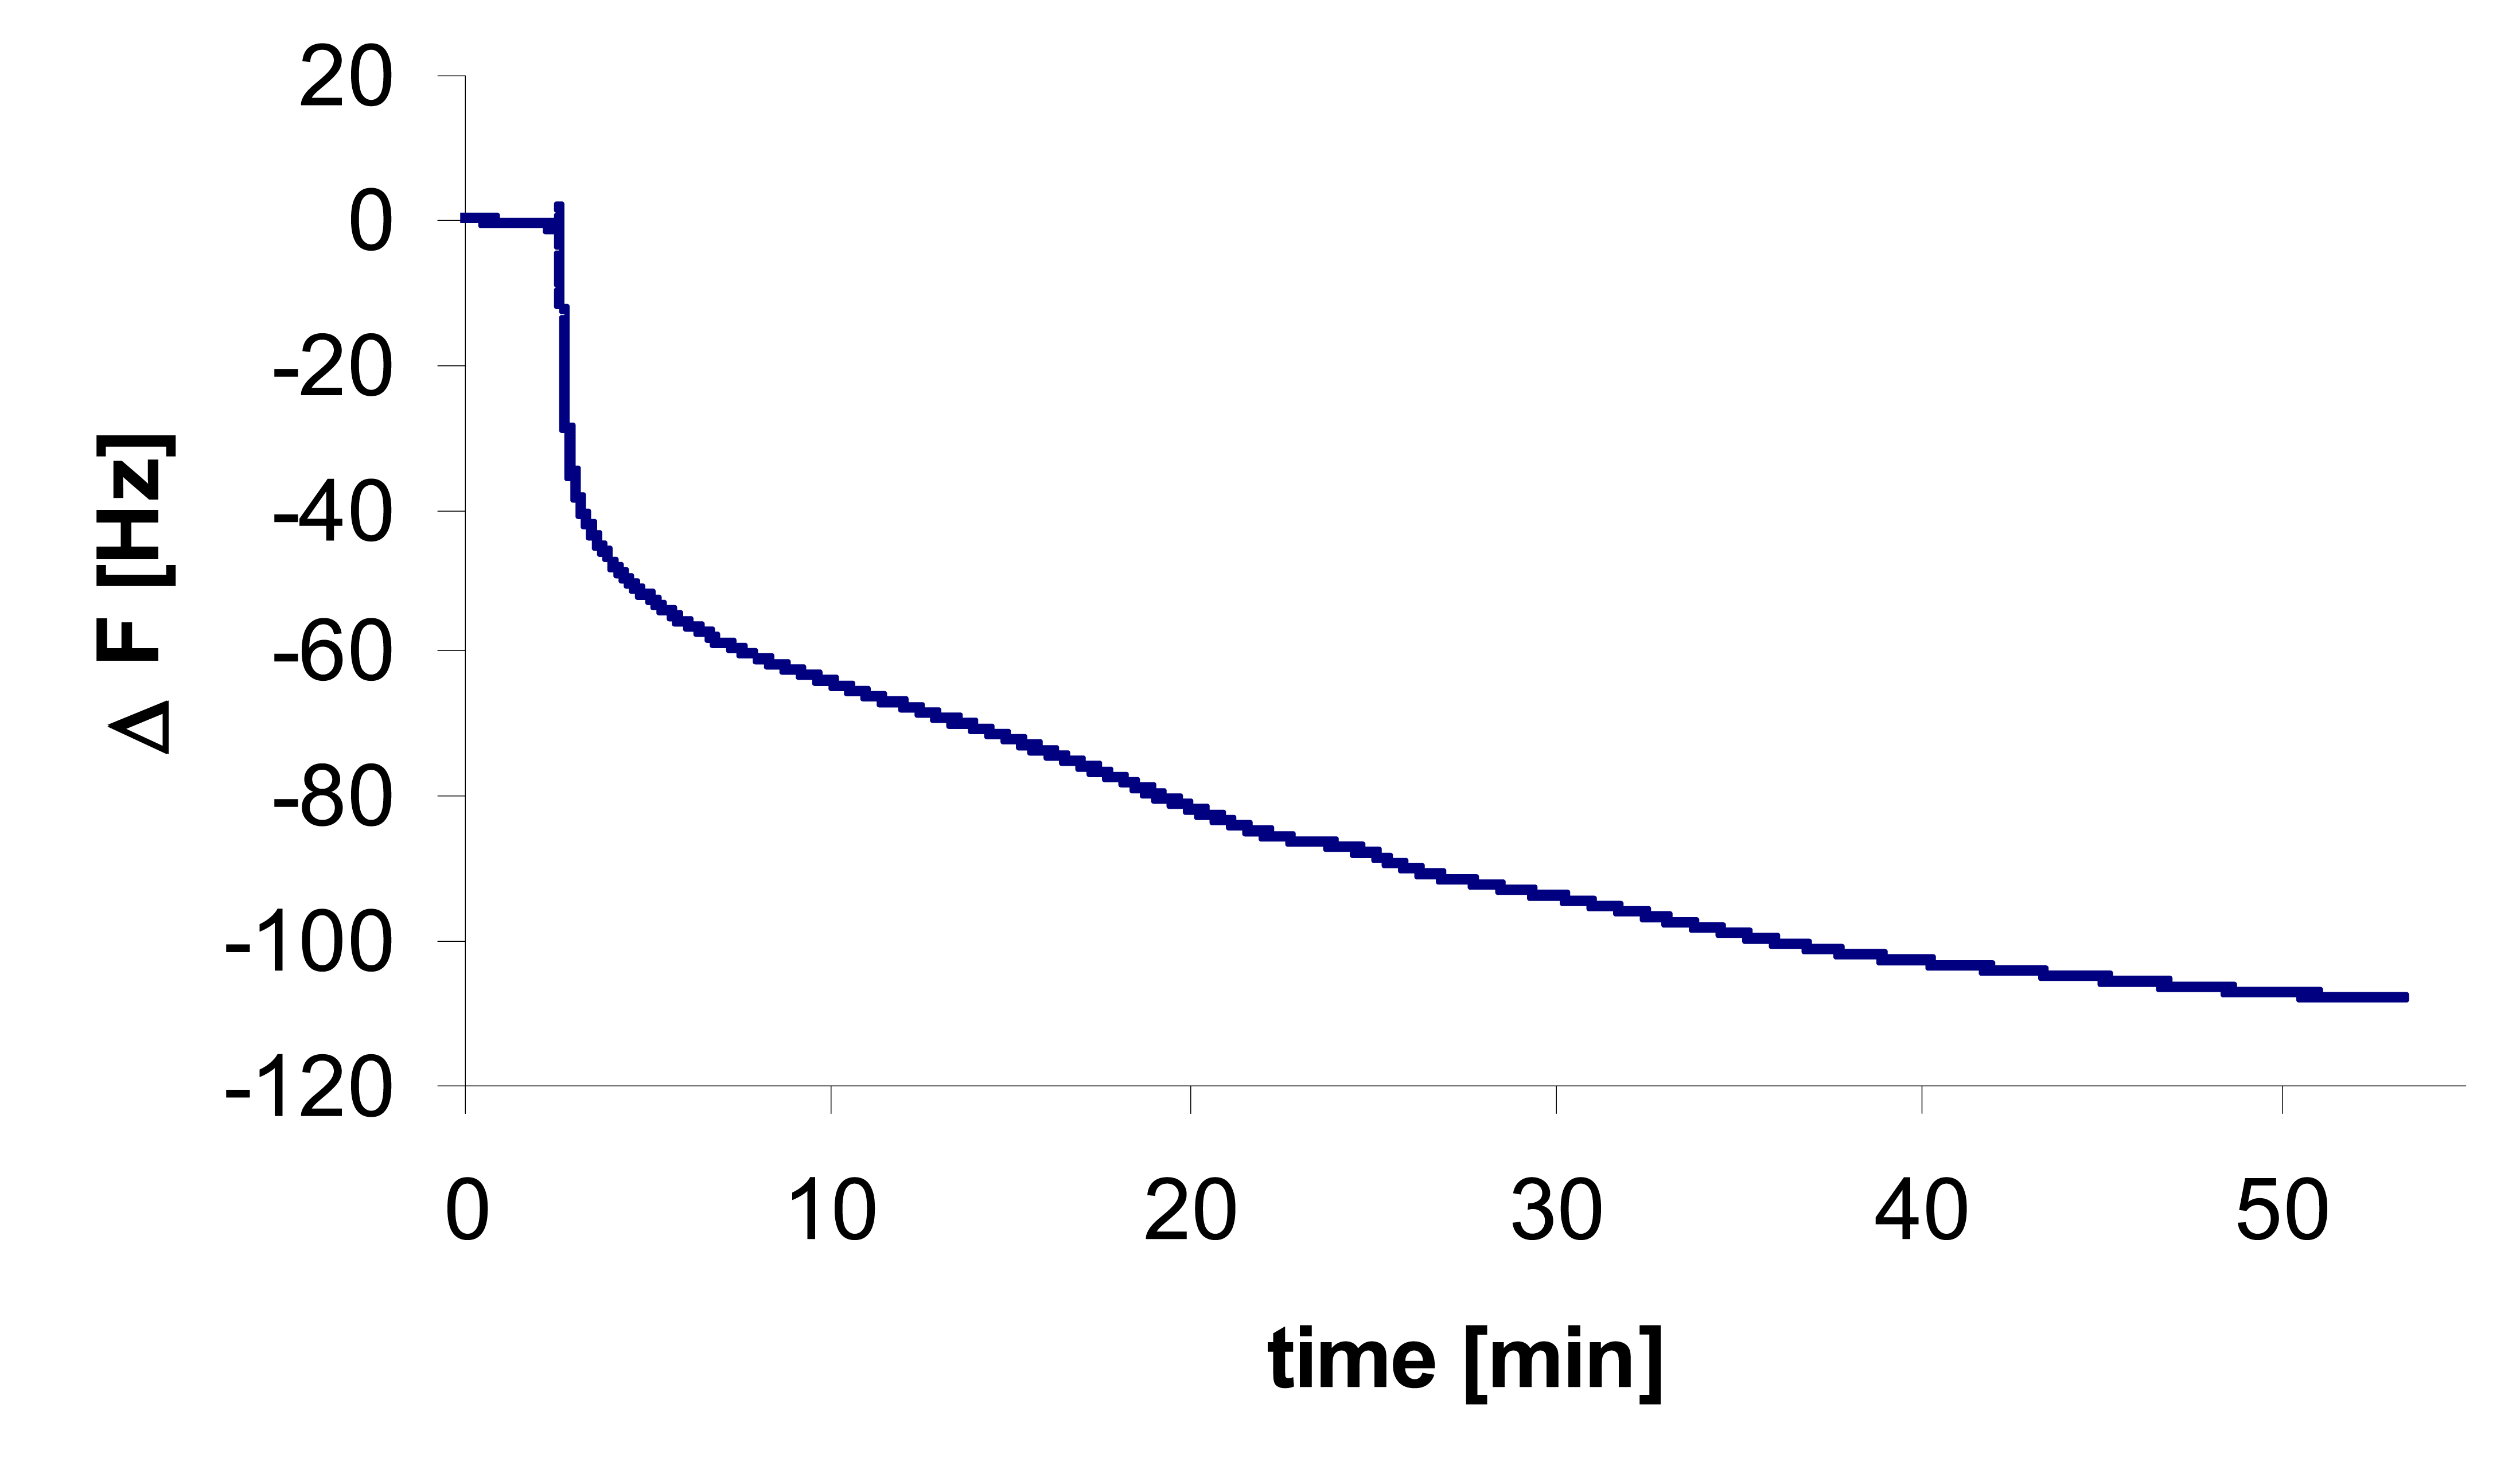
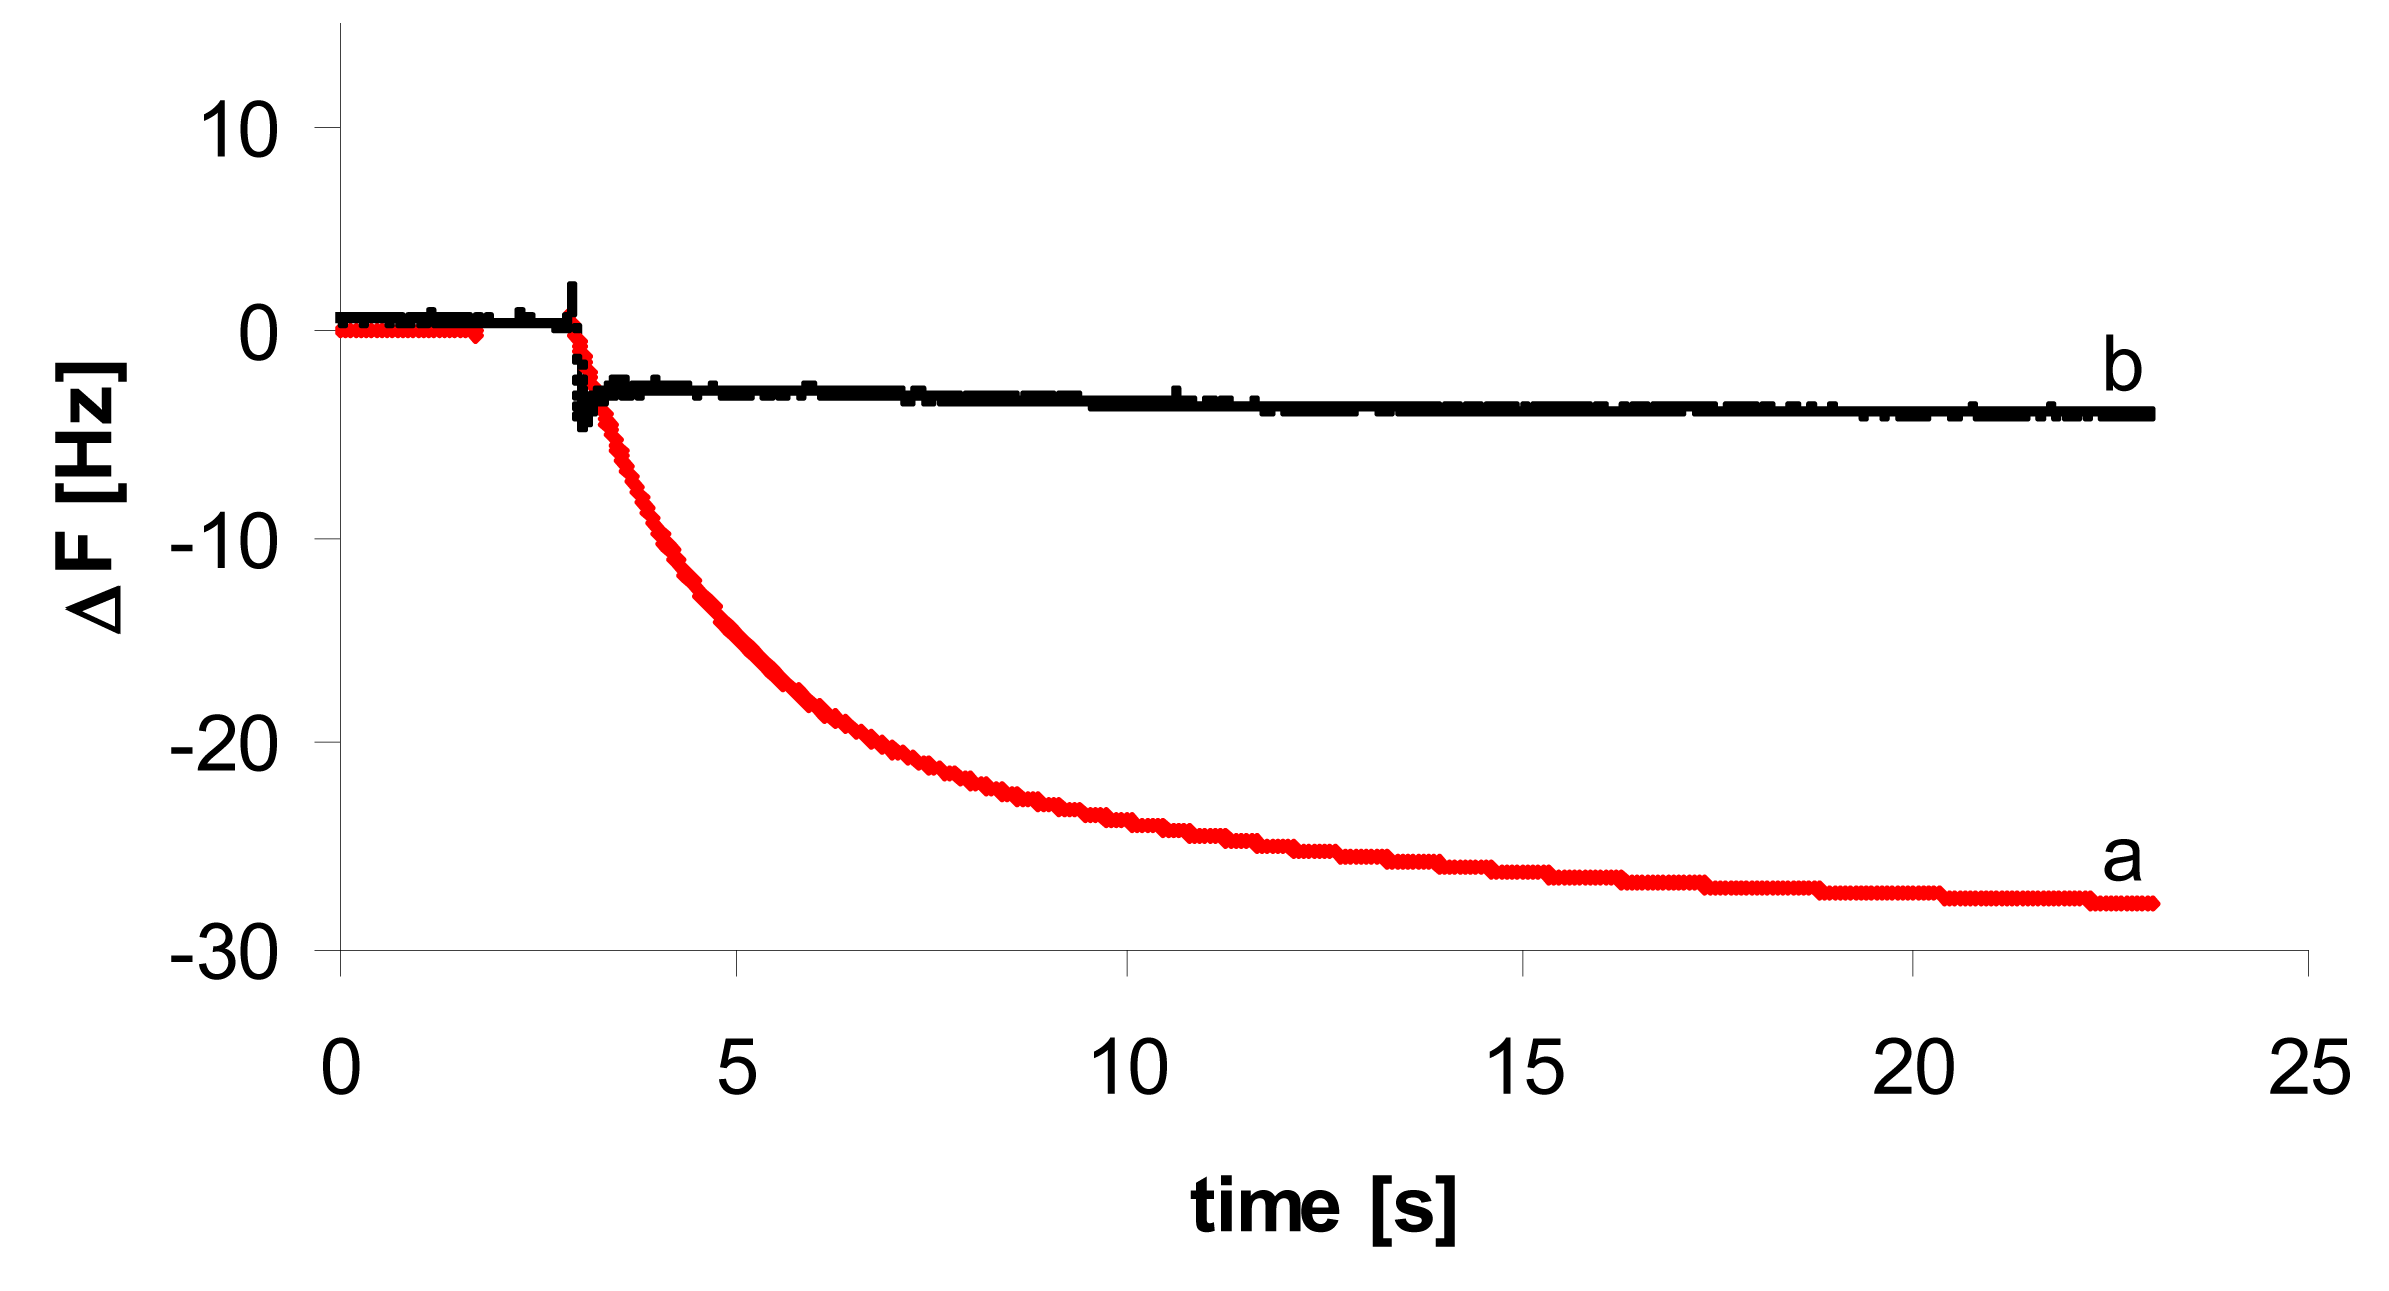
3.2. Hybridization Process Monitored by QCM Method
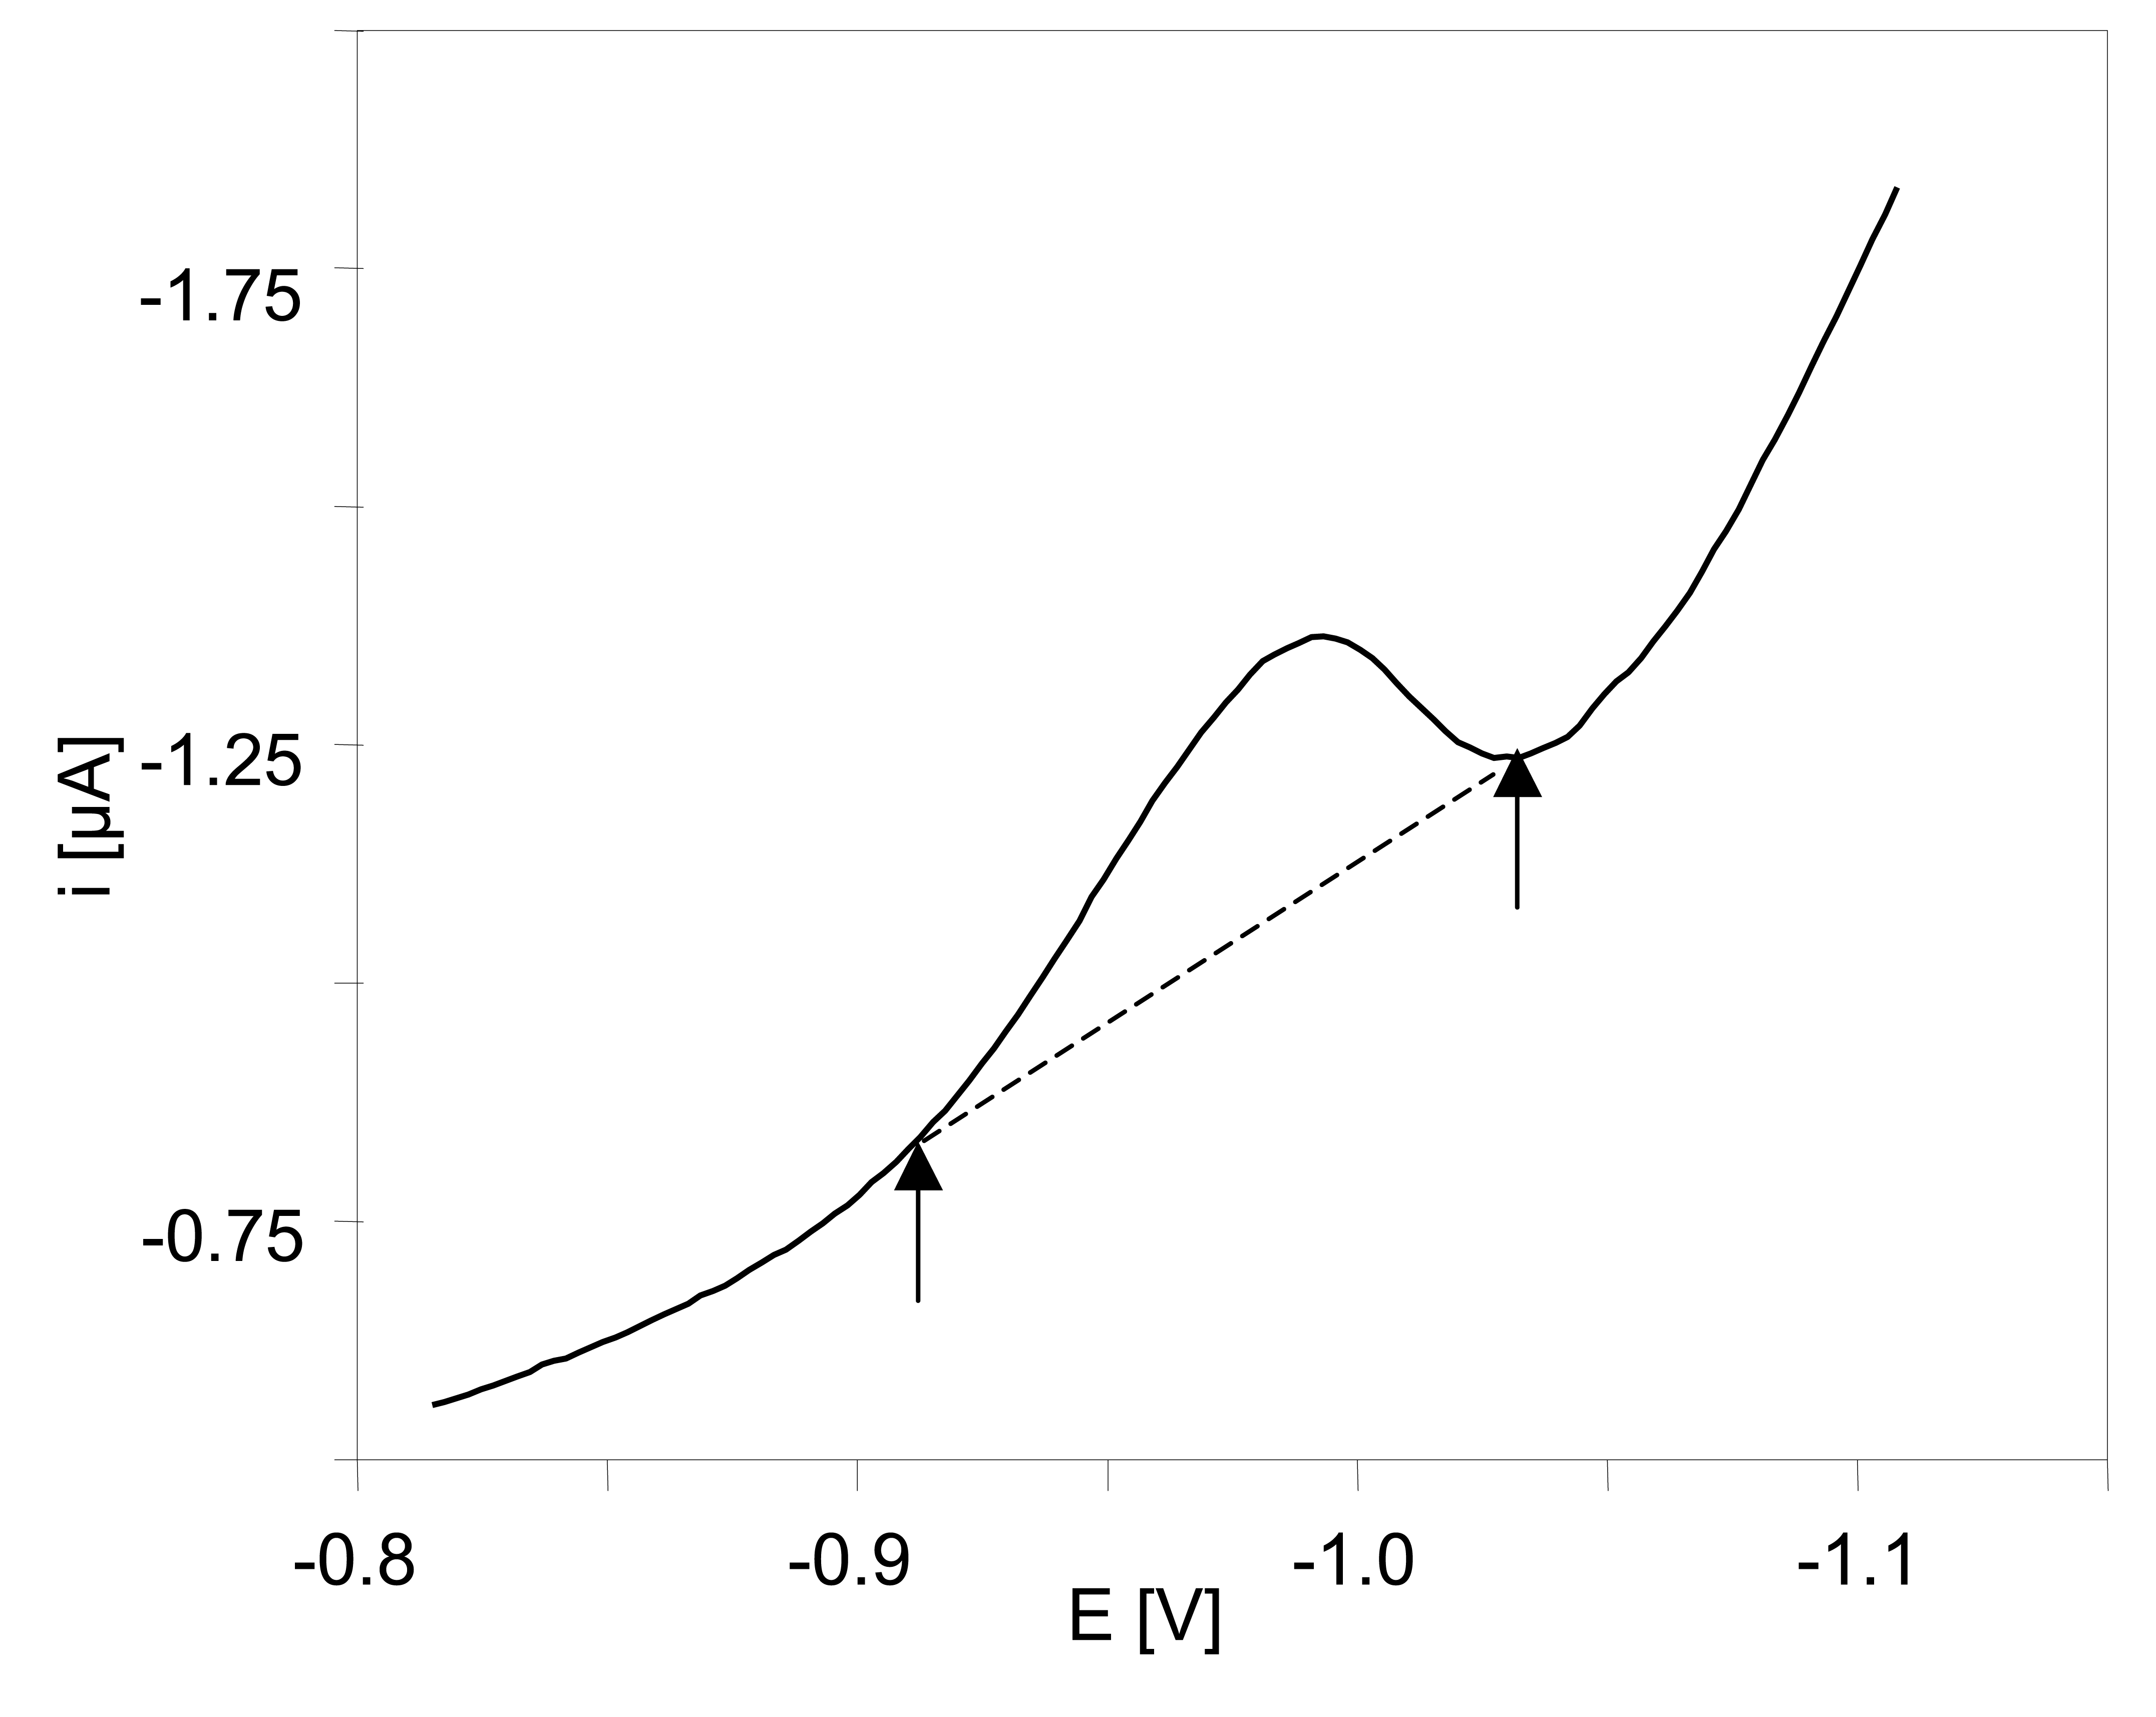
3.3. Detection of Genetic Modification in Genomic DNA Non-amplified by PCR
3.4. Conclusions
Acknowledgments
References
- Hupfer, Ch.; Hotzel, H.; Sachse, K.; Engel, K.H. Detection of genetically modified insect-resistant Bt maize by means of polymerase chain reaction. Zeitschrift für Lebensmitteluntersuchung und –Forschung 1997, 205, 442–445. [Google Scholar]
- Straub, J. A.; Hertel, Ch.; Hammes, W.P. Limits of a PCR-based detection method for genetically modified soya beans in wheat bread production. Z Lebensm Unters Forsch A. 1999, 208, 77–82. [Google Scholar]
- Minunni, M.; Mascini, M.; Cozzani, I. Screening methodologies for genetic modified organisms (GMOs). Anal. Lett. 2000, 33(15), 3093–3125. [Google Scholar]
- Holst-Jensen, A.; Rønning, S.B.; Løvseth, A. PCR technology for screening and quantification of genetically modified organisms (GMOs). Anal. Bioanal. Chem. 2003, 375, 985–993. [Google Scholar]
- Lau, L-T.; Collins, R.A.; Yiu, S.-H.; Xing, J.; Yu, A.C.H. Detection and characterization of recombinant DNA in Roundup Ready® soybean insert. Food Control 2004, 15, 471–478. [Google Scholar]
- Forte, V.T.; Di Pinto, A.; Martina, C.; Tantillo, G.M.; Grasso, G.; Schena, F.P. A general multiplex-PCR assay for the general detection of genetically modified soya and maize. Food Control 2005, 16, 535–539. [Google Scholar]
- Vaϊtilingom, M.; Pijnenburg, H.; Gendre, F.; Bringon, P. Real-time quantitative PCR detection of genetically modified maximizer maize and Roundup Ready soybean in some representative foods. J. Agric. Food Chem. 1999, 47, 5261–5266. [Google Scholar]
- Berdal, K.G.; Holst-Jansen, A. Roundup Ready® soybean event-specific real time quatitative PCR assay and estimation of the practical detection and quantification limits in GMO analyses. Eur Food Res Technol. 2001, 213, 432–438. [Google Scholar]
- Moriuchi, R.; Monma, K.; Sagi, N.; Uno, N.; Kamata, K. Applicability of quantitative PCR to soy processed foods containing Roundup Ready soy. Food Control 2007, 18, 191–195. [Google Scholar]
- Campás i Homs, M. DNA sensors. Anal.Lett. 2002, 35(12), 1875–1894. [Google Scholar]
- Disulescu, V.C.; Paquim, A-M.Ch.; Brett, A.M.O. Electrochemical DNA sensors for detection of DNA damage. Sensors 2005, 5, 377–393. [Google Scholar]
- Paleček, E.; Fojta, M. Detecting DNA hybridization and damage. Anal. Chem. 2001, 73, 74A–83A. [Google Scholar]
- Paleček, E. Past, present and future of nucleic acids electrochemistry. Talanta 2002, 56, 809–819. [Google Scholar]
- Paleček, E.; Jelen, F. Electrochemistry of nucleic acids and development of DNA sensors. Critica Rev. Anal. Chem 2002, 32(3), 261–270. [Google Scholar]
- Niu, S.; Li, F.; Zhang, S.; Wang, L.; Li, X.; Wang, S. Studies of interaction mechanism of 1,10-Phenanthroline cobalt (II) complex with DNA and preparation of electrochemical DNA biosensor. Sensors 2006, 6, 1234–1244. [Google Scholar]
- Millan, K.M.; Sarullo, A.; Mikkelsen, S.R. Voltametric DNA biosensor for cystic- fibrosis based on modified carbon-paste electrode. Anal. Chem. 1994, 66, 2943–2948. [Google Scholar]
- Takenaka, S.; Yamashita, K.; Takagi, M.; Uto, Y.; Kondo, H. DNA sensing on a DNA probe-modified electrode using ferrocenylnaphtalene diimide as the electrochemically active ligand. Anal. Chem. 2000, 72, 1334–1341. [Google Scholar]
- Ligaj, M.; Oczkowski, T.; Jasnowska, J.; Musiał, W.G.; Filipiak, M. Electrochemical genosensors for detection of L. Monocytogenes and genetically modified components in food. Pol. J. Food Nutr. Sci. 2003, 12(53, SI2), 61–63. [Google Scholar]
- Meric, B.; Kerman, K.; Marrazza, G.; Palchetti, I.; Mascini, M.; Ozsoz, M. Disposable genosensor, a new tool for the detection of NOS-terminator, a genetic element present in GMOs. Food Control 2004, 15, 621–626. [Google Scholar]
- Ligaj, M.; Jasnowska, J.; Musiał, W.G.; Filipiak, M. Covalent attachment of single – stranded DNA to carbon paste electrode modified by activated carboxyl groups. Electochimica Acta 2006, 51, 5193–5198. [Google Scholar]
- Aoki, H.; Bühlmann, P.; Umezawa, Y. Electrochemical detection of a one-base mismatch in an oligonucleotide using ion-chennel sensors with self-assembled PNA monolayers. Electroanal 2000, 12(16), 1272–1276. [Google Scholar]
- Aoki, H.; Umezawa, Y. High sensitive ion-channel sensors for detection of oligonucleotides using PNA modified gold electrodes. Electroanal. 2002, 14(19-20), 1405–1410. [Google Scholar]
- Aoki, H.; Umezawa, Y. Trace analysis of an oligonucleotide with a specific sequence using PNA-based ion-channel sensors. Analyst 2003, 128, 681–685. [Google Scholar]
- Aoki, H.; Hasegawa, K.; Tohda, K.; Umezawa, Y. Voltammetric detection of inorganic phosphate using ion-channel sensing with self-assembled monolayers of a hydrogen bond-forming receptor. Biosens. Bioelectron. 2003, 18(2-3), 261–267. [Google Scholar]
- Umezawa, Y.; Aoki, H. Ion-channel sensors based on artificial receptors. Anal. Chem. 2004, 76, 320A–326A. [Google Scholar]
- Patolsky, F.; Lichtenstein, A.; Willner, I. Detection of single-base DNA mutataions by enzyme –amplified electronic transduction. Nature Biotech. 2001, 19, 253–257. [Google Scholar]
- Li, Ch-Z.; Liu, Y.; Luong, J.H.T. Impedance sensing of DNA binding drugs using gold substrates modified with gold nanoparticles. Anal. Chem. 2005, 77, 478–485. [Google Scholar]
- Feriotto, G.; Grdenghi, S.; Bianchi, N.; Gambari, R. Quantitation of Bt-176 maize genomic sequences by surface plasmon resonance-based biospecific interaction analysis of multiplex polymerase chain reaction (PCR). J. Agric. Food Chem. 2003, 51, 4640–4646. [Google Scholar]
- Sauerbrey, G. Verwendung von Schwingquarzen zur Wägung Dünner Schichten und zur Mikrowägung. Z. Physik 1959, 155, 206–222. [Google Scholar]
- Rodhal, M.; Kasemo, B. On the measurement of thin liquid overlayers with quartz crystal microbalance. Sensors and Actuators A 1996, 54, 448–462. [Google Scholar]
- Přibyl, J.; Hepel, M.; Halámek, J.; Skládal, P. Development of piezoelectric immunosensors for competitive and direct determination of atrazine. Sensors and Actuators B 2003, 91, 333–341. [Google Scholar]
- Tombelli, S.; Mascini, M.; Braccini, L.; Anichini, M.; Turner, A.P.F. Coupling of a DNA piezoelectric biosensor and polymerase chain reaction to detect apolipoprotein E polymorphisms. Biosens.Bioelectron. 2000, 15, 363–370. [Google Scholar]
- Minunni, M.; Tombelli, S.; Scielzi, R.; Mannelli, I.; Mascini, M.; Gaudiano, C. Detection of β-thalassemia by a DNA piezoelectric biosensor coupled with polymerase chain reaction. Anal. Chim. Acta 2003, 481, 55–64. [Google Scholar]
- Stobiecka, M.; Hepel, M.; Radecki, J. Transient conformation changes of albumin adsorbed on gold piezoelectrodes. Electrochim. Acta 2005, 50, 4873–4887. [Google Scholar]
- Minunni, M.; Tombelli, S.; Pratesi, S.; Mascini, M.; Piatti, P.; Bogani, P.; Buiatti, M.; Mascini, M. A piezoelectric affinity biosensor for genetically modified organisms (GMOs) detection. Anal. Lett. 2001, 34(6), 825–840. [Google Scholar]
- Manneli, I.; Minunni, M.; Tombelli, S.; Mascini, M. Quartz crystal microbalance (QCM) affinty biosensor for genetically modified organisms (GMOs) detection. Biosen. Bioelectron. 2003, 18, 129–140. [Google Scholar]
- Minunni, M.; Mannelli, I.; Spiriti, M.M.; Tombelli, S.; Mascini, M. Detection of highly repeated sequences in non-amplified genomic DNA by bulk acoustic wave (BAW) affinity biosensor. Anal. Chim. Acta 2004, 526, 19–25. [Google Scholar]
- Su, X.; Wu, Y.J.; Robelek, R.; Knoll, W. Surface plasmon resonance spectroscopy and quartz crystal microbalance study of streptavidin films structure effects on biotinylated DNA assembly and target DNA hybridization. Langmuir 2005, 21, 348–353. [Google Scholar]
- Su, X. Covalent DNA immobilization on polymer-shielded silver-coated quartz crystal microbalance using photobiotin-based UV irradiation. Biochem. Biophys. Res. Commun. 2002, 290, 962–966. [Google Scholar]
- Cabrita, J.F.; Abrantes, L.M.; Viana, A.S. N-Hydroxysuccinimide-terminated self-assembled monolayers on gold for biomolecules immobilization. Electrochimica Acta 2005, 50, 2117–2124. [Google Scholar]
- Rosano, C.; Arosio, P.; Bolognesi, M. The X-ray three-dimensional structure of avidin. Biomol. Engin. 1999, 16, 5–12. [Google Scholar]
- Murray, M.G.; Thompson, W.F. Rapid isolation of high molecular weight plant DNA. Nucleic Acid Research 1980, 8(19), 4321–4325. [Google Scholar]
- Imabayashi, S-I.; Iida, M.; Hobara, D.; Feng, Z.Q.; Niki, K.; Kakiuchi, T. Reductive desorption of carboxylic-acid-terminated alkanethiol monolayers from Au(111) surfaces. Journal of Electroanal. Chem. 1997, 428, 33–38. [Google Scholar]
- Radecka, H.; Szymańska, I.; Pietraszkiewicz, M.; Pietraszkiewicz, O.; Aoki, H.; Umezawa, Y. Intermolecular ion-channel sensors using gold electrodes immobilized with macrocyclic polyamines for voltammetric detection of adenine nucleotides. Chem.Anal (Warsaw) 2005, 50, 85–102. [Google Scholar]
- Neher, R.A.; Gerland, U. DNA as a programmable viscoelastic nanoelement. Biophys. J. 2005, 89, 3846–3855. [Google Scholar]
- Mannelli, I.; Minunni, M.; Tombelli, S.; Wang, R.; Spiriti, M.M.; Mascini, M. Direct Immobilisation of DNA Probes for the development of affinity biosensors. Bioelectrochem. 2005, 66, 129–138. [Google Scholar]
- Arumuganathan, K.; Earle, E.D. Nuclear DNA content of some important plant species. Plant Molecular Biology Reporter 1991, 9(3), 208–218. [Google Scholar]


- (a)
- complementary oligonucleotide (21-mer) (80 nM)
- (b)
- non-complementary oligonucleotide (22-mer) (72 nM)
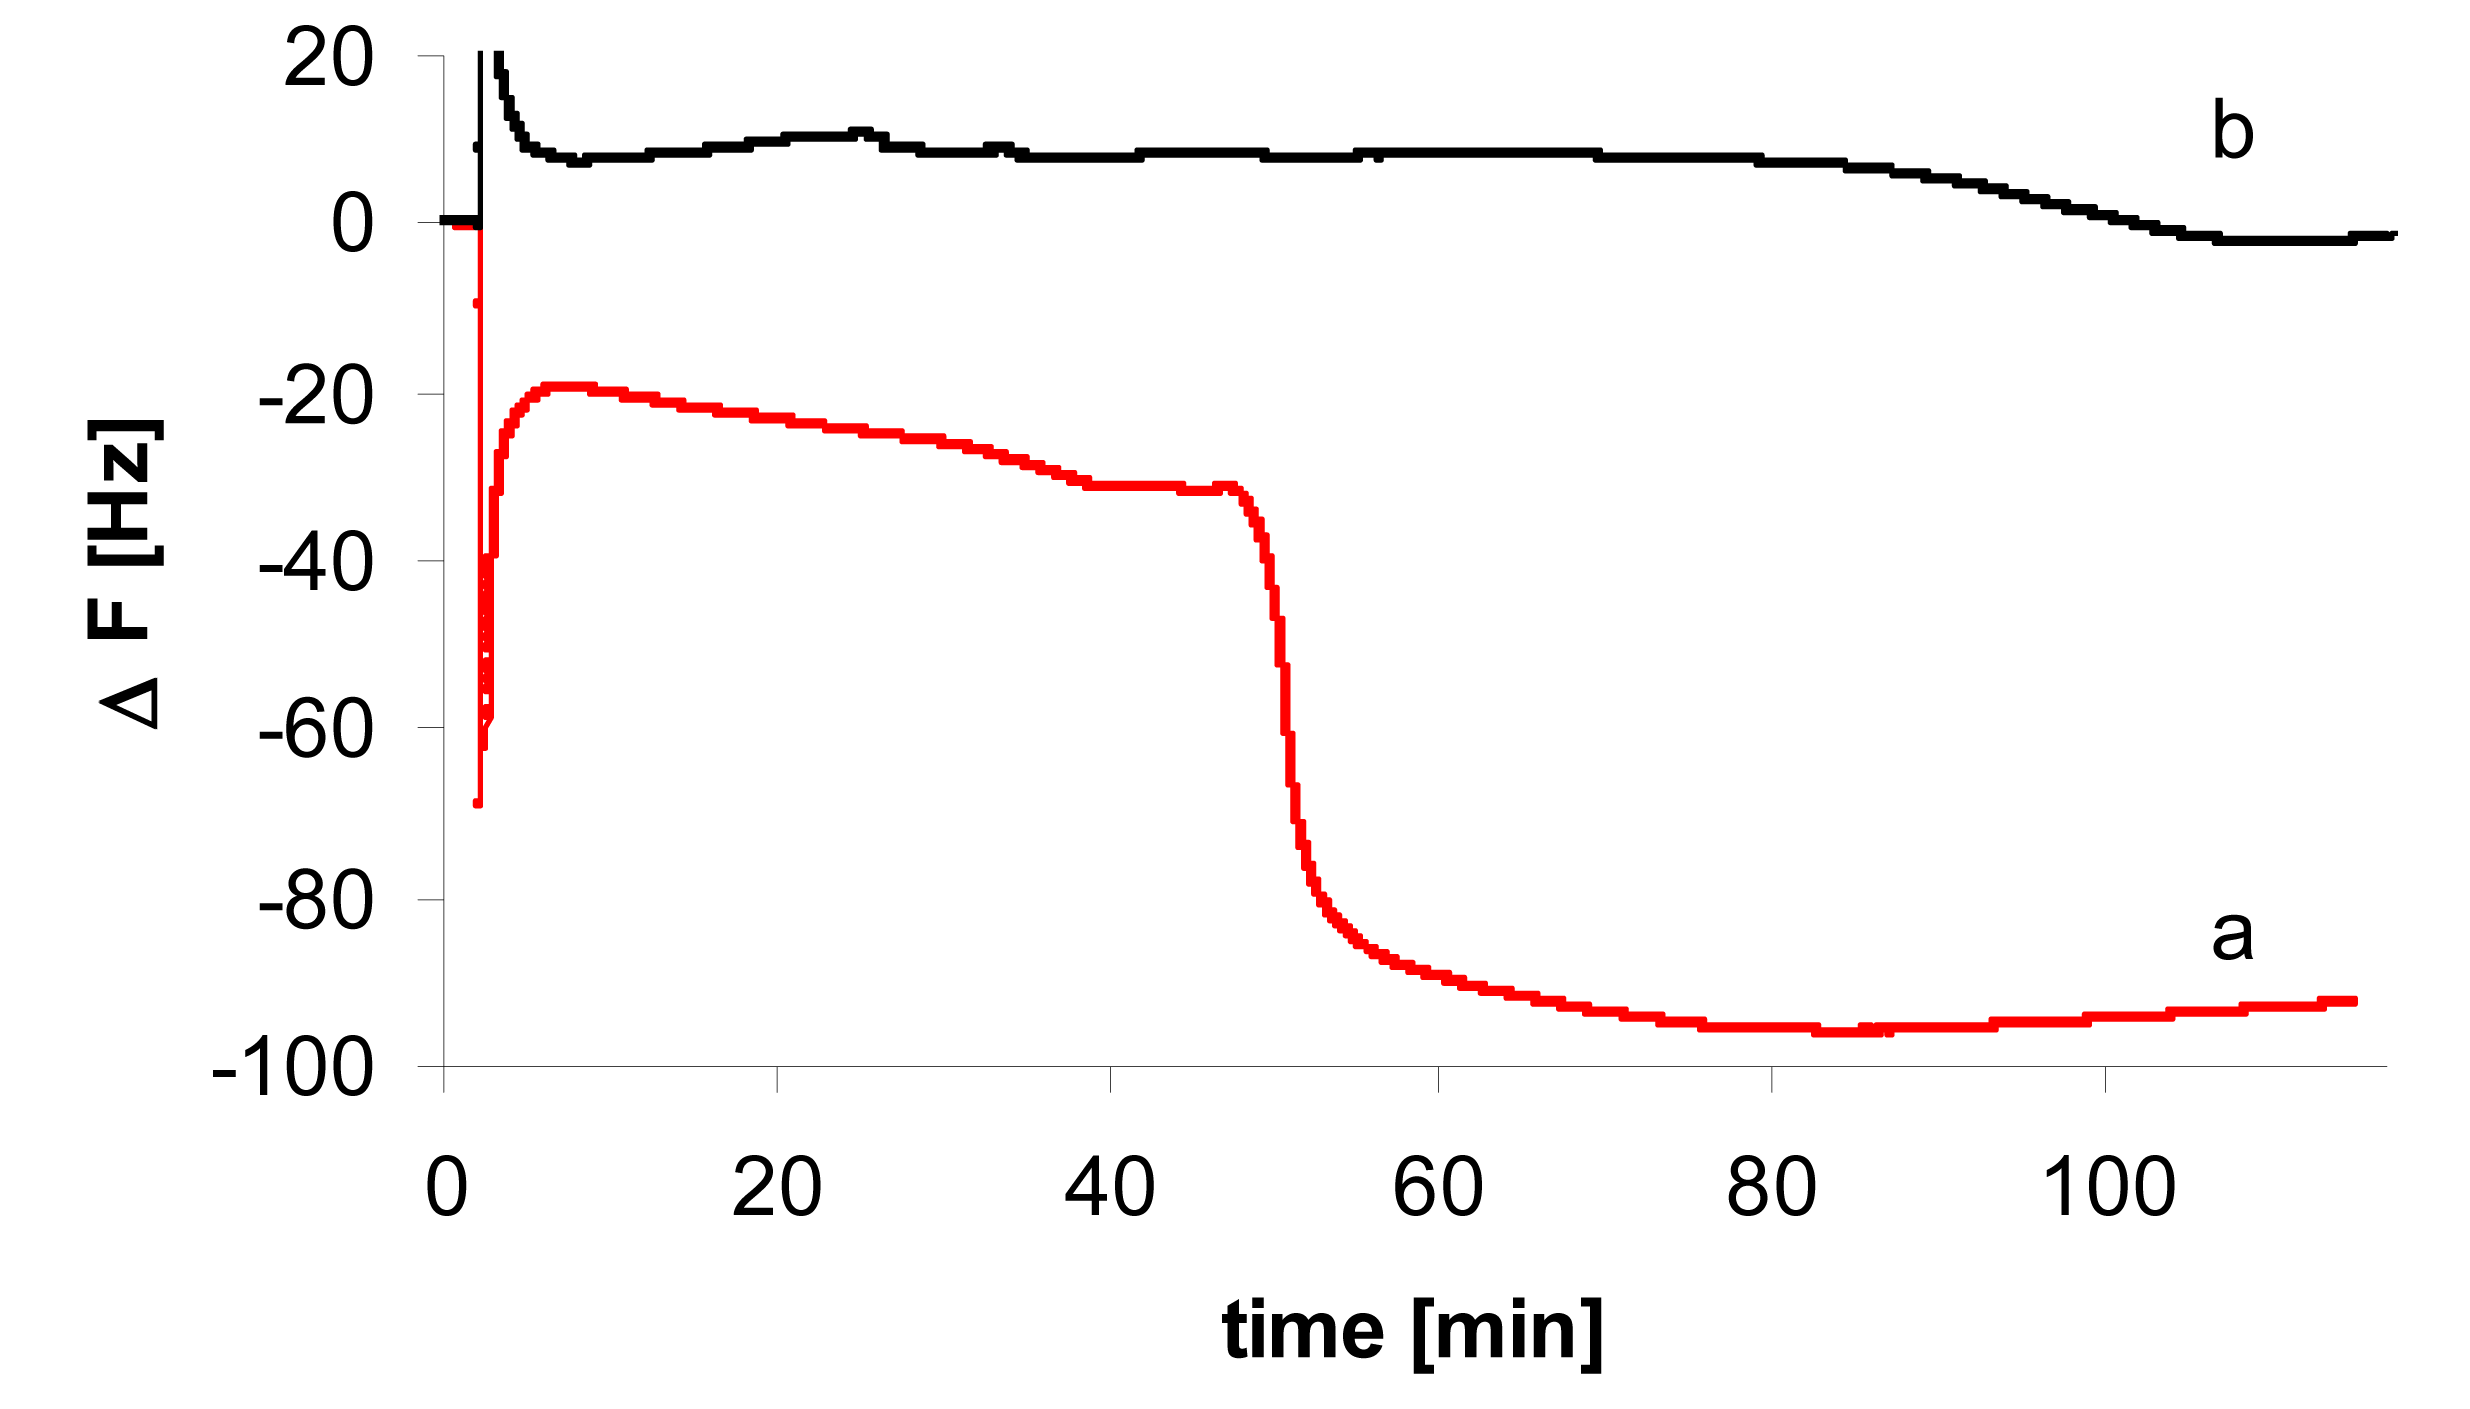
- (a)
- complementary oligonucleotide (21-mer) (80 nM)
- (b)
- non-complementary oligonucleotide (22-mer) (72 nM)

- (a)
- complementary PCR product - fragment of EPSPS gene (2.5 nM)
- (b)
- non-complementary PCR product - fragment of Adh gene (2.5 nM)
- (a)
- complementary PCR product - fragment of EPSPS gene (2.5 nM)
- (b)
- non-complementary PCR product - fragment of Adh gene (2.5 nM)


| Molecules immobilized on the QCM electrode | Δ F [Hz] | Δ m [ng] | Number of molecules × 1012on the gold electrode | Density of the molecules on the gold electrode × 1010 [molecules/mm2] |
|---|---|---|---|---|
| avidin | − 104.8 ± 7.3 | 140.5 ± 9.7 | 1.3 ± 0.1 | 6.8 ± 0.4 |
| biotinylated oligonucleotide (probe 1) | − 19.7 ± 4.8 | 26.3 ± 6.5 | 2.3 ± 0.5 | 11.7 ± 2.8 |
| 21-base pairs oligonucleotide complementary to probe 1 | − 17.2 ± 5.9 | 23.1 ± 7.9 | 2.2 ± 0.8 | 11.4 ± 3.9 |
| biotinylated oligonucleotide (probe 2) | − 19.8 ± 5.1 | 26.5 ± 6.9 | 2.4 ± 0.6 | 12.2 ± 3.1 |
| 21-base pairs oligonucleotide complementary to probe 2 | − 19.0 ± 8.4 | 25.5 ± 11.3 | 2.4 ± 1.0 | 12.3 ± 5.6 |
| A | |||
|---|---|---|---|
| No of solution | Concentration of EPSPS [nM] | Changes of frequency ΔF [Hz] | |
| 1. | 2.5 | − 88.2 ± 7.5 | |
| 2. | 2.0 | − 62.1 ± 19.7 | |
| 3. | 1.5 | − 25.2 ± 8.0 | |
| 4. | 1.0 | − 21.4 ± 7.9 | |
| B | ||||
|---|---|---|---|---|
| No of solution | Concentration of EPSPS [nM] | Concentration of Adh [nM] | Changes of frequency ΔF [Hz] | |
| 1. | 2.5 | 0.0 | − 88.2 ± 7.5 | |
| 2. | 2.0 | 0.5 | − 60.4 ± 1.0 | |
| 3. | 1.0 | 1.5 | − 15.9 ± 6.8 | |
| 4. | 0.0 | 2.5 | − 4.8 ± 1.0 | |
| Amount of genomic DNA extracted from animal feeder contained modified RR soybean in the QCM cell [μg] | Number of genom copies containing EPSPS gene in the QCM cell | ΔF [Hz] |
|---|---|---|
| 3.6 | 4.7 · 105 | 19.6 ± 2.7 |
| 4.6 | 6.0 · 105 | 33.1 ± 9.4 |
| 5.4 | 7.0 · 105 | 51.2 ± 9.9 |
| Amount of genomic DNA extracted from unmodified soybean in the QCM cell [μg] | ||
| 3.6 | - | 3.4 ± 2.5 |
| 4.6 | - | 7.5 ± 0.2 |
| 5.4 | - | 14.5 ± 7.8 |
© 2007 by MDPI ( http://www.mdpi.org). Reproduction is permitted for noncommercial purposes.
Share and Cite
Stobiecka, M.; Cieśla, J.M.; Janowska, B.; Tudek, B.; Radecka, H. Piezoelectric Sensor for Determination of Genetically Modified Soybean Roundup Ready (R) in Samples not Amplified by PCR. Sensors 2007, 7, 1462-1479. https://doi.org/10.3390/s7081462
Stobiecka M, Cieśla JM, Janowska B, Tudek B, Radecka H. Piezoelectric Sensor for Determination of Genetically Modified Soybean Roundup Ready (R) in Samples not Amplified by PCR. Sensors. 2007; 7(8):1462-1479. https://doi.org/10.3390/s7081462
Chicago/Turabian StyleStobiecka, Magdalena, Jarosław M. Cieśla, Beata Janowska, Barbara Tudek, and Hanna Radecka. 2007. "Piezoelectric Sensor for Determination of Genetically Modified Soybean Roundup Ready (R) in Samples not Amplified by PCR" Sensors 7, no. 8: 1462-1479. https://doi.org/10.3390/s7081462