Article

Formation and Characterization of Self-Assembled Phenylboronic Acid Derivative Monolayers toward Developing Monosaccaride Sensing-Interface

1
College of Pharmacy, Pusan National University, Pusan 609-735, Korea
2
SEED BioChips Inc., Chung-Buk Technopark, Oh-Chang, Chung-Buk 363-883, Korea
3
College of Nanoscience and Nanotechnology, Pusan National University, Pusan 609-735, Korea
4
Department of Molecular Science and Technology, Ajou University, Suwon, Korea
5
Chemistry Division, Kyungil University, Kyungsanbuk-do 712-701, Korea
*
Author to whom correspondence should be addressed.
Sensors 2007, 7(8), 1480-1495; https://doi.org/10.3390/s7081480
Submission received: 1 July 2007 / Accepted: 1 August 2007 / Published: 1 August 2007

Abstract

:
We designed and synthesized phenylboronic acid as a molecular recognition model system for saccharide detection. The phenylboronic acid derivatives that have boronic acid moiety are well known to interact with saccharides in aqueous solution; thus, they can be applied to a functional interface of saccharide sensing through the formation of self-assembled monolayer (SAM). In this study, self-assembled phenylboronic acid derivative monolayers were formed on Au surface and carefully characterized by atomic force microscopy (AFM), Fourier transform infrared reflection absorption spectroscopy (FTIR-RAS), surface enhanced Raman spectroscopy (SERS), and surface electrochemical measurements. The saccharide sensing application was investigated using surface plasmon resonance (SPR) spectroscopy. The phenylboronic acid monolayers showed good sensitivity of monosaccharide sensing even at the low concentration range (1.0 × 10⁻¹² M). The SPR angle shift derived from interaction between phenylboronic acid and monosaccharide was increased with increasing the alkyl spacer length of synthesized phenylboronic acid derivatives.

1. Introduction

Accomplishment of genome projects has provided us with fundamental genetic information for proteins but the in vivo functions of most genes have still remained obscure. To understand their real function, it is essential to identify the process of their post-translational modifications. Among the post-translational modifications of proteins, glycosylation is the most common event in both eukaryotes and prokaryotes. In particular, the change of the carbohydrate moiety through glycosylation can affect the physico-chemical and biological properties of a glycoprotein and is also related to features of some fetal diseases such as cancer, diabetes, and heart disease [1-3]. Thus, the development of a sensitive, reliable, and robust analytical method for the change of carbohydrate moiety is important in the pharmaceutical industry.
In principle, a molecular recognition system generates a signal through selective interaction between a receptor and target molecules. To apply this molecular recognition principle to the development of new and simple saccharide detection method, it is important to construct a molecular recognition system with high sensitivity and selectivity for saccharide and to couple it with an efficient signal amplification method. To this end, the self-assembled phenylboronic acid monolayers and surface plasmon resonance (SPR) were utilized in the present study.
Among the artificial receptor molecules for saccharide, phenylboronic acid derivatives that have a boronic acid moiety are well-known to form complexes with diol of saccharide in basic aqueous media [4-8]. Ludwig et al. detected saccharides using phenylboronic acid at the air-water-interface [9-11]. Therefore they can be used as a suitable recognition molecule to construct a molecular recognition system for saccharide [12-14]. Moreover, to optimise the sensing ability of the molecular recognition system, self-assembled monolayer (SAM) that provides a simple route to construct a well-ordered molecular interface can be applied to the organization of recognition-functional molecules [15, 16].
As a signal amplification method, SPR is an electron excitation phenomenon at the interface between a metal and a dielectric material that has attracted considerable attention. This technique is very sensitive to the optical properties of the medium close to a metal surface. Therefore, it has been recognized as a simple and useful method for interfacial studies and shows great potential for investigation of various biomolecular interactions [17-19]. In particular, because SPR is a powerful method for direct sensitive detection of molecular interaction without labelling, a large number of biosensors are based on the SPR technique [20, 21].
Our research purpose is the fundamental development of new and simple saccharide detection method based on molecular recognition and SPR. For this purpose, we synthesized phenylboronic acid derivatives with different alkyl spacer length as the recognition molecules for saccharide and applied them to construct a molecular recognition interface through SAM formation. Phenylboronic acid SAMs were characterized by atomic force microscopy (AFM), Fourier transform infrared reflection absorption spectroscopy (FTIR-RAS), surface enhanced Raman spectroscopy (SERS), and cyclic voltammetry (CV). In addition, the application of the molecular recognition system for saccharide detection was investigated by SPR method.

2. Experimental

2.1 Dithiobis(glycolylamino-m-phenylboronic acid) (1)

Phenylboronic acid derivatives were synthesized according to a previously reported method as follows (Fig. 1 (a)) [15].
For the synthesis of dithiobis(glycolylamino-m-phenylboronic acid) (1), an aqueous solution of 3-aminophenylboric acid was dissolved in 3-aminophenylboric acid hemisulfate (930 mg, 5.0 mmol) in water (20 mL). The pH of the solution was adjusted with 0.1 N NaOH and then the solution was cooled to 4 □ in an ice bath. A separate aqueous solution of dithiobisglycolic acid was prepared by dissolving 40% aqueous dithiobisglycolic acid solution (910 mg, 2.0 mmol) in water (10 mL), adjusting the pH of the solution with 0.1 N NaOH, and then cooling to 4□ in an ice bath. 1-Ethyl-3-(3-dimethylaminopropyl) carbodiimide monohydrochloride (EDC) (90 mg, 5.0 mmol) was added to the aminophenylboric acid solution, and then cooled at 0□ for 20 min before being slowly added dropwise to a solution of dithiobisglycolic acid. The reaction mixture was stirred for 2 hs in an ice bath and then stored in a refrigerator overnight. White precipitate was collected by filtration and dried at 80□ under a vacuum. The crude product was recrystallized from methanol-water to yield a crystalline product (655 mg, yield 78%; after vacuum drying. The product was characterized by 1H and 13C NMR (400 MHz and 100 MHz, CD3OD, Bruker Co., USA), FTIR (Galaxy 7020A, Mattson Instruments Inc., USA), and EA (EA1110 and EA1108, Fisons, USA). 1H NMR (400 MHz, CD3OD) peaks of 1 showed at δ 7.86 (bs, 0.41 H), 7.79 (bs, 0.59 H), 7.66 (bd, 0.41 H), 7.64 (bd, 0.59 H), 7.50 (bd, 0.41 H), 7.33 (m, 1.59 H), and δ 3.7 (s, 2 H), due to two conformers (41:59 ratio calculated by deconvolution of 7.92-7.72 ppm) formed by slow rotation of an amide bond. 13C NMR (100 MHz, CD3OD) peaks of 1 showed at δ = 169.8, 139.0, 138.9, 131.3, 130.8, 129.4, 129.2, 127.0, 126.4, 123.6, 122.8, and 44.6. Five pairs of aromatic carbon absorptions were observed due to the two conformers formed by the amide bond, and the ipso carbon to boron atom was not noticed due to the coupling and broadening by 11B of boronic acid. The IR spectra of 1 showed intense bands at 3386 cm−1 ν(O-H), 3301 cm−1 ν(N-H), 3063 cm−1 νarom(C-H), 2950 cm−1 νas(CH2), 2853 cm−1 νs(CH2), 1664 cm−1 ν(C=O) amide I, 1583 cm−1 λ(N-H) amide II, 1608 cm−1 ν(C=C) ring, 1535 cm−1 1,3-disubstituted phenyl, and 1426 cm−1 ν(C-N). Elemental analysis of 1 was calculated for C16H18O6N2S2B2: C 45.75, H 4.32, and N 6.67 and found for C 45.91, H 4.28, and N 6.68.

2.2 Dithiobis(3-propionylamino-m-phenylboronic acid) (2)

Dithiobis(3-propionylamino-m-phenylboronic acid) (2) was synthesized by the same procedure as above; an aqueous solution of 3,3′-dithiodipropionic acid was prepared by dissolving 3,3′-dithiodipropionic acid solution (421 mg, 2.0 mmol) in water (20 mL). A crystalline solid (632 mg, yield 71%) was obtained from methanol-water after drying under a high vacuum. 1H NMR (400 MHz, CD3OD) peaks of 2 showed at δ 7.81 (bs, 0.51 H), 7.75 (bs, 0.49 H), 7.61 (bd, 0.51 H), 7.59 (bd, 0.49 H), 7.47 (bd, 0.51 H), 7.28 (m, 1.49 H), δ 3.04 (t, J 7.0 Hz, 2 H), and 2.80 (t, J 7.0 Hz, 2 H) due to two conformers (49:51 ratio calculated by deconvolution of 7.68-7.88 ppm) formed by slow rotation of the amide bond. 13C NMR (100 MHz, CD3OD) peaks of 2 appeared at δ = 172.3, 139.2, 139.0, 131.0, 130.5, 129.3, 129.1, 127.1, 126.4, 123.7, 122.8, 37.5, and 35.1. IR spectra of 2 showed intense bands at 3414 cm−1 ν(O-H), 3305 cm−1 ν(N-H), 3043 cm−1 νarom(C-H), 2965 cm−1 νas(CH2), 2940 cm−1 νas(CH2), 2852 cm−1 νs(CH2), 1662 cm−1 ν(C=O) amide I, 1542 cm−1 δ(N-H) amide II, 1534 cm−1 1,3-disubstituted phenyl, and 1412 cm−1 ν(C-N). Elemental analysis of 2 was conducted for C18H22O6N2S2B2: C 48.24, H 4.95, and N 6.25 and found for C 48.24, H 4.91, and N 6.28.

2.3 Dithiobis(4-butyrylamino-m-phenylboronic acid) (3)

Dithiobis(4-butyrylamino-m-phenylboronic acid) (3) was also prepared by the same synthetic procedure as above; an aqueous solution of 4,4′-dithiodibutyric acid was prepared by dissolving 4,4′-dithiodibutyric acid solution (477 mg, 2.0 mmol) in water (30 mL). A crystalline solid (380 mg, yield 40%) was crystallized from methanol-water after drying under a high vacuum. 1H NMR (400 MHz, CD3OD) peaks of 3 appeared at ′ 7.80 (bs, 0.41 H), 7.75 (bs, 0.59 H), 7.61 (bd, 0.41 H), 7.59 (bd, 0.59 H), 7.47 (bd, 0.41 H), 7.28 (m, 1.59 H), 2.78 (t, J 7.1 Hz, 2 H), 2.49 (t, J 7.1 Hz, 2 H), and 2.08 (quint, J 7.1 Hz, 2 H) due to two conformers (49:51 ratio calculated by deconvolution of 7.68-7.88 ppm) formed by slow rotation of the amide bond. 13C NMR (100 MHz, CD3OD) peaks of 3 appeared at ′ = 173.8, 139.3, 139.1, 130.9, 130.4, 129.3, 129.1, 127.1, 126.4, 123.7, 122.8, 39.0, 36.4, and 26.3. IR spectra of 3 showed intense bands at 3415 cm−1 ν(O-H), 3299 cm−1 ν(N-H), 3063 cm−1 νarom(C-H), 2963 cm−1 νas(CH2), 2920 cm−1 νas(CH2), 2852 cm−1 νs(CH2), 1657 cm−1 ν(C=O) amide I, 1542 cm−1 ′(N-H) amide II, 1538 cm−1 1,3-disubstituted phenyl, and 1427 cm−1 ν(C-N). Elemental analysis of 3 was performed for C20H26O6N2S2B2: C 50.45, H 5.50, and N 5.88 and found for C 50.45, H 5.61, and N 5.62.

2.4 General methods

A microscope cover glass (Matsunami, Japan) was used for the sensor chip substrate. Au film (about 50 nm thickness) was deposited on the cover glass by the sputter coating system (E5000, Polaron Co., U.K.) under conditions of 2.0 × 10⁻² mbar and 20 mA for 180 s. The Au chips were cleaned in piranha solution (30% H2O2: concentrated H2SO4 = 1:3, v/v) for 15 s and carefully rinsed with Milli-Q grade water. The Au chips were then dried in a nitrogen stream and placed in a vacuum evaporator.
The SAMs of the phenylboronic acids were prepared by immersing the Au chips into phenylboronic acid solutions for 12 h [22]. The concentration of phenylboronic acids solutions was 1.0 mM in a 9:1 (v/v) mixture of THF and methanol. The immobilization process was monitored by SPR spectroscopy. After the immobilization process, the sensor chip was rinsed with methanol and then dried under N2 stream.
Phenylboronic acid monolayers were characterized by FTIR-RAS (Magma-IR TM 550, Nicolet, USA), AFM (SPM-LS, Park Scientific Instruments, USA), SERS and CV (BAS 100B, Bioanalytical Systems Inc., USA). The FTIR-RAS spectra were measured with 2 cm−1 resolution. The glazing angle was maintained at 80° and a p-polarized IR beam was used as the light source. AFM images were collected by the contact mode. The silicon nitride cantilevers had a nominal spring constant of about 0.067 N/m. The scanning parameters were adjusted to provide clear images, revealing the affects of SAM on the deposited gold surface. For electrochemical measurements, Au, Pt, and Ag/AgCl were used as the working, counter, and reference electrodes, respectively. The CV measurements for the phenylboronic acid derivatives modified electrodes were performed in 0.1 M KCl with 1.0 mM K3[Fe(CN)6] and the scan rate was 20 mV/s. To calculate the real area of the electrode, second CV measurements for the Au electrode were carried out in 0.5 M H2SO4 with a scan rate of 200 mV/s. The electrochemical reductive desorption of phenylboronic acids from the electrode was performed in 0.5 M KOH solution by scanning from 0 to -1.2 V at a scan rate of 100 mV/s.
For SERS measurements, Ag electrodes polished with 0.3 mm Al2O3 powder were used as the working electrodes. The surface of the electrode was roughened by an oxidation and reduction cycle to make the surfaces active for SERS measurements. The oxidation and reduction cycle was performed by scanning between -0.6 and 0.6 V for silver in 0.1 M KCl aqueous solution under N2 without laser illumination. SERS spectra were collected using a triple monochromator coupled with a blue intensified the CCD array detector (Triplemate 1877, Spex Industries, Edison, NJ, USA). The excitation source was 488 nm line of an Ar+ laser (INNOVA 70-5, Coherent Co., Santa Clara, CA, USA) with 10 mW at the sample. The angle of the laser excitation source was about 45° with respect to the surface normal, and Raman scattered light was collected parallel to the surface normal.
SPR spectroscopic measurements were performed by a homemade SPR system based on the traditional Kretschmann configuration [21, 23]. A schematic diagram of the SPR system and a sensor chip configuration is shown in Fig. 1 (b) and (c). LED (λmax = 650 nm) was used as the light source. A diffusion layer was applied to ensure light uniformity and a pinhole (ϕ = 200 μm) was adapted to transform the LED light into a point light source. The LED light was passed through a collimating lens system (Suruga Seiki Co. Japan) to make a parallel beam and compensated for chromatic aberration by passing it through a meniscus lens. The parallel beam was focused to a point on a hemisphere prism using an achromatic lens. Before entering the prism, the incident beam was polarized to the transversal magnetic (TM) mode that was available to create the SPR. The incident angle range was maintained constantly at 7°. The reflected beam from the prism was detected by CCD (ILX5110, Sony Co., Japan). The signal from each pixel of the CCD was converted through a signal process board (Spectra View 2000, K-MAC, Korea) and was interfaced with a computer. The angle resolution of the SPR system, as determined by the number of pixels and incident angle range, was 0.0034° for each pixel.
Molecular interaction between the phenylboronic acid monolayers and the monosaccharides was measured by the batch method in a Teflon chamber with a small reaction volume (31.0 μl). SPR angle shifts induced by the interaction between the phenylboronic acid monolayers and the monosaccharides were measured for four kinds of monosaccharides (glucose, fructose, galactose, and mannose). The measured concentration of each monosaccharide solution ranged from 1.0 × 10⁻¹² M to 1.0 × 10⁻⁴ M (0.1 M phosphate buffer, pH 7.4). The results were averaged after measurement and uniformly smoothed by adjacent averaging. The results from the experiment to investigate the interaction between monosaccharides and phenylboronic acid monolayers exhibited a relationship between monosaccharide concentration and relative SPR angle shifts (log(θ/θ0)), where θ is the shifted SPR angle in each sample solution and θ0 is the SPR angle in buffer solution.

3. Results and Discussion

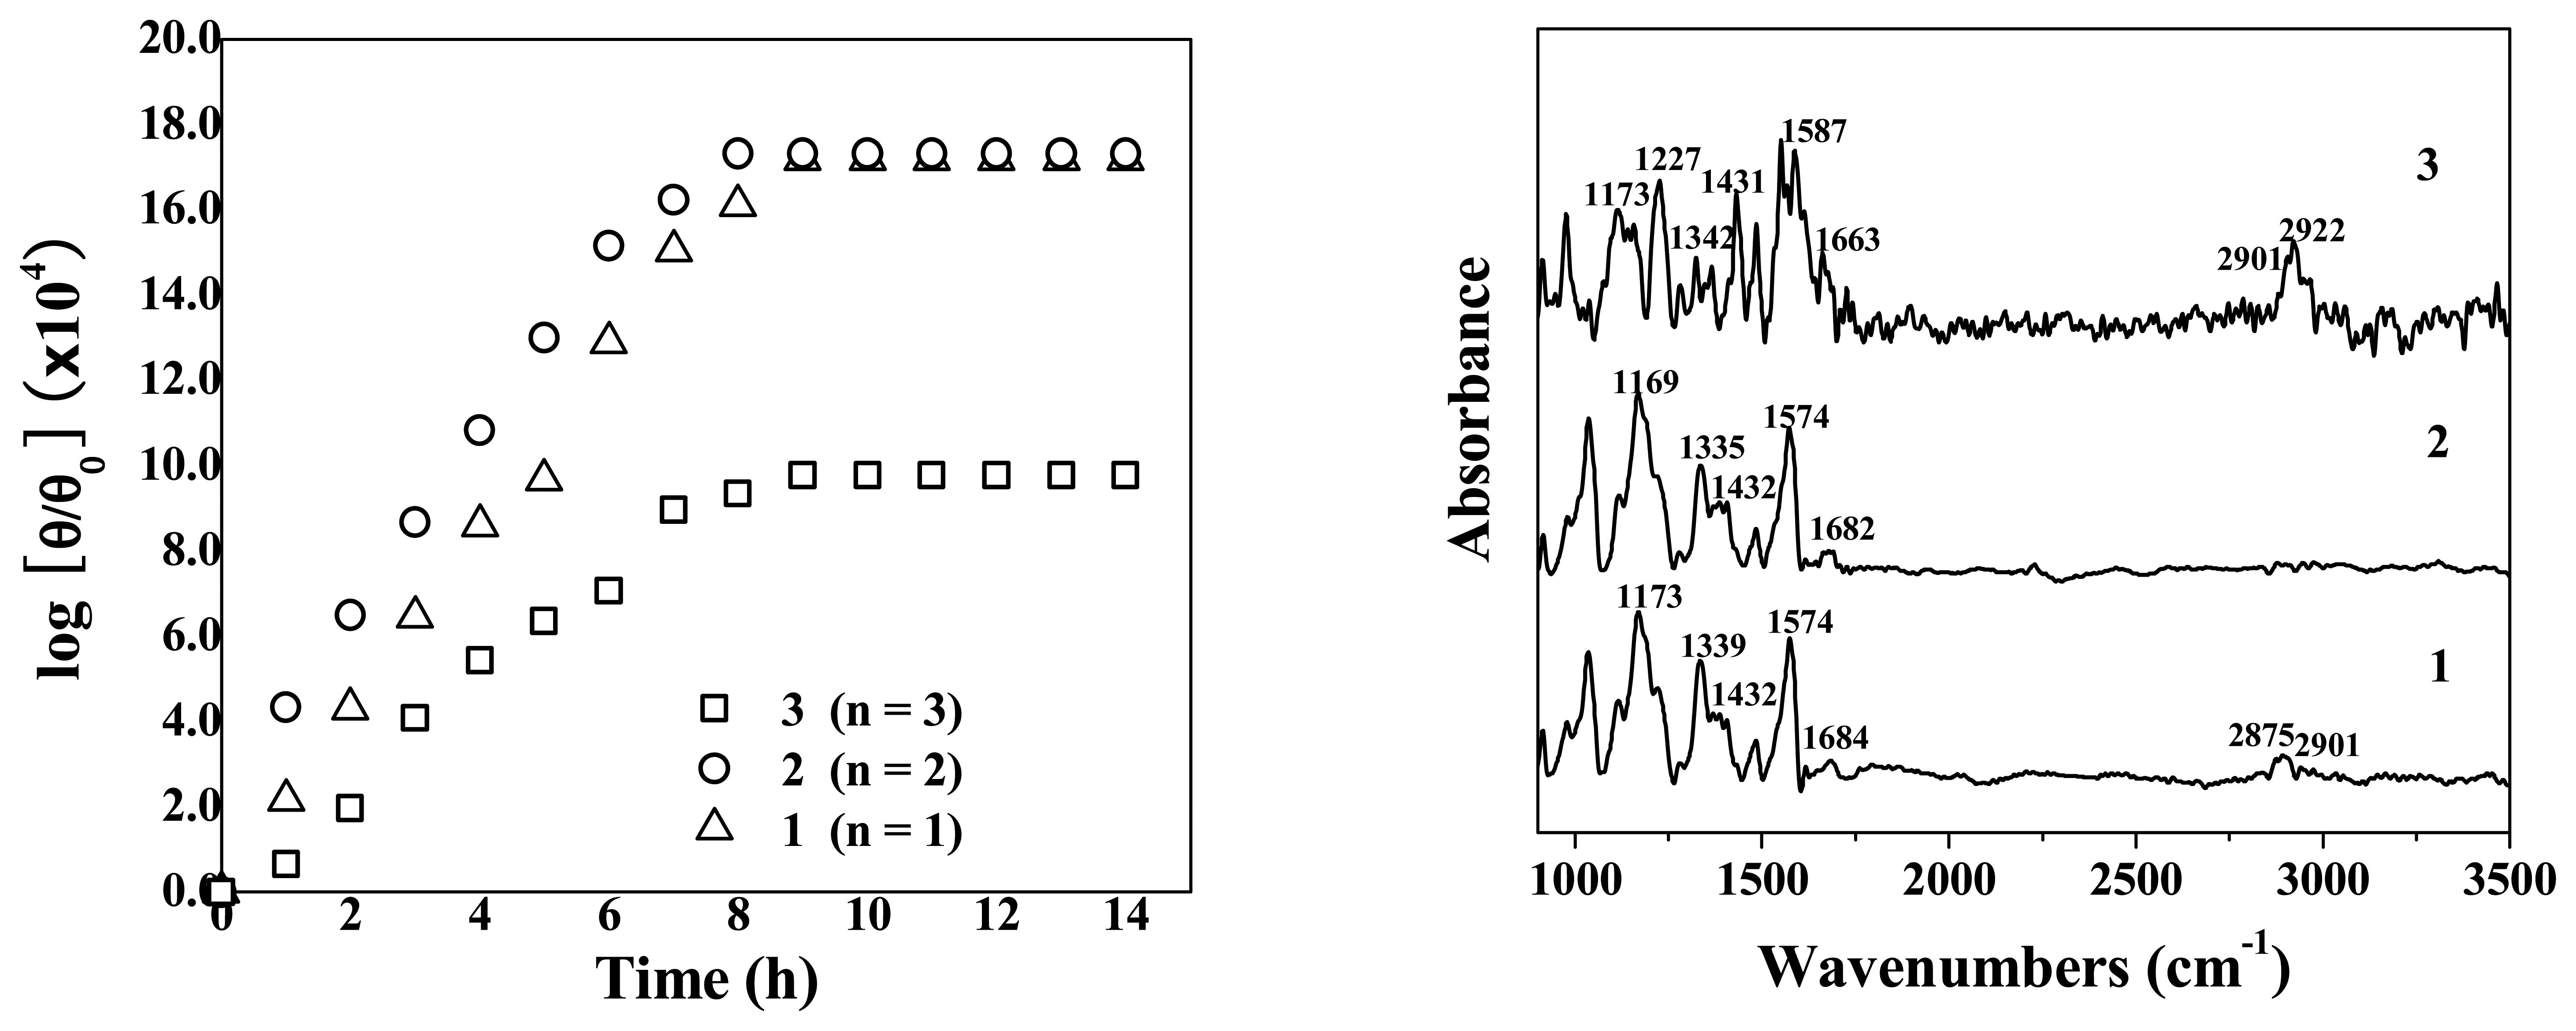
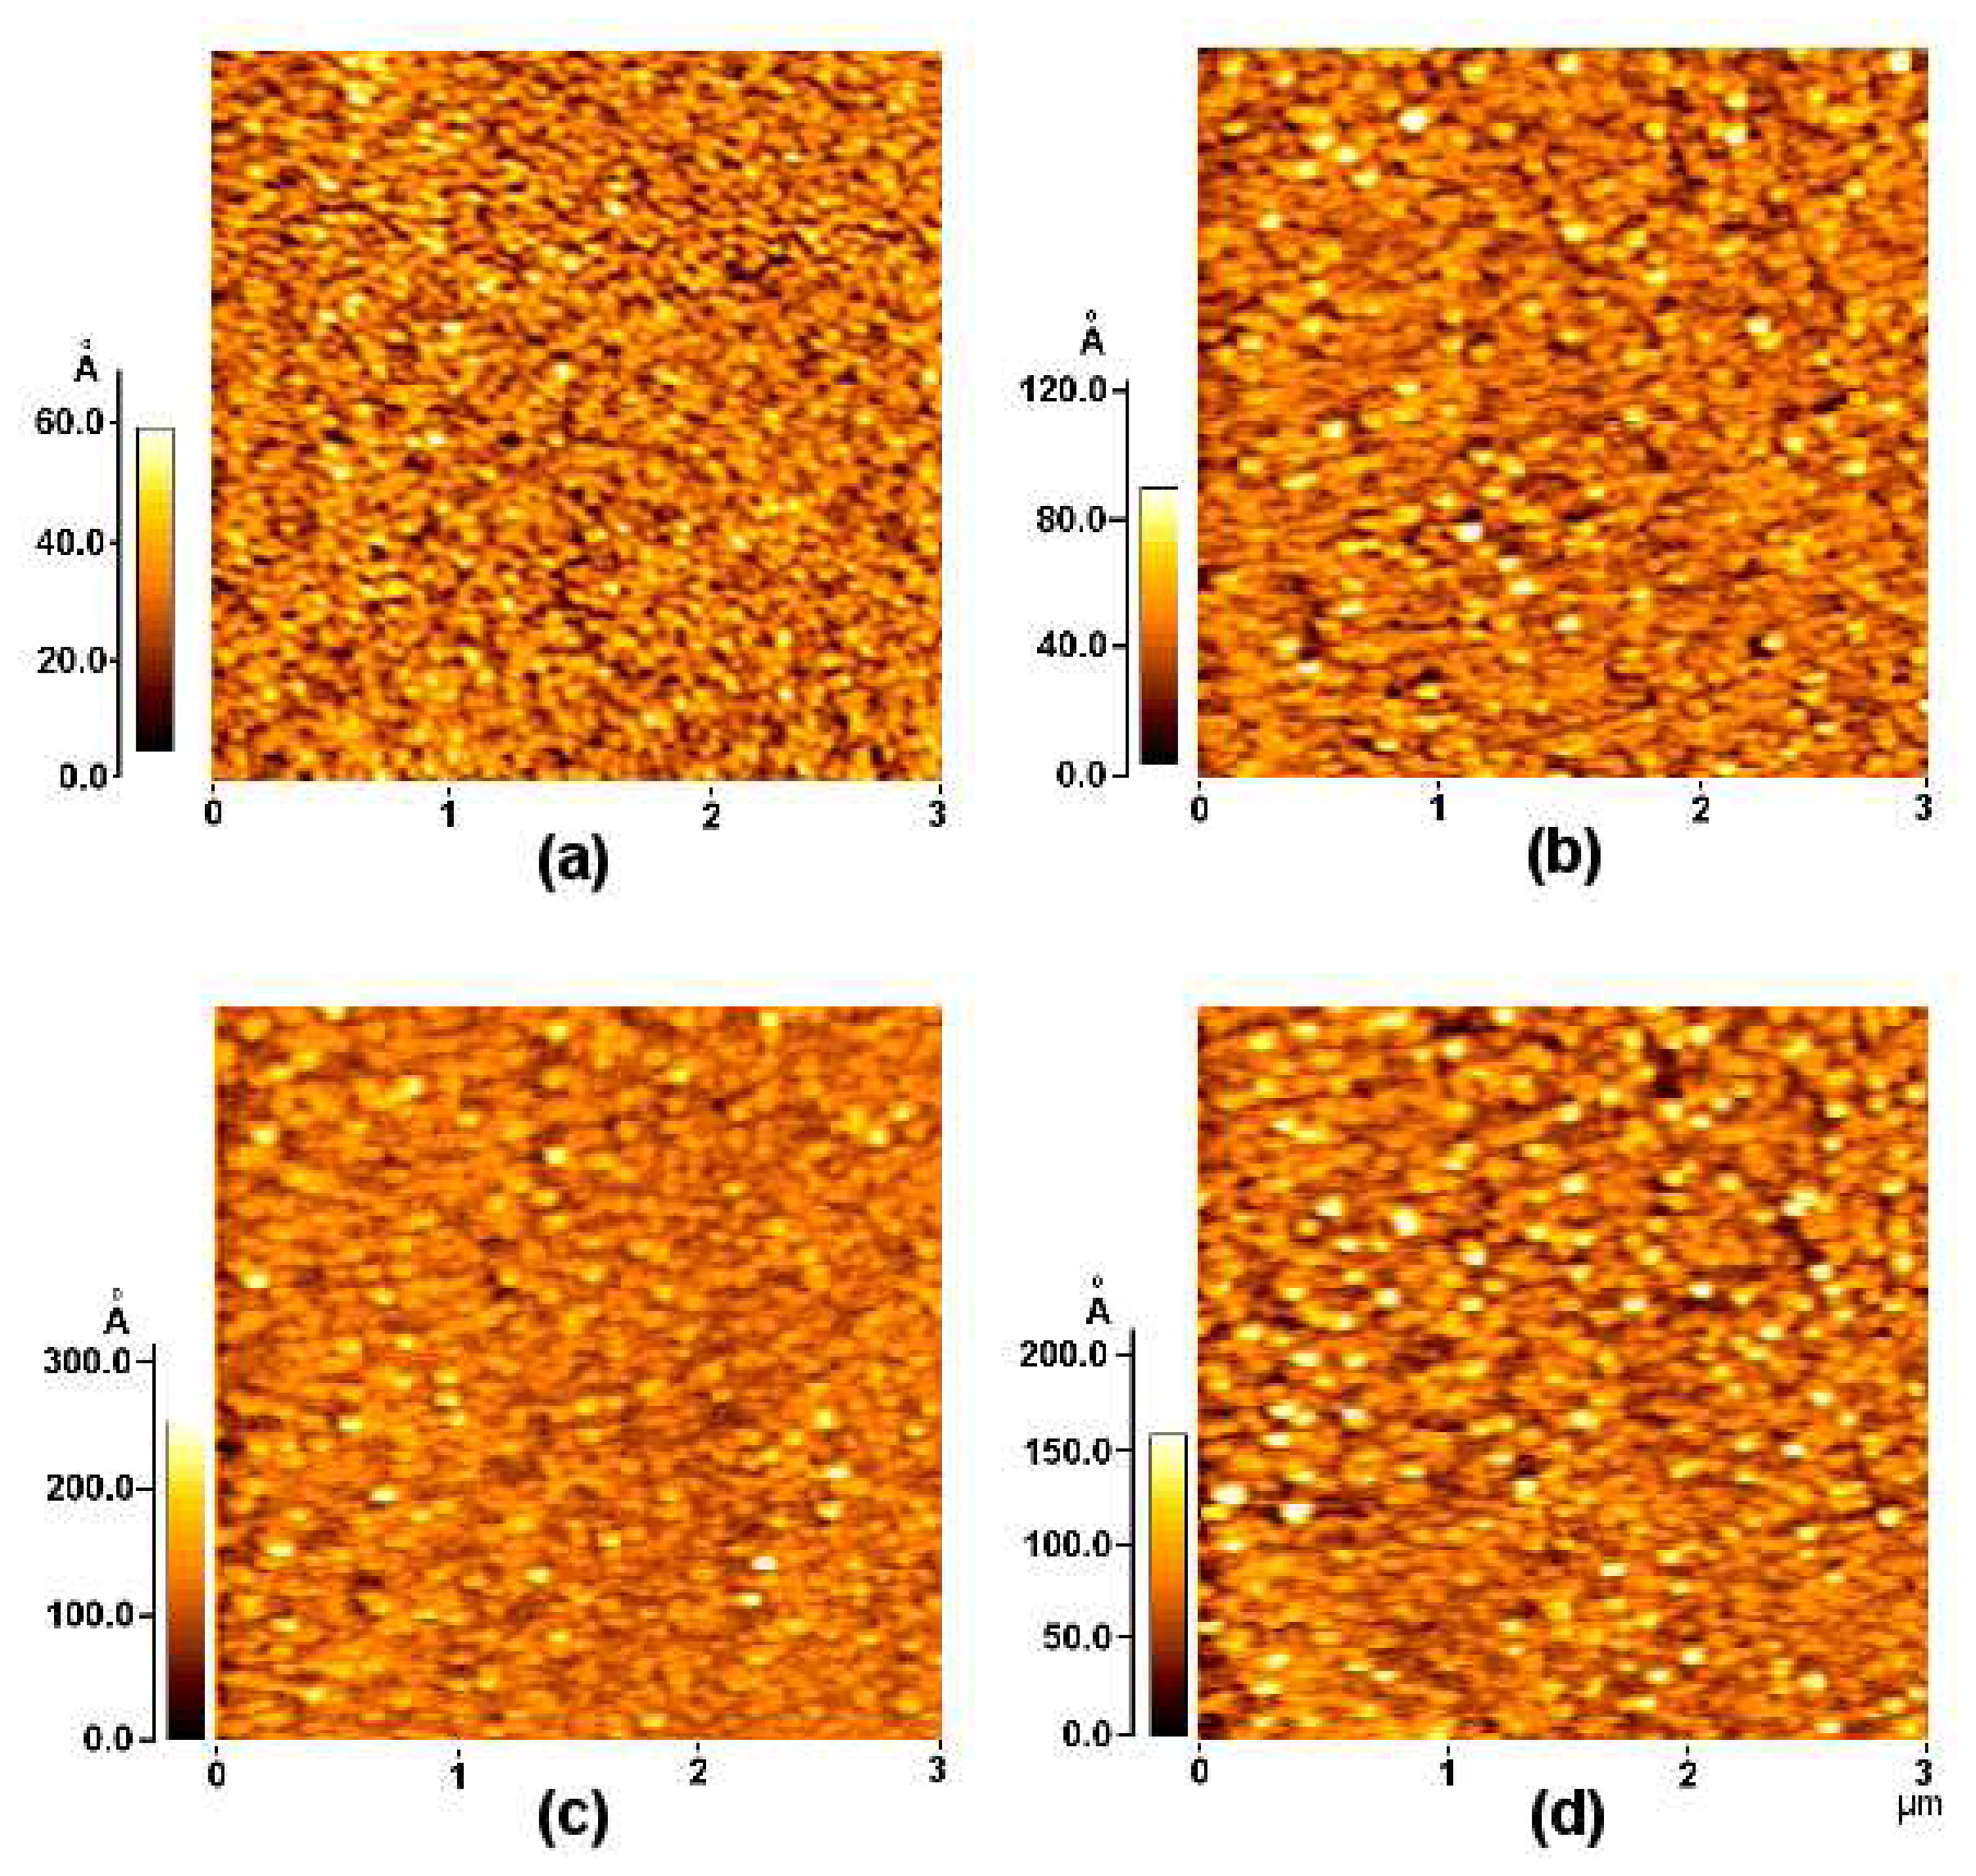
3.1 Characterization of phenylboronic acid monolayers

The immobilization process of synthesized phenylboronic acids was investigated by SPR. In the immobilization process of phenylboronic acids, SPR angle shifts reflect the change of dielectric constant induced by formation of an organic monolayer on the metal surface. As the number of immobilized molecules increased, SPR angle shifts gradually increased and became saturated at inner 10 h in all case (Fig. 2 (a)). SPR angle shifts (Δθ) caused by the immobilization of phenylboronic acids were 0.32° (1, 2) and 0.18° (3), respectively. Based on the result of surface electrochemical measurements that will be discussed later, 3 SAM showed the highest surface coverage. This means that 3 SAM has a larger amount of immobilized molecules than other phenylboronic acid SAM on the Au surface; at the same time it has the structure most perpendicular to the Au surface among the three phenylboronic acid SAM. In case of 3 SAM, although the number of immobilized molecules is the largest, the SPR angle shift due to the immobilization of 3 is smaller than that of other phenylboronic acid SAM. This may be caused by 3 SAM which has a well-standing structure and its benzene ring is far away from the Au surface. On the other hand, 1 and 2 SAM have a more declined structure on the Au surface. Accordingly, their benzene ring moiety is localized closer to the Au surface than that of 3 SAM. Thus, in case of 1 and 2, it was suspected that the SPR angle shift was amplified due to the proximity of the benzene ring to the Au surface.
Many strong and clear stretching modes appeared in the FTIR-RAS spectra of the phenylboronic acid monolayers. These stretching modes reflect the arrangement of phenylboronic acid monolayers on the Au surface (Fig. 2 (b)). As shown in Table 1, we could confirm some stretching modes, such as a C=O stretching mode and a C(08211)N stretching mode, that support the formation of phenylboronic acid monolayers on the Au surface. The C=O stretching mode appeared at 1684 (1), 1682 (2) and 1663 cm−1 (3), while the C(08211)N stretching mode appeared at 1432 (1, 2) and 1431 cm−1 (3). In particular, symmetric and asymmetric CH2 stretching modes of phenylboronic acid monolayers were assigned at 2875–2901 and 2901–2922 cm−1, respectively. The intensities of CH2 stretching modes were comparable with each other at 1 and 3. Theses peak positions and peak intensities have been generally reported for well-ordered monolayers without gauche defects in FTIR-RAS spectra of organic SAMs with a methylene group [24, 25]. On the basis of these results, we can assume that the 1 and 3 monolayers have a relatively well-ordered construction. In case of the 2 monolayer, their CH2 stretching mode intensity appeared weakly. This can be explained by their disordered structure or aggregate structure on the Au surface.
The AFM images showed the surface geometry of bare Au and phenylboronic acids-modified Au (Fig. 3). In comparison with bare Au, the phenylboronic acids-modified Au surface showed a marked difference. The images of phenylboronic acids-modified surface were composed of a much larger grain size than the bare Au surface. To evaluate the surface profile of phenylboronic acids-modified Au, one of the most general and most useful roughness parameters, root mean square (RMS) roughness was applied. The RMS roughness of the bare Au surface was 8.10 Å, while those of phenylboronic acid-modified Au surface were 11.6 (1), 27.5 (2), and 26.7 Å (3), respectively. These increases in RMS roughness of phenylboronic acids-modified Au surfaces strongly support the formation of the SAM. In particular, the 2-modified Au surface showed the largest value of RMS roughness. This may be explained by 2-modified Au surface has its disordered surface structure. This result is quite consistent with the results of other measurements such as FTIR-RAS, SERS, CV and SPR.
The electrochemical measurements provide additional proof of the formation of phenylboronic acid monolayers. The potential difference (ΔEp) between the cathodic and anodic peaks of the bare Au electrode was 64 mV. On the other hand, the potential difference of the electrode treated with phenylboronic acids were 73 (1), 79 (2), and 95 mV (3), respectively (Fig. 4 (a)). The increase in potential difference at the Au electrode treated with phenylboronic acids indicated a marked decrease in the charge transfer for oxidation and reduction of [Fe(CN6)]3−. These changes are attributable to the formation of phenylboronic acid monolayers on the surface of the Au electrode.
In some previous studies, it has been proposed that the formation of alkanethiol monolayers on Au substrates to involves cleavage of the S-H bond with simultaneous bonding of an S head group to Au [26-28]. Though the additional oxidation of the S-S bond is involved, the formation of phenylboronic acid derivative monolayers on Au surface can be explained by the same above mentioned mechanism.
The properties of the electrode with phenylboronic acid monolayers can be estimated by submitting the electrode to reductive desorption experiments [26, 29]. Fig. 4 (b) shows the reductive desorption peak of phenylboronic acid monolayers on the Au electrode. This peak has been attributed to the reductive desorption of thiolated compounds that are chemisorbed to Au. This indicates that the phenylboronic acid derivatives were absorbed into the Au electrode by breaking the S-S bond and forming the Au-S bond.
After assuming that all thiolated compounds are reduced/oxidized in the CV experiments, the surface coverage can be determined from CV measurements [26-28, 30]. Accounting for the surface roughness of the Au electrode, the surface coverage (Γ) of the phenylboronic acid monolayers at the Au electrode were calculated from the integrated area under the reduction peak. The surface coverage of phenylboronic acids monolayers are 1.04 × 10⁻¹⁰ (1), 1.49 × 10⁻¹⁰ (2), and 3.33 × 10⁻¹⁰ mole/cm2 (3), respectively. These values effectively indicate the relative packing degree of each molecule on the Au surface. As the length of alkyl spacer increasing, the value of surface coverage increased, which is similar to the results of a previous study9. The other CV of the 3-modified Au electrode was measured in 0.5 M H2SO4 solution with a scanning rate of 200 mV/s (Fig. 4 (c)). The peak current of the 3-modified Au electrode conspicuously decreased compared to the bare Au electrode, which was due to the reduction of the electron transfer caused by the immobilization of the 3. Surface roughness of the Au electrode and the coverage ratio of the 3 monolayer can be calculated based on the relationship between the current and electrode area [30]. The surface roughness of the Au electrode was 2.0, while the coverage ratio of 3 monolayer was calculated to be 0.56. After considering the coverage ratio, the area per molecule of 3 was determined to 0.28 nm2 from the surface coverage of 3. This calculated value is similar not only to the result (0.24 nm2) of previous study about phenylboronic acid, but also the value (0.21 nm2) of alkanethiolates on Au (111) [15]. These close values strongly suggest that the 3 monolayer has a well-packed and regularly standing structure. Because this structure contributes to the exposure of the boronic acid moiety that interacts with saccharide on the top of monolayer, we conclude that the 3 monolayer has an advantageous surface for saccharide sensing.
On the other hand, the 2 monolayer showed lower surface coverage than that of the 3 monolayer. This low surface coverage and the relatively high RMS roughness of 2 strongly support that the 2 monolayer has a disordered or aggregated structure.
Because the Au energy transition overlapped with the energy band transition due to the SER effect at 488 nm, unfortunately, SERS spectra of phenylboronic acid monolayers on Au surface were not detectable [15]. Therefore, instead of Au, Ag electrode that is not only an effective substrate for SERS spectroscopy measurement but also a good metal substrate for SAM was used as a substrate.
To confirm the changes induced by monolayer formation, SERS spectra of phenylboronic acid monolayers were compared with those of phenylboronic acid bulk solid. In SERS spectra of bulk solid, a strong peak corresponding to disulfide bond commonly appeared at 510 cm−1 (Fig. 5). After the formation of phenylboronic acid monolayers, the C-S bond was localized in the closest neighborhood of the metal surface. In general, the intensities of Raman scattering for the moieties neighboring to the metal surface are most enhanced by SER effect. It was expected that the intensity of the ν(C-S) stretching mode would be most enhanced. In the SERS spectra of the 3 monolayer, the intensity of the ν(S-S) stretching mode decreased and the peaks attributable to the C-S stretching modes of gauche-conformer (ν(C-S)G) and trans-conformer (ν(C-S)T) appeared at 631 and 696 cm−1, respectively. In particular, the intensity of the ν(C-S)T stretching mode was stronger than that of the ν(C-S)G stretching mode. This result indicates that the 3 monolayer has well-ordered construction. In case of the 2 monolayer, on the other hand, the intensities of the ν(C-S)G and ν(C-S)T stretching modes appeared weakly. This result may be explained by 2 monolayer disordered or aggregate structure and its defect on surface arrangement prevent the SER effect. In SERS spectra of the 1 monolayer, the intensity of the ν(C-S)G stretching mode was stronger than that of the ν(C-S)T stretching mode. This intensity pattern of the 1 monolayer indicated that it has a less ordered structure than that of the 3 monolayer [31].
On the basis of the results from FTIR, AFM, CV and SERS, the degree of orderliness of the phenylboronic acid monolayers was as follows: 3> 1> 2. 3 monolayer had the most highly ordered and highly packed construction on the Au surface among three kinds of phenylboronic acid monolayers. In case of the 2 monolayer, although it had a more packed structure than the 1 monolayer, its degree of orderliness was less than the 1 monolayer. The results of FTIR-RAS, AFM, and SERS strongly suggest that the 2 monolayer had a disordered or aggregated construction.

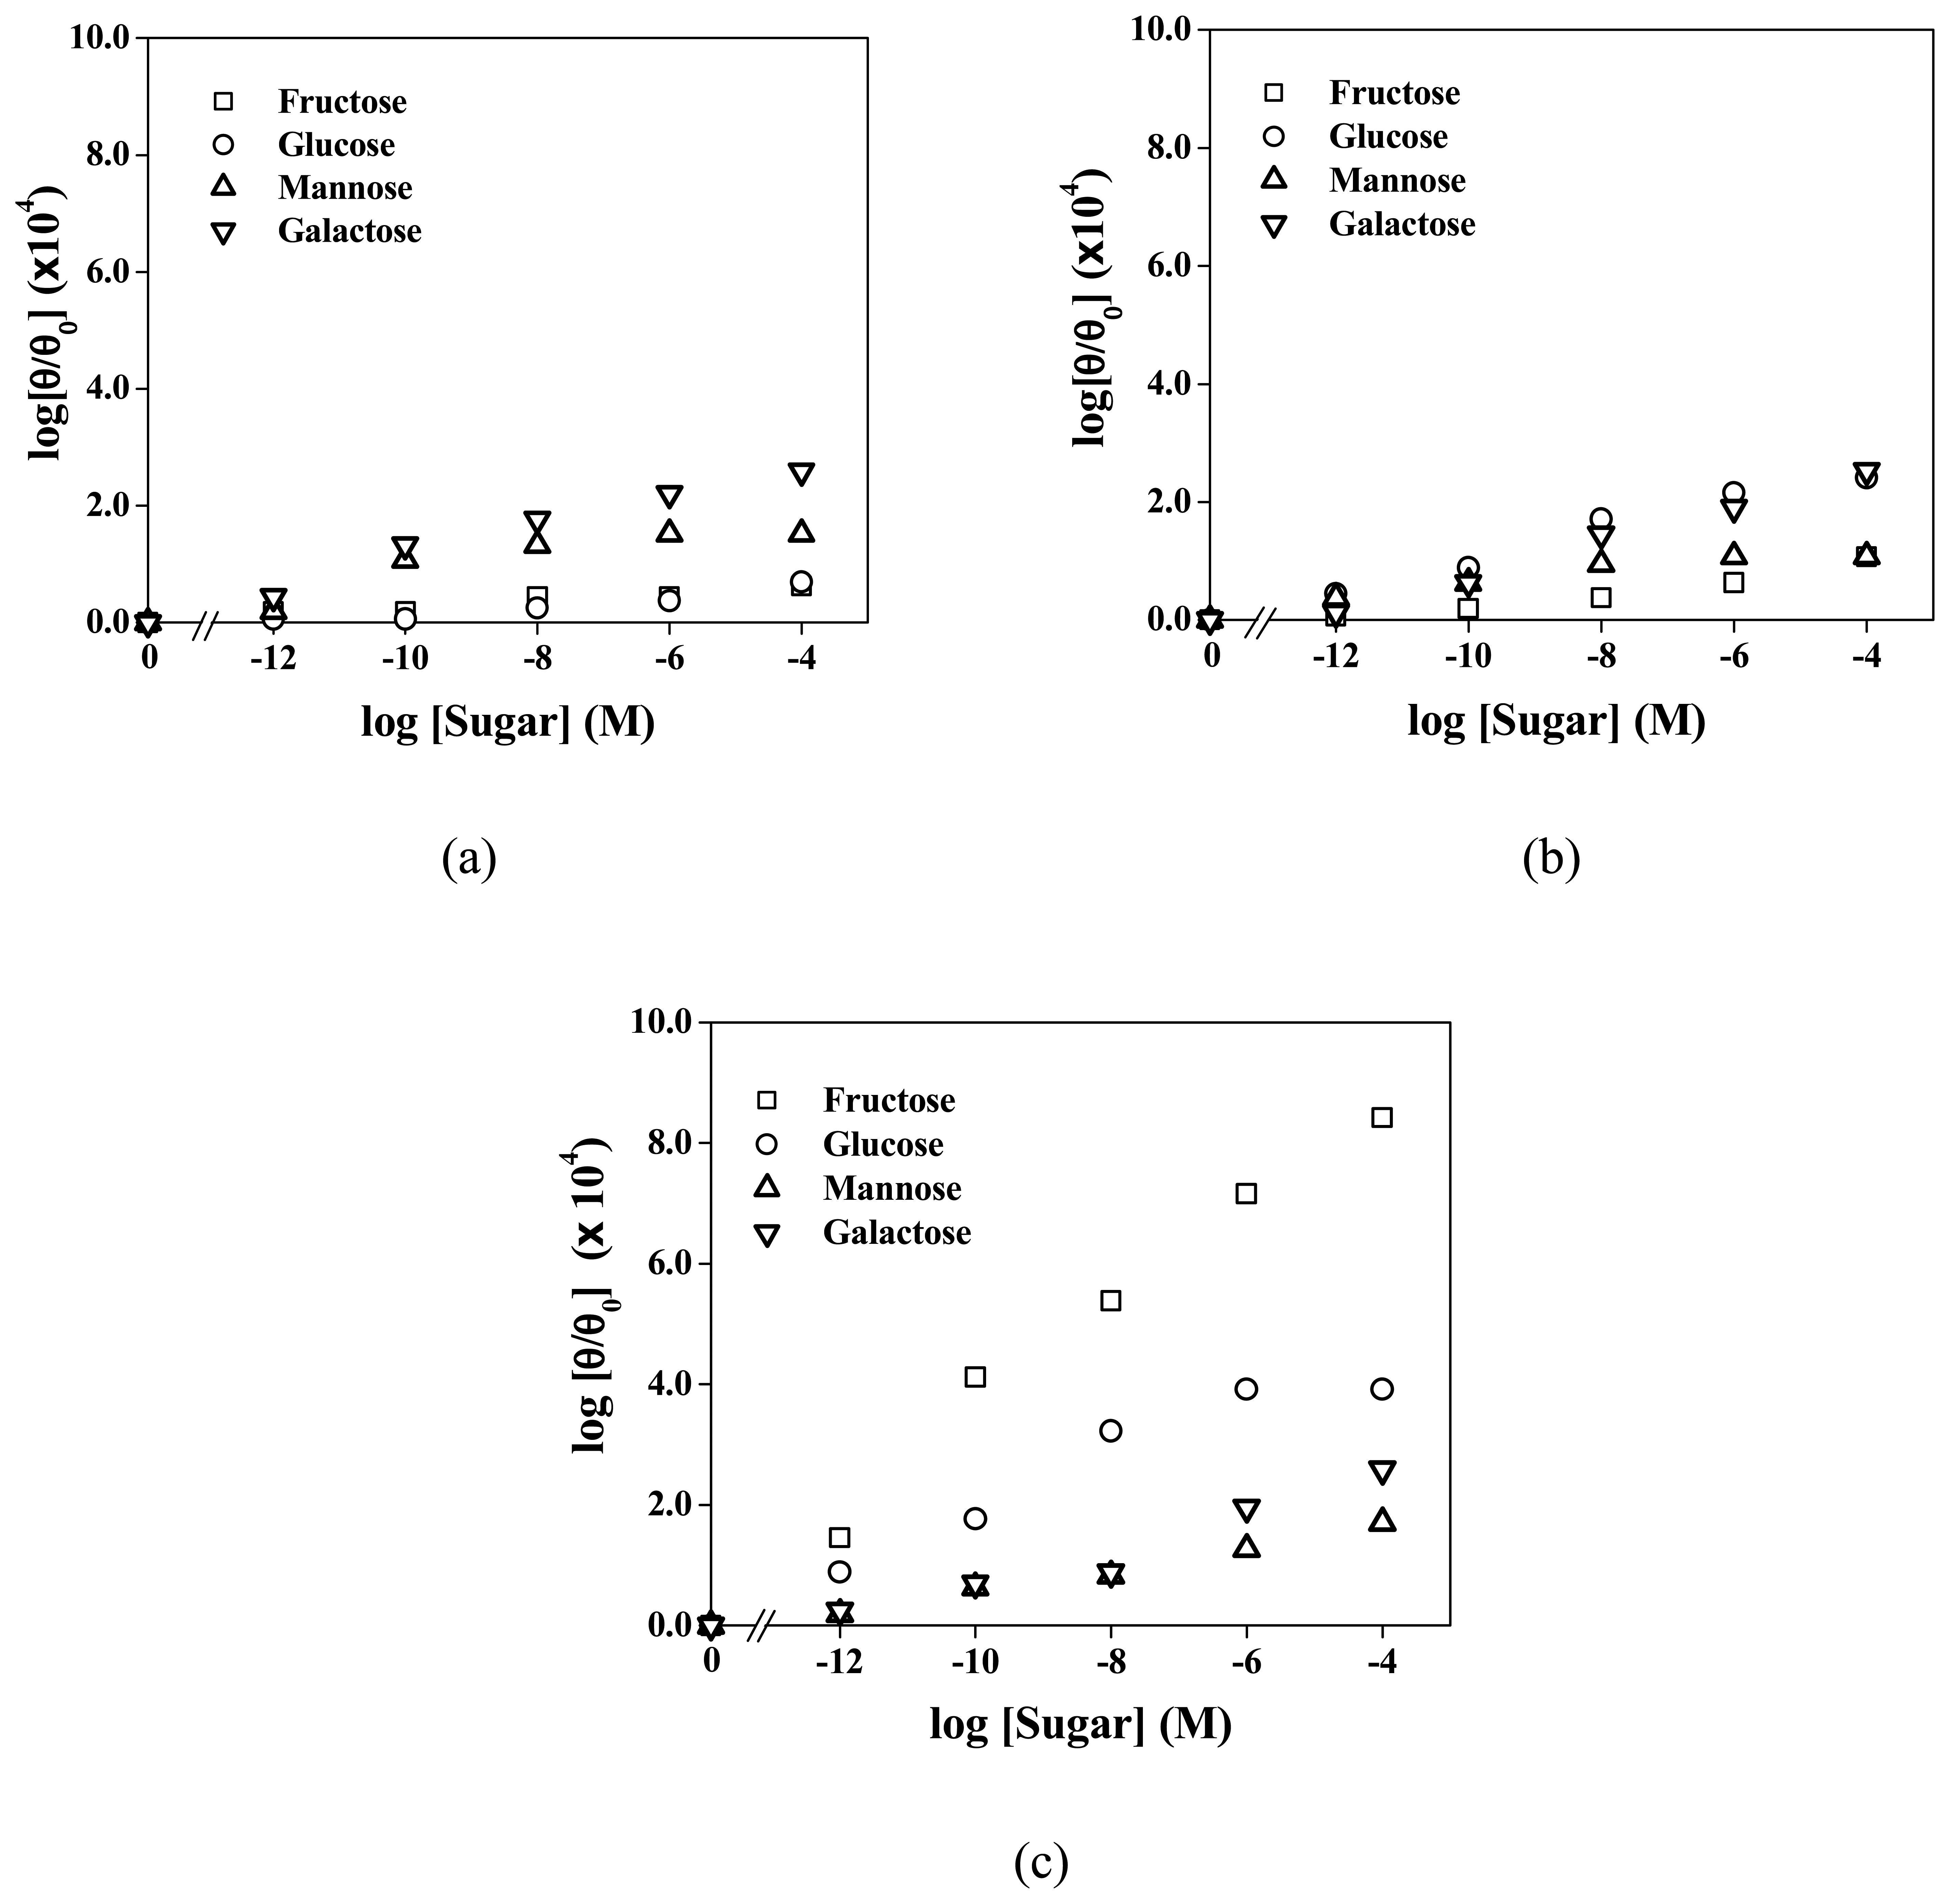
3.2 SPR study of interaction between phenylboronic acid monolayers and monosaccharides

The molecular interaction between the phenylboronic acid monolayer and monosaccharide can be measured through the SPR angle shifts that reflect the refractive index change or thickness change of the medium outside the metal layer. Fig. 6 (a) shows the SPR angle shifts of the 3 monolayer corresponding to various concentrations of fructose. As the monosaccharide concentration increased, the SPR angle of the phenylboronic acid monolayer gradually increased. This SPR angle shift arose from the molecular interaction between phenylboronic acid and monosaccharide on the recognition interface.
Among the phenylboronic acid monolayers, the 3 monolayer showed the highest sensitivity to fructose (Fig. 6 (b)). In particular, despite the low concentration (≥ 1.0 × 10⁻¹² M), the 3 monolayer sensitively responded to fructose. This result indicates that the SPR angle shifts well reflect a feeble signal from the molecular recognition at a very low fructose concentration. With regard to the detection limit of conventional electrode methods, which stay at the (00956)M level, these results are quite remarkable. In addition, a good sensitivity of the 3 monolayer indicates that it might interact better with fructose than do other phenylboronic acid monolayers. On the contrary, other phenylboronic acid monolayers (1 and 2 monolayer) showed relatively low sensitivity to fructose. The reason why sensitivity for fructose is low in 1 and 2 monolayer is that they have a disordered recognition interface, as indicated by the results of FTIR-RAS, AFM, and SERS.
SPR angle shifts by interaction between monosaccharides and phenylboronic acid monolayers with different alkyl spacers (n = 1, 2, 3) showed the effect of different alkyl spacer lengths. As the alkyl spacer length increased, SPR angle shifts showed a corresponding tendency to increase (Fig. 7). This result indicates that the increase of alkyl spacer length contributes to the formation of a well-ordered phenylboronic acid monolayer.
In the SPR spectroscopic measurements for the four kinds of monosaccharides, unfortunately the 1 and 2 monolayers showed low sensitivity and inconsistent response for monosaccharides sensing. On the other hand, the 3 monolayer showed not only good sensitivity but also slight selectivity for fructose among the four kinds of monosaccharides. On the basis of these results, it is clear that the 3 monolayer has the most suitable recognition interface for saccharide detection among the three kinds of phenylboronic acid monolayers.
In previous studies, it was reported that phenylboronic acid has a strong affinity for fructose among monosaccharides [4, 15, 32]. Therefore, the results for the 3 monolayer can be explained by the selective molecular recognition of phenylboronic acid. In the case of the 1 and 2 monolayers, they are also phenylboronic acid derivatives as is 3. Thus, they can show selectivity for fructose among monosaccharides, but in the present study, they did not show the selectivity for fructose. As previously mentioned, the results from FTIR-RAS, AFM, SERS and CV strongly support that 1 and 2 monolayers have a disordered or aggregated construction. In addition, the results of SPR sensing for monosaccharides showed low sensitivity and an inconsistent response at 1 and 2 monolayers. Therefore, it might be inferred from these results that the lack of selectivity was due to their disordered surface construction.

Conclusions

We have constructed phenylboronic acid SAMs and have carefully characterized their surface properties. Among the three kinds of phenylboronic acid monolayers, the 3 monolayer has the best ordered construction. This result was strongly supported by the SPR measurements for saccharide sensing. The saccharide sensing system was sufficiently useful in detecting monosaccharides even at very low concentrations. In addition, it showed selectivity for fructose. Consequently, these results reveal that a molecular recognition system based on a SAM method and SPR spectroscopy is very useful for saccharide detection. It also has great potential for glycoprotein analysis. To improve the selectivity of the saccharide selective molecular recognition system, at present, we are pursuing the research about molecular design for decreasing pKa value of recognition molecules and SAM process improvement for controlling the distance between binding sites.

Acknowledgments

This work was supported for two years by Pusan National University Research Grant and partially by the Brain Korea 21 project in 2007.

References

  1. Bjellqvist, B.; Hughes, G.J.; Pasquali, C.; Paquet, N.; Ravier, F.; Sanchez, J. C.; Frutiger, S.; Hochstrasser, D. The focusing positions of polypeptides in immobilized pH gradients can be predicted from their amino acid sequences. Electrophoresis 1993, 14, 1023–1031. [Google Scholar]
  2. Oh-eda, M.; Tominage, E.; Nabuchi, Y.; Matsuura, T.; Ochi, N.; Tamura, M.; Hase, S. Preparation of pyridylaminated O-linked sugar chains from glycoproteins blotted on a polyvinylidene difluoride membrane and application to human granulocyte colony-stimulating factor. Anal. Biochem. 1996, 236, 369–371. [Google Scholar]
  3. Dwek, M.; Ross, V.H. A.; Leathem, A. J. C. Proteome and glycosylation mapping identifies post-translational modifications associated with aggressive breast cancer. Proteomics 2001, 1, 756–762. [Google Scholar]
  4. Nunes, F.M.; Domingues, M. R.; Coimbra, M. A. Arabinosyl and glucosyl residues as structural features of acetylated galactomannans from green and roasted coffee infusions. Carbohydrate Research 2005, 340, 1689–1698. [Google Scholar]
  5. Seymour, E.; Fréchet, J.M. J. Separation Of Cis Diols From Isomeric Cis-Trans Mixtures By Selective Coupling To A Regenerable Solid Support. Tetrahedron Lett. 1976, 41, 3669–3672. [Google Scholar]
  6. Tong, A.J.; Yamauchi, A.; Hayashita, T.; Zhang, Z. Y.; Smith, B. D.; Teramae, N. Boronic Acid Fluorophore/g-cyclodextrin Complex Sensors for Selective Sugar Recognition in Water. Anal. Chem. 2001, 73, 1530–1536. [Google Scholar]
  7. Tsukagoshi, K.; Shinkai, S. Boronic Acid Fluorophore/g-cyclodextrin Complex Sensors for Selective Sugar Recognition in Water. J. Org. Chem. 1991, 56, 4089–4091. [Google Scholar]
  8. DiCesare, N.; Lakowicz, J. New Sensitive and Selective Fluorescent Probes for Fluoride Using Boronic Acids. Anal. Biochem. 2002, 301, 111–116. [Google Scholar]
  9. Ludwig, R.; Ariga, K.; Shinkai, S. Sensitive Detection of Saccharides by an Amphiphilic Phenylboronic Acid at the Air-warter-interface in the Presence of Quaternized Amines. Chem. Lett. 1993, 1413–1416. [Google Scholar]
  10. Ludwig, R.; Shiomi, Y.; Shinkai, S. Saccharide Recognition by Amphiphilic Diboronic Acids at the Air-Water-Interface and the Relationship Between Selectivity and Stoichiometry. Langmuir 1994, 10, 3195–3200. [Google Scholar]
  11. Ludwig, R.; Harada, T.; Ueda, K.; James, T.D.; Shinkai, S. Chiral Discrimination of Monosaccharides by monolayers of a steroidal boronic acid. J. Chem. Soc., Perkin Trans. 1994, 2, 697–702. [Google Scholar]
  12. Friggeri, A.; Kobayashi, H.; Shinkai, S.; Reinhoudt, D.N. From Solutions to Surfaces: A Novel Molecular Imprinting Method Based on the Conformational Changes of Boronic-acid-appended Poly(L-lysine). Angew. Chem. Int. Ed. 2001, 40, 4729–4731. [Google Scholar]
  13. Dusemund, C.; Mikami, M.; Shinkai, S. Selectve Molecular Recognition of Disaccharides by a Biphenyldiboronic Acid at the Air-water-interface. Chem. Lett. 1995, 157–158. [Google Scholar]
  14. Gabai, R.; Sallacan, N.; Chegel, V.; Bourenko, T.; Katz, E.; Willner, I. Characterization of the swelling of acrylamidophenylboronic acid - acrylamide hydrogels upon interaction with glucose by Faradaic impedance spectroscopy, chronopotentiometry, quartz-crystal microbalance (QCM) and surface plasmon resonance (SPR) experiments. J. Phys. Chem. 2001, 105, 8196–8202. [Google Scholar]
  15. Kanayama, N.; Kitano, H. Interfacial recognition of sugars by boronic acid-carrying self-assembled monoloayer. Langmuir 2000, 16, 577–583. [Google Scholar]
  16. Chaki, N.K.; Vijayamohanan, K. Self-assembled monolayers as a tunable platform for biosensor applications. Biosens. Bioelectr. 2002, 17, 1–12. [Google Scholar]
  17. Chen, H.; Kim, Y. S.; Keum, S. R.; Kim, S. H.; Choi, H. J.; Lee, J.; An’, W. G.; Koh, K. Surface Plasmon Spectroscopic Detection of Saxitoxin. Sensors 2007, 7, 1216–1223. [Google Scholar]
  18. Karlsson, O.P.; Löfås, S. Flow-mediated on-surface reconstitution of G-protein coupled receptors for applications in surface plasmon resonance biosensors. Anal. Biochem. 2002, 300, 132–138. [Google Scholar]
  19. Su, X.; O'Shea, S.J. Determination of monoenzyme- and bienzyme-stimulated precipitation by a cuvette-based surface plasmon resonance instrument. Anal. Biochem. 2001, 299, 241–246. [Google Scholar]
  20. Rich, R.L.; Day, Y. S.; Morton, T. A.; Myszka, D. G. High-resolution and high-throughput protocols for measuring drug/human serum albumin interactions using BIACORE. Anal. Biochem. 2001, 296, 197–207. [Google Scholar]
  21. Chen, H.; Lee, M.; Choi, S.; Kim, J. H.; Choi, H. J.; Kim, S. H.; Lee, J.; Koh, K. Comparative Study of Protein Immobilization Properties on Calixarene Monolayers. Sensors 2007, 7, 1091–1107. [Google Scholar]
  22. Lee, M.; Kim, T. I.; Kim, K. H.; Kim, J. H.; Choi, M. S.; Choi, H. J.; Koh, K. Formation of a self-assembled phenylboronic acid monolayer and its application toward developing a surface plasmon resonanc-based nonosaccharide sensor. Anal. Biochem. 2002, 310, 163–170. [Google Scholar]
  23. Kretschmann, E. Determination of optical constants of metals by excitation of surface plasmons. Phys. 1971, 241, 313–324. [Google Scholar]
  24. Chidsey, C.E. D.; Loiaconol, D. N. Chemical Functionality in Self-Assembled Monolayers: Structural and Electrochemical Properties. Langmiur 1990, 6, 682–691. [Google Scholar]
  25. Tamada, K.; Nagasawa, J.; Nakanishi, F.; Abe, K. Structure and growth of hexyl azobenzene thiol SAMs on Au(111). Langmuir 1998, 14, 3264–3271. [Google Scholar]
  26. Whitesides, G.M.; Laibinis, P. E. Wet Chemical Approaches to the Characterization of Organic Surfaces: Self-Assembled Monolayers, Wetting, and the Physical-Organic Chemistry of the Solid-Liquid Interface. Langmuir 1990, 6, 87–96. [Google Scholar]
  27. Bryant, M.A.; Pemberton, J. E. Surface Raman scattering of self-assembled monolayers formed from 1-alkanethiols: behavior of films at Au and comparison to films at Ag. J. Am. Chem. Soc. 1991, 113, 8284–8293. [Google Scholar]
  28. Wang, J. Analytical electrochemistry; John Wiley & Sons: New York, 2000; pp. 161–189. [Google Scholar]
  29. Widrig, C.A.; Chung, C.; Porter, M. D. The electrochemical desorption of N-alkanethiol monolayers from polycrystalline Au and Ag electrodes. J. Electroanal. Chem. 1991, 310, 335–359. [Google Scholar]
  30. Walczac, M. M.; Popenoe, D. D.; Deinhammer, R. S.; Lamp, B. D.; Chung, C.; Porter, M. D. Reductive Desorption of Alkanethiolate Monolayers at Gold: A Measure of Surface Coverage. Langmuir 1991, 7, 2687–2693. [Google Scholar]
  31. Sandhyarani, N.; Pradeep, T. Characteristics of alkanethiol self assembled. monolayers prepared on sputtered gold films: a surface enhanced Raman spectroscopic investigation. Vacuum 1998, 49, 279–284. [Google Scholar]
  32. Suenaga, H.; Mikami, M.; Sandanayake, K. R. A. S.; Shinkai, S. Screening of fluorescent boronic acids for sugar sensing which show a large fluorescence change. Tetrahedron lett. 1995, 36, 4825–4828. [Google Scholar]
Figure 1. Scheme of (a) synthesis of phenylboronic acid derivatives (n = 1, 2, 3); (b) the SPR system and (c) the sensor chip configuration.
Sensors 07 01480f1
Figure 2. (a) Relative SPR angle shifts according to the immobilization of phenylboronic acids. (b) FTIR-RAS spectra of phenylboronic acid monolayers on Au.
Sensors 07 01480f2
Figure 3. AFM images of phenylboronic acids modified Au surface. (a) Bare Au surface. (b) 1-modified Au surface. (c) 2-modified Au surface. (d) 3-modified Au surface.
Sensors 07 01480f3
Figure 4. CV of Bare and phenylboronic acids-modified Au electrodes immersed in (a) 0.1 M KCl with 1.0 mM [Fe(CN)6]3−; (b) in 0.5 M KOH and (c) in 0.5 M H2SO4.
Sensors 07 01480f4
Figure 5. SERS spectra of phenylboronic acid monolayers excited at 488 nm (25°C); (a) Bulk solid and (b) Phenylboronic acid SAMs on Ag.
Sensors 07 01480f5
Figure 6. (a) SPR angle shifts of 3 monolayer (n = 3) according to various concentrations of fructose. The arrow indicates the direction of SPR angle shifts. The values in parenthesis mean SPR angle at each concentration of fructose. (b) Relative SPR angle shifts of phenylboronic acid monolayers with different alkyl spacer length (n =1, 2, 3) according to various concentration of fructose.
Sensors 07 01480f6
Figure 7. Relative SPR angle shifts of phenylboronic acid monolayers according to various concentrations of monosaccharides. (a) 1 monolayer; (b) 2 monolayer; (c) 3 monolayer.
Sensors 07 01480f7
Table 1. FTIR-RAS peak assignment of phenylboronic acid monolayers on Au.
Stretching modeWavenumber (cm−1)

123
νa(CH2)29012922
νs(CH2)28752901
ν(C=O) amide168416821663
νa(C=C) aromatic157415741587
ν(C-N) amide143214321431
ν(B-O)133913351342
δ(CH2)122612241227
δ(C-C)11731173

