1. Introduction
This investigation was carried out within the framework of the European Commission (EC) HYRESSA (HYperspectral REmote Sensing in Europe specific Support Actions) project. HYRESSA (see also
www.hyressa.net) is investigating the user needs of the European hyperspectral research community with respect to access to and accuracy, quality and conformity of hyperspectral imagery - especially with the advent of next-generation European hyperspectral sensors in order to refine protocols related to calibration, acquisition, processing and in-situ measurements in compliance with standards.
Since its early development over 30 years ago, hyperspectral imagery (HSI) has gradually expanded from its initial use as a research tool to commercial application. Today, 30 years after the first technical demonstration, it is the fastest growing research area in remote sensing /3/.
In contrast to multispectral imagery, HSI generates contiguous spectra of the observed target. With hundreds of spectral bands, an HSI system obtains a spectrum of the energy reflected or emitted by each element in the scene. The identification of an object using HSI is established via its spectrum, as opposed to its shape, which is used by most multispectral systems. HSI is, in general, a 3-dimensional data cube comprising of two spatial dimensions and one spectral dimension, where the spatial dimensions account for across track and along track directions of the HSI sensor-carrying platform.
The first HSI airborne instruments appeared in the 1980s and these instruments were particularly used in geology for the determination of minerals. A key early platform was the AVIRIS instrument, which was designed and operated at JPL/NASA starting its pathfinder function for hyperspectral applications in 1989. A decade later, around 2000/01, the first civilian high-ground-resolution spaceborne hyper spectral sensors were launched on NASA's EO-1 and ESA's PROBA platform. The HSI sensors onboard these pathfinder missions are called HYPERION and CHRIS, and are still delivering important information for scientists in many fields around the world. Since then several national and international initiatives have been proposed to allow fully operational missions for systematic measurement of spectral signatures with reasonable spectral, radiometric, spatial and temporal resolution.
Since HSI is the fastest growing research area in remote sensing /3/, the user community is thus eager to see the next generation fully-operational imaging spectrometers, either as spaceborne instruments (EnMap) or as airborne counterparts (e.g., APEX, ARES). An overview of some HSI instruments and programmes is given in
Table 1.
HSI applications are very diverse and generally support the generation of important products for industrial, agricultural, geological, and environmental use. As examples of the high amount of interdisciplinary effort needed, one observes that research applications are very heterogeneously covered through studies in
Vegetation (with forestry, agriculture), e.g., detection of chlorophyll, cellulose,
Atmosphere, e.g., detection of aerosols and trace gases,
Land use, e.g., detection of land cover and change,
Geology/mining, e.g., detection of minerals, soil types,
Limnology/coastal waters, e.g., detection of plankton, dissolved organic material, sediment content,
Snow/ice, e.g., snow impurity, depth and grain size.
Additionally, the research fields are extremely diverse, covering technical challenges, algorithm development and application research performed by sensor manufacturers, data providers as well as the end-user. Currently, the technological development steps include:
Instrument development (high signal-to-noise ratio (SNR), low self-polarization, broad spectral range),
Processing (new parallel or grid processing schemes for large HSI data volumes),
Calibration (uniformity, known accuracies, sensor stability).
This complexity and diversity is probably the reason that so few comprehensive investigations of user needs, accounting for the complexity of HSI data characteristics, have been carried out so far.
Hence, within the HYRESSA project, a new method for evaluating remote sensing community user needs was desired in order to analyze and better understand the requirements coming from this very active but heterogeneous research community.
2. Value-Benefit Analysis (VBA) Methodology
The VBA is a well-established tool used in operations research for the systematic problem solving process, providing the possibility of comparing projects or solutions. It enables an evaluation on the basis of a multidimensional objective model and can be augmented by experts' preferences. The VBA is a method for an appropriate evaluation of complex project alternatives on the basis of a multidimensional objective system. In practice, it is used when the objectives relevant for the evaluation of alternatives cannot be measured solely using monetary units, which is often the case for capital-intensive projects in economics, politics and research. Therefore the measuring system uses a scaling approach (Law of Comparative Judgment) in order to achieve the required ranking judgments. The details of the VBA theory have first been described in by C. Zangemeister (1973).
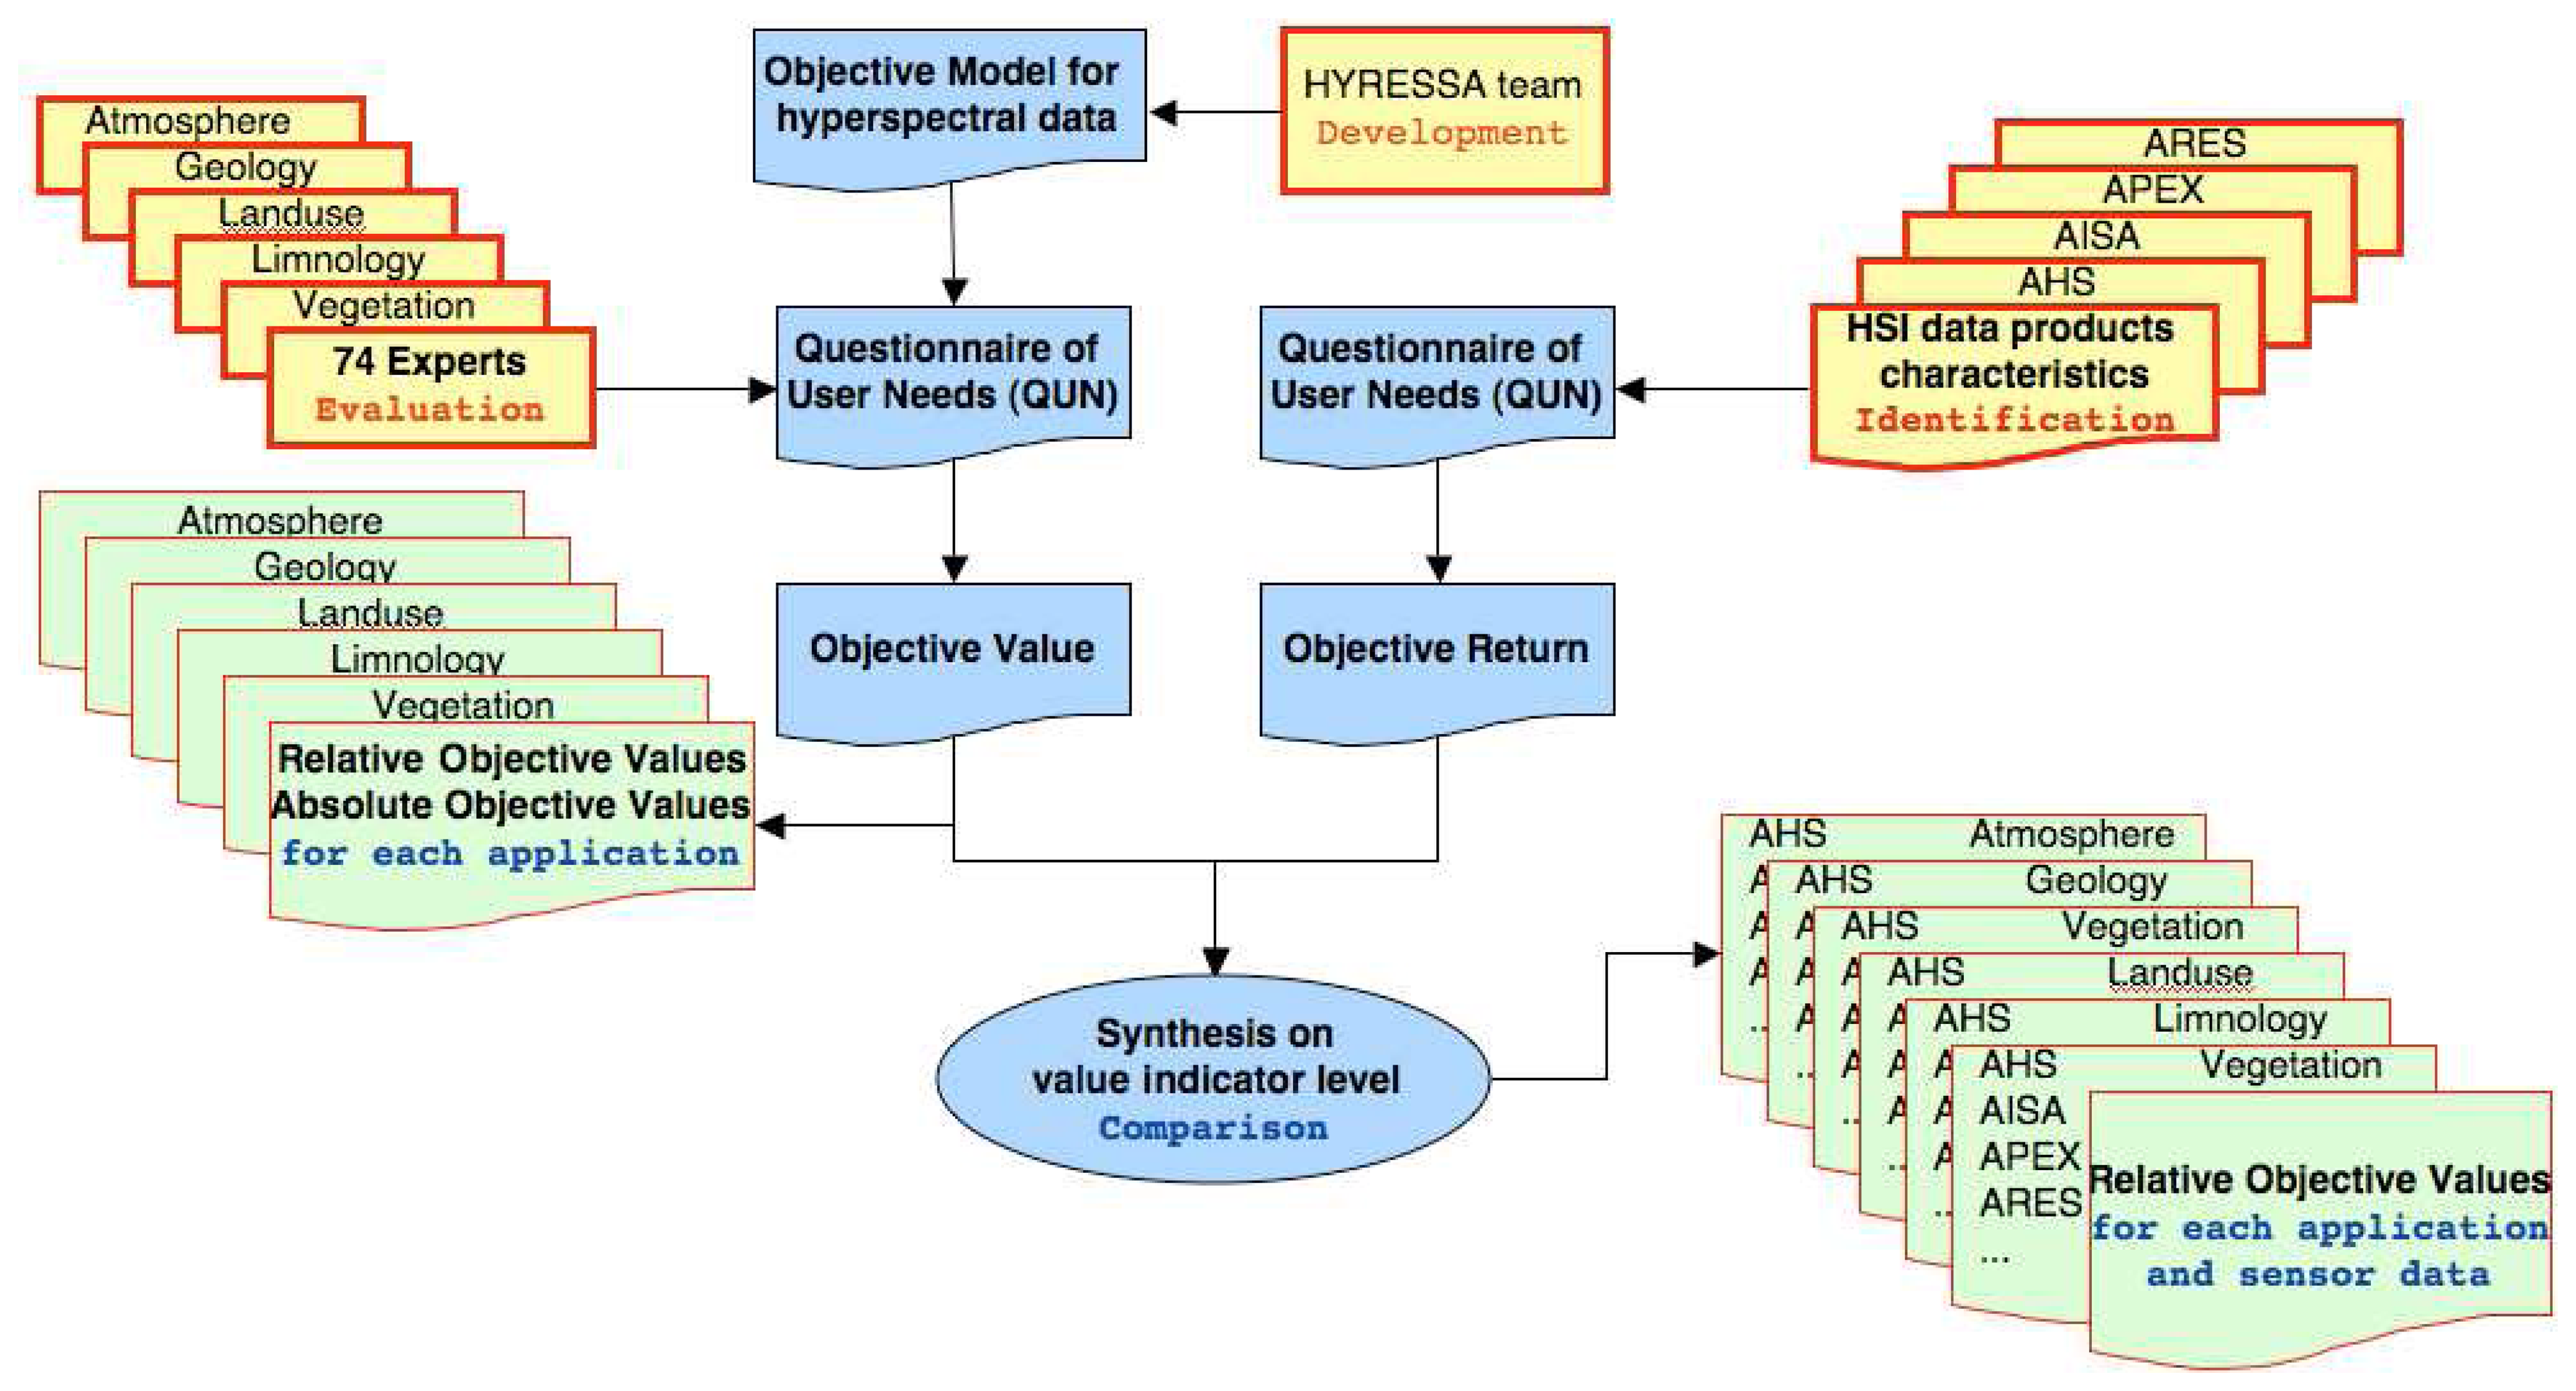
In order to apply a VBA to evaluate the needs of hyperspectral data users, an objective model needs to be set-up describing the “
maximal attractiveness of hyperspectral data”. The subsequent analysis is then relatively simple using this objective model to evaluate user preferences. The objective model will in parallel be used to compare those user-reported preferences with the real world, i.e., the data typically provided by HIS operators. The steps are detailed in the following subsections (see also
Figure 1).
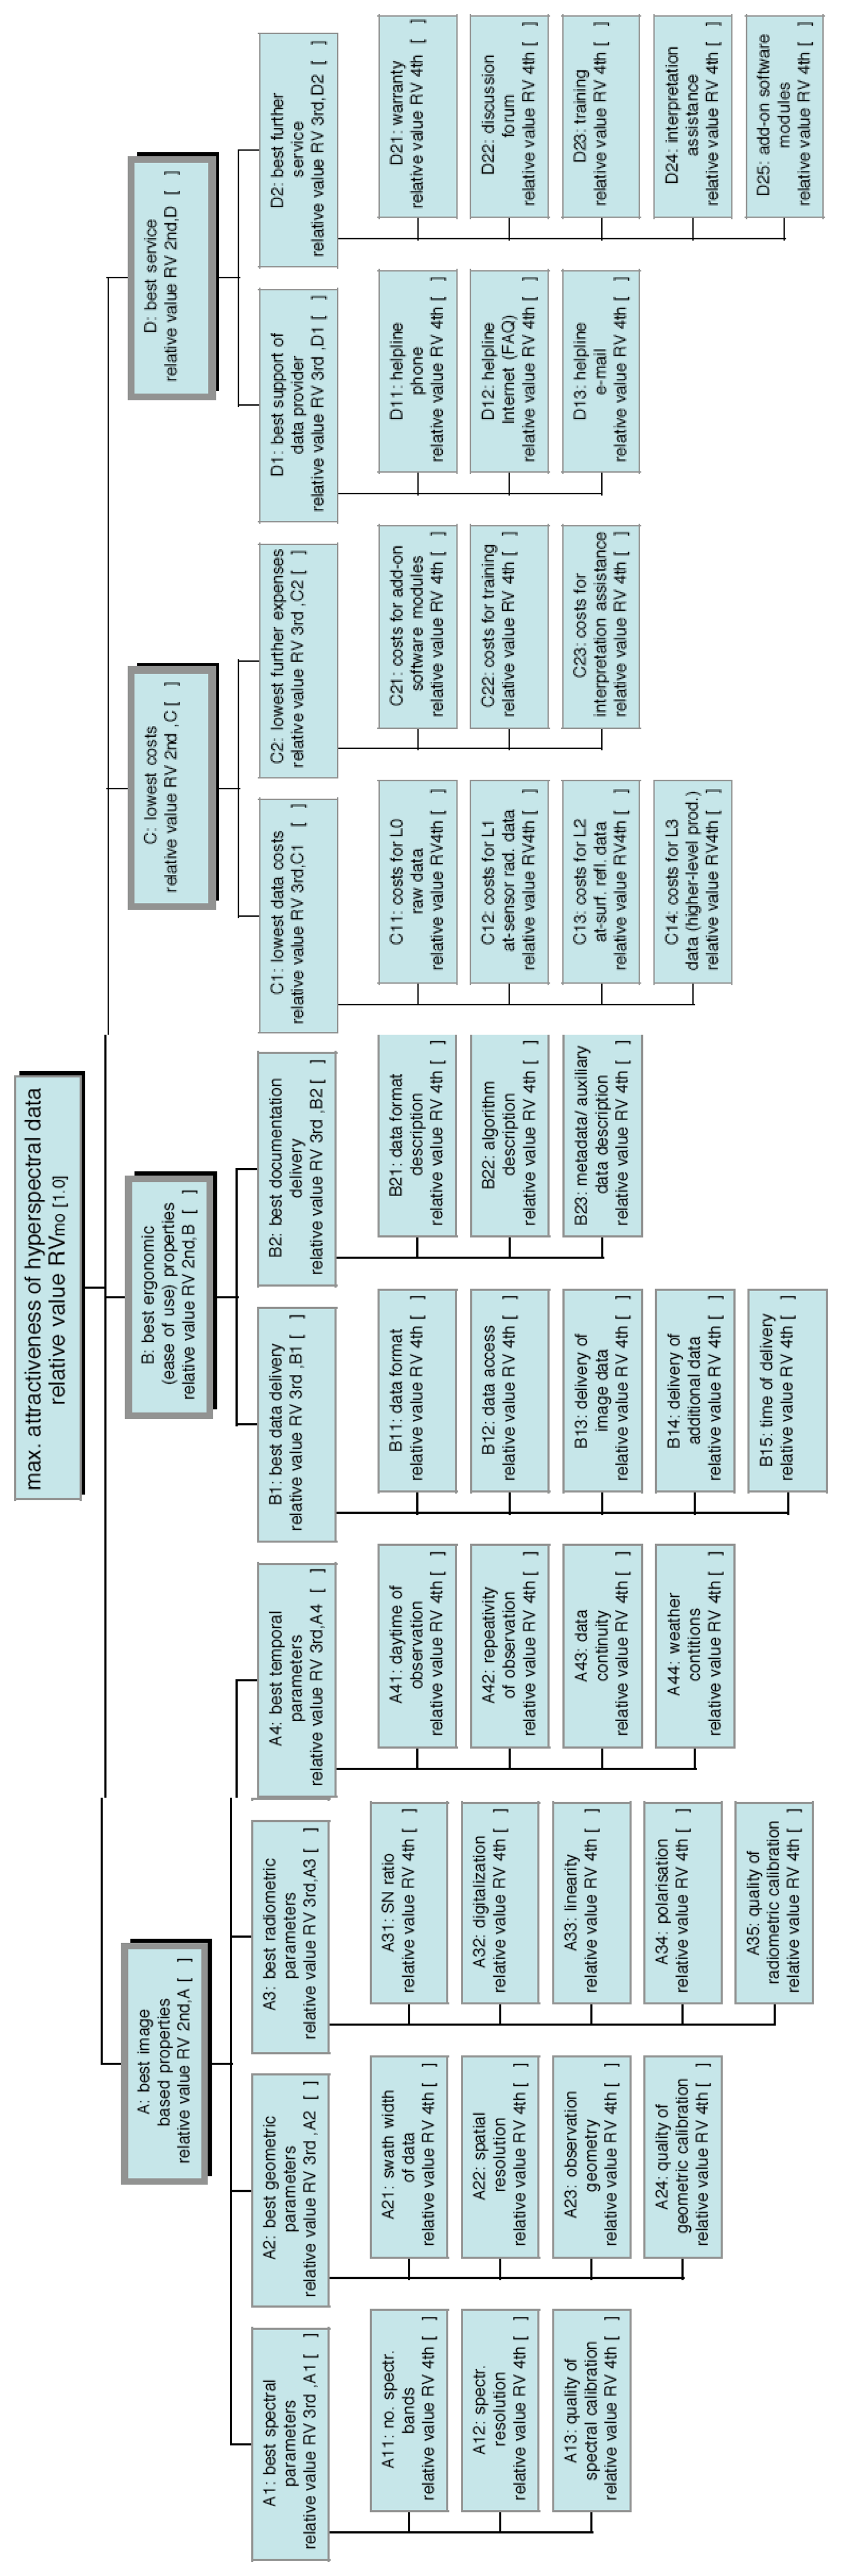
2.1 Compilation of a Multi-Dimensional Objective Model
The first step in executing a VBA involves defining a main objective for the objective model; in the case of HSI data: “Maximum attractiveness of hyper-spectral data”. Afterwards all properties of hyperspectral image data – focusing on the visible, near- and thermal infrared (VNIR-TIR) spectral region – must be enumerated and sorted. Therefore, a tree diagram is used, which leads to a hierarchical structure of the objective model. The main objective is placed at the top of the diagram and is then branched (and further subdivided) into three subordinate objective levels. At the lowest level of the objective model are the objective value indicators and dedicated value indicator functions. These indicators are e.g., swath width, processing steps, radiometric accuracy, price etc. and in general can be quantified in specific units, e.g., km, level 1-3, %, and €/km2.
2.2 Evaluation of the Objective Model by Experts / Users
The evaluation step consists of an objective model weighting procedure performed by experts (i.e., the user filling out the QUN). A weighting of the objective model is needed since the objectives have different relative values for different user preferences. The participating users are divided into different application areas. This first evaluation process is realized by experts and users in the field of HSI remote sensing. The weighting is performed by distributing 100 percent on the objectives of each branching point at each objective level. These branching weights denote the relative objective value concerning the main objective at the top of the tree diagram. The result is an objective model, where all objective levels and objective value functions are weighted hierarchically with relative weights (priorities) concerning the objective-specific value of hyperspectral imaging data. Additionally, absolute values for the indicators (for example, the spectral resolution [in nm]) were specified by the user based on his personal preferences. These objective values are needed for step #4 of the VBA.
2.3 Hyperspectral Imager Survey (VIS-TIR)
In this step the alternative HSI sensor data are described using the lowest level of the objective model - the value indicators. The sensor manufacturers and/or the data-distributing agencies provide the technical information and the relevant value indicators can then be determined for each HSI data delivery scheme.
2.4 Synthesis of Values for each Sensor
In a final step, the determination of the relative score for each sensor is achieved by the synthesis of values. First the relative values of each tree level are multiplied following a specific tree branch to get the final relative values for a specific indicator. Then the absolute user and sensor values are compared. If the sensor value fulfils the user requirements, then the full relative user value is used for the evaluation. By limited fulfillments of x %, only x % of the relative value is further brought to the evaluation. Finally, all resulting relative values are summed up resulting in a percentage, indicating how well the main objective “Maximum attractiveness of hyperspectral data” is achieved for a given sensor and a specific application. The result is called objective return.
In
Figure 1 the basic VBA approach applied within the HYRESSA project can be depicted.
3. The HSI Objective Model, Objective Value and Objective Return
Since the requirements for hyperspectral data depend highly upon the application area in question, the participating users are asked to choose an application area during the introductory part of the QUN. It is implicitly understood that those who choose a particular area fill out the entire questionnaire with respect to the specific area selected, i.e., vegetation (in general), forestry, agriculture, atmosphere, land use, geology/mining, or limnology/coastal waters.
3.1 Objective Model
In setting up the objective model, a tree model was selected (see
Figure 2). The main objective is divided into four different sub-objectives on the 2
nd objective level, i.e., best image based properties (A), best ergonomic properties (B), lowest costs (C), and best services (D).
The objectives of the 2nd objective level are further divided into sub-objectives on the 3rd objective level. As a result, objective A is subdivided into best spectral, best geometric, best radiometric and best temporal parameters. Objective B leads to best data delivery and best documentation. Objective C results in lowest data costs and lowest further expenses and objective D is hierarchically split into best support of data provider and best further services.
The same approach is taken for the 4th objective level, which also includes the objective indicator values. The first two objective levels of the model are presented in the sub-objectives of A, B, C and D.
3.2 Objective Value
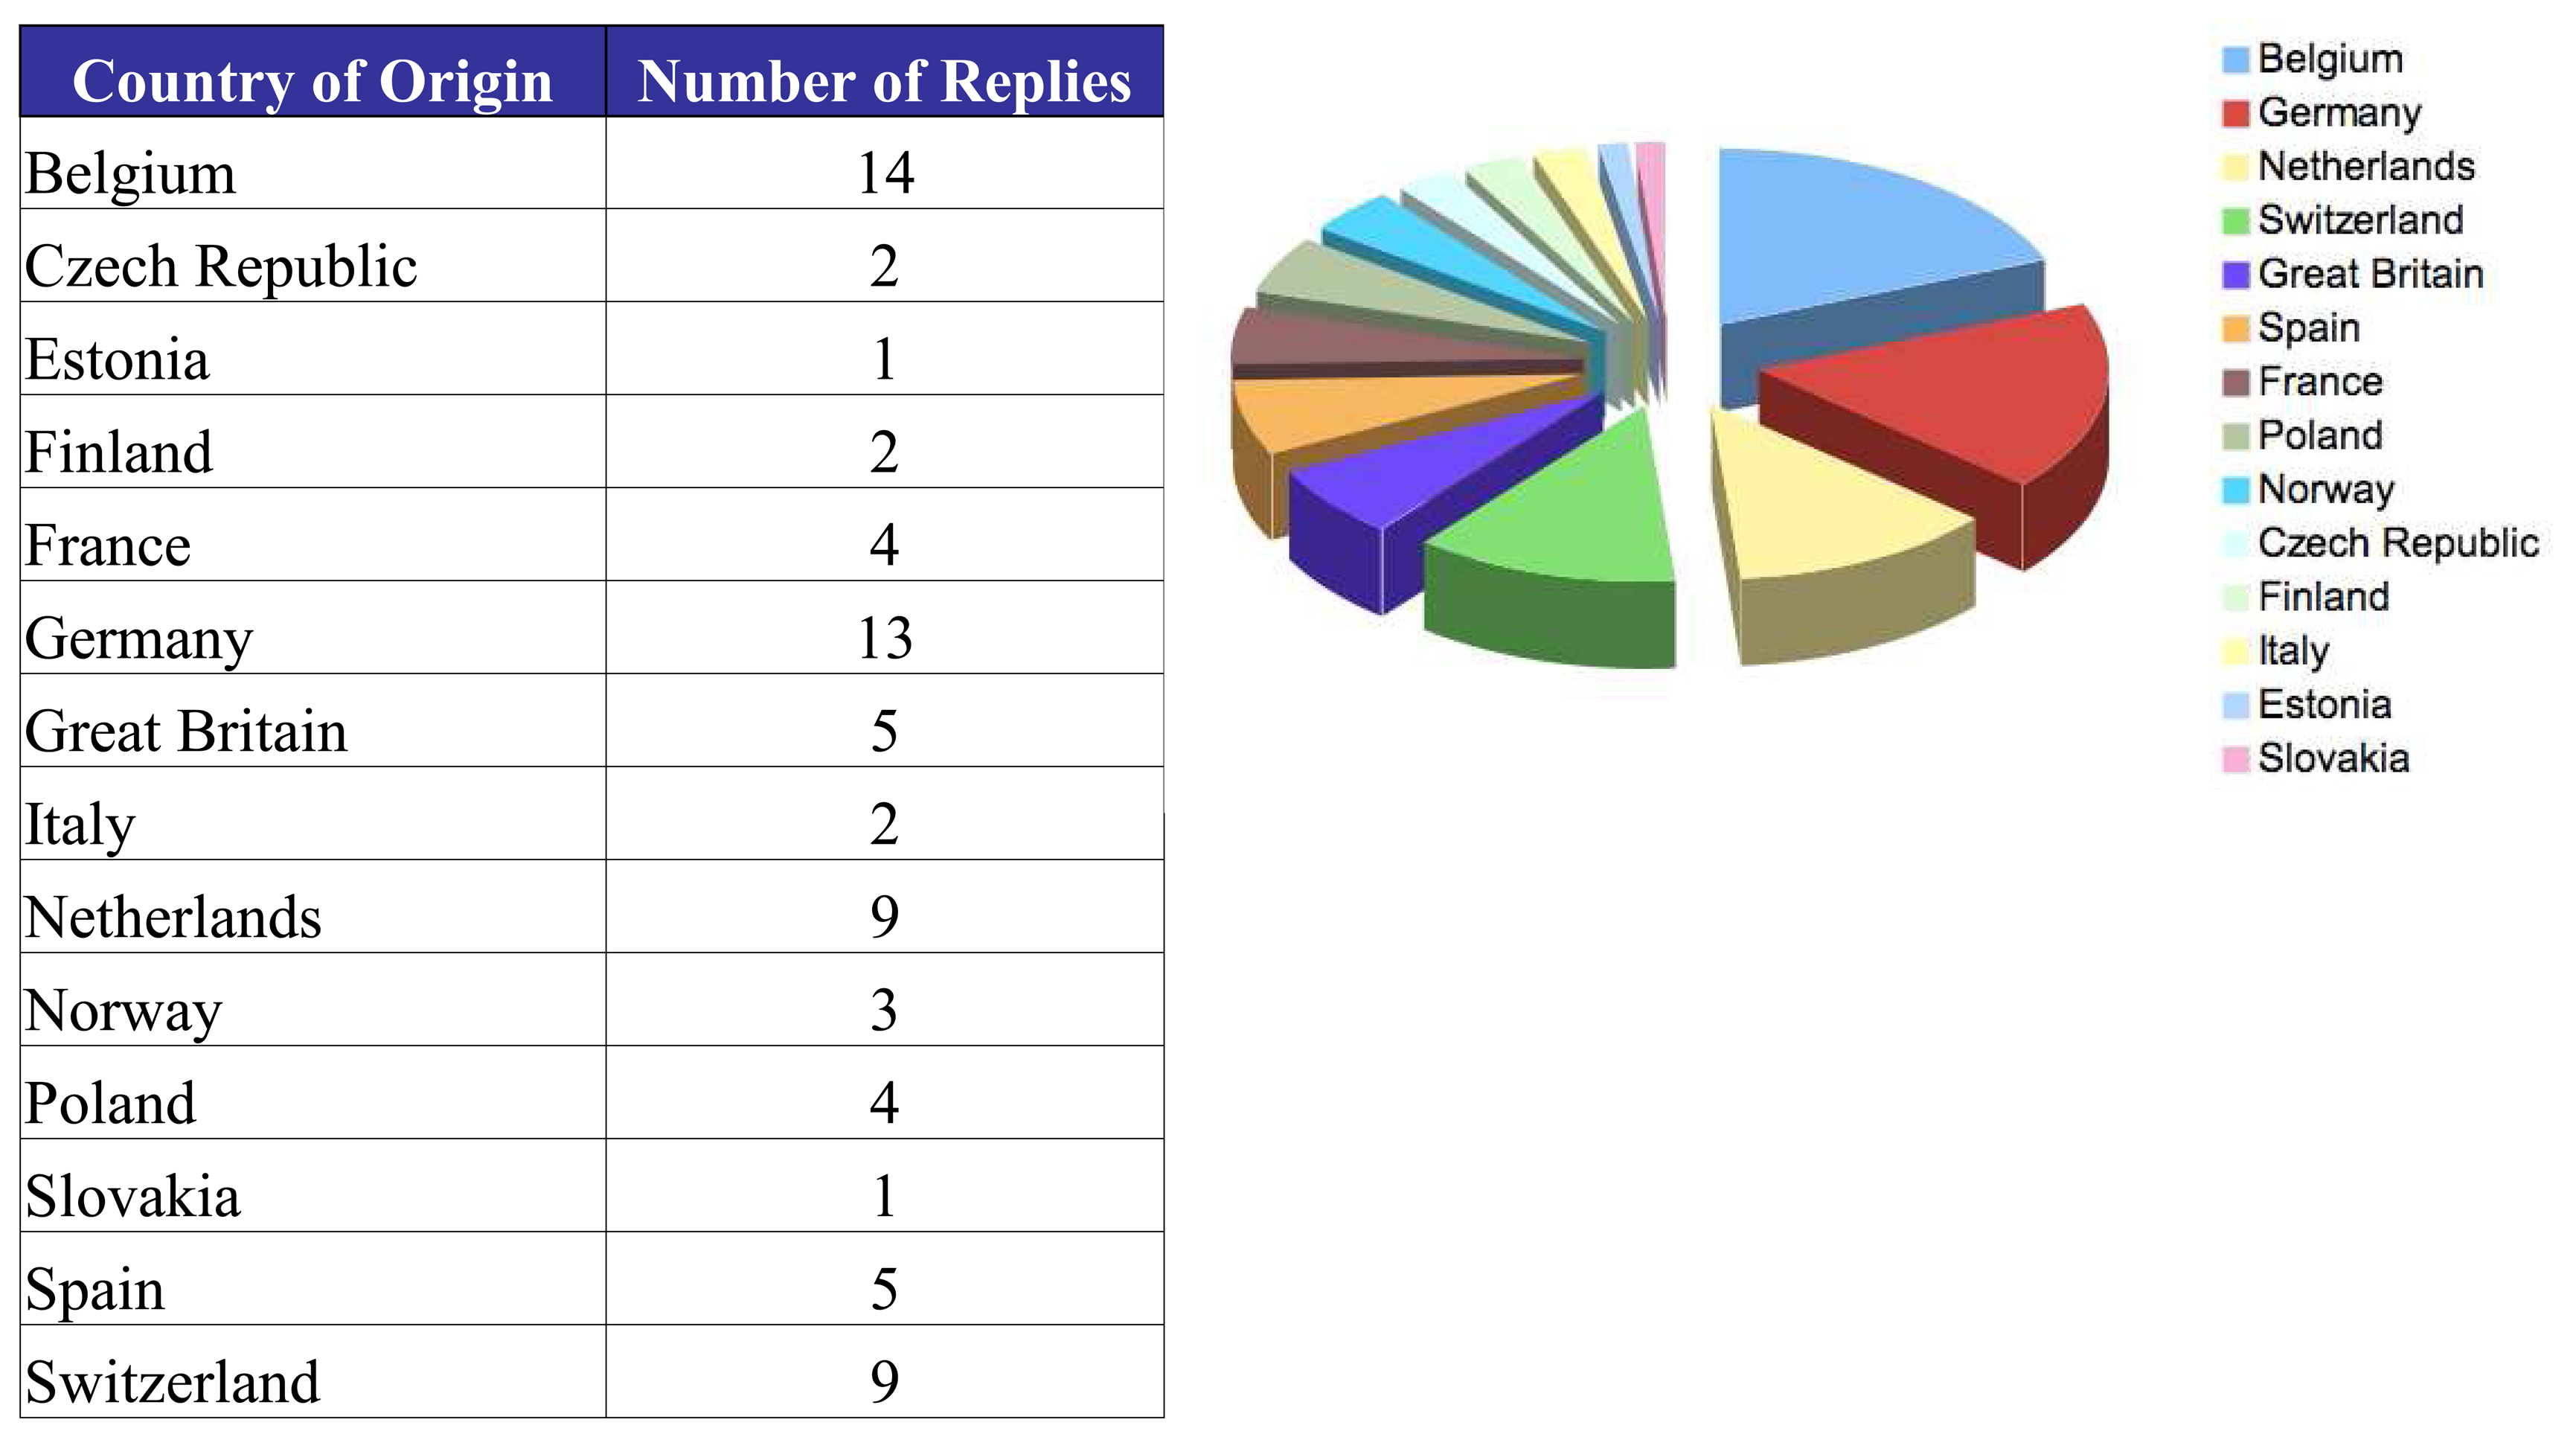
A total of 74 experts filled out the objective model. The respondents' employee background was 47 % University, 38 % Research Institute and 15 % Government. Most of the respondents were very experienced users and have worked with hyperspectral data from several sensors. The origin of the researchers is shown in demonstrating that evaluations from the majority countries of the European Union (EU) were obtained. It may also give some indication of interests within the Community on the HYRESSA project and/or on the HSI subject itself.
Figure 3 shows how the 74 QUN-responses are distributed into different application areas. Whereas the largest number of replies was submitted for the application area vegetation (incl. agriculture and forestry), each of geology, land use and limnology/water application areas were almost equally represented with 10 replies each. The application area atmosphere was underrepresented receiving only replies from three experts. This distribution may reflect the research interests in hyper spectral remote sensing in Europe. In other words, HSI related application research seems mainly focused on vegetation issues. However, since some application areas (especially atmosphere) provided only a small number of responses, statically relevant conclusions are difficult to make.
For the VBA, the average of the resulting relative values for each application was calculated and statistically analyzed.
3.3 Objective Return
After 30 years of research in the field of HSI, there exists a large variety of hyper spectral imagers and HSI data, produced using different processing and calibration approaches. This is why the HYRESSA team decided to focus on the most prominent HSI data that is made available for high spatial resolution observations in Europe. Both spaceborne and airborne HSI data are taken into account.
Therefore, a final selection based upon spaceborne (HYPERION, CHRIS) and airborne (APEX, AHS, ARES, AVIRIS, HYSPEX, CASI, AISA) HSI data (see also
Table 1) was performed. This was carried out by contacting sensor manufacturers and/or data-distributing agencies for obtaining the relevant information. In the end, for all HSI data and each HSI data delivery scheme, value indicators could be provided, which appropriately describe the objective model on the highest level of detail.
4. Results
The results of the VBA can be described in terms of relative or absolute values. Whereas the relative values describe the relative importance of a sensor or a value indicator in fulfilling the overall objective, absolute values become clear requirements, providing benchmarks establishing the point where a certain objective can be regarded as fulfilled (see also
Figure 1).
4.1 Relative Values
It is possible for the relative value for each sensor and each application related to the main objective to be described. In other words, it is possible to quantify directly the attractiveness of HSI data for a specific application. This attractiveness is related to a given objective return and objective evaluation and the subsequent synthesis of its values, i.e., fully traceable and comparable on all levels of the objective tree.
Table 2 shows the resulting percentage representing how well the main objective “Maximum attractiveness of hyperspectral data” is achieved for a given HSI data set with respect to a specific application. First of all it becomes clear that there are no outliers, i.e., the results for a specific sensor do not change substantially from one application to another. The relative value difference range is within a 5 to 12 % window for all sensors.
It is also evident that there is not a single HSI data set that entirely fulfils all user requirements. The spaceborne sensor HYPERION receives the highest relative values for all applications, followed by the airborne sensors APEX, ARES, HYSPEX and the spaceborne sensor CHRIS, assuming that all applications are equally important. This result may at first be surprising and should therefore be elaborated in more detail.
For this reason, the results in combination with the subsequent objective level (2
nd objective level) in the objective tree were compared to each other. The 2
nd objective level is subdivided in
image-based properties (A),
best ergonomic properties (B),
lowest costs (C) and
best service (D). As it is not possible to depict the table for every application within this paper, one is chosen representing the application of highest interest by the evaluating experts: vegetation (see
Table 3).
HYPERION data do not receive the best values in A, B and D, but an explicit better value for C (lowest costs), which is sufficient for obtaining the best overall value. The costs are so important for the user, that the relatively low SNR of HYPERION is not too critical in an overall assessment of that sensor. Note that the specific values are the result of the user assessment giving the image-based properties lower priority.
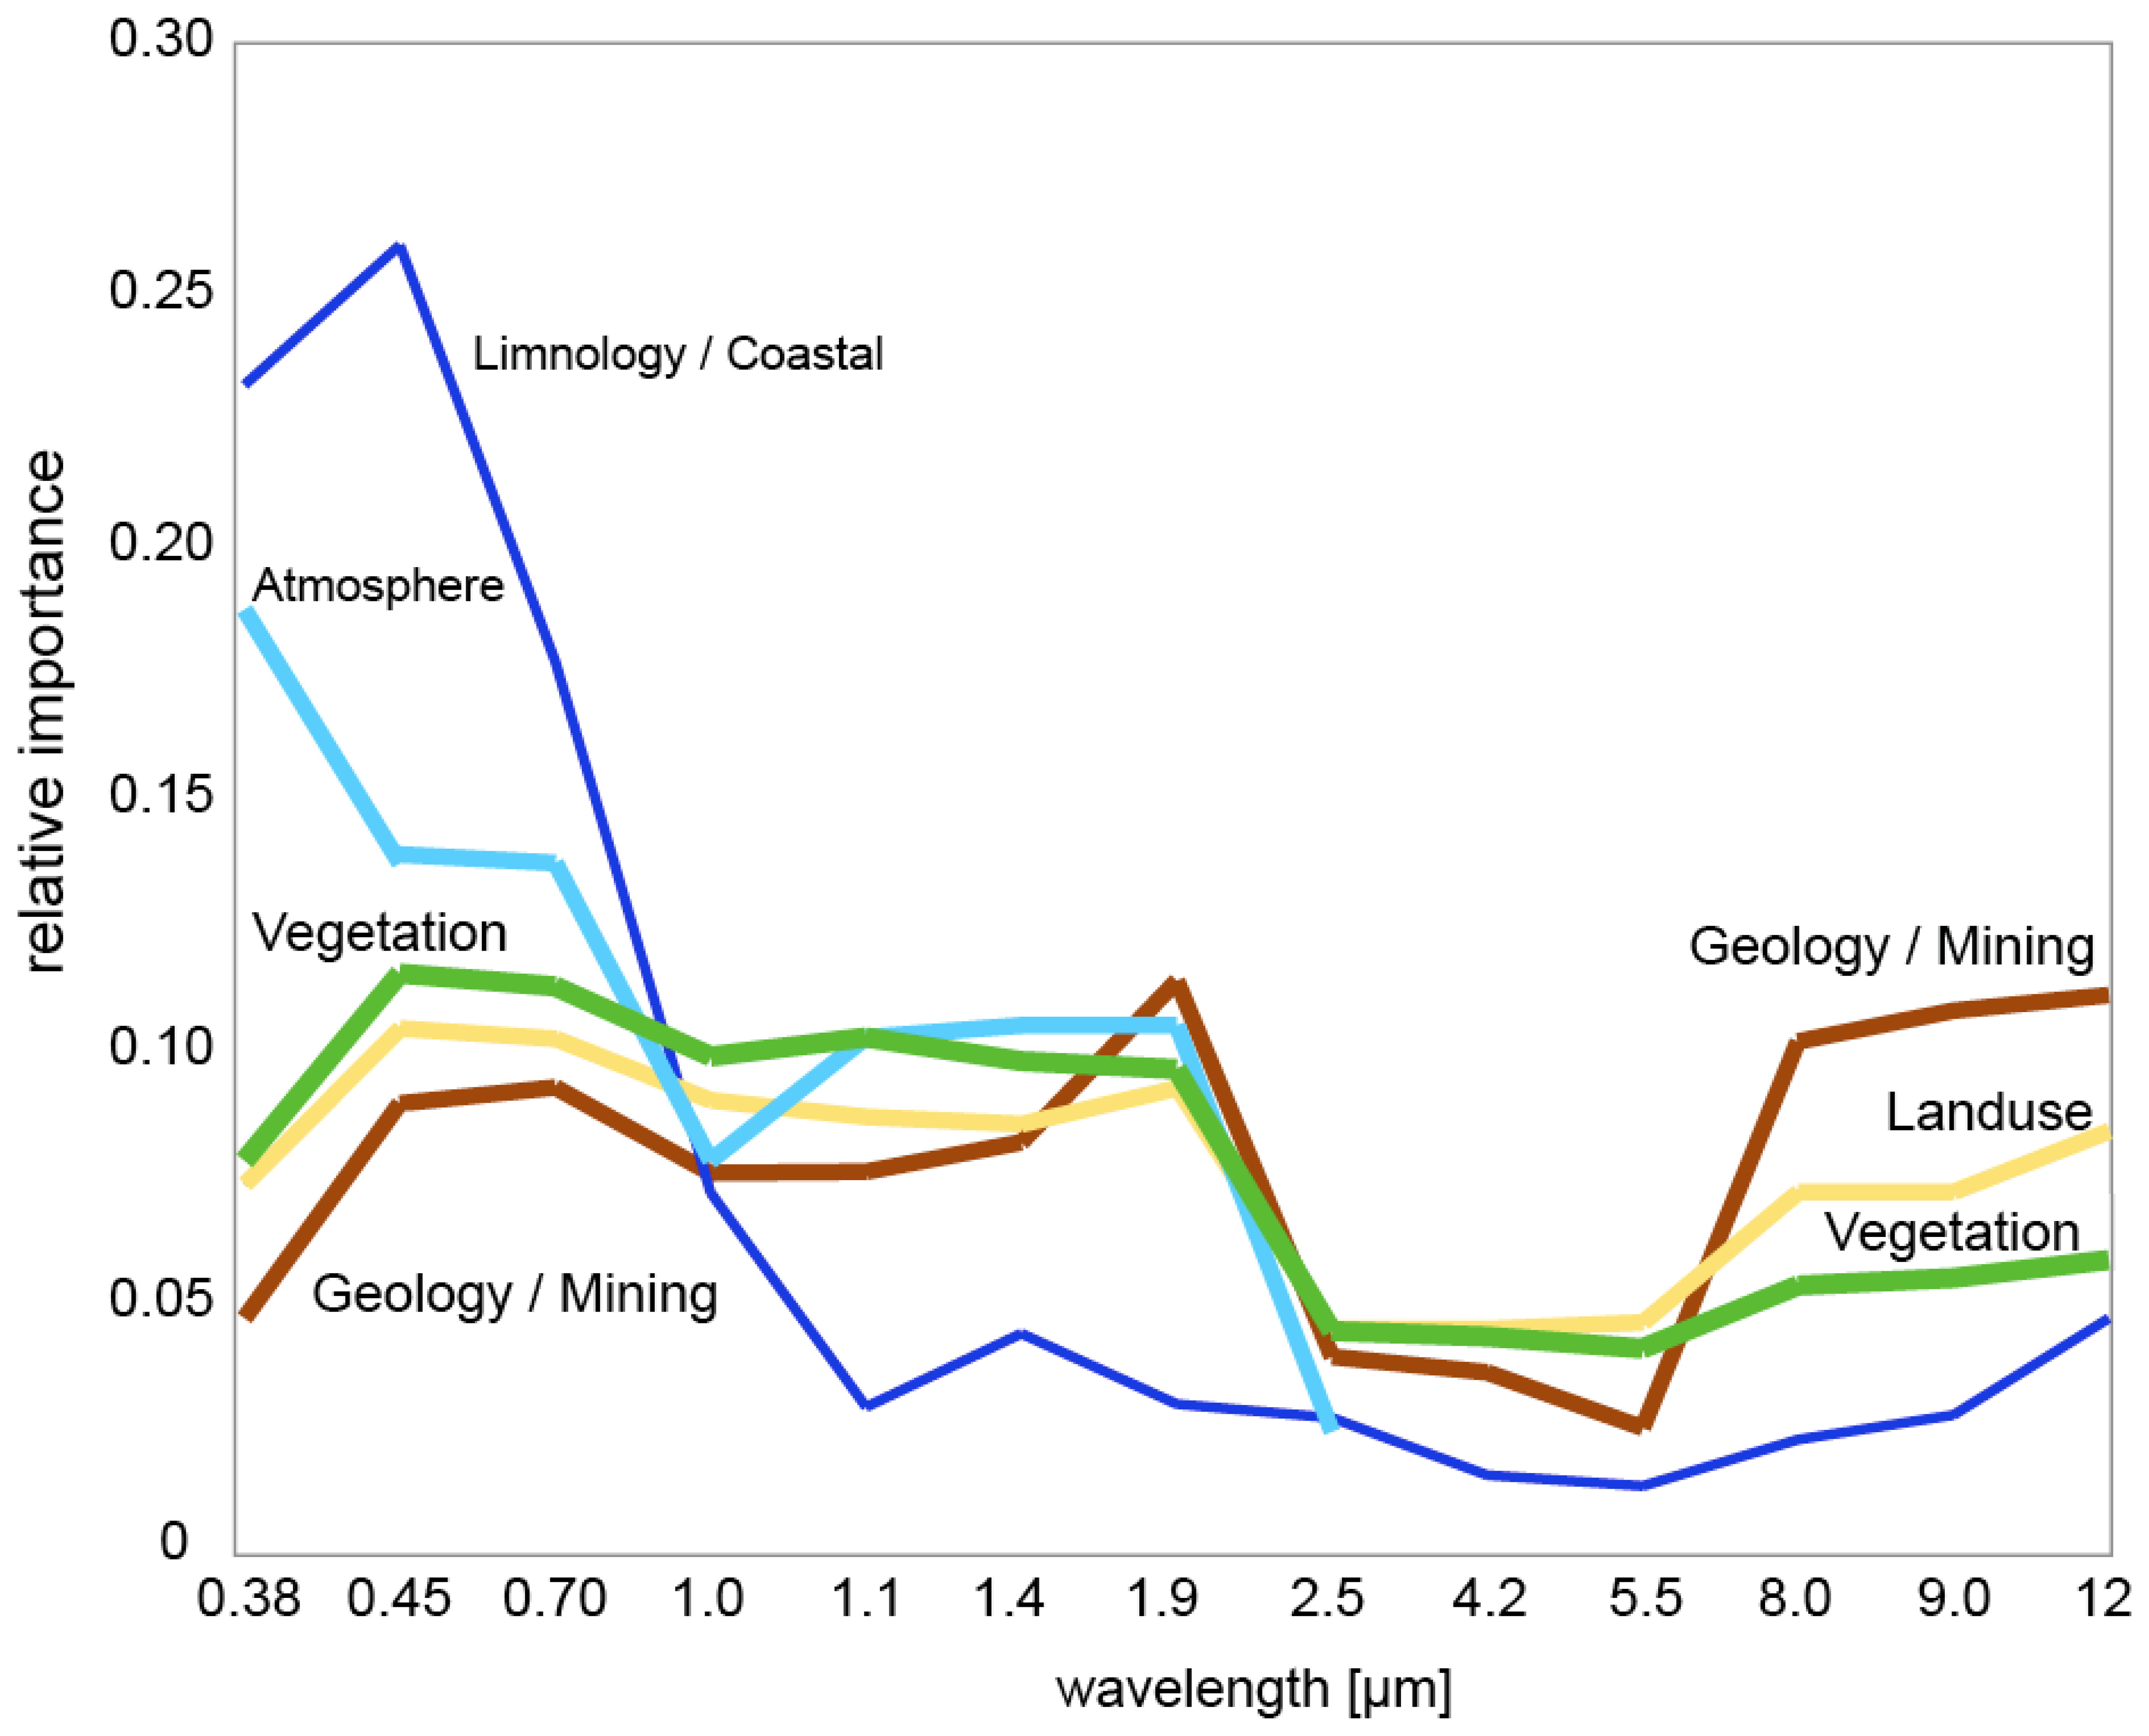
The performance of the second spaceborne sensor CHRIS data product is slightly inferior, although its data is even available free of charge for research projects. Here the underperformance in A and B are significant due to the limitation of the sensor in the VNIR region. As shown in
Figure 4, the average user (working in the research area vegetation) requires HSI data with bands in the VNIR and SWIR region. This is also why CASI-3 data receive less value when compared with data from sensors covering the entire VNIR-SWIR spectral range.
AHS and ARES get slightly better values (0.23) for the Image-based Properties (A) than APEX and HYSPEX (0.22). This originates in the supplementary spectral region that the two sensors cover, the thermal infrared.
Table 2 shows that ARES performs better than APEX for geology applications, since the thermal infrared is very important for geological research, even if less important for other applications.
AVIRIS is less important for the user community in Europe largely because the sensor rarely gets deployed on the European side of the Atlantic Ocean. The properties of AISA data underperform compared to the counterparts for the image-based properties (A) and the ergonomic properties (B), because of the inferior spectral calibration (accuracies of 2-6 nm) and non-existence of Level 2 and 3 data products.
4.2 Absolute Values
In contrast to relative values, the absolute values become clear requirements (instead of priorities), representing benchmarks from which point a certain objective can be regarded as fulfilled (see also
Figure 1). An extract of absolute values retrieved from the VBA for the
image-based properties is given in
Table 4. These values reflect the user requirements in all possible dimensions of the data:
The demand for the number of spectral bands ranges from 200 to 3000 over the entire spectral region (VNIR-TIR). Whereas agriculture, limnology, land-use and vegetation users are satisfied with 200 to 300 bands, the geological, atmospheric and some vegetation applications explicitly need more spectral bands for worthwhile research. Unfortunately for atmospheric applications, the absolute values differ widely. It was discovered after discussion with experts in the atmospheric group that observation requirements heavily depend upon the observation target (ranging from only a few spectral bands for aerosol studies to a huge number of bands for trace gas retrieval) and purpose (spatially coarse resolution for global, and high for urban observation). Due to this as well as the fact that the number of experts evaluating the QUN was very limited, the absolute values represent just the mean of the given figures. Here definitely more research is needed.
For the vegetation group another interpretation problem occurred. For forestry, agriculture and vegetation, the absolute values diverged greatly. The problem was discussed with some experts, resulting in an interesting interpretation: vegetation applications should not be subdivided in forestry and agriculture, but in two further interest groups: 1) a bio-chemical group (Group-1), with a main interest in high spectral and spatial resolution, and 2) a “classification” oriented vegetation group (Group-2), interested in a relatively broad spectral (< 30 nm) and lower spatial (10-30 m) resolution. Both groups see their respective SNR requirement in the range of 450 in the VNIR spectral band. The corresponding re-calculated values are depicted in
Table 4.
In conclusion, the absolute values in
Table 4 show that the required spectral resolution in the VNIR ranges between 0.05 and 30 nm, in the SWIR between 0.2 and 40 nm and in the MIR/TIR from 4 to 400 nm. The table also shows that the required spectral resolution for the application geology is much higher than for all other applications (except of the atmospheric group). The spatial resolution is expected to be between 4 and 20 meters in the VNIR and SWIR and between 10 and 30 meters in the MIR and TIR for all applications but atmosphere. The requirements for vegetation and geology are very similar, asking for a SNR of 400-500 in the VNIR. In contrast limnological and atmospheric applications need higher SNR values of 700 and 1500.
5. Conclusion
Ever since the first steps initially taken over 30 years ago, HSI applications and technology have demonstrated high potential. Today, HSI research is indispensable over a wide range of different applications areas, such as studies involving the atmosphere, vegetation, land-use, geology/mining, and limnology/coast zone research. However, it has become clear that further important steps must be undertaken for generating HSI products that better fulfill user requirements e.g., fully traceable uncertainties, operational data acquisition, and low data costs. Such development steps are urgently needed to account appropriately for the complex interaction between solar and Earth radiation and surface structures that can therefore lead to a better definition of related models for climate, hydrodynamics and ecology.
In order to better understand what that might entail, especially when focusing on HSI infrastructure and data delivery, the HYRESSA team analyzed European HSI user requests. Within an EC financed project, a Questionnaire of User Needs (QUN) was produced and distributed within a user community of actively practicing users/experts in HSI research. 74 individual researchers from 14 European countries provided relevant and important input by answering detailed questions about current HSI data and by giving an appropriate prediction of future HSI activities. In order to evaluate the data, Value-Benefit Analysis (VBA) was applied to achieve highly transparent and traceable answers.
It has been demonstrated – partly in detail – that a VBA is a suitable method for analyzing user needs and supporting the sensor/data specification-building process. The advantage of VBA is its ease of handling once the objective tree is accurately established. This advantage results in a comprehensive and traceable evaluation. However, one drawback is the large effort required in realizing such an analysis because the level of detail is extremely high. This may result in the conflict that not every detail is covered by a corresponding sensor data parameter.
Finally, the result of the VBA shows that HSI users have very individualistic preferences over how HSI data should be structured and distributed in order to make use of the data for their specific research. However the VBA – for the first time – provides individual preferences in detail, which enables a data provider to define requirements for HSI data and its corresponding EU infrastructure.
Acknowledgments
The authors would like to express their gratitude to all those who made this analysis possible: the 74 HSI experts who returned the QUN, the sensor data specialists providing HSI data characteristics (e.g., I. Baarstad, R. Choi, I, McCubbin, M. Koskela), the thinking & working team at RSL (K.I. Itten, B. Seiler, J. Brazile and 20 Geography Students) and VITO (J. Everaerts, S. Adriaensen, K. Meuleman) for the never-ending discussions and improvements, and the further members of the HYRSSA team, i.e., A. Müller and S. Holzwarth (DLR-DFD), H. Kaufmann and S. Chabrillat (GFZ Potsdam), M. Schaepman and L. Kooistrat (Wageningen University), E. De Miguel Llanes and J.A. Gómez Sánchez (INTA), Z. Malenovsky (ISBE ASCR), M. Mõttus (Tartu Observatoorium), P. Pellikka (University of Helsinki), T.J. Malthus (University of Edinburgh).
The investigation was carried out under EC contract FP-6-2004-Infrastructure-6 No. 026194.
References
- FP6-2004-Infrastructures-6. Contract Number 026194. http://www.hyressa.net.
- Reusen, I. and the HYRESSA Team. Towards an improved access to hyperspectral data across Europe (HYRESSA). 5th EARSeL Workshop on Imaging Spectroscopy, Bruges, Belgium, 23.-25. April 2007.
- Modello, Ch. ASPRS 10 Years Industry Forecast Phase IV Result Preview, ASPRS 2006 Annual Conference, Reno, NV.
- Goetz, A.F.H. Imaging spectrometry for earth remote sensing. Science 1985, 228, 1147–1153. [Google Scholar]
- Green, R.O.; Eastwood, M.L.; Sarture, C.M.; Chrien, T.G.; Aronsson, M.; Chippendale, B.J. Imaging spectroscopy and the airborne visible/infrared imaging spectrometer (AVIRIS). Remote Sensing of Environment 1998, 65, 227–248. [Google Scholar]
- Folkman, M.A.; Pearlman, J.; Liao, B.L.; Jarecke, P.J. EO-1/Hyperion hyperspectral imager design, development, characterization, and calibration. SPIE; 2001; 4151, pp. 40–51. [Google Scholar]
- Cutter, M.A. A Small Satellite Hyperspectral Mission. 4S Symposium Small Satellites, Systems and Services, La Rochelle France, 20.-24. September 2004; p. SP571.
- Kaufmann, H.; Segl, K.; Chabrillat, S.; Hofer, S.; Stuffler, T.; Mueller, A.; Richter, R.; Schreier, G.; Haydn, R.; Bach, H. EnMAP A Hyperspectral Sensor for Environmental Mapping and Analysis. IGARSS Geoscience and Remote Sensing Symposium; 2006. [Google Scholar]
- Nieke, J.; Itten, K.I.; Debruyn, W. and the APEX team. The Airborne Imaging Spectrometer APEX: from concept to realization. Proceedings of 4th EARSeL Workshop on Imaging Spectroscopy, Warsaw; 2005. [Google Scholar]
- Müller, A.; Richter, R.; Habermeyer, M.; Mehl, H.; Dech, S.; Kaufmann, H.J.; Segl, K.; Strobl, P.; Haschberger, P.; Bamler. 2004. ARES: a new reflective/emissive imaging spectrometer for terrestrial applications. SPIE; 2004; 5574, pp. 120–127. [Google Scholar]
- Zangemeister, C. Nutzwertanalyse in der Systemtechnik-Eine Methodik zur multidimensionalen Bewertung und Auswahl von Projektalternativen. 1974. [Google Scholar]
- Fernández-Renau, A.; Gómez, J.A.; de Miguel, E. The INTA AHS system. SPIE; 2005; 5978, pp. 471–478. [Google Scholar]
- Baarstad, I.; Løke, T.; Kaspersen, P. ASI – A new airborne hyperspectral imager. Proceedings of the 4th EARSeL Workshop on Imaging Spectroscopy – New Quality in Environmental Studies, Warsaw, Poland; 2005. [Google Scholar]
- Babey, S.K.; Anger, C.D. Compact airborne spectrographic imager (CASI): a progress review. SPIE; 1993; 1937, pp. 152–163. [Google Scholar]
- Bärs, R.; Watson, L.; Weatherbee, O. AISA as a Tool for Timely Commercial Remote Sensing. 4th Int. Airb. R. S. Conf. and Exh. ERIM, Ottawa, CA; 1999; I, pp. 239–246. [Google Scholar]


