Article

Cross-Reactive Sensor Array for Metal Ion Sensing Based on Fluorescent SAMs

Department of Supramolecular Chemistry and Technology, MESA+ Institute for Nanotechnology, University of Twente, P.O. Box 217, 7500 AE Enschede, The Netherlands
*
Author to whom correspondence should be addressed.
Sensors 2007, 7(9), 1731-1746; https://doi.org/10.3390/s7091731
Submission received: 20 August 2007 / Accepted: 4 September 2007 / Published: 5 September 2007
(This article belongs to the Special Issue Supramolecular Sensors)

Abstract

:
Fluorescent self assembled monolayers (SAMs) on glass were previously developed in our group as new sensing materials for metal ions. These fluorescent SAMs are comprised by fluorophores and small molecules sequentially deposited on a monolayer on glass. The preorganization provided by the surface avoids the need for complex receptor design, allowing for a combinatorial approach to sensing systems based on small molecules. Now we show the fabrication of an effective microarray for the screening of metal ions and the properties of the sensing SAMs. A collection of fluorescent sensing SAMs was generated by combinatorial methods and immobilized on the glass surfaces of a custom-made 140 well microtiter-plate. The resulting libraries are easily measured and show varied responses to a series cations such as Cu2+, Co2+, Pb2+, Ca2+ and Zn2+. These surfaces are not designed to complex selectively a unique analyte but rather they are intended to produce fingerprint type responses to a range of analytes by less specific interactions. The unselective responses of the library to the presence of different cations generate a characteristic pattern for each analyte, a “finger print” response.

1. Introduction

Despite several decades of research in optical sensor technology, there is still a substantial need for new sensing materials that can be applied for environmental contaminants, food industry and medical analysis.[1] The conventional approach to chemical sensing, inspired by the “lock and key” paradigm of molecular recognition,[2] is to prepare a different sensor for each analyte of interest (one sensor–one analyte approach). This approach has many drawbacks. First, the need to create absolute selectivity for specific analytes is a difficult task. Significant rational design, computer modeling, and trial and error testing is required to optimize the ability of the receptor to recognize the guest analyte. Second, the number of sensors grows linearly with the number of analytes to be measured. An emerging different approach is the fabrication of cross-reactive sensor arrays,[3],[4],[5],[6] inspired by the mammalian (natural) way of sensing. In the olfactory system a limited number of cross-reactive receptors that are not highly selective generate a response pattern that is perceived by the brain as a particular odor.[7],[8],[9] The large number of response pattern combinations leads to a broadly responsive system able to recognize and detect thousands of distinct odors, including complex mixtures.[10],[11] The number of odors that can be detected is limited only by the number of unique receptor patterns that can be generated and recognized. Artificial cross-reactive sensors are composed of arrays of sensing systems which are not highly selective, but the combined signal response from the array produce a characteristic picture (fingerprint) of the analyte. Identification of the analytes is achieved by a variety of chemometrics tools for pattern-recognition.[12],[13],[14]
Since 1982, when Persaud and Dodd first reported chemical sensing based on arrays of cross-reactive conductive polymer sensors,[15] a variety of arrays have been fabricated employing different chemical interaction, materials, and strategies such as the use of conductive polymers,[16] conductive polymer/carbon-black composites,[17] modified tin oxide sensors,[18],[19] polymer coated surface acoustic wave devices,[20],[21] quartz crystal microbalances[22] dye-doped polymer matrixes,[23],[24],[25],[26],[27] molecular imprinted polymers,[28] colorimetric vapor sensors with metalloporphyrins immobilized in thin layers of silicagel,[29],[30],[31] colorimetric and fluorescence changes of receptor and indicator molecules covalently attached to polymeric microspheres in micro machined cavities,[32],[33],[14] and many others.[34],[35],[36],[37],[38] Even an optical imaging fiber-based recombinant bacterial biosensor has been fabricated.[39] The potential of organic self-assembled monolayers (SAMs) as sensing interfaces for array fabrication was outlined by Crooks and Ricco in 1998.[20] The synthetic flexibility of the organic monolayers implies that they can be tailored to exhibit a high level of chemical independence and structural order. Each individual type of monolayer in the array responds to an analyte or class of analytes in a distinct manner. Because of the inexpensive procedures to create these materials, families of substrates with a range of chemical properties for analyte recognition can be easily generated using simple combinatorial methods.[40],[41],[42],[43],[44],[45],[46] Thicker materials such as polymers provide a much larger quantity of receptors than SAMs. Thus, polymers-based optical sensors have an enhanced sensitivity compared to monolayer-based optical sensors.[47] However, they have a limiting factor in terms of response rate of the signaling process, which is the chemical and physical permeability of the material and they are commonly inappropriate for real time applications.[47] SAMs generally provide very fast responses since all the receptors are exposed to the surface liquid interface and they are only 1-3 nm thick.
Here we use a combinatorial sensing methodology, earlier developed by us, for ion sensing[48],[40] which relies on the random sequential attachment of different fluorophores and small ligand molecules on a SAM formed on a glass substrate.[40] We report a new approach to high through put screening of the fluorescent SAMs metal ion sensing properties. A library of fluorescent SAMs on glass has been confined on a microtiter plate. The directional preorganization inherent in the SAM and the random lateral distribution brings the ligand groups and the fluorophores in close enough proximity that the ligand-analyte interaction is communicated to the fluorophore, resulting in a modulation of the fluorescence intensity. Generally, these SAMs-based sensing materials are not highly selective, which implies a need for cross-reactive array-based sensor devices. Depending on the interaction between the metal ion and the fluorescent SAM, the fluorescence emission of the functionalized surface might be enhanced or quenched. Therefore, modulation of the initial fluorescence will differ depending on the layer composition and the applied analyte.[49]
The sensing array was prepared by the parallel synthesis of an amino-terminated SAMs functionalized with different fluorophore-ligand pairs in the bottom glass of different wells in a microtiter plate (MTP). The physical immobilization of the sensing layers on the wells of an MTP enables straightforward preparation of the arrays and it enables the rapid screening of large sets of libraries.[26] The result is a sensing array which is able to generate a characteristic fingerprint type of response with a single fluorescence “snapshot” allowing for the visual identification of different analytes.
In this paper the power of this novel method is demonstrated for the analysis of different metal cations. The overall unselective responses of the array components in the presence of different cations generates a characteristic fluorescent pattern for each analyte. We believe that this approach for the generation of sensing materials based on fluorescent SAMs can be extended to a large number of different analytes such as small organic molecules.

2. Results and Discussion

A collection of 21 sensing self-assembled monolayers, generated by parallel combinatorial methods was immobilized on glass surfaces of the different wells of a custom-made microtiter plate (MTP) (Figure 1). The MTP was custom designed with dimensions of 75 x 25 mm2 to allow analysis of the array by commercial fluorescence microarray scanners. It contains 140 wells, of 3 mm diameter which can be filled with a volume up to 7 μL.[50]
The general procedure for the fabrication of the sensing monolayers on the glass surface of the wells involves the functionalization of the MTP surface with the amino terminated SAM N-[3-(trimethoxysilyl)propyl]ethylenediamine (TPEDA) and its sequential modification with a different fluorophore-ligand molecule pair in each well (Figure 2). Commercially available amino-reactive fluorescent probes (F) (λex= 500-550 nm, λem>550 nm) and ligands (R) were used, allowing the direct covalent attachment of the array building blocks to the MTP wells (Figure 2a).
Figure 2 depicts the three-step synthesis and distribution of the parallel combinatorial library of sensing monolayers in the MTP wells. First the amino terminated monolayer (TPEDA, Figure 2a) is formed by silanization of the well glass surface by immersion of the MTP in a solution of N-[3-(trimethoxysilyl)propyl]ethylenediamine) in toluene. Sequentially three acetonitrile solutions each containing a different amino-reactive fluorophore (Figure 2b), TAMRA (5-(and-6)-carboxytetramethylrhodamine, succinimidyl ester (5(6)-TAMRA, SE) *mixed isomers*) (TM), TRITC (tetramethylrhodamine-5-(and-6)-isothiocyanate (5(6)-TRITC) *mixed isomers*) (T), or Lissamine (Lissamine™ rhodamine B sulfonyl chloride *mixed isomers*) (L), were pipetted on different columns of the MTP affording fluorescent monolayers TM0, T0, and L0. Six solutions, each containing a different amino-reactive ligating molecule (1-6), p-isopropyl phenyl isocyanate, hexyl isocyanate, phenyl isothiocyanate, hexanoyl chloride, p-propyl benzoyl chloride and phenyl isocyanate, were pipetted in different rows. The covalent attachment of the complexing groups onto the fluorescent monolayers results in an array of 21 different sensing monolayers[51] (TM0-TM6, T0-T6, L0-L6). On the top row, no complexing molecule was added; therefore the layers TM0, L0, T0, contain amino groups as ligating functionalities.
To avoid contamination with unwanted fluorophores and ligating molecules from neighboring wells, the MTP was rinsed after each synthesis step with propylamine (0.1 M, acetonitrile) to remove the excess reactant. Figure 3 shows the fluorescence microscopy images of two neighboring wells, one functionalized with L0 SAM, and the other functionalized only with TPEDA SAM. The images clearly show that the fluorophores have not spread into neighboring wells after this rinsing procedure.
To control the reproducibility of the measurement and the quality of the data, every monolayer in the analysis library was made in triplicate (in consecutive wells) and in duplicate in the reference library (Figure 3b). To facilitate the data quantification the MTP was divided in two parts (Figure 3a). In both parts an identical monolayer library was made. The first part was used as a reference and the second part, the analysis library, was incubated with the corresponding analyte solutions. The fluorescence intensity of both libraries was subsequently measured. In total 105 wells were functionalized with 21 different sensing systems. Figure 4 shows the plot of the fluorescence intensity of each system (in triplicate). Analysis of the data indicated good inter-well reproducibility.
To demonstrate the generality of this sensing scheme, the metal ions were chosen to represent a wide range of ionic species. The response of the above described sensor array to Ca2+, Cu2+, Co2+, Zn2+, or Pb2+ was studied. Depending on the interaction between metal ion and SAM, the fluorescence emission can be enhanced or quenched.[49] First, the MTP was incubated with a 10-4 M acetonitrile solution of the perchlorate salts of Ca2+, Cu2+, Co2+, Pb2+, and Zn2+, subsequently rinsed gently with dichloromethane and dried with a nitrogen stream. Afterwards, the fluorescence intensity of each well of the reference and of the analysis libraries was measured using a laser scanning confocal fluorescence microscope (LSCM).[52] Qualitative and quantitative analysis of the microtiter plate response in the presence of the analytes are both feasible. The fluorescence intensity of each well was measured by LSCM and one colored image was generated for each well.[53] The ratio of fluorescence intensities of the reference and the analysis library was calculated providing a quantitative measure of the analyte influence in each well (see experimental part for details).[54] The interaction of each metal ion with the different sensing wells results in an individual fluorescent signal for each well. The combination of the 21 individual responses generates a characteristic pattern signature (fingerprint) for each analyte. Figure 5 shows the fluorescence intensity of each MTP well after incubation with the metal ion solutions. It can be clearly seen that each analyte in the array produces a unique fluorescent pattern. In this way each analyte is easily distinguished from the others.[55]
Figure 6 depicts the changes in fluorescence intensity of each sensing system of the MTP upon analyte complexation. Quantification of the data was done by analyzing the fluorescence intensity of each well before and after exposure to the analyte.
As mentioned before, the MTP used to form the monolayer array had the dimensions of a standard microscope slide (75 × 25 mm), suitable for measurements in commercial fluorescence microarray reader scanners. Therefore, a commercial scanner was used to read the microsensor array allowing imaging of the whole array in a shorter time. This compact bench-top scanner combines easy-to-use features with advanced optics and solid-state laser technology necessary to provide rapid scan times, image quality, and data reproducibility for accurate and reliable measurements. The simplicity of the analysis technology should enhance the performance of our sensing scheme, allowing fast and accurate measurements. To prove whether the sensing SAMs array can be measured using a standard fluorescence array scanner, sensing and recycling experiments were performed. First a microtiter plate was functionalized with the previously described sensitive SAMs library comprised of 21 different sensing monolayers (for library composition see Figure 2). The monolayers were arranged in the MTP according to the pattern given in Figure 3b (analysis library). Every monolayer was prepared in triplicate in three consecutive wells to evaluate the reproducibility of the measurements. The MTP was imaged before incubation with the analytes to register the initial fluorescence intensity of each well. Subsequently, the plate was incubated with Cu2+ (10−4 M, acetonitrile), and scanned again.[52] Figure 7 shows the pictures of the plate functionalized with the SAM array before and after Cu2+ addition. The scanning of the microtiter plate takes less than 40 s.[57] The fluorescence intensity patterns of the functionalized MTP after exposure to the analyte provided a signature characteristic for the analyte comparable with that obtained previously using the confocal microscope. The fluorescence laser scanner allows imaging a sensing SAM array in a short time what constitutes an extra advantage in the screening methodologies for sensor arrays discussed in this paper.
Recycling of this MTP confined sensing array was also studied using the laser fluorescence scanner as imaging set up. A functionalized MTP containing the SAM library described in Figure 2, was incubated with Co2+ (10−4 M, acetonitrile) and produced the fluorescence pattern (Figure 7). Subsequently, the MTP was rinsed with a solution of the metal scavenger, EDTA (ethylenediaminetetraacetic acid, 0.01 M, in H2O solution). Upon rinsing with the EDTA solution the fluorescence intensity of each monolayer increased, indicating that almost all metal ions had been removed from the array. Subsequent exposure of the rinsed MTP to Co2+ resulted in almost the same fluorescent pattern found after the initial addition of Co2+. Thus, the complexation is reversible and the surface can be easily recycled for further analysis.
In conclusion, arrays of 21 different fluorescent sensing monolayers have been directly generated by parallel combinatorial synthesis on the wells surface of glass microtiter plates. The collection of the unselective response of the twenty one different monolayers in the presence of the different metal cations generates a characteristic fluorescent pattern, a “fingerprint” of each analyte in the array. The array was reused after removal of the analytes by washing with EDTA. The monolayers responded extremely fast to the presence of the analytes, and the array could be easily screened by laser confocal microscopy and microarray reader fluorescence scanner.
The results herein demonstrate the successful application of parallel combinatorial methods to generate different sensing SAMs covalently immobilized in the wells of a glass microtiter plate and its application to high through put screnning of sensing materials. We envision their potential for the fabrication of cross-reactive fluorescent sensor arrays. Using the array format and screening tools described in this paper, we are currently working on the continuous sensing of metal ions and the generation of universal arrays containing sensitive probes for identification of mixtures of analytes using chemometric tools.

3. Experimental Section

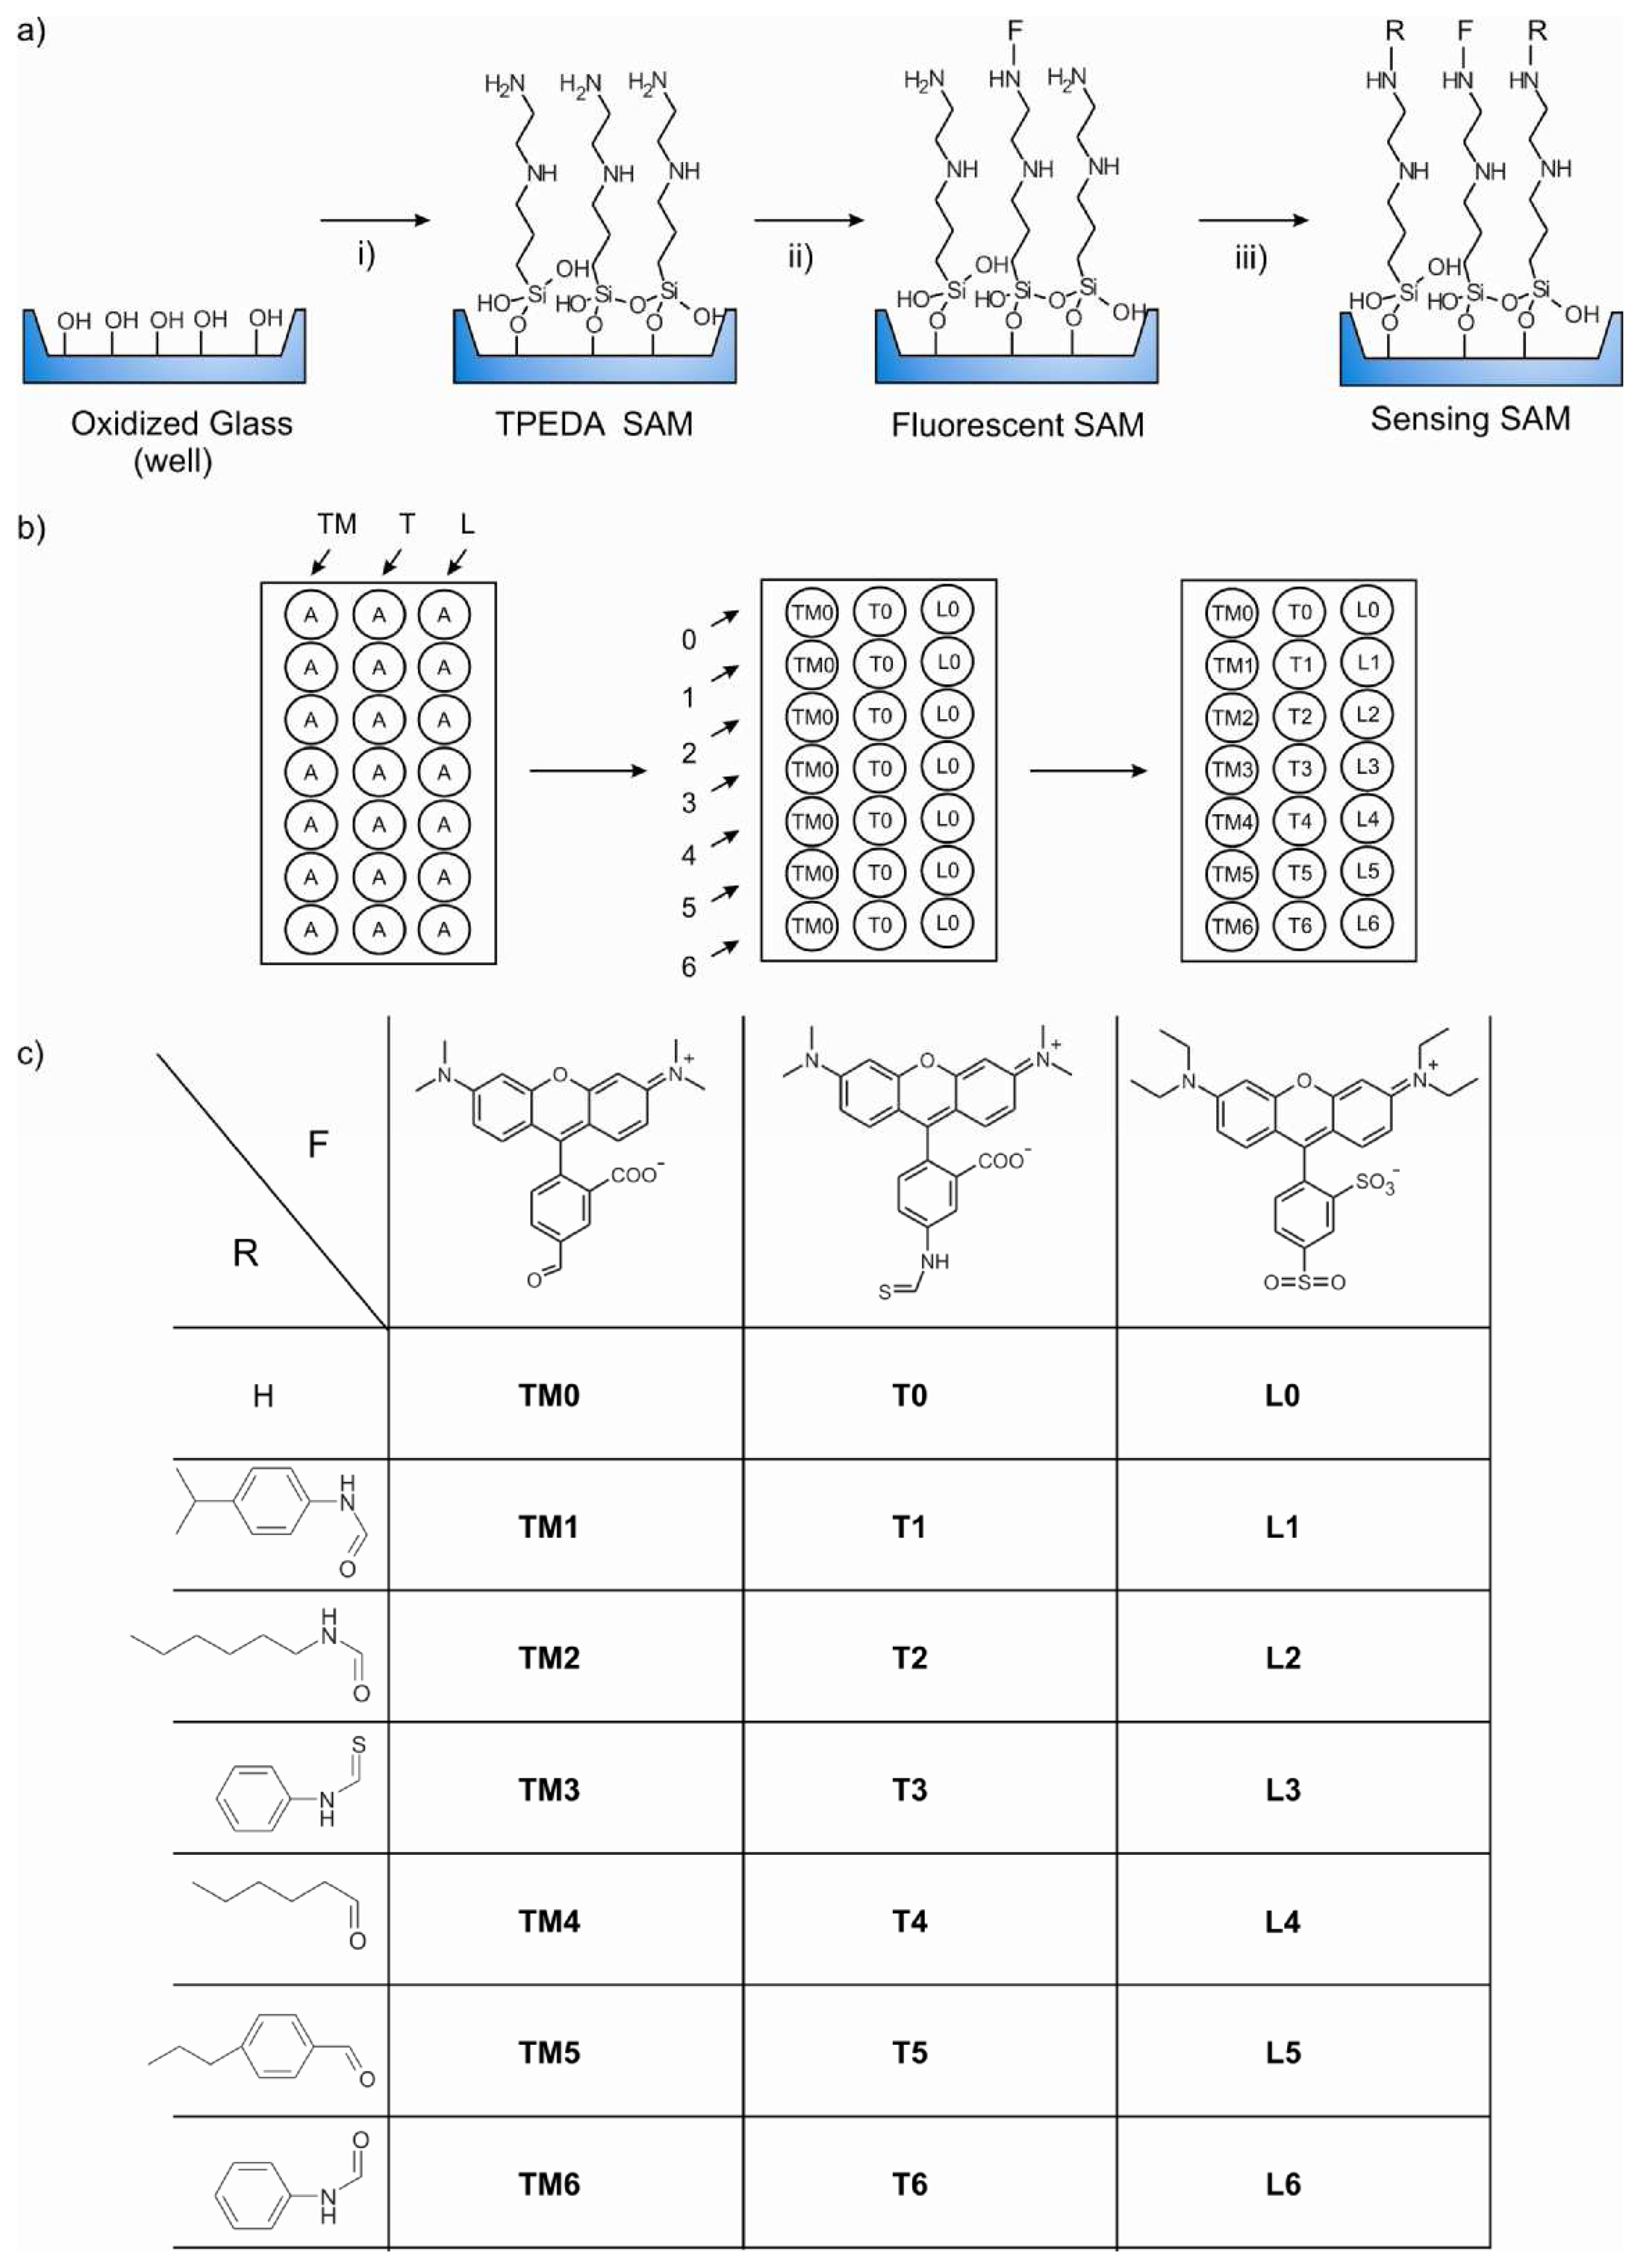
Monolayer microarray fabrication

All glassware used to prepare the layers was cleaned by sonicating for 15 minutes in a 2% v/v Hellmanex II solution in distilled water, rinsed four times with high purity (MilliQ, 18.2 MΩcm) water, and dried in an oven at 150º C. The substrates, custom made 140 well glass microtiter plates (MTP) were cleaned for 15 minutes in piranha solution (concentrated H2SO4 and 33% aqueous H2O2 in a 3:1 ratio. Warning: Piranha solution should be handled with caution: it has been reported to detonate unexpectedly). They were then rinsed several times with high purity (MilliQ) water, and dried in a nitrogen stream immediately prior to performing the formation of the monolayers.

Synthesis of TPEDA monolayers in the MTP wells

Formation of the N-[3-(trimethoxysilyl)propyl]ethylenediamine SAM TPEDA was achieved in a glovebox under an atmosphere of dry nitrogen. The freshly cleaned MTP was immersed in a 5 mM solution of N-[3-(trimethoxysilyl)propyl]ethylenediamine, in dry toluene (freshly distilled over sodium) for 3.5 h. After the MTP was taken from the solution, it was rinsed twice with toluene (under nitrogen atmosphere) to remove excess silane and avoid polymerization. The MTP was then removed from the glovebox and rinsed with ethanol and dichloromethane to remove physisorbed material. The following protocol was repeated twice: stirring of the MTP in a beaker filled with EtOH, then rinsing with a stream of EtOH, followed by stirring in CH2Cl2, then rinsing with a stream of CH2Cl2. The MTP was then dried under an air stream. The result is the complete coating of the MTP surface with the TPEDA monolayer.

Immobilization of the fluorophores: Synthesis of the TM0, L0, and T0 SAMs

The attachment of the fluorophores onto the TPEDA-functionalizaed MTP wells was achieved by pipetting in the corresponding wells a solution (5 μL, 0.1 mM, acetonitrile) of the fluorophore TAMRA (5-(and-6)-carboxytetramethylrhodamine, succinimidyl ester (5(6)-TAMRA, SE) *mixed isomers)) (TM), fluorophore Lissamine (L) (Lissamine rhodamine B, sulfonyl chloride) and fluorophore TRITC (T) (tetramethylrhodamine-5-(and-6)-isothiocyanate(5(6)-TRITC), *mixed isomers) to yield layers TM0, L0 and T0, respectively. Triethylamine, 500 μL, was added in all the solutions to avoid protonation of the amine groups on the TPEDA SAM. The plate was kept for 3h in an acetonitrile saturated atmosphere to avoid evaporation. After reaction the plate was immersed in propylamine (0.1 M, acetonitrile). Subsequently, the plate was gently rinsed with CH2Cl2 and dried under an air stream.

Immobilization of the ligands: Synthesis of the layers L1-L6, T1-T6, and TM1-TM6

The corresponding microtiter plate wells functionalized with the fluorescent monolayers T0, TM0, and L0 were filled with 5 μL of a solution of 0.1 mL of p-isopropyl phenyl isocyanate, hexyl isocyanate, phenyl isothiocyanate, hexanoyl chloride, p-propyl benzoyl chloride and phenyl isocyanate in 20 mL of acetonitrile with 100 μL of triethyelamine, to afford layers T1-T6, TM1-TM6, and L1-L6, respectively. The plate was kept for 3h at room temperature in a saturated acetonitrile atmosphere to avoid evaporation. The reactants were taken out of the wells to avoid spreading of the reactive species to other wells. Subsequently the plate was sonicated for 2 min in a 0.1 M acetonitrile solution of propylamine, for 2 min in CH3CN, for 2 min in EtOH, and for 2 min in CH2Cl2. Finally, the plate was dried under an air stream.

Metal ion sensing with the microtiter plate

Ca2+, Co2+, Cu2+, Zn2+, and Pb2+ sensing with the confined monolayer array was measured using the following protocol: immersion of the analysis library of the plate in a beaker filled with a 10-4 M acetonitrile solution of the corresponding analyte for 5 min followed by gentle rinsing of the plate first in a beaker filled with CH2Cl2 and subsequently with a stream of fresh CH2Cl2, and final drying of the plate under an air stream. Subsequently, fluorescent images of the plate were recorded with laser confocal microscopy (LSCM) and fluorescence scanner (see details below).

Imaging Instrumentation

Laser scanning confocal microscopy

Confocal microscopy images of the functionalized wells of the glass microtiter plate were taken on a Carl Zeiss LSM 510 microscope. Images were acquired using a confocal laser scanning microscope equipped with an argon laser module (Carl Zeiss Inc., Thornwood, NY) using a 10×0.25-na objective. The light was focused through the glass plate on the top side of each well. The image is collected using the focus that gives the maximum initial fluorescence intensity. All the fluorophores were excited at 543 nm with a HeNe laser. The following parameters were kept constant for all types of monolayers: pinhole (17.7 μm), image size (1024 x 1024 pixels), scanning speed (5) and data depth (12 bit). Depending on the initial intensity of the fluorescent monolayers and the expected response in the presence of the analytes (enhancement or quenching of the fluorescence intensity) the following settings were used: for sensing of Ca2+, Pb2+ and Zn2+, the detector gain was set to 774, 750 and 772 for TAMRA, TRITC, and Lissamine containing layers, respectively; the amplifier offset was set to -0.115, -0.136 and -0.057 for TAMRA, TRITC, and Lissamine containing layers, respectively; and the amplifier gain was set to 1, 1 and 1.17 for TAMRA, TRITC, and Lissamine containing layers, respectively. For sensing of Cu2+ and Co2+ the detector gain was set to 901, 849 and 822 for TAMRA, TRITC, and Lissamine containing layers, respectively; the amplifier offset was set to -0.071, -0.136 and -0.057 for TAMRA, TRITC, and Lissamine containing layers, respectively; and the amplifier gain was set to 1, 1 and 1.17 for TAMRA, TRITC, and Lissamine containing layers, respectively. The fluorescence was collected on a PMT R6357. All the images were collected in air. For data evaluation, two sets of the same monolayer library were made in a MTP (reference library and analysis library). Only the analysis library was exposed to the analyte. After exposure, an image of each functionalized well of both sets was made and the mean fluorescence intensity of each image was extracted. The average value of the duplicate (in the reference library) and the triplicate (in the analysis library) wells in both libraries was calculated. For data evaluation, the fluorescence intensity of each system in the reference library was set to 0 and compared with the intensity of the corresponding well in the analysis library. The values given in the text are the average of two measurements from two different microtiter plates.

Laser confocal fluorescence scanner

Fluorescence laser scanner images of the monolayer array were obtained with an Affymetrix 428 scanner (Affymetrix, High Wycombe, UK), and the Jaguar Software package (Affymetrix). Excitation light was in all the cases 532 nm. For data evaluation, the plate was scanned before and after analyte addition. The resulting images were analyzed with Imagine 5.0 software (BioDiscovery Inc., El Segundo, CA). Data were further processed. The MTP was placed on the scanner upside down to focus on the bottom part of the wells.

Acknowledgments

The authors are very grateful to Dr. Klass Kok and Prof. Charles Buys and the staff of the Department of Genetics in the University Medical Centre Groningen, for allowing the use of their Affymetrix Scanner facilities and their kind support during the measurements.

References and Notes

  1. Czarnik, A. W. Desperatel Seeking Sensors. Chemistry & Biology 1995, 2, 423–428. [Google Scholar]
  2. Behr, J.P. The Lock and Key Principle, The State of the Art - 100 Years On; Wiley: New York, 1994; Vol. 1. [Google Scholar]
  3. Jurs, P. C.; Bakken, G. A.; Mcclelland, H. E. Computational Methods for the Analysis of Chemical Sensor Array Data From Volatile Analytes. Chem. Rev. 2000, 100, 2649–2678. [Google Scholar]
  4. Doty, R. L. Handbook of Olfaction and Gustation, Neurological Disease and Therapy., 2nd ed.; Marcel Dekker: New York, 2003; Vol. 57. [Google Scholar]
  5. Lavigne, J. J.; Anslyn, E. V. Sensing a Paradigm Shift in the Field of Molecular Recognition: From Selective to Differential Receptors. Angew. Chem., Int. Ed. 2001, 40, 3119–3130. [Google Scholar]
  6. Albert, K. J.; Lewis, N. S.; Schauer, C. L.; Sotzing, G. A.; Stitzel, S. E.; Vaid, T. P.; Walt, D. R. Cross-Reactive Chemical Sensor Arrays. Chem. Rev. 2000, 100, 2595–2626. [Google Scholar]
  7. Stopfer, M.; Jayaraman, V.; Laurent, G. Intensity Versus Identity Coding in an Olfactory System. Neuron 2003, 39, 991–1004. [Google Scholar]
  8. Lundstrom, I. Artificial Noses - Picture the Smell. Nature 2000, 406, 682–683. [Google Scholar]
  9. Shepherd, G. M. Discrimination of Molecular Signals by the Olfactory Receptor Neuron. Neuron 1994, 13, 771–790. [Google Scholar]
  10. Lundstrom, I.; Erlandsson, R.; Frykman, U.; Hedborg, E.; Spetz, A.; Sundgren, H.; Welin, S.; Winquist, F. Artificial Olfactory Images From a Chemical Sensor Using a Light-Pulse Technique. Nature 1991, 352, 47–50. [Google Scholar]
  11. Lancet, D. Olfaction - the Strong Scent of Success. Nature 1991, 351, 275–276. [Google Scholar]
  12. Bishop, C. M. Neural Networks for Pattern Recognition; Bishop, C. M., Ed.; Oxford University Press: Oxford, U.K., 1995. [Google Scholar]
  13. Lyons, W. B.; Lewis, E. Neural Networks and Pattern Recognition Techniques Applied to Optical Fibre Sensors. Trans. Inst. Measurm. Control 2000, 22, 385–404. [Google Scholar]
  14. Wright, A. T.; Anslyn, E. V. Differential Receptor Arrays and Assays for Solution-Based Molecular Recognition. Chem. Soc. Rev. 2006, 35, 14–28. [Google Scholar]
  15. Persaud, K.; Dodd, G. Analysis of Discrimination Mechanisms in the Mammalian Olfactory System Using a Model Nose. Nature 1982, 299, 352–355. [Google Scholar]
  16. Freund, M. S.; Lewis, N. S. A Chemically Diverse Conducting Polymer-Based Electronic Nose. Proc. Natl. Acad. Sci. U. S. A. 1995, 92, 2652–2656. [Google Scholar]
  17. Lonergan, M. C.; Severin, E. J.; Doleman, B. J.; Beaber, S. A.; Grubb, R. H.; Lewis, N. S. Array-Based Vapor Sensing Using Chemically Sensitive, Carbon Black-Polymer Resistors. Chem. Mater. 1996, 8, 2298–2312. [Google Scholar]
  18. Heilig, A.; Barsan, N.; Weimar, U.; Schweizer-Berberich, M.; Gardner, J. W.; Gopel, W. Gas Identification by Modulating Temperatures of SnO2-Based Thick Film Sensors. Sens. Actuators, B 1997, 43, 45–51. [Google Scholar]
  19. Gardner, J. W.; Shurmer, H. V.; Tan, T. T. Application of an Electronic Nose to the Discrimination of Coffees. Sens. Actuators, B 1992, 6, 71–75. [Google Scholar]
  20. Crooks, R. M.; Ricco, A. J. New Organic Materials Suitable for Use in Chemical Sensor Arrays. Acc. Chem. Res. 1998, 31, 219–227. [Google Scholar]
  21. Grate, J. W.; Abraham, M. H. Solubility Interactions and the Design of Chemically Selective Sorbent Coatings for Chemical Sensors and Arrays. Sens. Actuators, B 1991, 3, 85–111. [Google Scholar]
  22. Brunink, J. A. J.; Dinatale, C.; Bungaro, F.; Davide, F. A. M.; Damico, A.; Paolesse, R.; Boschi, T.; Faccio, M.; Ferri, G. The Application of Metalloporphyrins as Coating Material for Quartz Microbalance-Based Chemical Sensors. Anal. Chim. Acta 1996, 325, 53–64. [Google Scholar]
  23. Walt, D. R. Fiber Optic Imaging Sensors. Acc. Chem. Res. 1998, 31, 267–278. [Google Scholar]
  24. Mayr, T.; Liebsch, G.; Klimant, I.; Wolfbeis, O. S. Multi-Ion Imaging Using Fluorescent Sensors in a Microtiterplate Array Format. Analyst 2002, 127, 201–203. [Google Scholar]
  25. Dickinson, T. A.; White, J.; Kauer, J. S.; Walt, D. R. A Chemical-Detecting System Based on a Cross-Reactive Optical Sensor Array. Nature 1996, 382, 697–700. [Google Scholar]
  26. Chojnacki, P.; Werner, T.; Wolfbeis, O. S. Combinatorial Approach Towards Materials for Optical Ion Sensors. Microchim. Acta 2004, 147, 87–92. [Google Scholar]
  27. Mayr, T.; Igel, C.; Liebsch, G.; Klimant, I.; Wolfbeis, O. S. Cross-Reactive Metal Ion Sensor Array in a Micro Titer Plate Format. Anal. Chem. 2003, 75, 4389–4396. [Google Scholar]
  28. Greene, N. T.; Morgan, S. L.; Shimizu, K. D. Molecularly Imprinted Polymer Sensor Arrays. Chem. Commun. 2004, 1172–1173. [Google Scholar]
  29. Suslick, K. S.; Rakow, N. A.; Sen, A. Colorimetric Sensor Arrays for Molecular Recognition. Tetrahedron 2004, 60, 11133–11138. [Google Scholar]
  30. Rakow, N. A.; Suslick, K. S. Novel Materials and Applications of Electronic Noses and Tongues (Vol 406, Pg 710, 2000). MRS Bulletin 2004, 29, 913. [Google Scholar]
  31. Rakow, N. A.; Suslick, K. S. A Colorimetric Sensor Array for Odour Visualization. Nature 2000, 406, 710–713. [Google Scholar]
  32. Goodey, A.; Lavigne, J. J.; Savoy, S. M.; Rodriguez, M. D.; Curey, T.; Tsao, A.; Simmons, G.; Wright, J.; Yoo, S. J.; Sohn, Y.; Anslyn, E. V.; Shear, J. B.; Neikirk, D. P.; Mcdevitt, J. T. Development of Multianalyte Sensor Arrays Composed of Chemically Derivatized Polymeric Microspheres Localized in Micromachined Cavities. J. Am. Chem. Soc. 2001, 123, 2559–2570. [Google Scholar]
  33. Wright, A. T.; Anslyn, E. V.; Mcdevitt, J. T. A Differential Array of Metalated Synthetic Receptors for the Analysis of Tripeptide Mixtures. J. Am. Chem. Soc. 2005, 127, 17405–17411. [Google Scholar]
  34. Ho, C. K.; Hughes, R. C. In-Situ Chemiresistor Sensor Package for Real-Time Detection of Volatile Organic Compounds in Soil and Groundwater. Sensors 2002, 2, 23–34. [Google Scholar]
  35. Zhang, C.; Suslick, K. S. A Colorimetric Sensor Array for Organics in Water . J. Am. Chem. Soc. 2005, 127, 11548–11549. [Google Scholar]
  36. Schauer, C. L.; Steemers, F. J.; Walt, D. R. A Cross-Reactive, Class-Selective Enzymatic Array Assay. J. Am. Chem. Soc. 2001, 123, 9443–9444. [Google Scholar]
  37. Lavigne, J. J.; Savoy, S.; Clevenger, M. B.; Ritchie, J. E.; Mcdoniel, B.; Yoo, S. J.; Anslyn, E. V.; Mcdevitt, J. T.; Shear, J. B.; Neikirk, D. Solution-Based Analysis of Multiple Analytes by a Sensor Array: Toward the Development of an “Electronic Tongue”. J. Am. Chem. Soc. 1998, 120, 6429–6430. [Google Scholar]
  38. Potyrailo, R. A.; Sivavec, T. M. Dual-Response Resonant Chemical Sensors for Multianalyte Analysis. Sens. Actuators, B 2005, 106, 249–252. [Google Scholar]
  39. Biran, I.; Rissin, D. M.; Ron, E. Z.; Walt, D. R. Optical Imaging Fiber-Based Live Bacterial Cell Array Biosensor. Anal. Biochem. 2003, 315, 106–113. [Google Scholar]
  40. Zimmerman, R. S.; Basabe-Desmonts, L.; Van der Baan, F.; Reinhoudt, D. N.; Crego-Calama, M. A Combinatorial Approach to Surface-Confined Cation Sensors in Water. J. Mater. Chem. 2005, 15, 2772–2277. [Google Scholar]
  41. Carrascosa, L. G.; Moreno, M.; Alvarez, M.; Lechuga, L. M. Nanomechanical Biosensors: a New Sensing Tool. Trac-Trends in Analytical Chemistry 2006, 25, 196–206. [Google Scholar]
  42. Fritz, J.; Baller, M. K.; Lang, H. P.; Strunz, T.; Meyer, E.; Guntherodt, H. J.; Delamarche, E.; Gerber, C.; Gimzewski, J. K. Stress at the Solid-Liquid Interface of Self-Assembled Monolayers on Gold Investigated With a Nanomechanical Sensor. Langmuir 2000, 16, 9694–9696. [Google Scholar]
  43. Balakirev, M. Y.; Porte, S.; Vernaz-Gris, M.; Berger, M.; Arie, J. P.; Fouque, B.; Chatelain, F. Photochemical Patterning of Biological Molecules Inside a Glass Capillary. Anal. Chem. 2005, 77, 5474–5479. [Google Scholar]
  44. Dyukova, V. I.; Shilova, N. V.; Galanina, O. E.; Rubina, A. Y.; Bovin, N. V. Design of Carbohydrate Multiarrays. Biochimica Et Biophysica Acta-General Subjects 2006, 1760, 603–609. [Google Scholar]
  45. Mack, N. H.; Dong, R.; Nuzzo, R. G. Quantitative Imaging of Protein Adsorption on Patterned Organic Thin-Film Arrays Using Secondary Electron Emission. J. Am. Chem. Soc. 2006, 128, 7871–7881. [Google Scholar]
  46. Ji, H. F.; Hansen, K. M.; Hu, Z.; Thundat, T. Detection of Ph Variation Using Modified Microcantilever Sensors. Sens. Actuators, B 2001, 72, 233–238. [Google Scholar]
  47. Birkert, O.; Tunnernann, R.; Jung, G.; Gauglitz, G. Label-Free Parallel Screening of Combinatorial Triazine Libraries Using Reflectometric Interference Spectroscopy. Anal. Chem. 2002, 74, 834–840. [Google Scholar]
  48. Crego-Calama, M.; Reinhoudt, D. N. New Materials for Metal Ion Sensing by Self-Assembled Monolayers on Glass. Adv. Mater. 2001, 13, 1171–1174. [Google Scholar]
  49. Basabe-Desmonts, L.; Beld, J.; Zimmerman, R. S.; Hernando, J.; Mela, P.; García-Parajó, M. F. G.; Van Hulst, N. F.; Van den Berg, A.; Reinhoudt, D. N.; Crego-Calama, M. A Simple Approach to Sensor Discovery and Fabrication on Self-Assembled Monolayers on Glass. J. Am. Chem. Soc. 2004, 126, 7293–7299. [Google Scholar]
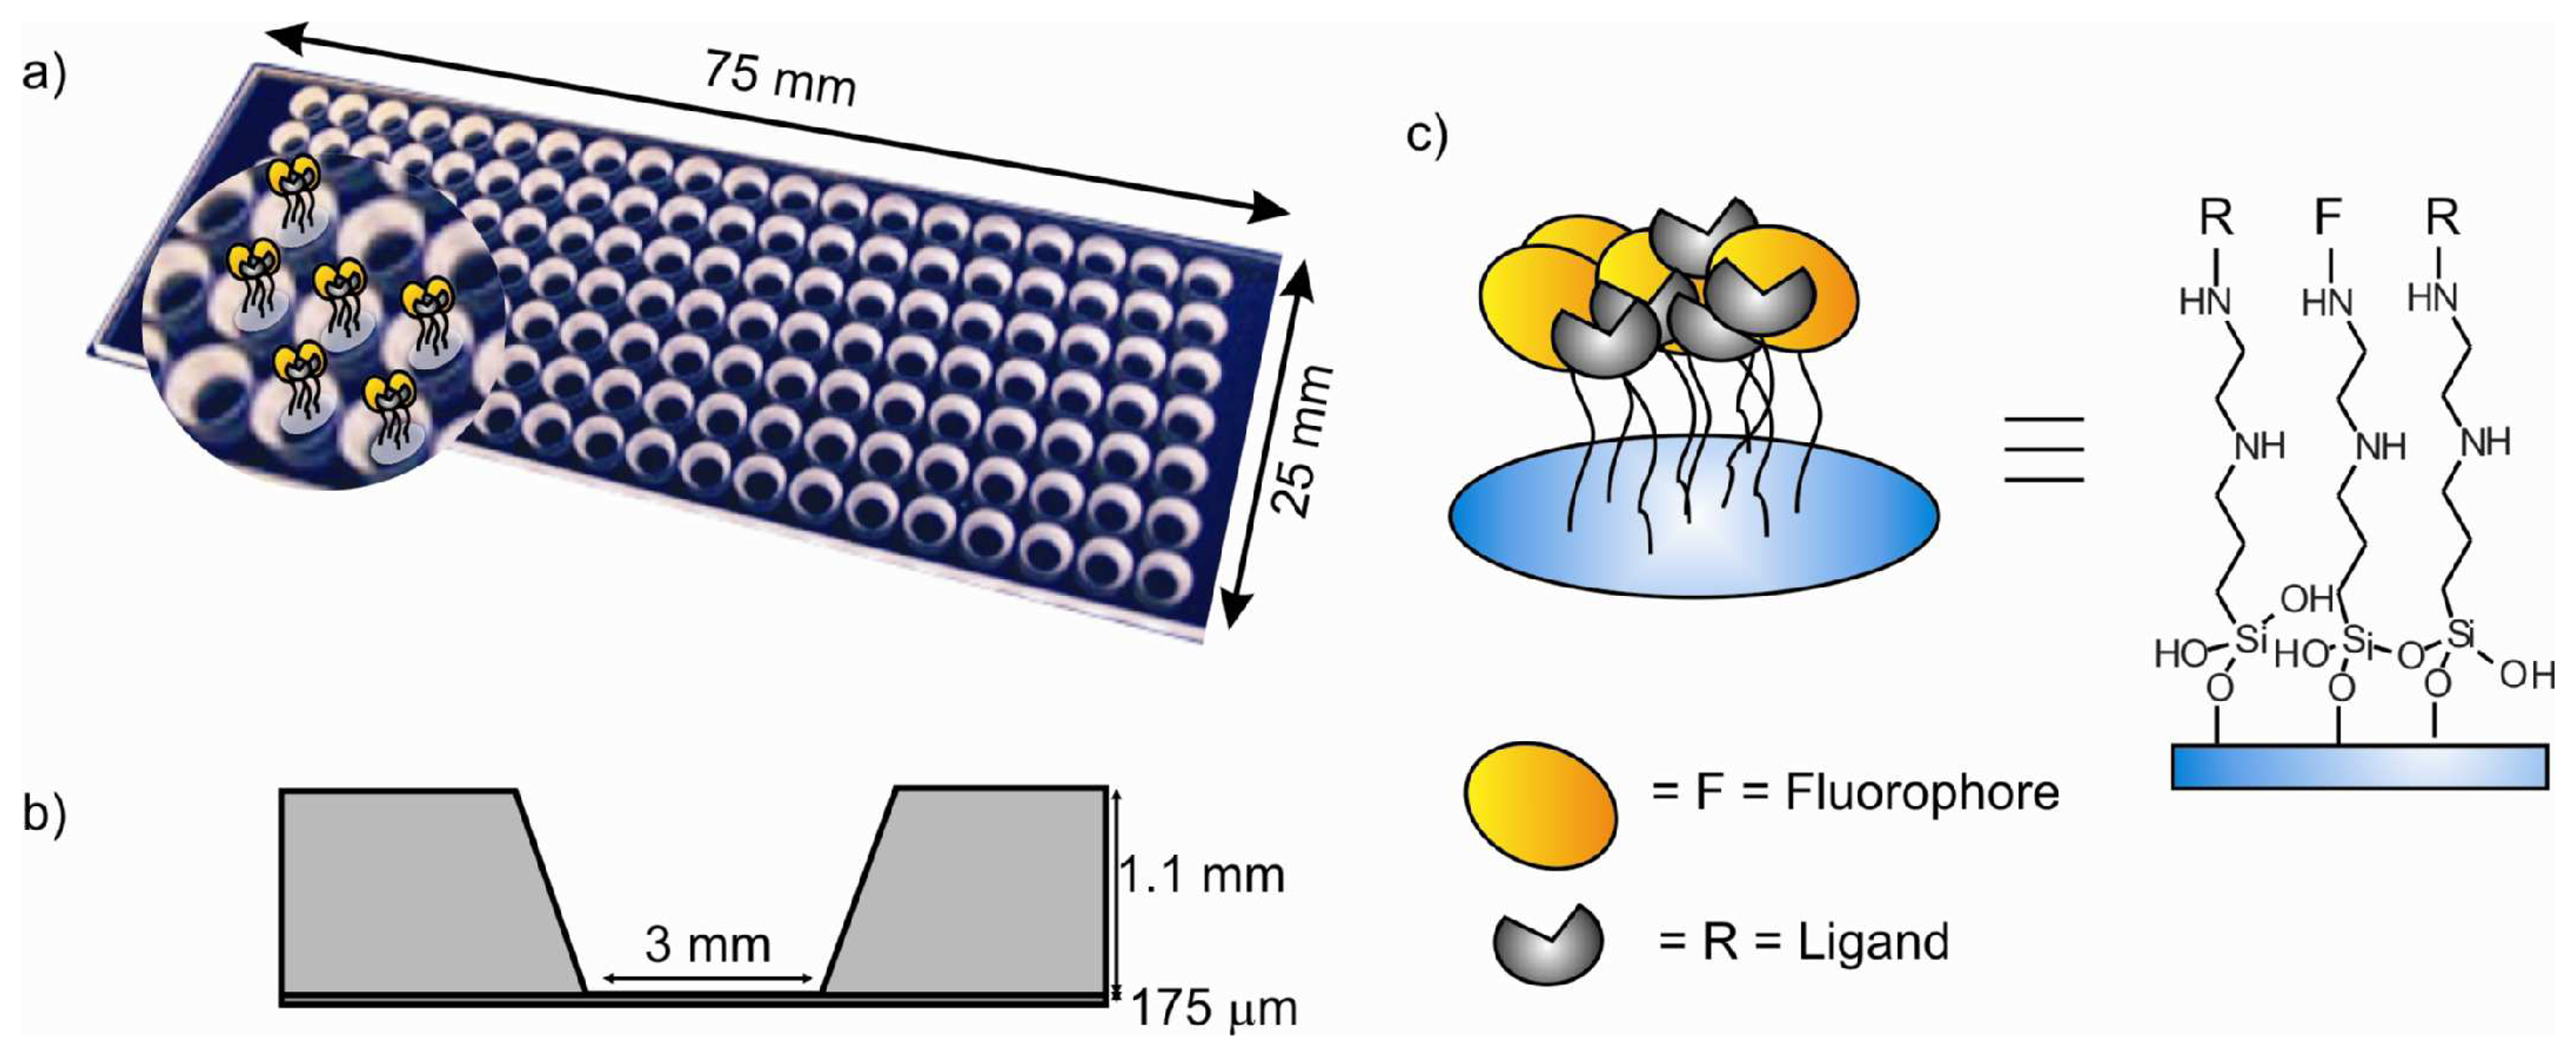
  50. The thickness of the glass bottom plate was 175 μm to allow fluorescent microscopy imaging of the bottom surface of the channel even with oil immersion objectives for acquisition (if needed) of higher resolution images.
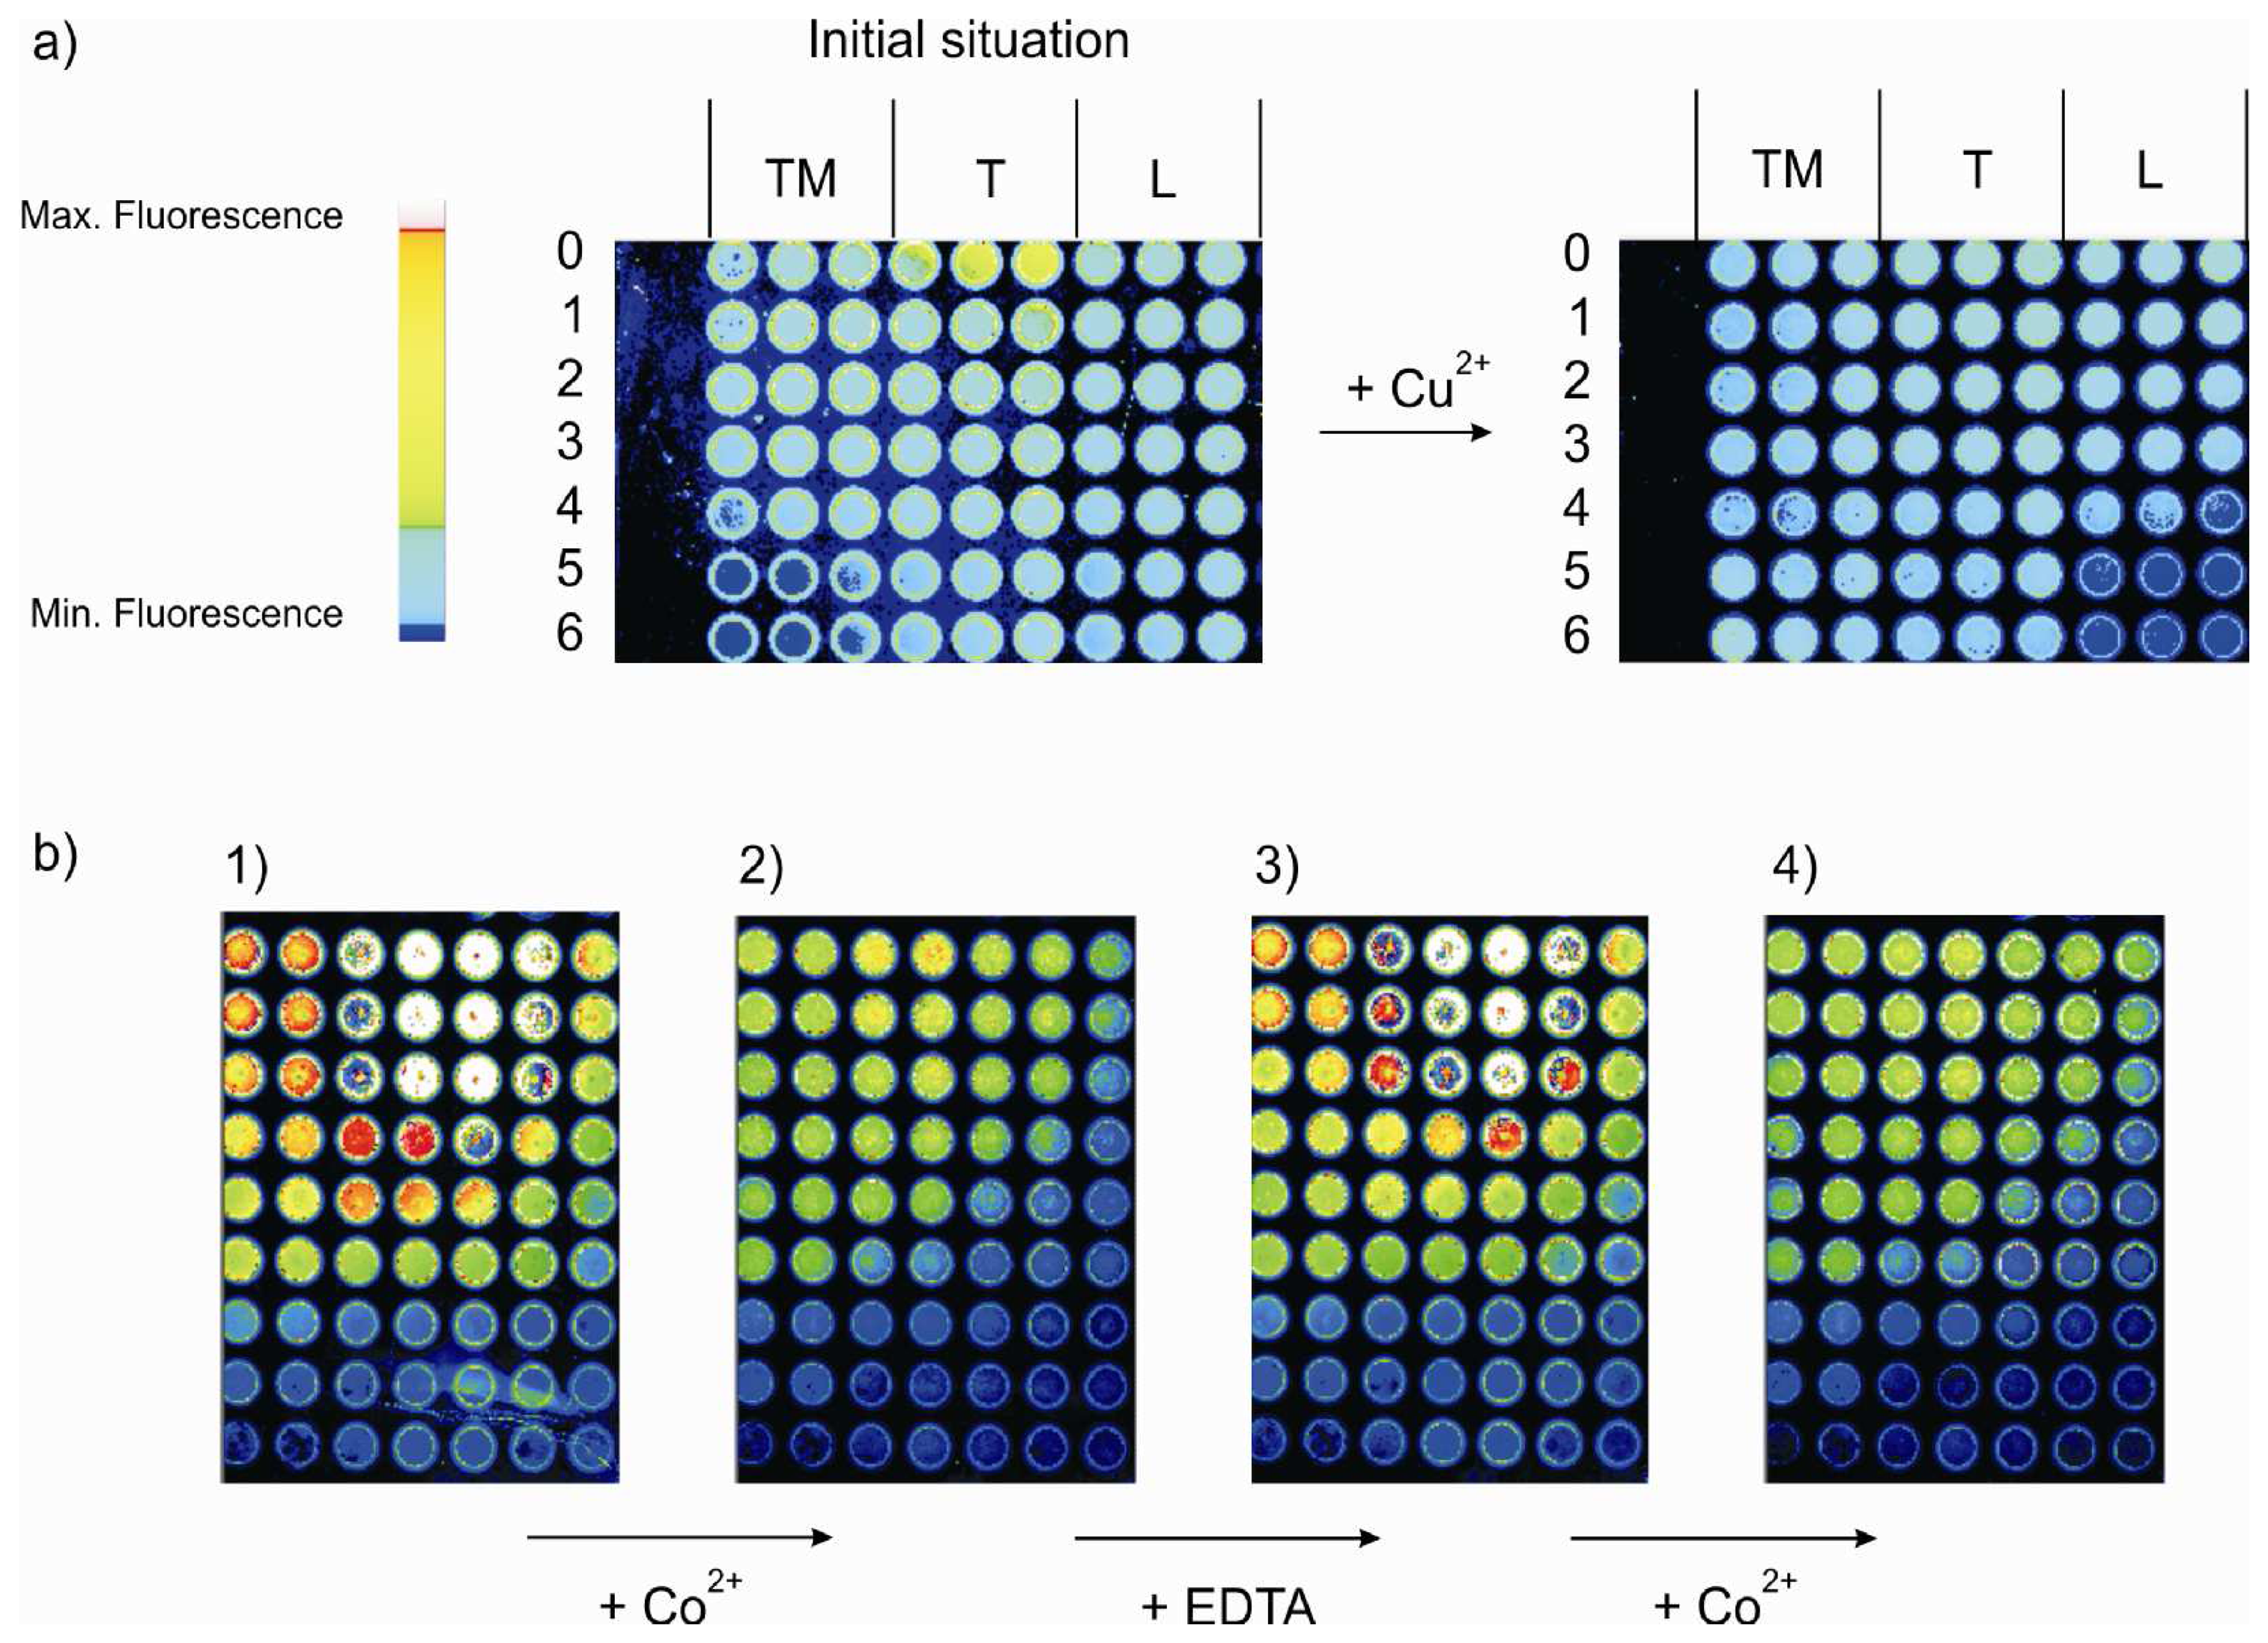
  51. Due to steric hindrance, some amino groups remain unreacted after addition of the fluorophore molecules. Thus, these groups can be reacted with a small molecule to form the complexing functionalities yielding the final sensitive fluorescent self-assembled monolayer (SAMs).
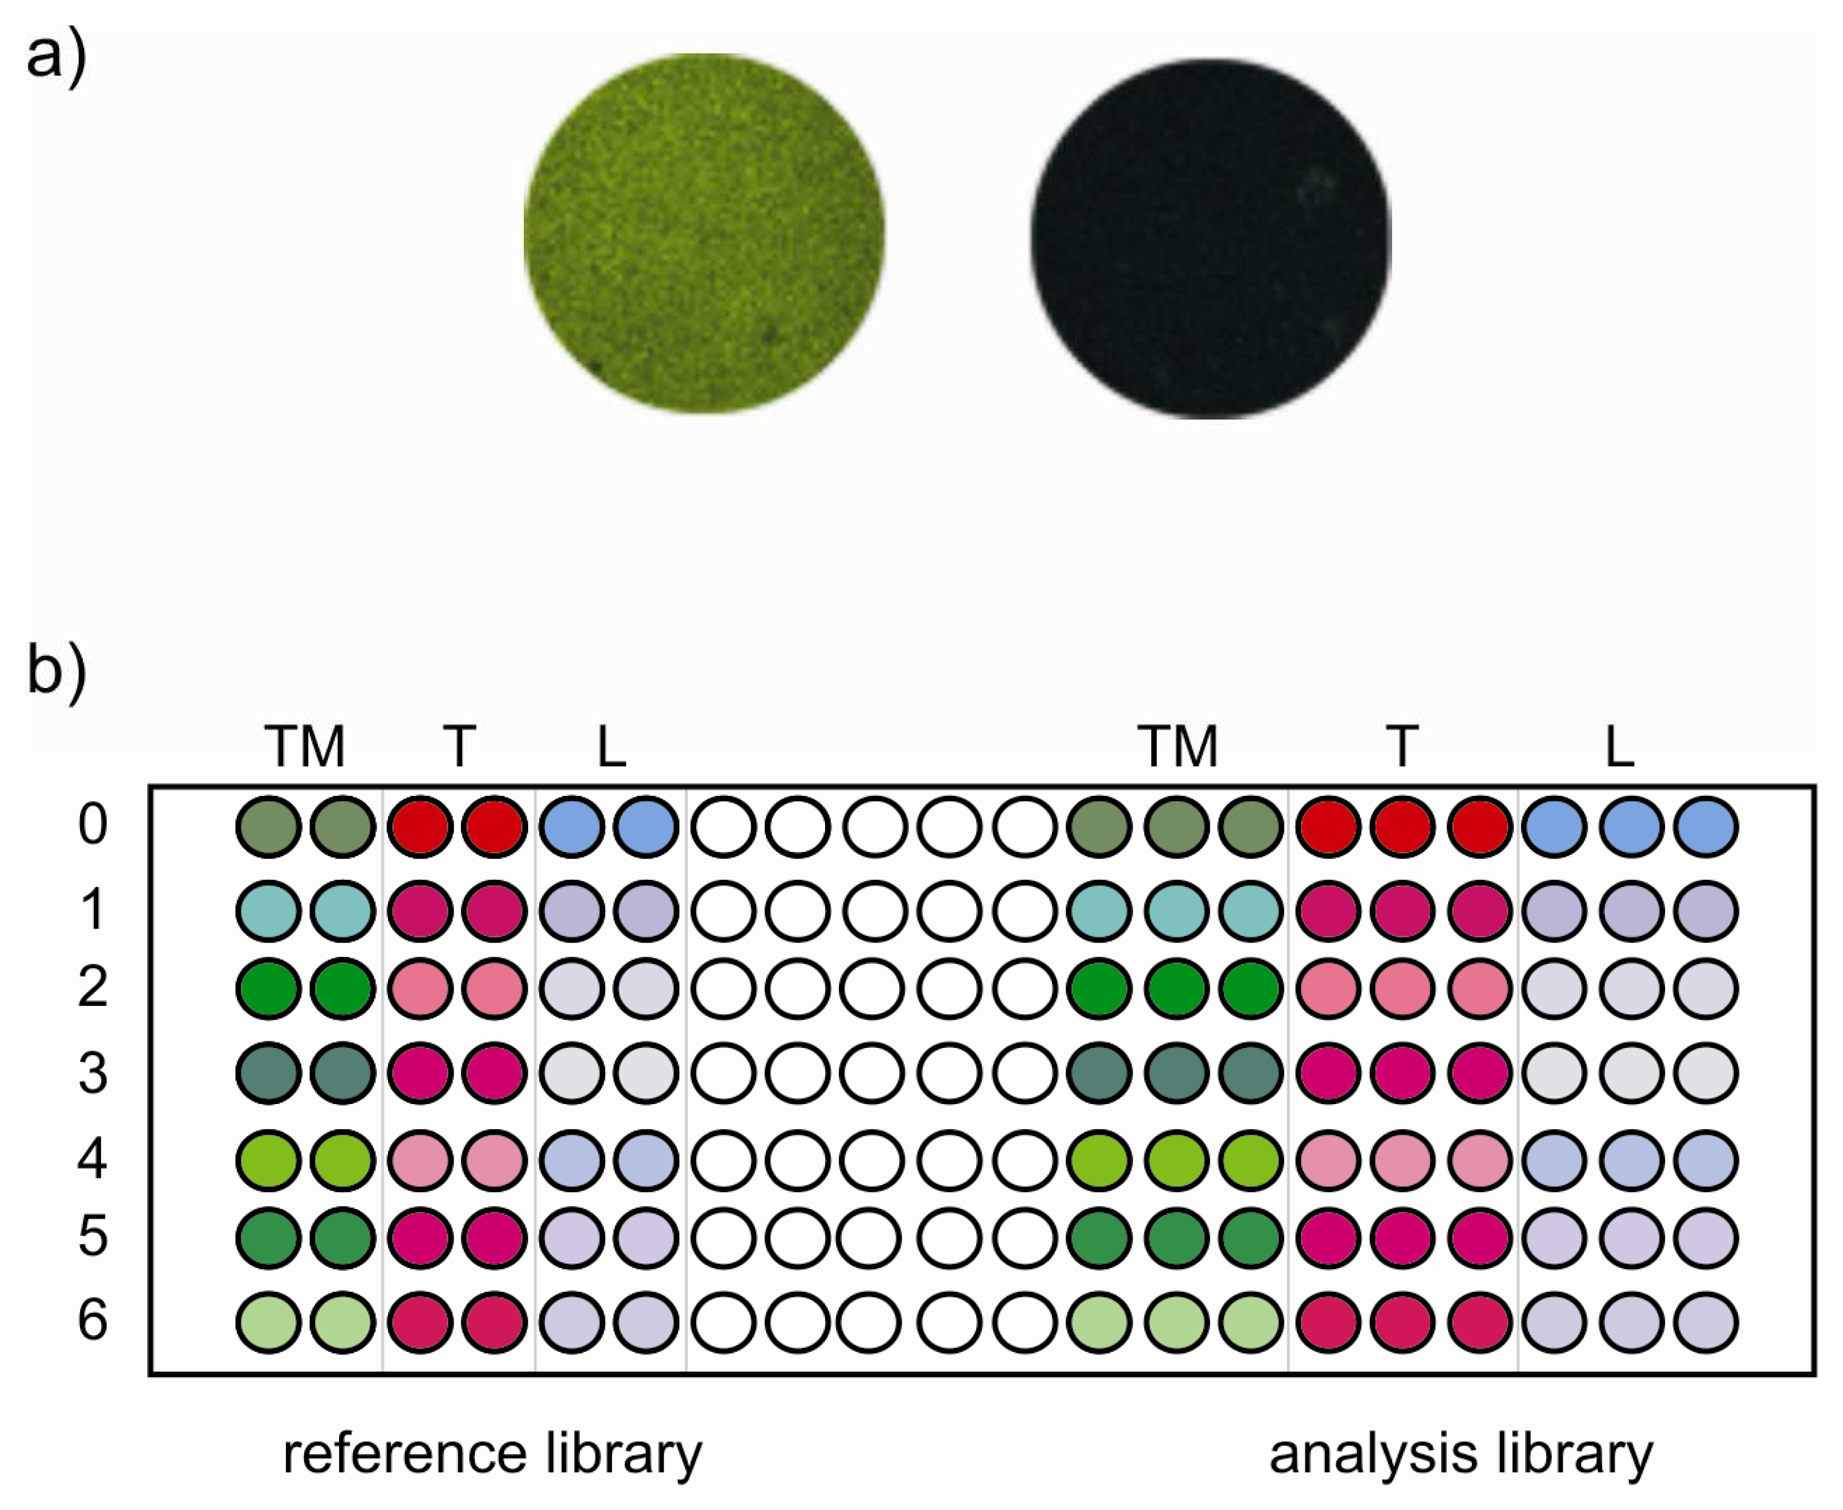
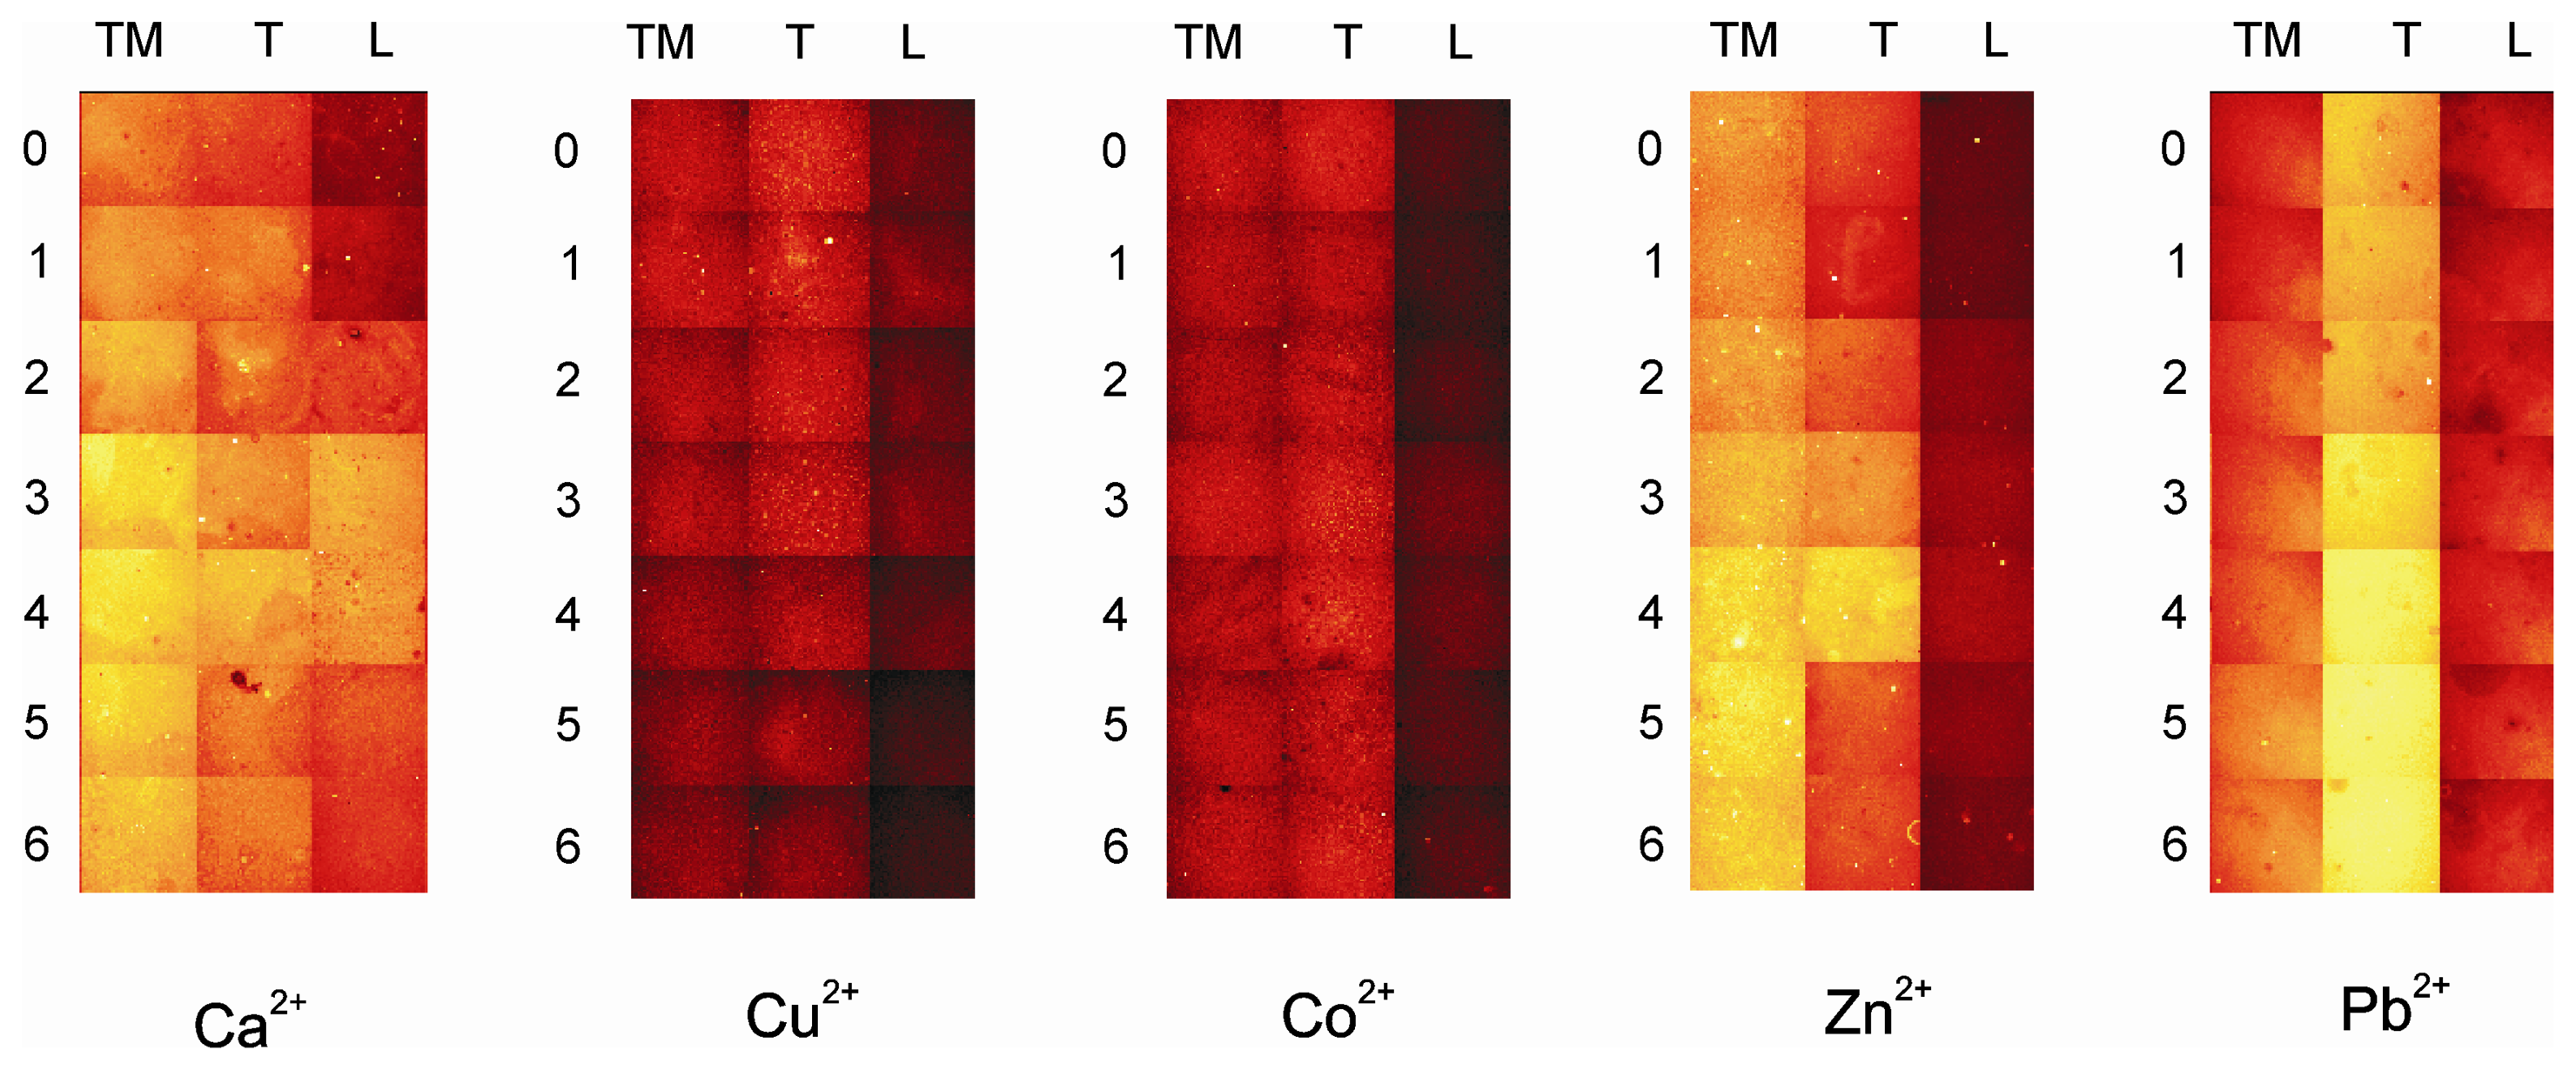
  52. All the shown fluorescence images are made in air. After incubation of the plate with the analyte, it is rinsed with dichloromethene, dried and then imaged.
  53. By setting threshold values luminescence intensity of the array can be scale up and down, in order to get high or low fluorescence intensity, into a visible pattern by eye. Different color within a gray scale is assigned to different fluorescence intensity values, and with a particular graphical software the gray scale pictures are transformed into colored photos with a red to yellow scale.
  54. The imaging of the array in absence and in contact with the analytes was done keeping constant all the parameters of the imaging set-up. The threshold for the fluorescence intensity of the reference library was set differently for layers TM0-TM6, T0-T6 and L0-L6 (see experimental).
  55. Every monolayer was made in triple in consecutive wells in the analysis library of the MTP. One image of each well is obtained after the incubation with the analytes. But only one image (out of three) for each of the 21 systems in the array is selected for the final picture.
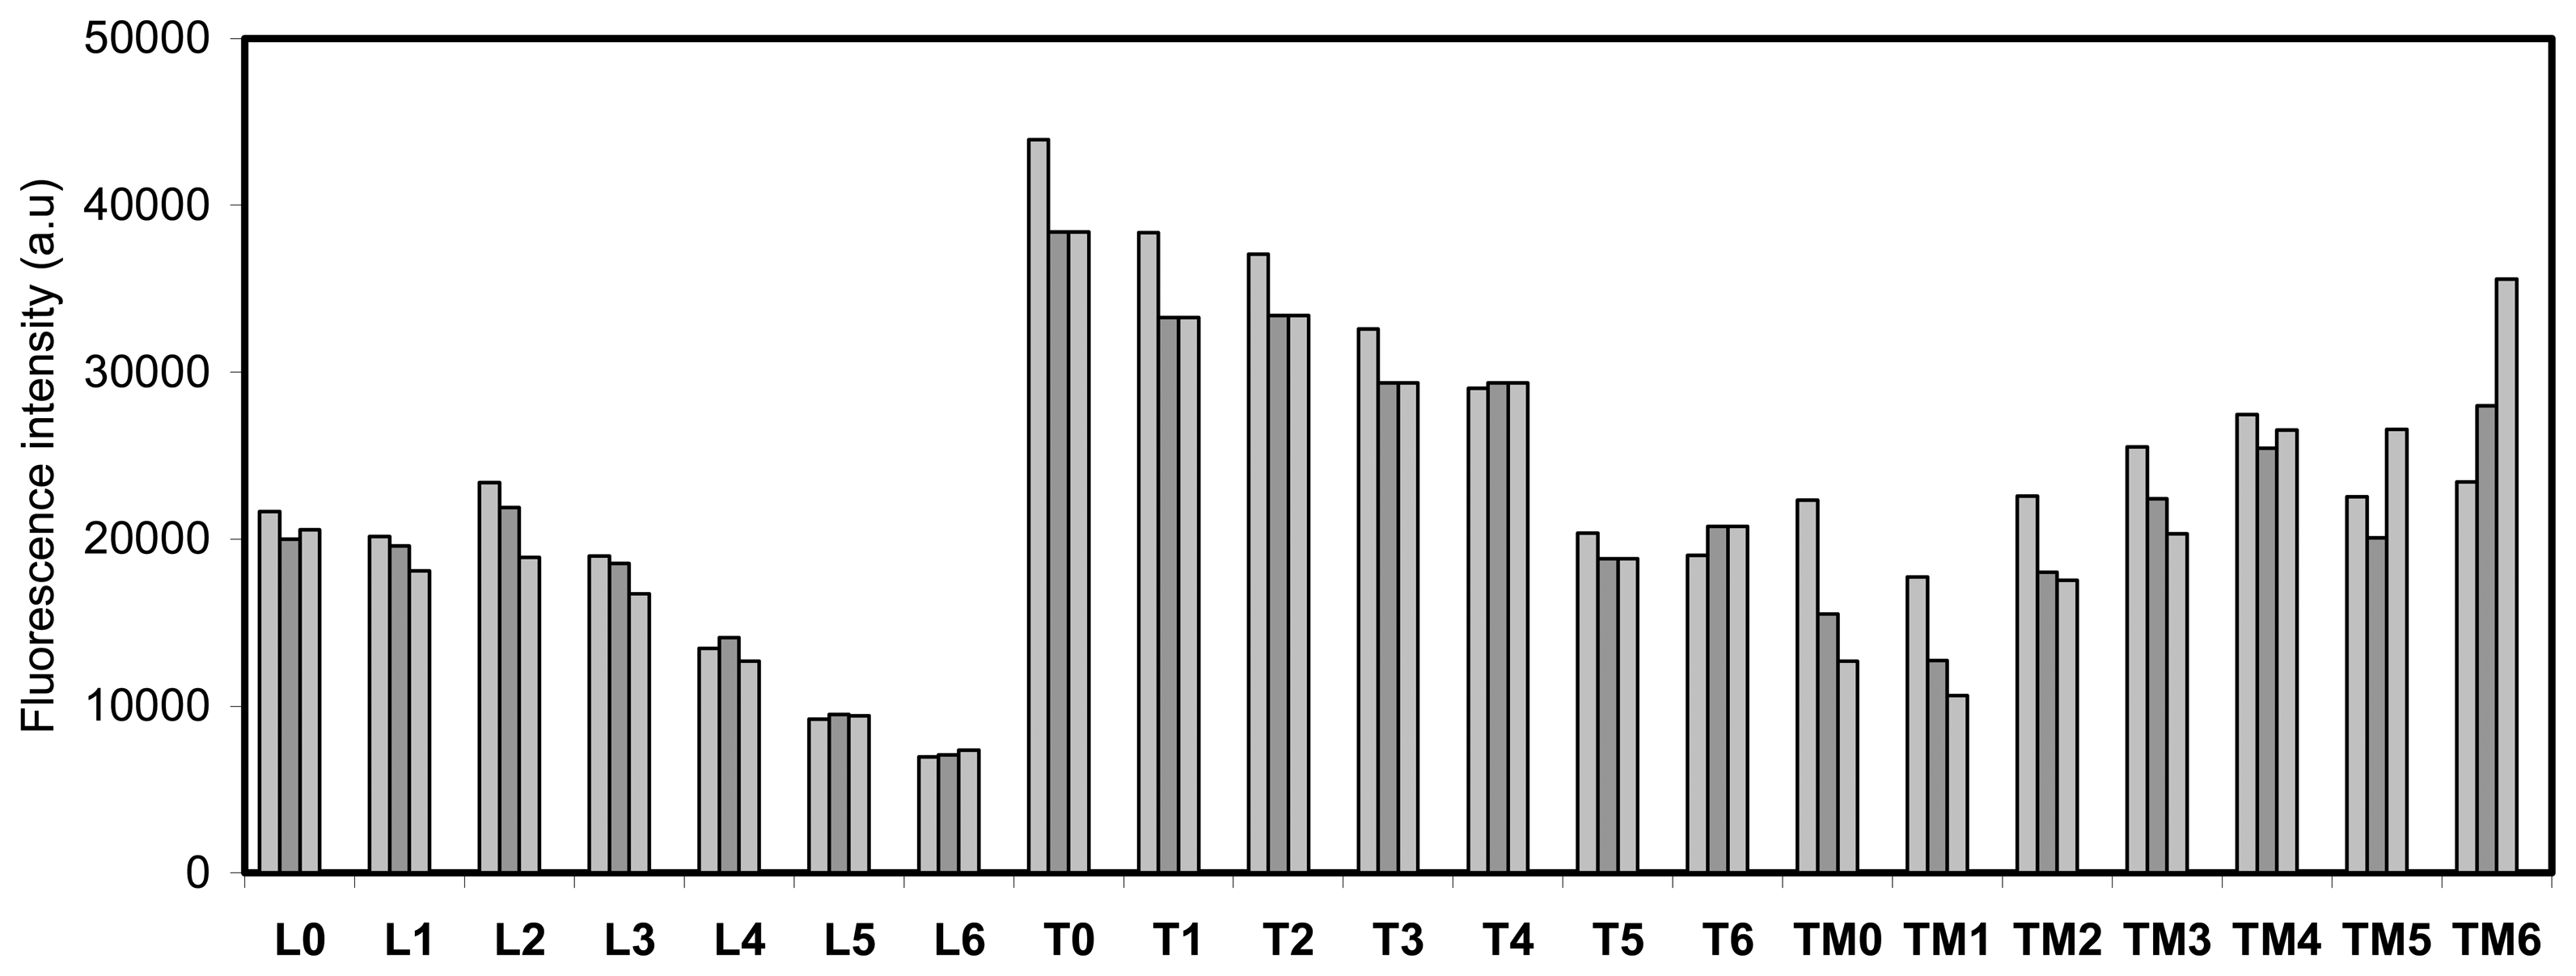
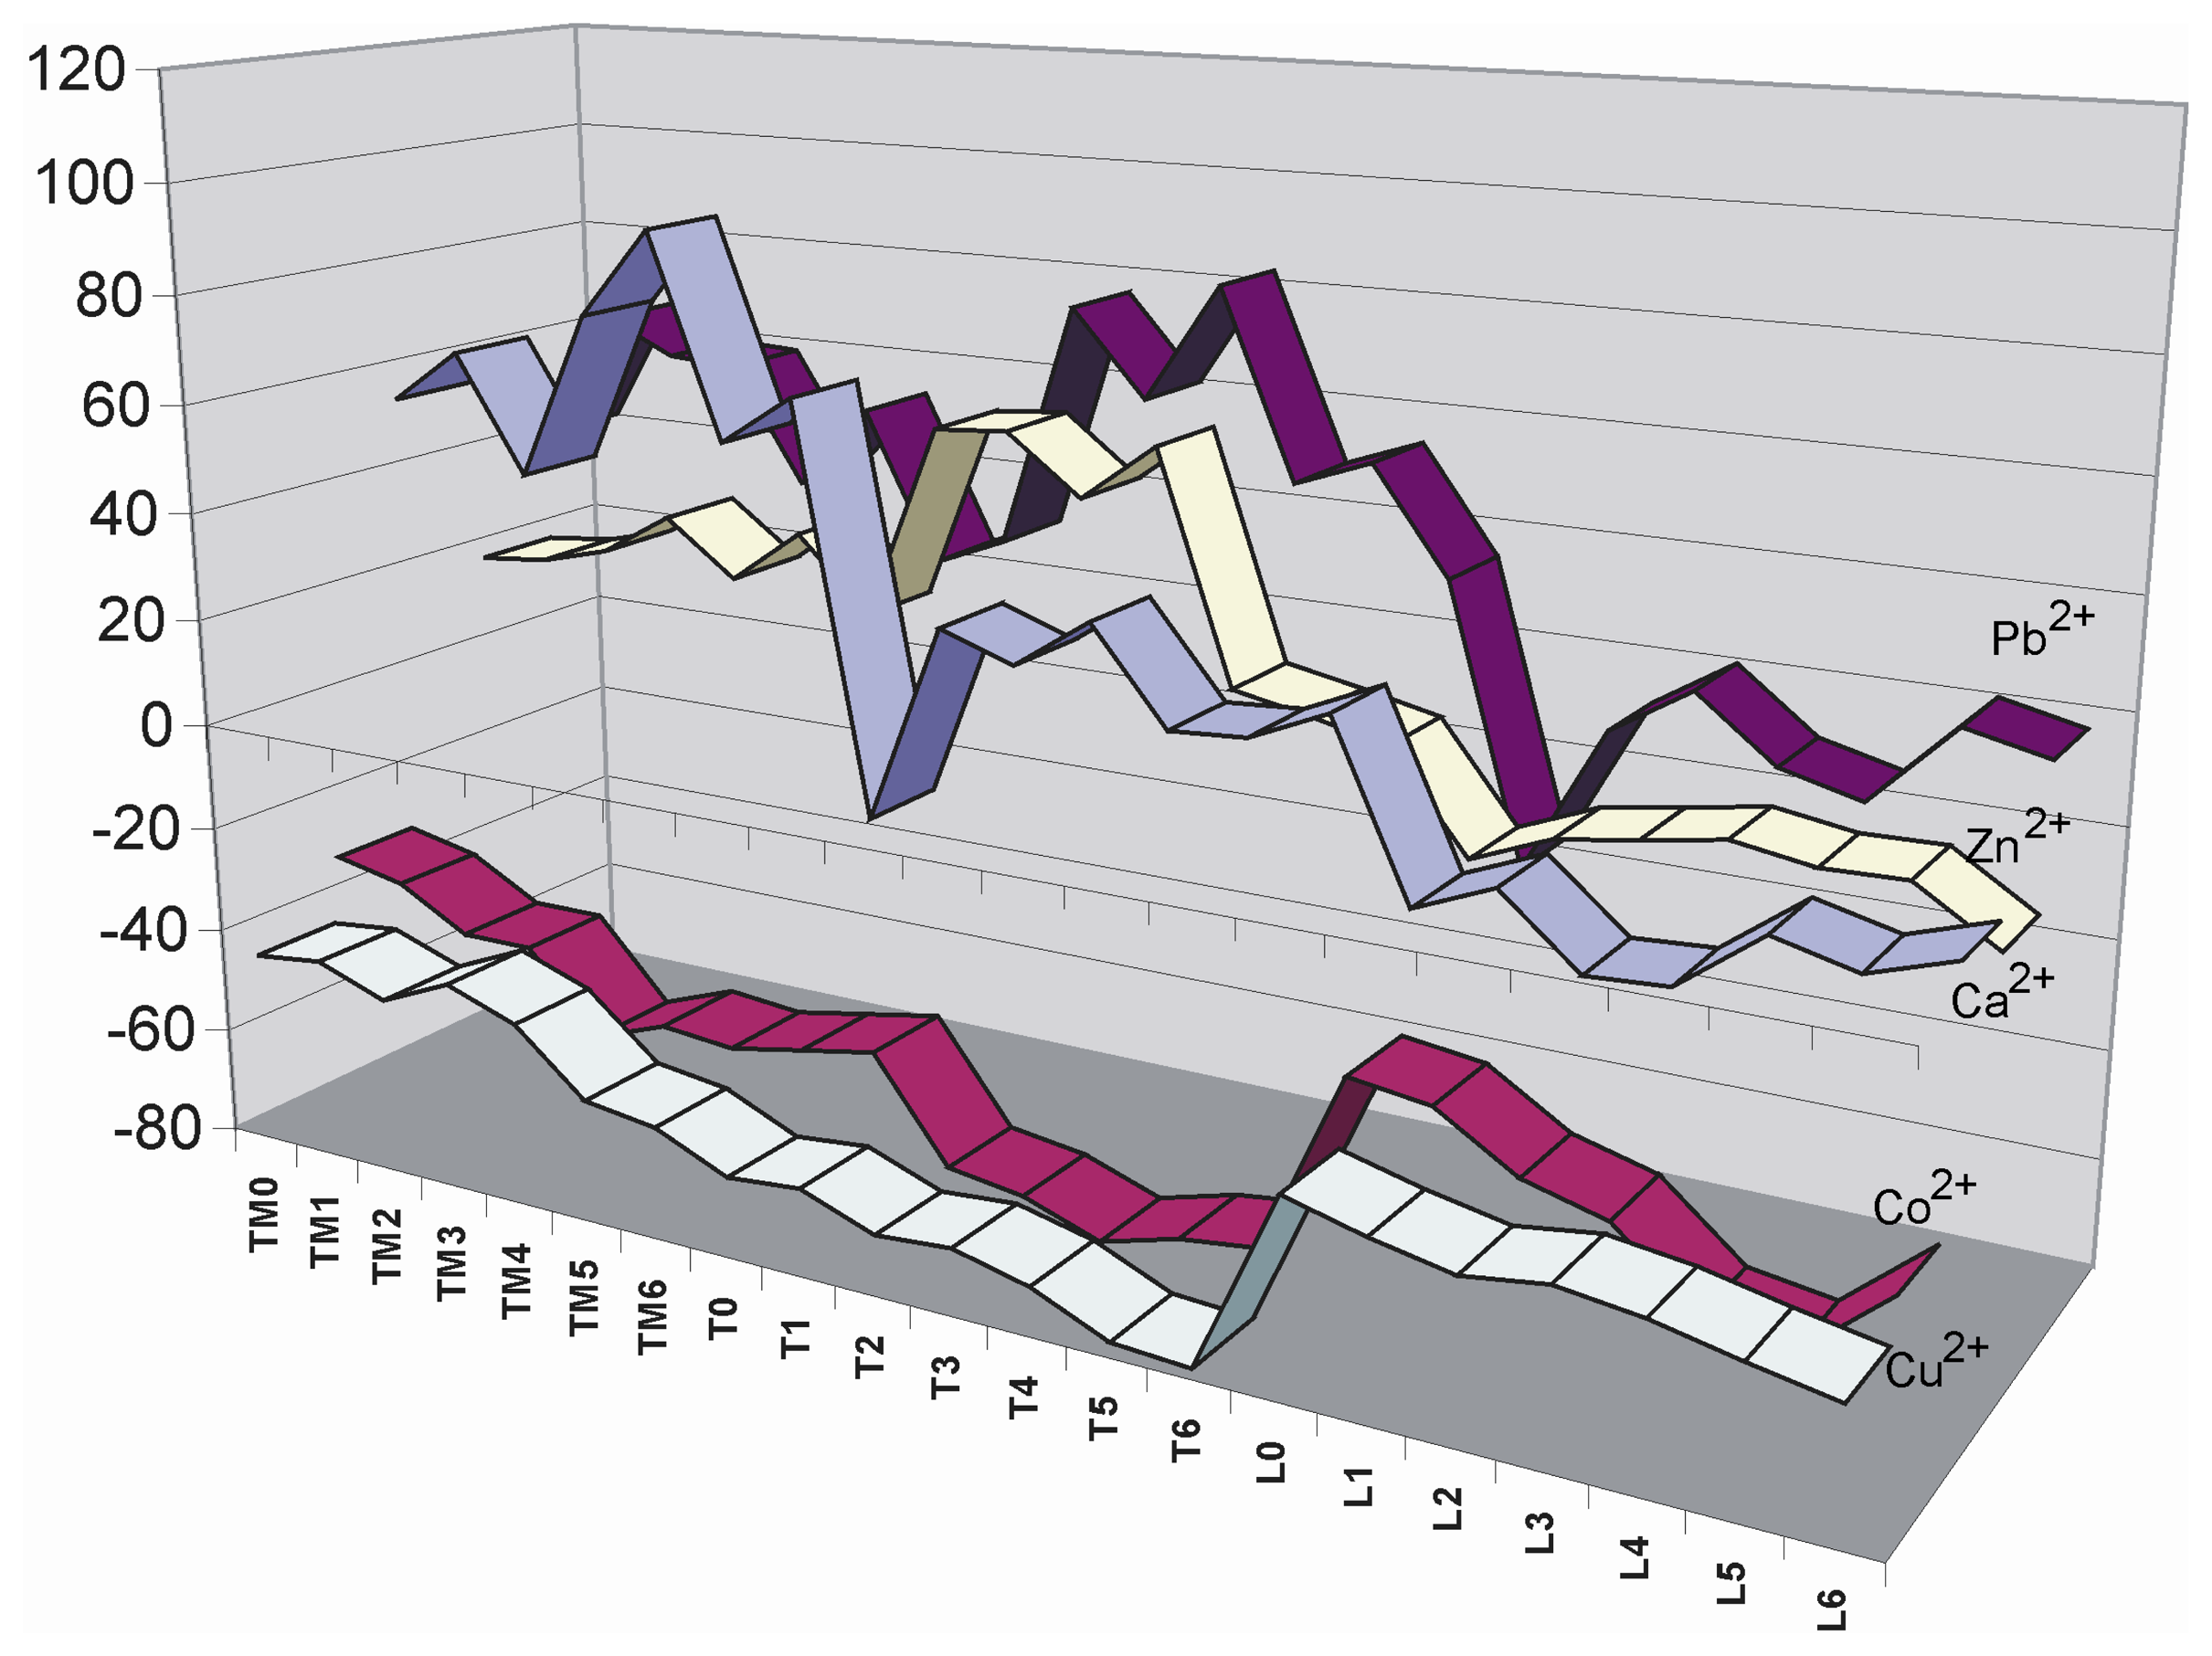
  56. Each point is the average of at least 3 measurements. The average deviation of these values is lower than 5 %.
  57. A deviation of the scanner laser focus calibration did not permit the scanning of the whole microtiter plate with high precision. Due to this reason only the half of the plate was imaged each time in order to get the maximum precision along the scanned area.
Figure 1. a) Picture of the 140 well glass microtiter plate (MTP) with a schematic representation (enlargement) of the wells substitution). Schematic representation of b) one microtiter plate well with the corresponding dimensions and c) the self-assembled monolayers formed in each well of the MTP.
Sensors 07 01731f1
Figure 2. a) Synthetic scheme of the formation of the sensing SAMs on the plate wells. i) N-[3-(trimethoxysilyl)propyl]ethylenediamine, toluene, rt, 3.5 h, ii): Lissamine rhodamine B sulfonyl chloride, 5-(and-6)-carboxytetramethylrhodamine, succinimidyl ester (5(6)-TAMRA, SE) or tetramethylrhodamine-5-(and-6)- isothiocyanate (5(6)-TRITC), acetonitrile, rt, 4 h and iii) isocyanates, thioisocyanates or acid chlorides (see text) used as ligands (R), acetonitrile, rt, 16 h. b) Schematic representation of the monolayer library synthesis (TM0-TM6, T0-T6, L0-L6) in a microtiter plate. Three different acetonitrile solutions containing each a different fluorophore, TAMRA (TM), TRITC (T), or Lissamine (L) are pipetted in the wells of three consecutive colunms of a MTP coated with TPEDA monolayer (A in this figure). Subsequently, six solutions (1-6) containing each a different ligand are pipetted in consecutive rows. No ligand solution is added on the top row (wells TM0, L0, T0). c) Chemical composition of the library of fluorescent SAMs (TM0-TM6, L0-L6, T0-T6) prepared on the MTP glass surface.
Sensors 07 01731f2
Figure 3. a) Fluorescence microscope images of two neighboring wells functionalized with L0 SAM (left) and TPEDA SAM (right), after rinsing the MTP with propylamine. b) Schematic representation of the functionalized MTP showing two identical monolayer libraries (reference library and analysis library) in the MTP wells. Fluorophores (TM, T, and L) and complexing molecules (1-6) were distributed in the TPEDA functionalized MTP as indicated resulting in 21 different monolayers.
Sensors 07 01731f3
Figure 4. Plot of the original fluorescence intensity of each sensing monolayer in air (L0-L6, T0-T6, TM0-TM6), made in triplicate in consecutive wells.
Sensors 07 01731f4
Figure 5. Fluorescence microscopy images of the MTP wells after each plate was incubated with Ca2+, Cu2+, Co2+, Zn2+ and Pb2+ (10−4 M, acetonitrile). Each square in every image represents an individual signal, and the collection of the individual signals constitutes the response pattern of the array, (for well composition see Figure 4).
Sensors 07 01731f5
Figure 6. Plot of the fluorescence emission intensity changes of each sensing system in the array upon Pb2+, Zn2+, Ca2+, Co2+ and Cu2+ complexation. Negative values indicate quenching of fluorescence while positive values indicate enhancement of fluorescence intensity. The data are normalized, the fluorescence intensity of the sensing systems in the reference layer has been set to 0, and compared with the fluorescence intensity of each system after analyte complexation.[56]
Sensors 07 01731f6
Figure 7. a) Fluorescence scanner images of a functionalized microtiter plate with a library of 21 SAMs configured into an array (for library composition see Figure 2), before and after exposure to a 10−4 M acetonitrile solution of Cu(ClO4)2, respectively. b) Fluorescence scanner images of a microtier plate functionalized with the sensing array, 1) initial situation, 2) after exposure to Co2+ (10−4 M, acetonitrile), 3) after subsequent rinsing with EDTA (0.01 M, aqueous solution), and 4) after re-exposure to Co2+ (10−4 M, acetonitrile).
Sensors 07 01731f7

