A Wireless, Passive Sensor for Quantifying Packaged Food Quality

1
Department of Biomedical Engineering, Michigan Technological University, 1400 Townsend Drive, Houghton, MI 49931, USA
2
Norinse Technologies LLC, Hancock, MI 49930, USA
*
Author to whom correspondence should be addressed.
Sensors 2007, 7(9), 1747-1756; https://doi.org/10.3390/s7091747
Submission received: 23 August 2007
/
Accepted: 28 August 2007
/
Published: 5 September 2007
Abstract
:This paper describes the fabrication of a wireless, passive sensor based on an inductive-capacitive resonant circuit, and its application for in situ monitoring of the quality of dry, packaged food such as cereals, and fried and baked snacks. The sensor is made of a planar inductor and capacitor printed on a paper substrate. To monitor food quality, the sensor is embedded inside the food package by adhering it to the package's inner wall; its response is remotely detected through a coil connected to a sensor reader. As food quality degrades due to increasing humidity inside the package, the paper substrate absorbs water vapor, changing the capacitor's capacitance and the sensor's resonant frequency. Therefore, the taste quality of the packaged food can be indirectly determined by measuring the change in the sensor's resonant frequency. The novelty of this sensor technology is its wireless and passive nature, which allows in situ determination of food quality. In addition, the simple fabrication process and inexpensive sensor material ensure a low sensor cost, thus making this technology economically viable.
1. Introduction
Dry, packaged food usually requires an airtight package to maintain its quality and ensure food safety. For example, hermitically sealed bags are essential for dry snacks such as potato chips, corn chips, and various types of cereals to retain their crispness and safety. Leaks in the package or improper manufacturing conditions increase the moisture content of the food package, leading to the softening of food and reducing the taste quality, or worst, the growth of harmful microorganism. Today, food quality is generally determined by its potential shelf life [1-4], which allows the consumers to know when a product should be sold or used. When determining the shelf life of a product, producers take into account the three main types of food deteriorations: senescence (natural deterioration of harvested or slaughtered produce), microbial spoilage, and chemical deterioration [5]. These types of deteriorations have various effects on food including food staleness and the growth of pathogens such as E. coli. Depending on the fashions of food deterioration, various ways have been developed to preserve food freshness including storing at lower temperatures, using controlled atmospheric packaging, pasteurizing food before refrigeration, and increasing food acidity.
While it is simple to predict the quality of food with a standardized expiration date, shelf life does not take into account of food spoilage caused by damages on the food package. Hence, an ideal way to ensure food quality and safety is to evaluate the condition of the food prior to purchase or consumption. An example of after-packaged food quality monitoring technique is the temperature-time integrated device that determines the food shelf life by tracking the temperature variation experienced by the product [6]. This device can improve the current shelf life labels by letting both consumers and producers know when the food package stays fresh and safe. However, this device does not actually measure the product itself and assumes the temperature measurements as an accurate indicator of product condition [6].
A wireless, passive sensor is presented here for in situ monitoring the taste quality of packaged dry food. The sensor, referred to as the LC sensor [7-11], consists of an interdigital capacitor (IDC) and a spiral inductor printed on a paper substrate (see Fig. 1). The sensor's resonant frequency, which is remotely interrogated with a detection coil, depends on the capacitance and inductance of the sensor. Therefore, the LC sensor can be used to measure humidity level since water vapor increases the effective dielectric constant and conductivity of the paper substrate, which then changes the capacitance of the capacitor. The change in capacitance in turn shifts the sensor's resonant frequency. In this work, the application of LC sensor for monitoring the moisture content inside packaged cereals is demonstrated.
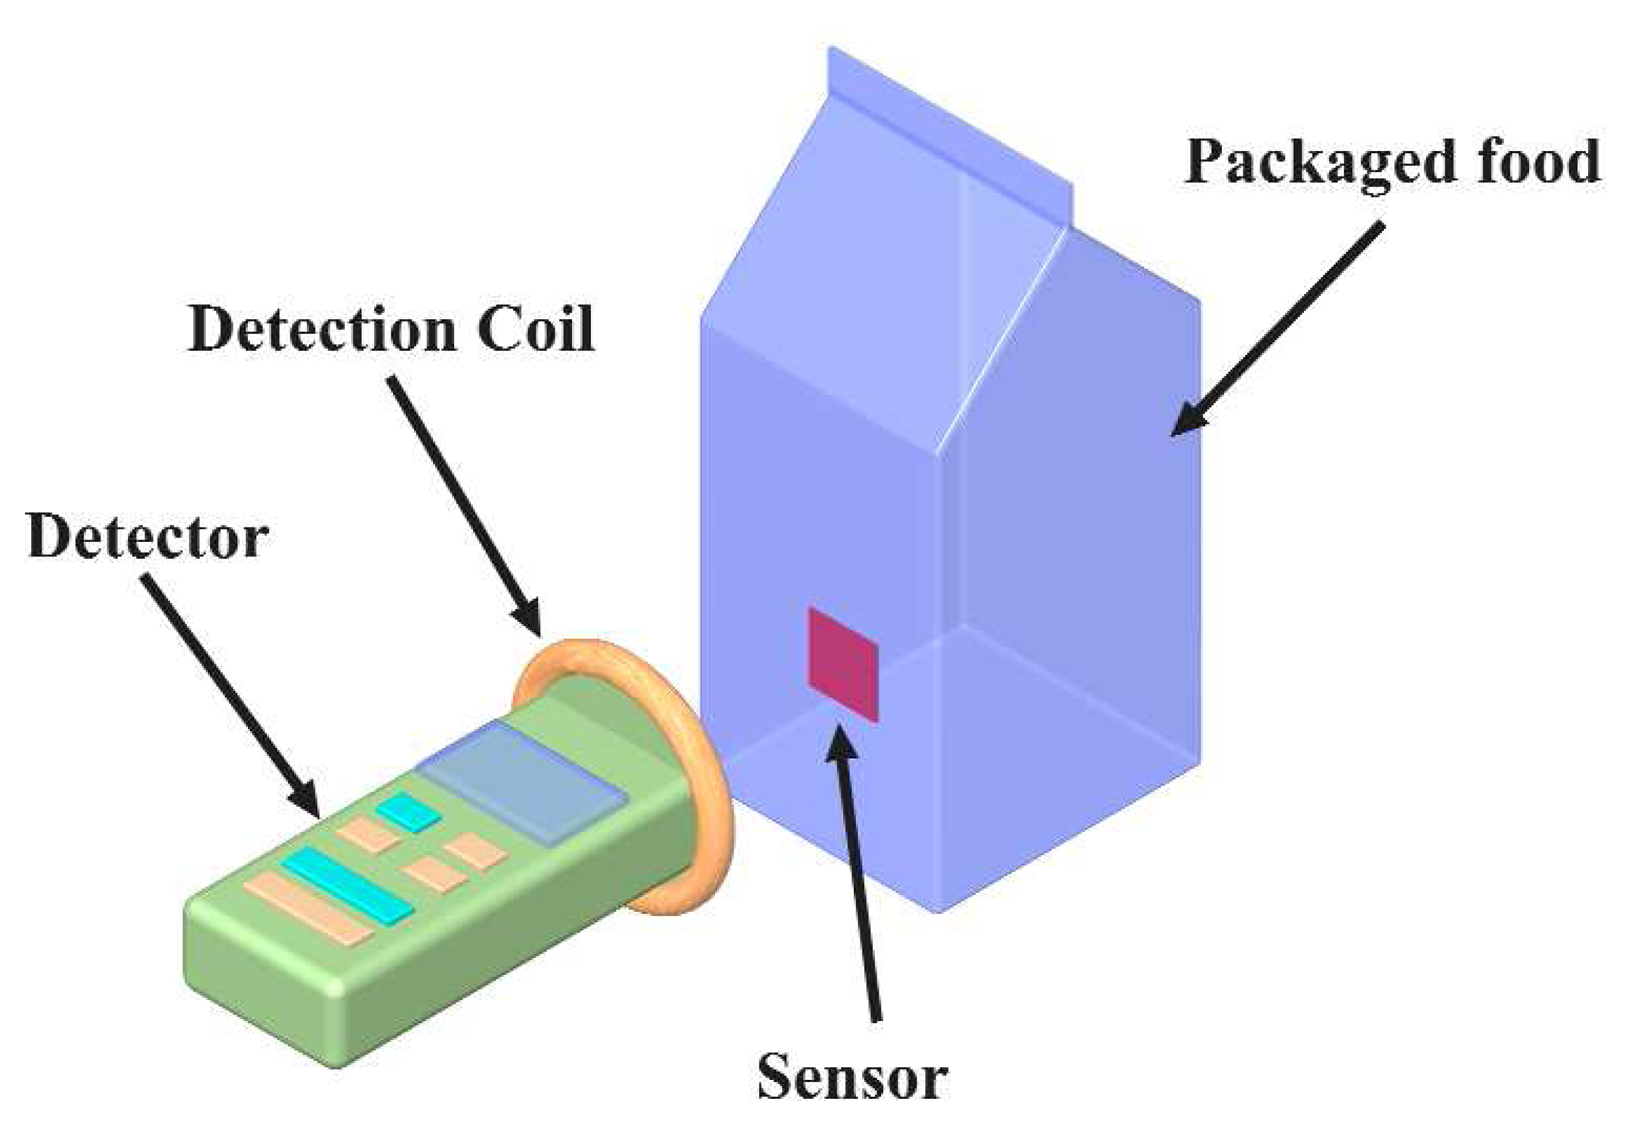
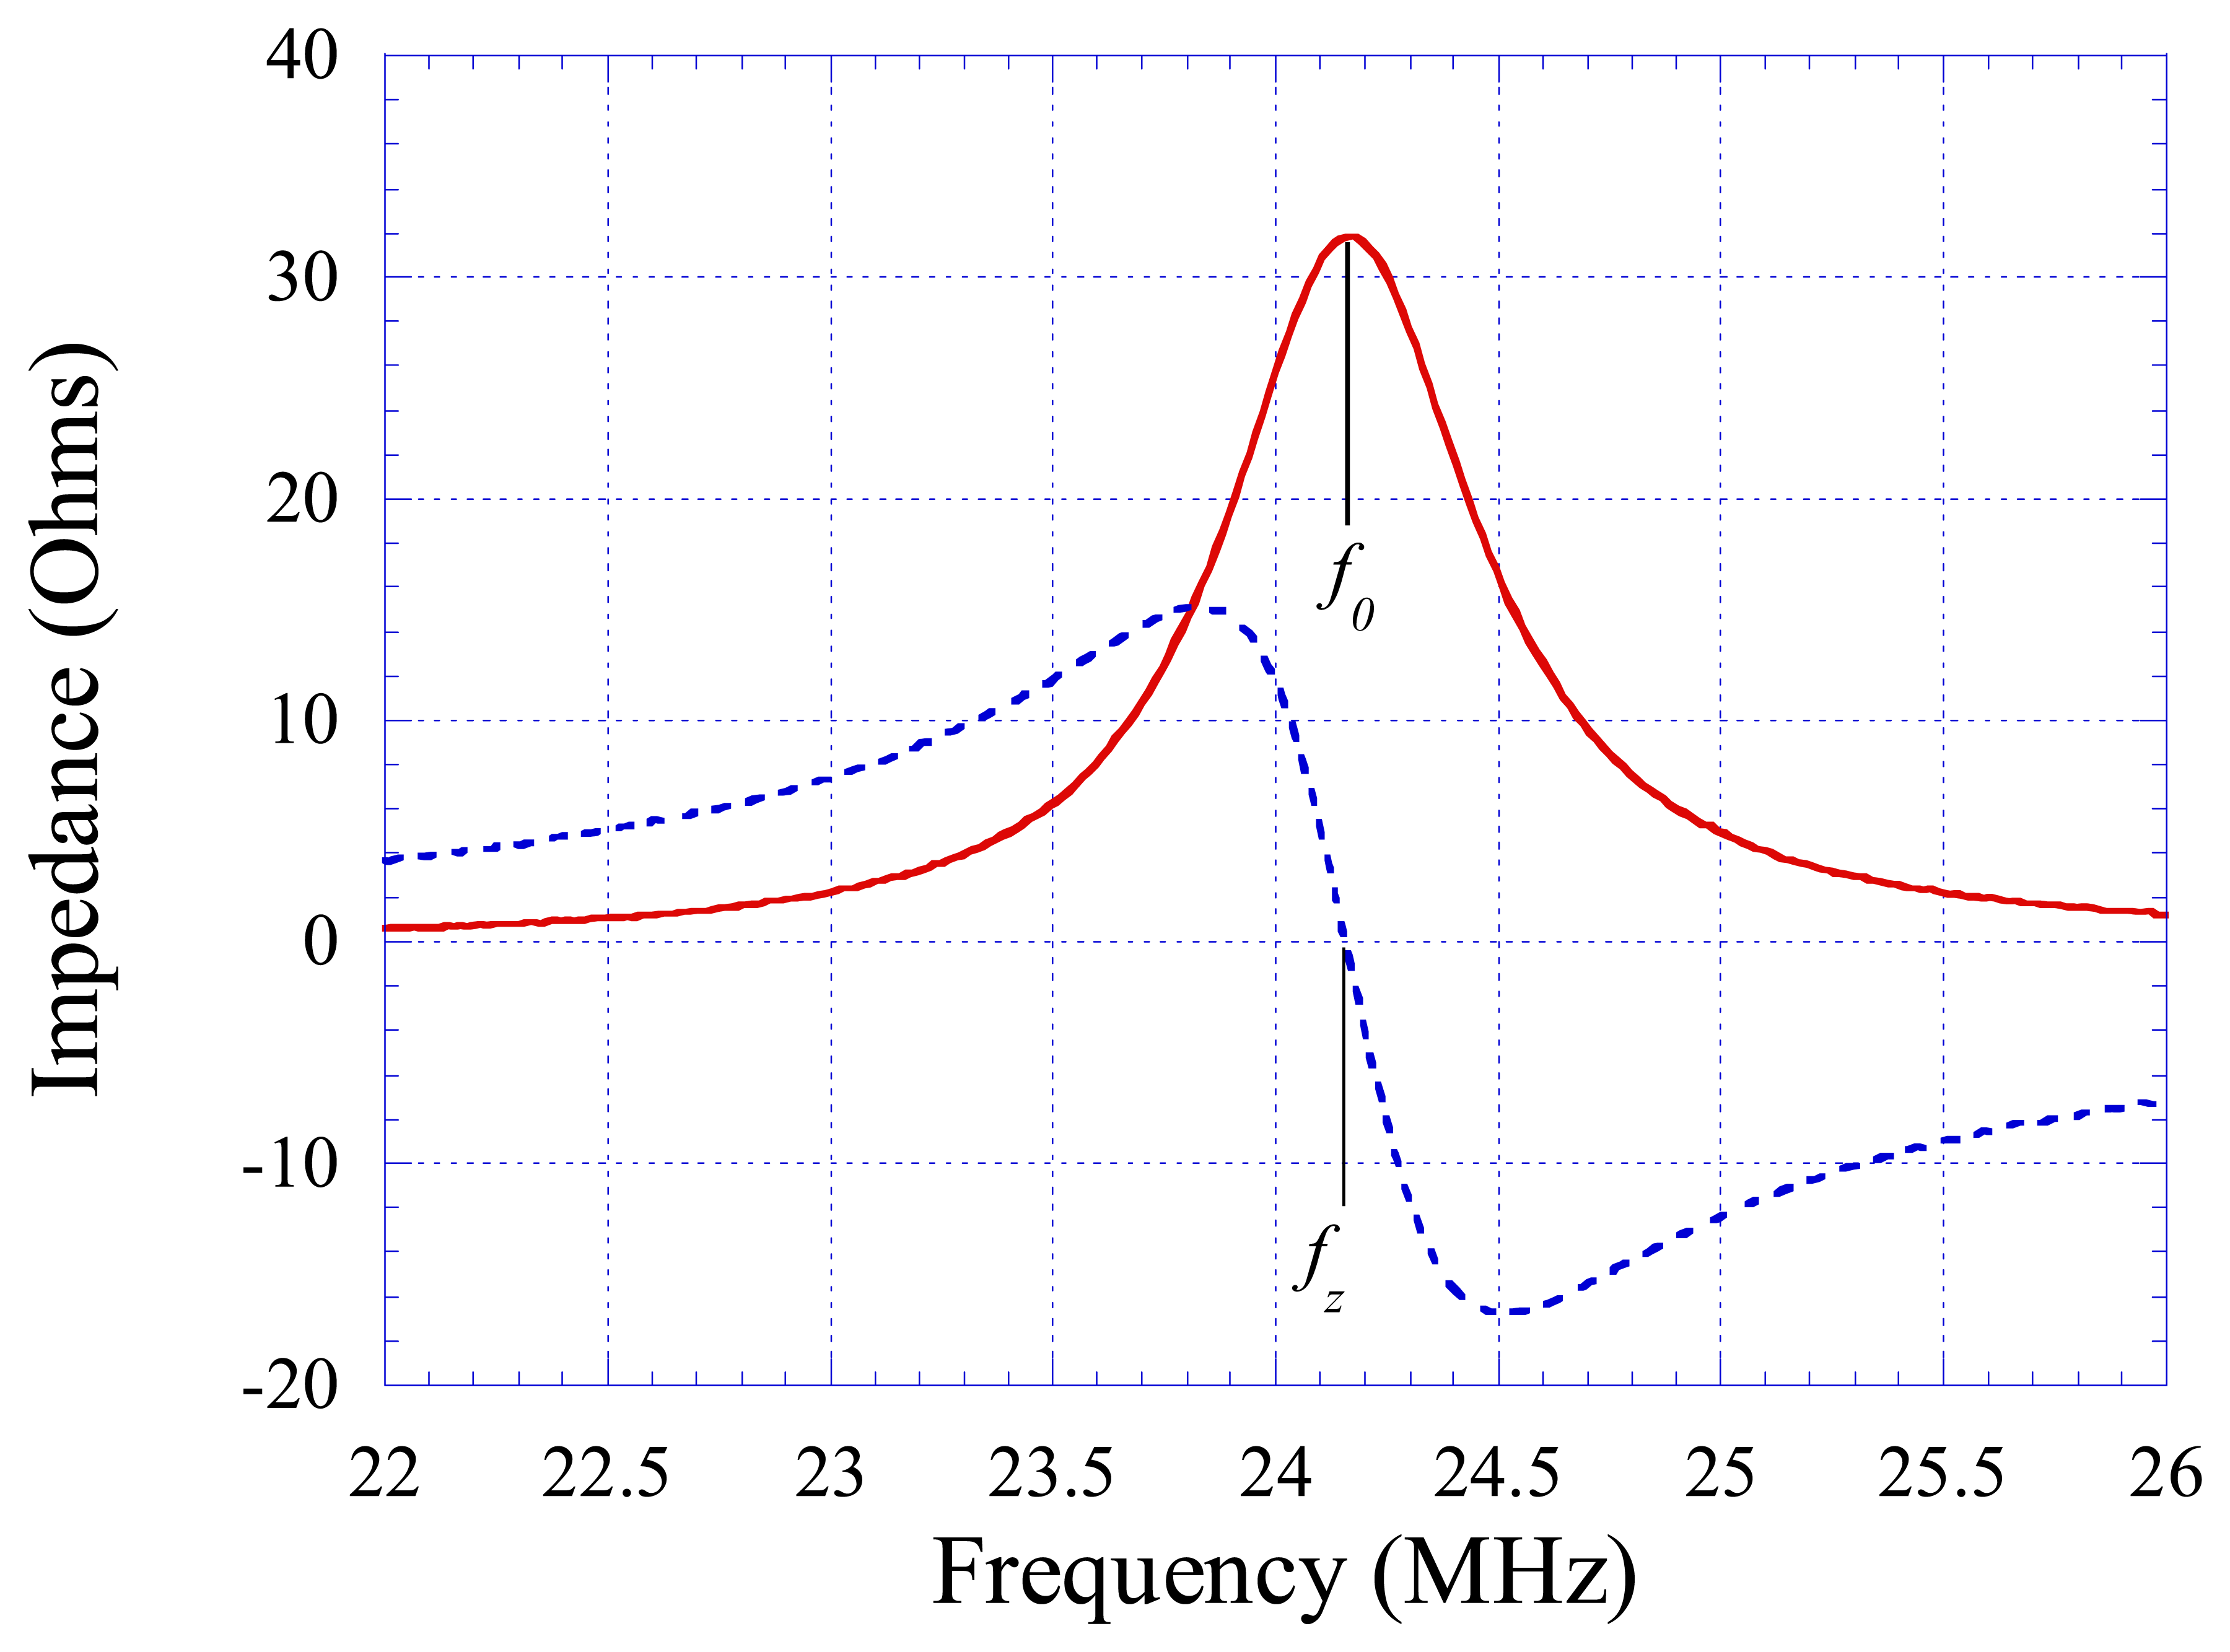
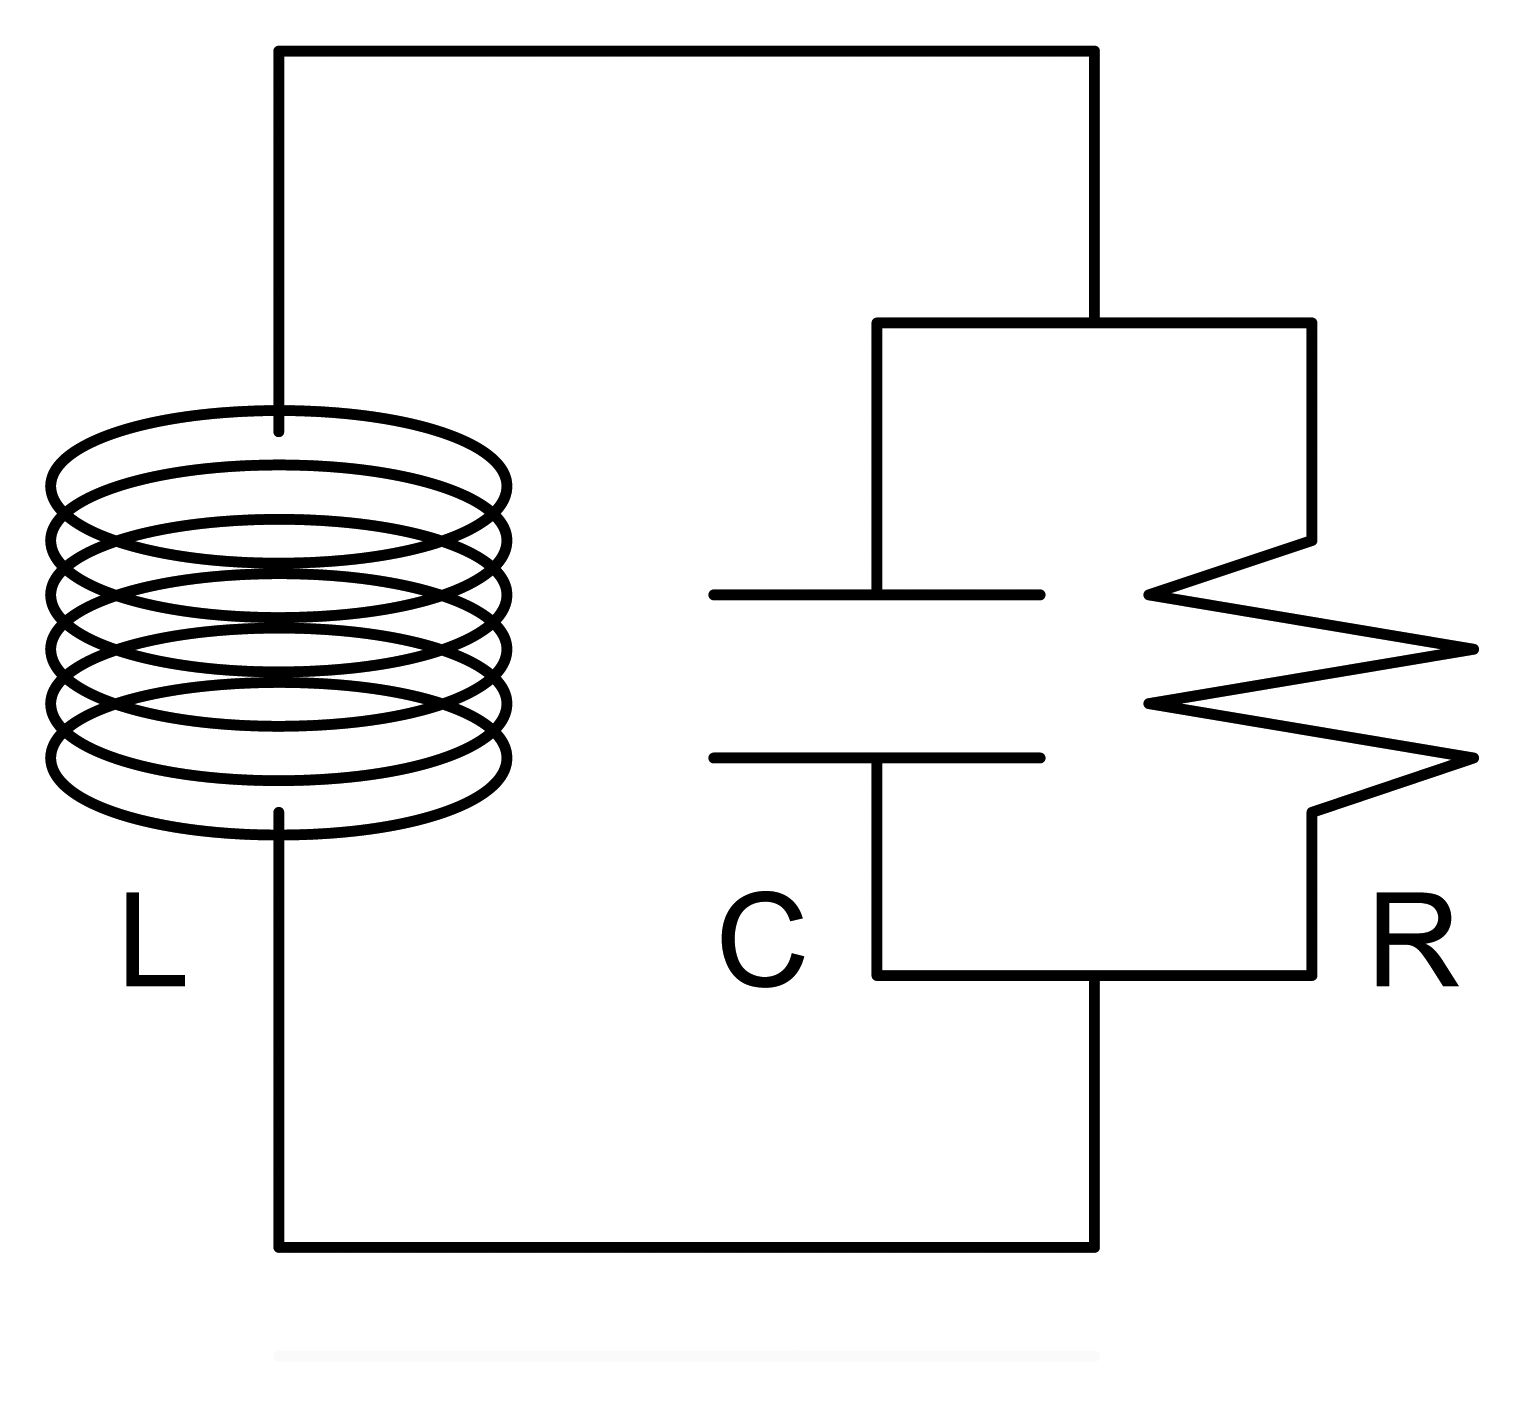
As illustrated in Fig. 2, the sensor is attached to the inner wall of the food package for monitoring the moisture content inside the food package. The sensor's resonant frequency is determined by measuring the impedance of the detection coil with an impedance analyzer. To remove the inductance of the coil, a background subtraction routine, which measures the impedance of the coil when the sensor is absent, is implemented prior to measuring the sensor response [7]. Fig. 3 shows the typical background-subtracted sensor impedance, where the resonant frequency f0 is defined as the frequency at the maximum of the real impedance (resistance), and the zero-reactance frequency fz is the frequency where the imaginary impedance (reactance) is at zero. To relate f0 and fz to sensor's inductor and capacitor, the sensor is represented with a serial connected capacitor C and inductor L as shown in Fig. 4. The capacitor is also in parallel with a resistor R to represent the capacitive loss.
Referring to Fig. 4, the resonant frequency and zero-reactance frequency are related to the R, L and C values as given by [7]:
The capacitance of the IDC, C, is dependent on its dimension given as [9]:
where lc is the length of the IDC fingers, Nc is the number of fingers on each IDC's terminal, ε0 is the free space permittivity, εr is the relative permittivity (dielectric constant) of the paper substrate, dc is the total spacing between two adjacent fingers, ds is the spacing between two adjacent fingers that is not covered by the conductor, and K is the complete elliptical integral of the first kind. Similarly, the inductance of the square spiral inductor, L, is dependent on its dimension given as [9]:
where Ni is the number of turn, and di and do are the inner and outer widths of the inductor, respectively.
As elevated humidity level increases the moisture content in the paper substrate, it increases its effective dielectric constant since the dielectric constant of water is about 78 and dry paper is generally less than 2 [12]. The increase in the effective dielectric constant of the substrate increases the capacitance of the IDC, leading to a reduction in the sensor's resonant frequency according to Eq. (1). The electrically conductive water vapor also increases the capacitive loss of the capacitor, which leads to the reduction in R. Since the inductance is constant throughout the experiment, Eq. (1) indicates that the resonant frequency of the sensor is purely dependent on the capacitance, so it is used directly to track dielectric constant variation. Conversely, the zero-reactance frequency is a function of capacitance and resistance, which depend on both dielectric constant and conductivity of the substrate.
The advantages of using the LC sensor are its passive, wireless nature, and low production cost which allows it to be used on a disposable basis. As illustrated in Fig. 2, the response of the LC sensor is remotely measured through a detection coil. In addition, the sensor is powered by the coil and does not require any internal batteries; thus there is no battery lifetime issue. The sensor is a simple resonant circuit consists of conductor lines printed on a paper substrate. The simplicity of the sensor design allows the sensor to be inexpensively fabricated and used on a disposable basis. The low sensor cost is critical to ensure commercial viability of this technology.
2. Experiments
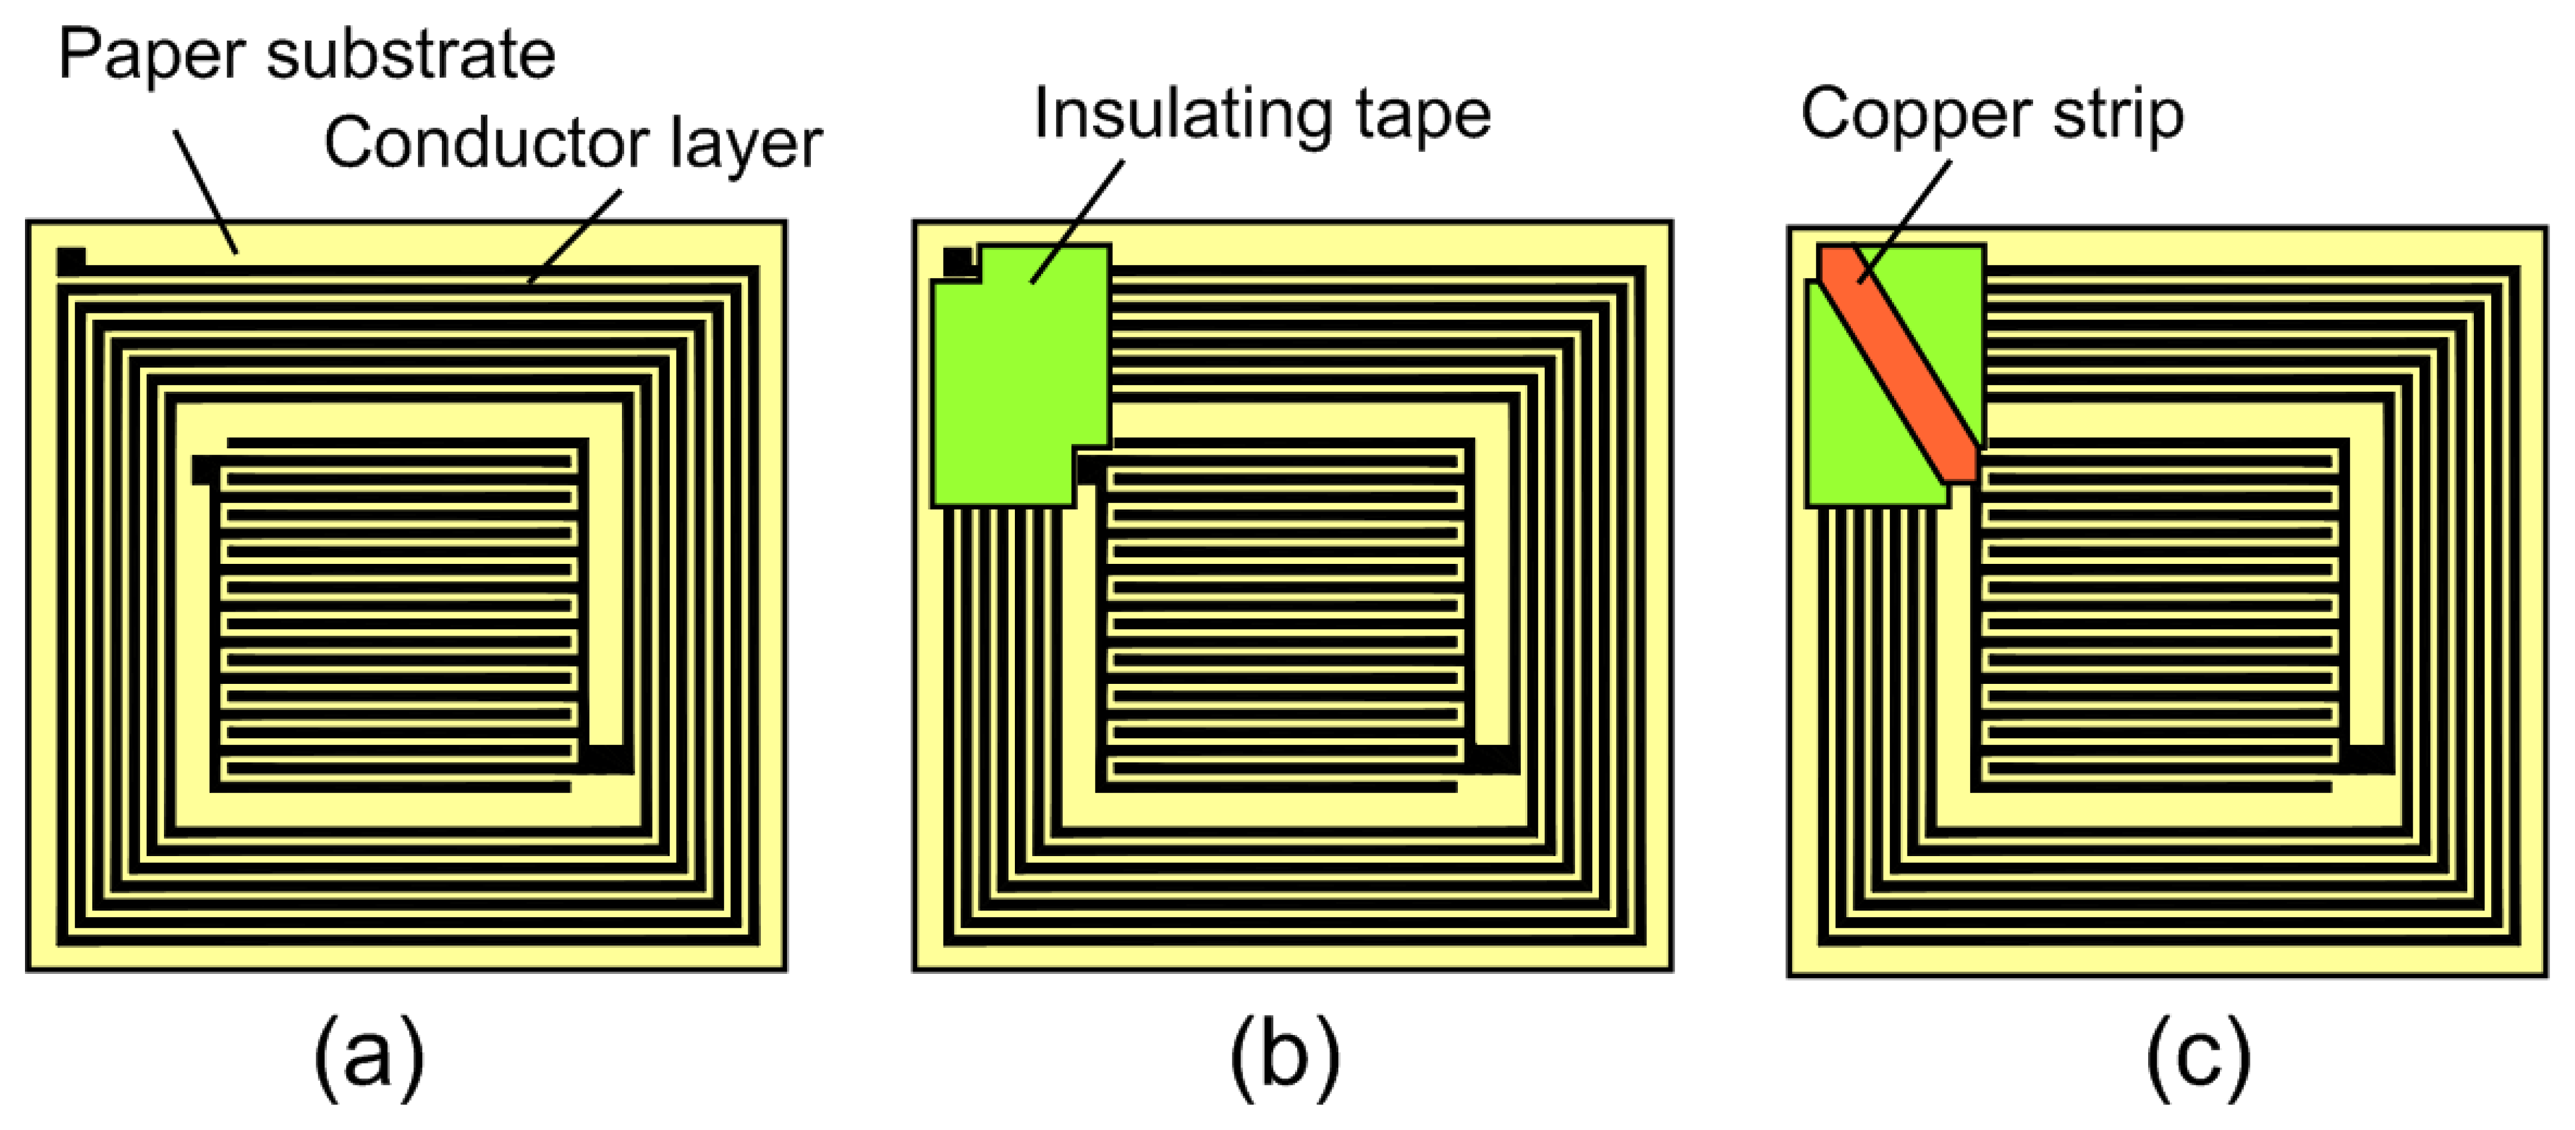
The sensor consisted of three layers: the bottom conducting layer that contained both the inductor and capacitor, a top conducting layer that connected the capacitor and inductor, and an insulating layer that separated the top and bottom conducting layers. As shown in Fig. 5, the LC resonant circuit was first printed on a paper-backed aluminum tape (10 μm thick) using a toner transfer paper. The exposed conductor was then etched with standard PCB enchanting solution (ferric chloride), followed by removing the printer toner with acetone. Although this conducting layer contained both the inductor and capacitor, the circuit was incomplete since only one of the terminals of both elements was connected. To complete the circuit, an insulating cellulose acetate layer of 50 μm thick was applied to isolate a portion of the inductor as shown in Fig. 5. This was followed by placing a thin strip of copper tape (20 μm thick) over the insulating layer and connecting the remaining ends of the capacitor and inductor.
Using Eq. (3), the capacitance of the sensor's IDC was calculated as 14.2 pF, which was closely compared to the measured capacitance of 15.7 pF (at 20% RH, 24 °C). Likewise, the inductance of the inductor was calculated using Eq. (4) as 2.86 μH, a close comparison to the measured inductance of 2.7 μH. The parasitic capacitance of the inductor, which depended on the width of the inductor's lines and the spacing between the lines, could not be estimated analytically. In this work, the parasitic capacitance of the spiral inductor was measured as 1.6 pF at 20% RH and 1.8 pF at 60% RH. Since the parasitic capacitance of the inductor was an order of magnitude smaller than the IDC and its humidity-induced variation was two orders of magnitude smaller, it was considered negligible in the current study.
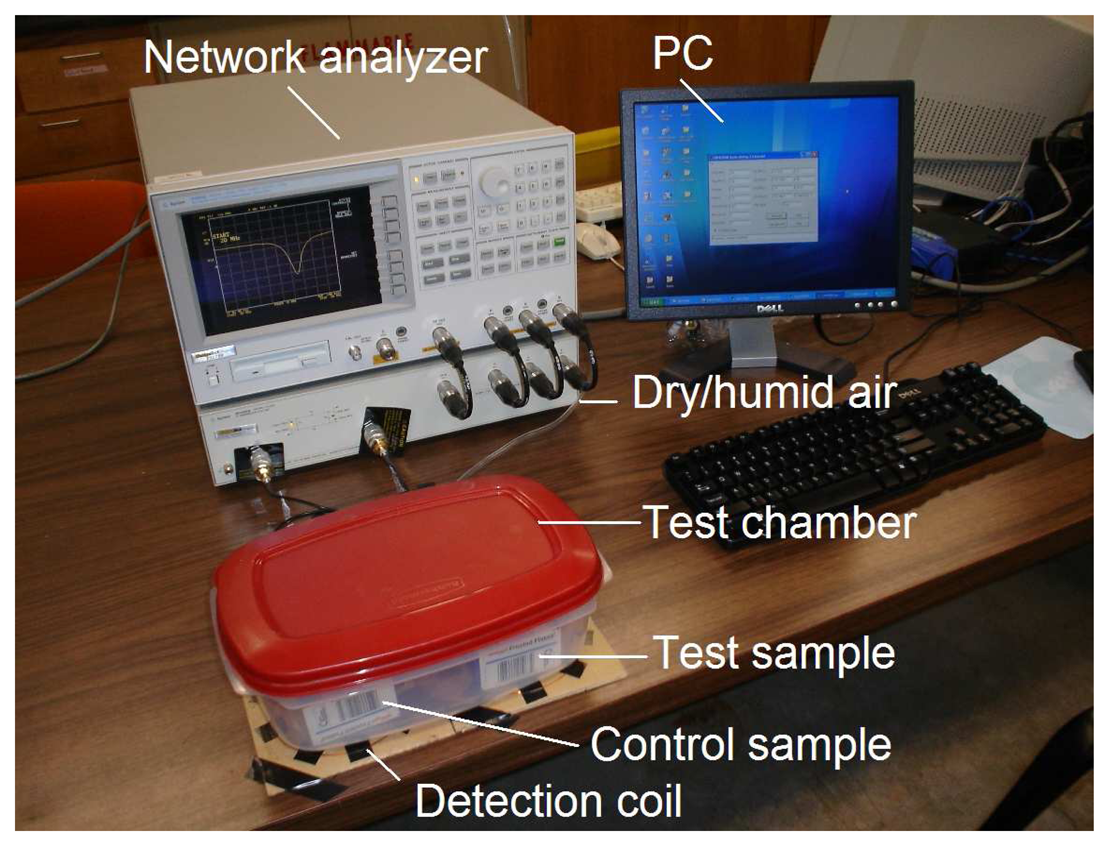
Fig. 6 depicts the experimental setup photographed in Fig. 7. Two sensors were separately inserted inside two similar food packages. One of the packages was immediately resealed to use as a control sample, and the other sample was left opened. Both food packages were placed inside a test chamber with a humidity level of 40 % RH – 60 % RH at 24 °C to accelerate the food spoilage. The responses of these two sensors were remotely monitored through two detection coils (one turn, 12 cm in diameter) by measuring the impedance of the coils with an Agilent Network/Spectrum Analyzer 4396A. Prior to measuring the sensor response, the network analyzer was calibrated using an Agilent Calibration Kit 85033E. The data was recorded and processed with a PC, and the measurement process was automated with customized software programmed with Visual Basic 6.0. In this work, packaged Kellogg's Cocoa Krispies cereal and Kellogg's Frosted Flakes cereal were chosen as the test samples.
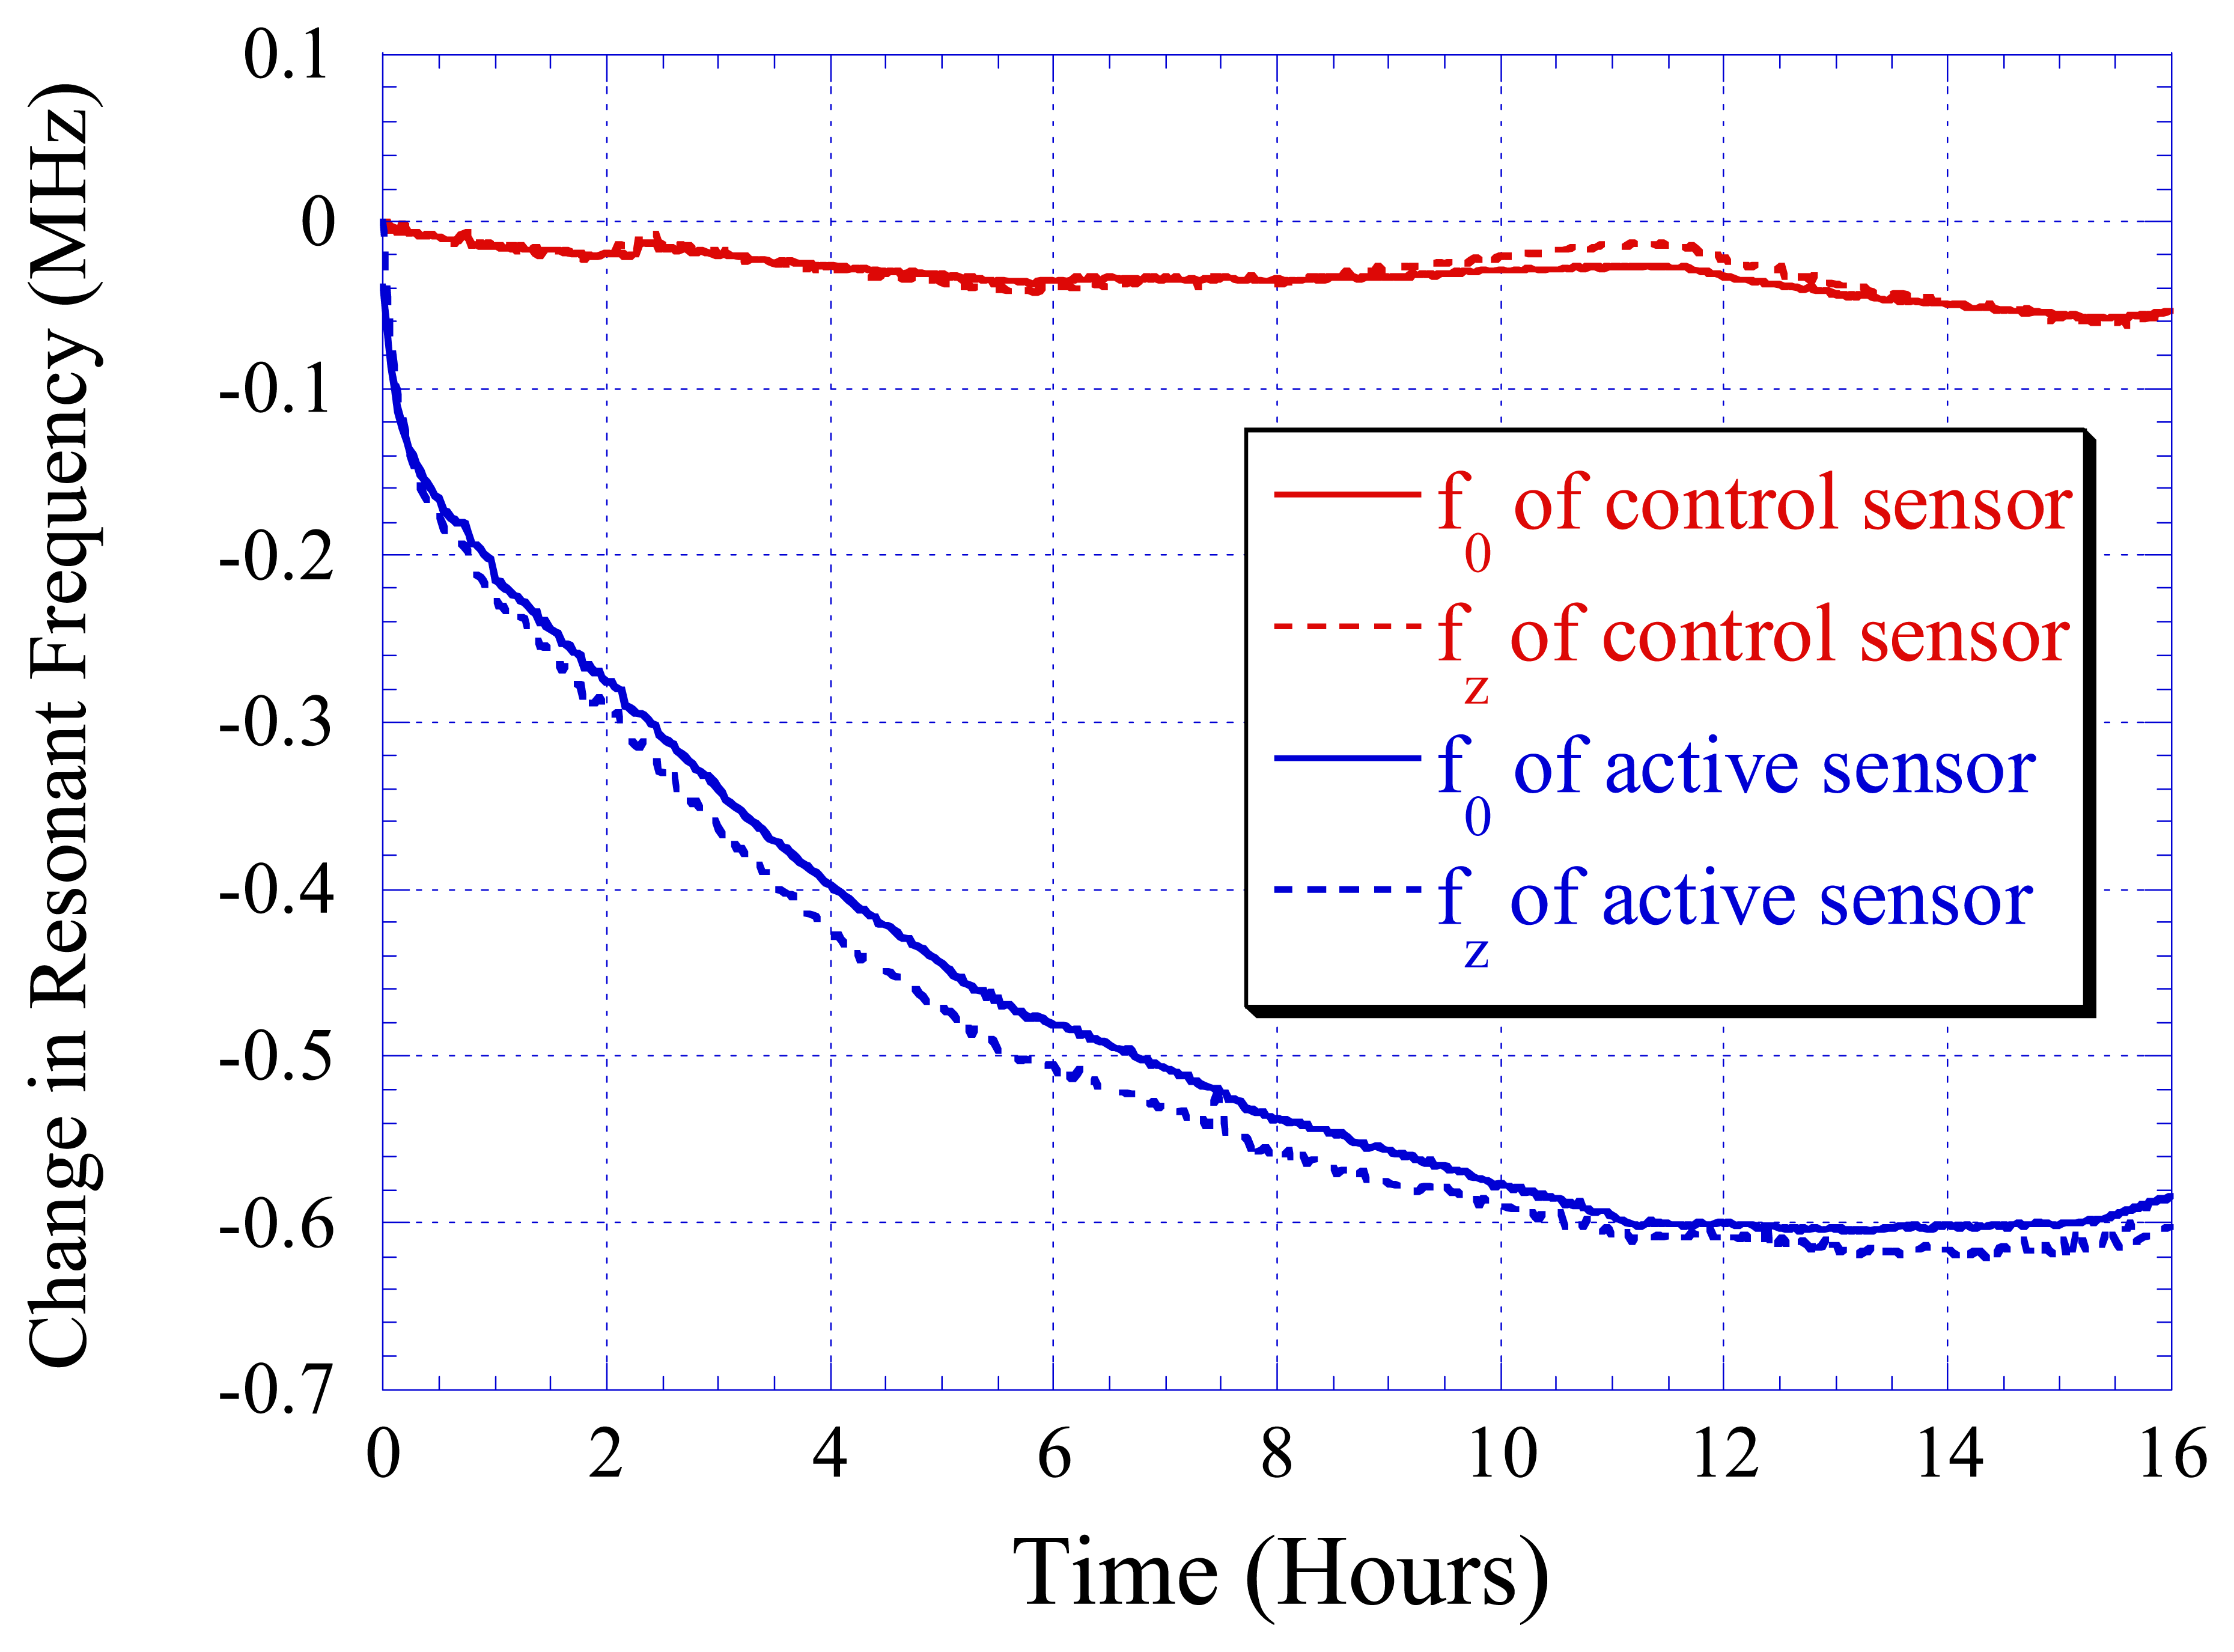
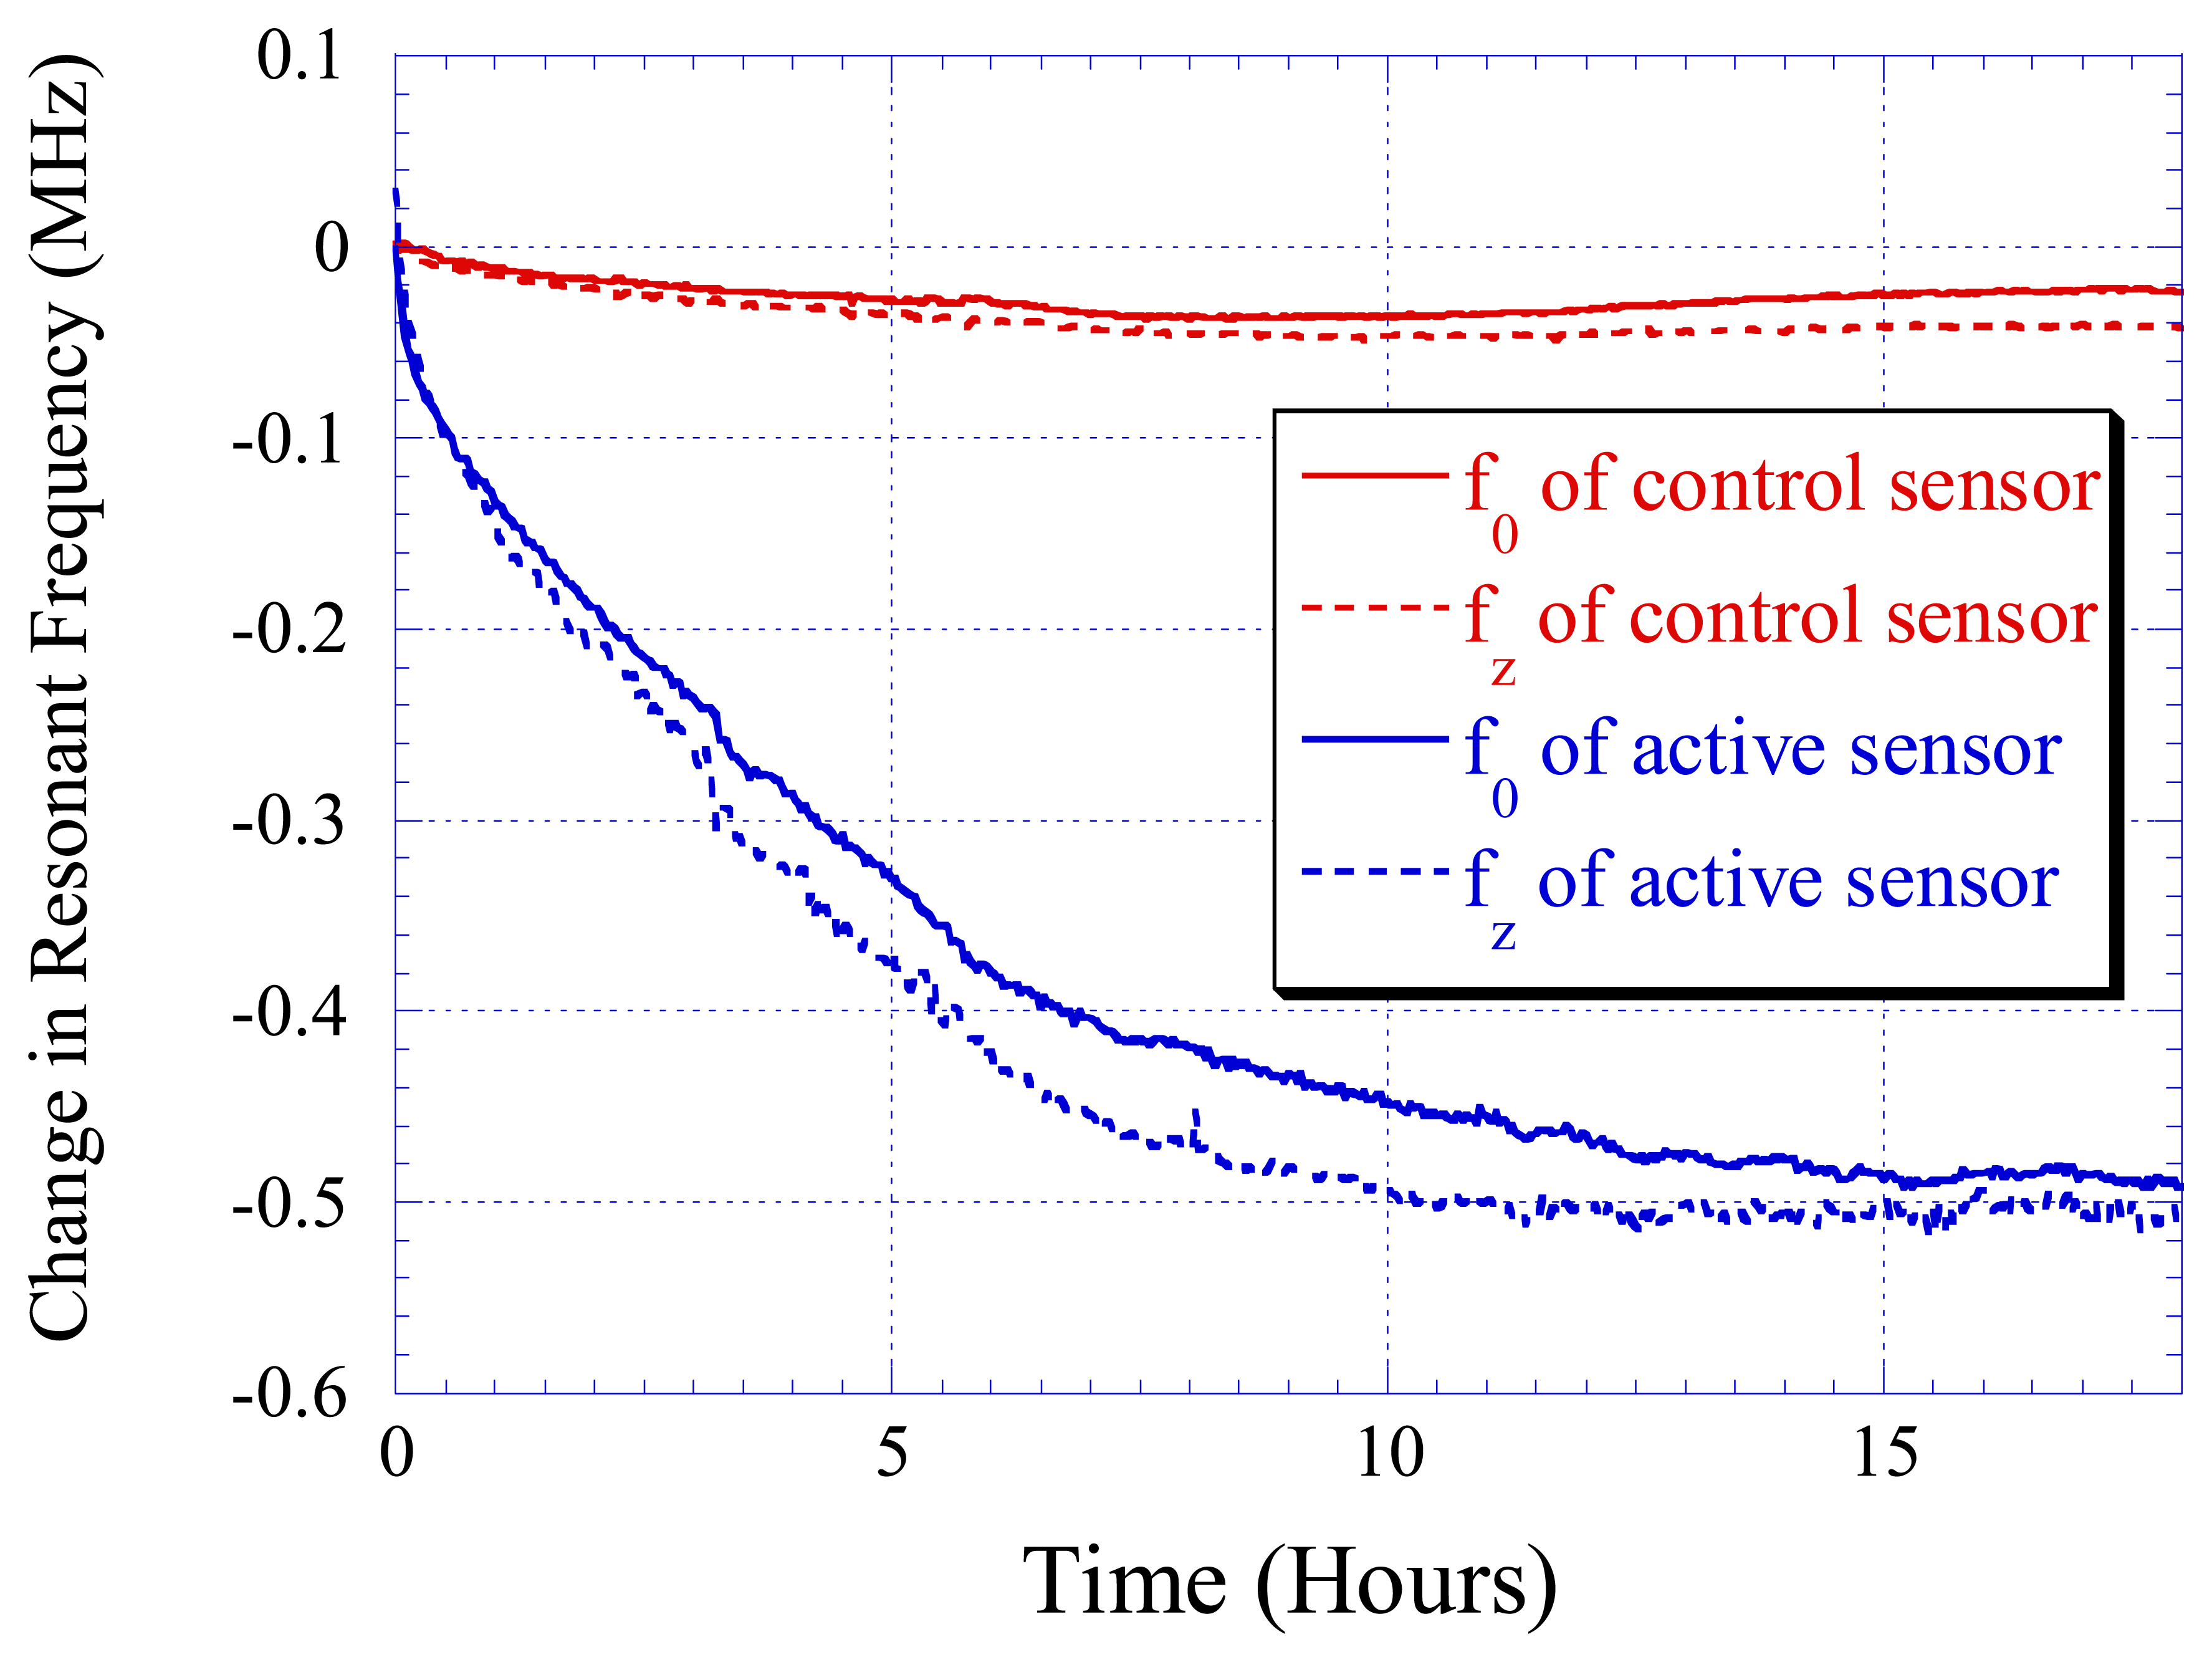
Fig. 8 shows the responses of the active and control sensors, which were embedded separately inside the opened and sealed Kellogg's Cocoa Krispies cereal packages. As shown in the figure, the response of the control sensor remained flat, while the resonant and zero-reactance frequencies of the active sensor had decreased. This indicated that the increase in capacitance was due to the water vapor adsorption on the paper substrate. The zero-reactance frequency was slightly lower, however, remaining close to the resonant frequency. This indicated that the absorption of water vapor to the sensor substrate increased the dielectric constant of the substrate but not the conductivity. Fig. 8 shows the response of the sensors in Kellogg's Frosted Flakes cereal packages. Similar to the previous experiment, the active sensor showed a continuous decrease in resonant and zero-reactance frequencies, while the response of the control sensor remained stable with respect to time.
Fig. 10 depicts the change of the sensor's resonant frequency as a function of relative humidity level at 24 °C. As illustrated in the figure, the resonant frequency decreased from 24.35 MHz to 23.8 MHz from 2 % RH to 44 % RH. The reversibility of the sensor is illustrated in Fig. 10. As shown in the figure, the sensor was completely reversible between the dry and wet cycles. The response time from wet-to-dry cycle of 3 hours was longer than that of dry-to-wet cycle of 1 hour. This can be explained by the fact that it took longer time for water vapor to evaporate than to absorb on a surface.
The purpose of this paper is to demonstrate the application of the LC sensor technology for food quality monitoring. Therefore, the operating frequency of the sensor, which was set as 23 MHz - 25 MHz following the designs of our previous work [7-11], might not match the allocated ISM frequency band for practical use. To commercialize this technology, the resonant frequency of the device has to be altered. A suitable frequency range may be between 30 MHz to 36 MHz, which is currently allocated for mobile remote control. The sensor's resonant frequency can be easily altered by changing the dimension and design of the spiral inductor and IDC as indicated in Eq. (3) and (4).
In this work, the sensor was interrogated with a network analyzer. For practical use, the sensor should be detected via a portable device as illustrated in Fig. 2. The device has to be calibrated prior to each measurement to ensure measurement accuracy.
3. Conclusion
A wireless, passive sensor was presented for in situ monitoring of food quality by measuring the humidity levels in the packaged food. The sensor was made of a planar inductor-capacitor resonant circuit, which had a resonant frequency that was proportional to the environment moisture content. The sensor was fabricated by first patterning the planar resonant circuit on a flexible paper-backing aluminum tape, followed by placing an insulating layer and a top conducting layer. Experimental results showed the resonant and zero-reactance frequency of the sensor decreased when opened food packages were exposed to humid air, while the resonant frequency of the sensor remained constant when the food packages were sealed. This work demonstrated the feasibility of using such a simple and effective sensor technology for monitoring the freshness of dry packaged food. In the future, a more advanced sensor will be developed by incorporating chemical or biological responsive coatings on the sensor to increase its selectivity towards various food pathogens.
Acknowledgments
The authors would like to thank Rupak Rajachar for his valuable suggestions in this project.
References and Notes
- Baeza, R.; Mielnicki, D.; Zamora, M. C.; Chirife, J. Effect of environmental daily temperature fluctuations over one year storage on the prediction of non-enzymatic browning in reduced-moisture foods stored at “ambient” temperature. Food Control 2007, 18, 1532–1537. [Google Scholar]
- Hough, G.; Calle, M. L.; Serrat, C.; Curia, A. Number of consumers necessary for shelf life estimations based on survival analysis statistics. Food Quality and Preference 2007, 18, 771–775. [Google Scholar]
- Balsa-Canto, E.; Rodriguez-Fernandez, M.; Banga, J. R. Optimal design of dynamic experiments for improved estimation of kinetic parameters of thermal degradation. Journal of Food Engineering 2007, 82, 178–188. [Google Scholar]
- Seguí, L.; Barrera, C.; Oliver, L.; Fito, P. Practical application of the SAFES (systematic approach to food engineering systems) methodology to the breadmaking process. Journal of Food Engineering 2007, 83, 219–228. [Google Scholar]
- Labuza, T.P. Functional Foods Dietary Supplements: Safety, Good Manufacturing Practice (GMPs) and Shelf Life Testing. In Essentials of Functional Foods.; Schmidl, M.K., Labuza, T.P., Eds.; 2000; Aspen Press: London. [Google Scholar]
- Bin, F.; Labuza, T.P. Considerations for applications of time-temperature integrators in food distribution. Journal of Food Distribution Research 1992, 23, 9–18. [Google Scholar]
- Ong, K. G.; Grimes, C. A.; Robbins, C. L.; Singh, R. S. Design and application of a wireless, passive, resonant-circuit environmental monitoring sensor. Sen. Actuators A 2001, 93, 33–43. [Google Scholar]
- Ong, K. G.; Wang, J.; Singh, R. S.; Bachas, L. G.; Grimes, C. A. Monitoring of bacteria growth using a wireless, remote query resonant-circuit sensor: application to environmental sensing. Biosensors Bioelectronics 2001, 16, 305–312. [Google Scholar]
- Ong, K. G.; Grimes, C. A. A resonant printed-circuit sensor for remote query monitoring of environmental parameters. Smart Mater Struct 2000, 9, 421–428. [Google Scholar]
- Ong, K. G.; Bitler, J. S.; Grimes, C. A.; Puckett, L. G.; Bachas, L. G. Remote query resonant-circuit sensors for monitoring of bacteria growth: application to food quality control. Sensors 2002, 2, 219–232. [Google Scholar]
- Ong, K. G.; Puckett, L. G.; Sharma, B. V.; Loiselle, M.; Grimes, C. A.; Bachas, L. G. Wireless, passive, resonant-circuit sensors for monitoring food quality. Photonics Boston, Proceedings of SPIE 2002, 4575, 150–159. [Google Scholar]
- Balanis, C. A. Advanced Engineering Electromagnetics; John Wiley & Sons: New York, 1989; p. 50. [Google Scholar]
Figure 1.
The LC sensor is comprised of a serial connected LC circuit printed on a paper substrate.

Figure 2.
The LC sensor is embedded inside the packaged food, and its response is remotely measured through a detection coil connected to the sensor reader.
Figure 2.
The LC sensor is embedded inside the packaged food, and its response is remotely measured through a detection coil connected to the sensor reader.

Fig. 3.
The real and imaginary portions of the impedance spectrum of the sensor after the background subtraction. The resonant frequency f0 is defined as the maximal of the real impedance, while the zero-reactance frequency fz is the zero of the imaginary impedance.
Fig. 3.
The real and imaginary portions of the impedance spectrum of the sensor after the background subtraction. The resonant frequency f0 is defined as the maximal of the real impedance, while the zero-reactance frequency fz is the zero of the imaginary impedance.

Figure 4.
The sensor is modeled as an inductor L and capacitor C connected in series. The capacitor loss is represented by the resistor R.
Figure 4.
The sensor is modeled as an inductor L and capacitor C connected in series. The capacitor loss is represented by the resistor R.

Figure 5.
The fabrication process of the sensor. (a) The bottom conductor layer was patterned, followed by (b) applying the insulating layer and (c) the top conductor strip to complete the resonant circuit.
Figure 5.
The fabrication process of the sensor. (a) The bottom conductor layer was patterned, followed by (b) applying the insulating layer and (c) the top conductor strip to complete the resonant circuit.

Figure 6.
Experimental setup for demonstrating the application of the LC sensor for real-time food quality monitoring.
Figure 6.
Experimental setup for demonstrating the application of the LC sensor for real-time food quality monitoring.

Figure 7.
Photograph of the experimental setup for demonstrating the application of the LC sensor for real-time food quality monitoring.
Figure 7.
Photograph of the experimental setup for demonstrating the application of the LC sensor for real-time food quality monitoring.

Figure 8.
Changes in f0 and fz when the active sensor was embedded inside an opened Kellogg's Cocoa Krispies cereal package, while the control sensor was within a sealed cereal package of the same type.
Figure 8.
Changes in f0 and fz when the active sensor was embedded inside an opened Kellogg's Cocoa Krispies cereal package, while the control sensor was within a sealed cereal package of the same type.

Figure 9.
Change in f0 and fz when the active sensor was embedded inside an opened Kellogg's Frosted Flakes cereal, while the control sensor was within a sealed cereal package of the same type.
Figure 9.
Change in f0 and fz when the active sensor was embedded inside an opened Kellogg's Frosted Flakes cereal, while the control sensor was within a sealed cereal package of the same type.

Figure 10.
The response of the sensor when it was cycled between dry air (2 % RH) and increasing humidity levels from 22 % RH to 44 % RH. The room temperature was 24 °C.
Figure 10.
The response of the sensor when it was cycled between dry air (2 % RH) and increasing humidity levels from 22 % RH to 44 % RH. The room temperature was 24 °C.

Figure 11.
The response of the sensor when it was cycled between 2% RH and 65% RH at room temperature (24 °C).
Figure 11.
The response of the sensor when it was cycled between 2% RH and 65% RH at room temperature (24 °C).

© 2007 by MDPI ( http://www.mdpi.org). Reproduction is permitted for noncommercial purposes.
Share and Cite
MDPI and ACS Style
Tan, E.L.; Ng, W.N.; Shao, R.; Pereles, B.D.; Ong, K.G. A Wireless, Passive Sensor for Quantifying Packaged Food Quality. Sensors 2007, 7, 1747-1756. https://doi.org/10.3390/s7091747
AMA Style
Tan EL, Ng WN, Shao R, Pereles BD, Ong KG. A Wireless, Passive Sensor for Quantifying Packaged Food Quality. Sensors. 2007; 7(9):1747-1756. https://doi.org/10.3390/s7091747
Chicago/Turabian StyleTan, Ee Lim, Wen Ni Ng, Ranyuan Shao, Brandon D. Pereles, and Keat Ghee Ong. 2007. "A Wireless, Passive Sensor for Quantifying Packaged Food Quality" Sensors 7, no. 9: 1747-1756. https://doi.org/10.3390/s7091747