Cantilever Micro-rheometer for the Characterization of Sugar Solutions

Ludwig-Maximilians-Universität München, Center for NanoScience (CeNS) and Dept. Earth and Environmental Sciences, Theresienstrasse 41, 80333 Munich, Germany
*
Author to whom correspondence should be addressed.
Sensors 2008, 8(1), 10-22; https://doi.org/10.3390/s8010010
Submission received: 29 October 2007
/
Accepted: 4 January 2008
/
Published: 9 January 2008
(This article belongs to the Special Issue Cantilever, Microcantilevers and Nanocantilever Sensors and Biosensors)
Abstract
:The volume required for the rheological characterization of fluids can be minimized by using micromechanical cantilevers as viscosity sensors. Here, a simple measurement tool for the characterization of sugar solutions is proposed. The sensor consists of a micromechanical cantilever as used in an atomic force microscopy which is integrated into a closed fluid handling system. Fluid properties are derived from an analysis of the power spectral density of the fluctuations of the cantilever deflection signal. The data acquisition system is operated with standard consumer computer components, which limits the costs for the hardware. Measurements with different sugar solutions indicate that the sensor system provides reliable viscosity values for sugar concentrations as they occur in biological systems. The viscosities of the sugar solutions could be evaluated with an error smaller than 5 %.
1. Introduction
A rheological characterization of liquids in an integrated device is of high interest in biotechnology, medicine and automotive engineering. Since traditional measurement techniques require at least several millilitres of sample fluid, the last years have seen an increased interest in the miniaturization of measurement tools. To minimize the required fluid volume, rheological characterizations have to be carried out in a microfluidic system.
There have been several approaches to establish vibrating plates as viscometers besides standard measurement techniques such as falling ball, rotation and capillary viscometry. The influence of fluids on vibrating plates and their possible use as sensors has already been discussed in the 1960s [1]. Today, a vast choice of micromechanical cantilevers is commercially available due to the widespread use of the atomic force microscope (AFM). These AFM cantilevers are usually between 100 μm and 400 μm long, 20 μm to 40 μm wide and 2 μm thick. Typical resonant frequencies in water are within the range from 1 kHz to 100 kHz. These characteristics make AFM cantilever well suited physical sensors for the characterization of fluid viscosity based on the principle of vibrating plates. Several research groups demonstrated viscosity measurements by AFM cantilevers. Two measurement strategies can be identified. One relies on the analysis of stochastic fluctuations due to Brownian motion [2, 3] the second on the measurement of the cantilever response to sinusoidal forcing [4]. The former does not require additional actuation of the sensor, whereas an appropriate actuation scheme is rired for the latter. Although often neglected, there are subtle differences between both schemes. Theoretical calculations showed that the peak frequency of the response to acoustic excitation is higher than the peak frequency of Brownian motion in highly viscous fluids [5]. Since this peculiarity of the acoustic excitation is usually neglected in the theoretical literature, frequency measurements based on the analysis of Brownian cantilever fluctuations can be expected to be a closer match to theoretical values than measurements obtained by acoustic cantilever excitation.
Another important issue is the simultaneous measurement of liquid density and viscosity since both critically depend on the temperature. Sader et al. developed a theoretical framework [6, 7] for the description of cantilever vibrations in viscous fluids which also allows for the simultaneous measurement of both parameters [8]. Recent theoretical works discussed viscous drag on microcantilevers [9], frequency response of cantilevers near a solid wall [10], and hydrodynamic loading [11] by finite-element analysis. Experimental works covered the application of special cantilever geometries [12], the vibration characteristics in the vicinity of surfaces [10], the influence of the temperature [13], the use of uncalibrated cantilevers [14, 15] and the applicability of cantilever MEMS sensors to the low-flow evaluation of density and viscosity of liquids [16]. Recently it was shown that high flow rates increase the resonant frequency of cantilevers in thin channels [17] due to high pressure differences.
In this work, we demonstrate viscosity measurements of sugar solutions. Sugar solutions are valuable test systems for such a microfluidic device because many biological liquids contain a remarkable amount of sugar. The sugar concentration in plant saps can reach typical values up to 0.8 mol/l [18]. In order to limit the amount of liquid under investigation, a low-cost system for the rheological characterization of liquids was integrated into a microfluidic system. The device was based on commercially available microcantilevers as used in atomic force microscopy.
2. Theoretical Background
Data analysis was based on the method of hydrodynamic function as introduced in Refs. [6-8]. A simple model function was fitted to the power spectral density of stochastic cantilever oscillations. The cantilever was modelled as a beam with rectangular cross section and rectangular plane view, which has a length to width ratio significantly larger than one. These conditions are valid for many commercial available rectangular cantilevers. For quality factors Q ≫ 1, the amplitude response A(ω) of the cantilever can be estimated in the vicinity of the resonance peak as a damped driven harmonic oscillator [19]
where A0 denotes the amplitude at the frequency ω = 0, Q the quality factor and ω and ωR the radial frequency and resonant frequency, respectively. From the theory of the damped harmonic oscillators it is clear that with decreasing Q the difference between the resonant frequency ωR and the peak frequency in the amplitude response curve increases.
For cantilever calibration and measurement of rheological parameters, we used equations (2a) and (2b) as given in Ref [8]. Resonant frequency ωR and quality factor Q in the fluid are given by
Here, parameter ωvac denotes the resonant frequency in vacuum, ρ the density of the fluid, μ the linear mass density of the beam, and Γ the hydrodynamic function as given in Ref. [6]. The indices i and r indicate imaginary and real part of the function. For calibration, the equations (2) and (3) have to be solved for ωvac and μ which leads to
After calibration of the cantilever with a test fluid with known properties, the viscosity and density of any fluid can be calculated numerically by simultaneously solving equations (2) and (3) by a computer algebra program such as Mathematica™.
3. Experimental Setup
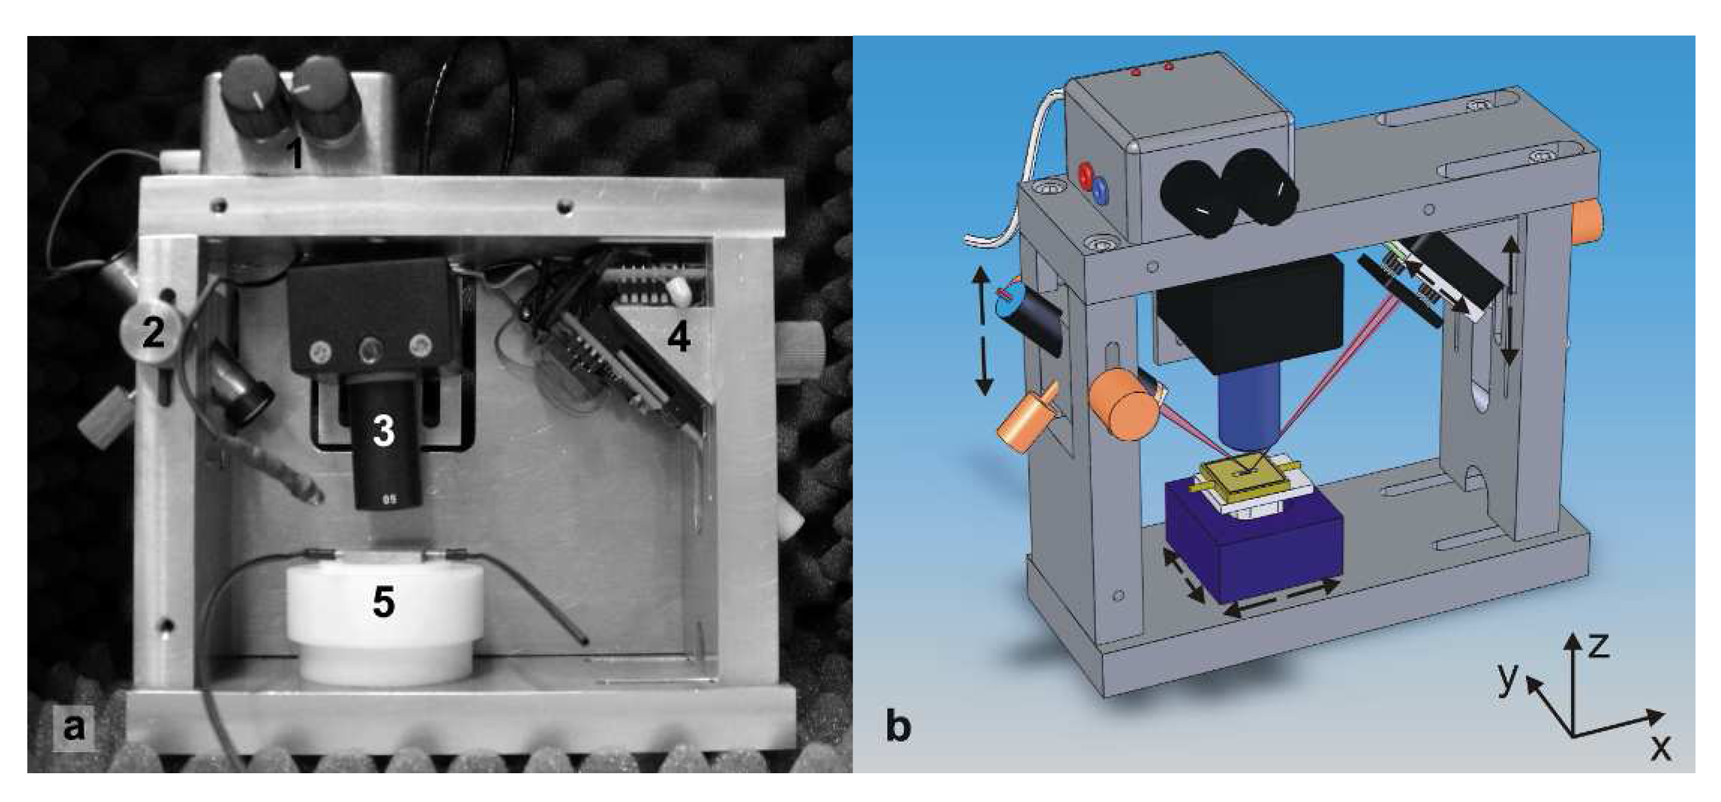
The measurement system consisted of a mechanical measuring stage, a pre-amplifier, a signal conditioning electronics, and a commercially available sound card for analogue to digital conversion. A steel frame (L × W × H = 160 mm × 60 mm × 140 mm) held all mechanical components of the sensor system. A video camera was attached on the top plate of the frame for optical control and could be adjusted in z-direction for focussing. The support for the measuring chamber was placed at the bottom of the frame. The support could be moved in x- and y-directions to adjust the cantilever in the field of view of the camera (figure 1).
Figure 2 shows the measurement chamber which was made from a 20 × 20 × 3.3 mm3 copper block to ensure thermal stability. A groove in the middle served as measurement chamber. Two supply channels were drilled into the copper block, connecting the measurement chamber with the left and right side of the block. Two flexible plastic tubes (Tygon®, 1.06 mm ID) connected the supply channels to a syringe which served as supply reservoir and to a waste container. The liquid was fed to the measurement chamber by a syringe pump. A PT100 resistance thermometer attached to a digital multimeter was used to control the temperature of the measurement chamber. A stable bulk temperature of 25°C was observed during the measurements. The cantilever chip was glued onto a glass cover slip by a two component epoxy resin (plus endfest 300, UHU GmbH & Co KG, Germany). The channel was then sealed with this glass cover slip using hot-melt adhesive. The total volume of the channel is about 10 μl which is reduced to less than 1 μl after inserting the cantilever chip.
For all measurements commercial cantilevers were used (NSC12, MikroMasch, Tallinn, Estonia). E-type cantilevers with a nominal resonant frequency of 29 kHz were used for no-flow measurements. The measurements under steady flow were also performed with the 29 kHz E-type levers and additionally with a harder cantilever (D-type, nominal resonant frequency 39 kHz). Both types of cantilevers had a width of 35 μm. The length was 300 μm (D-type) and 350 μm (E-type). Both thus met the condition of an aspect ratio significantly greater than one [3].
The cantilever deflection was read out by light lever detection. The laser diode (7mW, DL-3147-060 of IMM Meβtechnologie GmbH, Germany) and the photo split detector (QP50-6 U1 of Silicon Sensor GmbH, Germany) were mounted on the sides of the frame. The laser diode could be moved along the vertical axis of the stage for aligning the laser on the cantilever, as well as in the direction of its optical axis for focussing. The photo diode could be moved in the z-axis of the stage and in the plane parallel to its surface as depicted in figure 1 (b). This mounting allows the operator to place the spot of the laser beam in the centre of the diode.
The electronics consisted of a signal conditioning unit together with an amplifier (OP467, Analog Devices, MA, USA) and a commercial soundcard (24bit, 96kHz, Sound Blaster Audigy 2NX™, Creative Labs Inc., Singapore) for data acquisition. Four current to voltage converters were mounted in the direct vicinity of the photodiode, thus minimizing noise pick up. The pre-amplified signals were passed through an analog processing electronics to calculate the difference between top and bottom segments and the resulting signal was recorded by the soundcard. The electronic bandwidth was 20 Hz to 45 kHz. Frencies between 45 kHz and 48 kHz showed a linear roll off due to the anti-aliasing filter of the soundcard. The data acquisition was controlled by a LabView (National Instruments, Austin, TX, USA) program that incorporated a publicly available LabView VI to access the soundcard, a power-spectral density module and averaging routines.
Experiments were carried out in air, in distilled water, and in various sugar solutions at concentrations from 0.2 mol/l up to 2.0 mol/l. Distilled water was used as reference liquid for calibration of the system. Solutions of the monosaccharides fructose (C6H12O6) and glucose (C6H12O6), as well as of the disaccharide sucrose (C12H22O11) were characterized. All carbohydrates were prepared by first producing a 2.0 mol/l stock solution that was diluted to the desired concentration. After adjusting the concentration to the desired value, the liquids were degassed in an ultrasonic bath and then injected into the chamber with a syringe pump. For static measurements a series of measurements was carried out without flow. During the dynamic measurements a steady flow of 3 μl/s was maintained. After each measurement, data were Fourier transformed and a complete set of 250 measurements was consecutively averaged. After flushing the measurement chamber with air it was refilled with new solution to a total number of 5 measurement sets for each concentration.
To evaluate the absorption of light in the sugar solutions in the vicinity of the laser's wavelength, absorption spectra were acquired using a UV-VIS spectrometer (ISS UV/VIS USB 4000, Ocean Optics, Dunedin, FL, USA) that was ipped with a grating and a diode array for simultaneous acquisition of full spectra within a range from 200 nm to 950 nm wavelength.
4. Results and Discussion
4.1. Noise measurements
The measurements in water and sugar solutions showed a clear shift in resonant frequency and Q-factor in comparison to measurements in air. Figure 3 shows typical power spectral densities of the cantilever deflection signal in air, distilled water and 2 mol/l sucrose solution. The datasets were normalized to their total power (area beneath the graph). The signal to noise ratio, defined as the ratio between the peak height and the root mean square (rms) amplitude of the noise in the signal, was about S/N = 100 for the measurement in air.
In liquid, the signal to noise ratio decreased from S/N = 10 in distilled water to a minimum value of S/N = 5 with increasing sugar concentration. The resonant frequency decreased from 39 kHz in air to about 16 kHz after flooding the chamber with distilled water. The quality factor decreased from Q = 147 to Q = 3.3. After water was exchanged by 2.0 mol/l sucrose solution the resonant frequency was reduced further to 9 kHz and the quality factor dropped to Q = 1. Thus the microcantilever was critically or nearly critically damped in sugar solution. This effect was caused by the differences in viscosity and density between water and sucrose solution. A slight roll-off at frencies over 42 kHz was due to the low-pass anti-alias filter of the soundcard. In the low frequency range, the measurement bandwidth was restricted to frencies larger than 1.5 kHz since at lower frencies the signals were dominated by 1/f-noise.
4.2. Sensitivity to sugar concentration
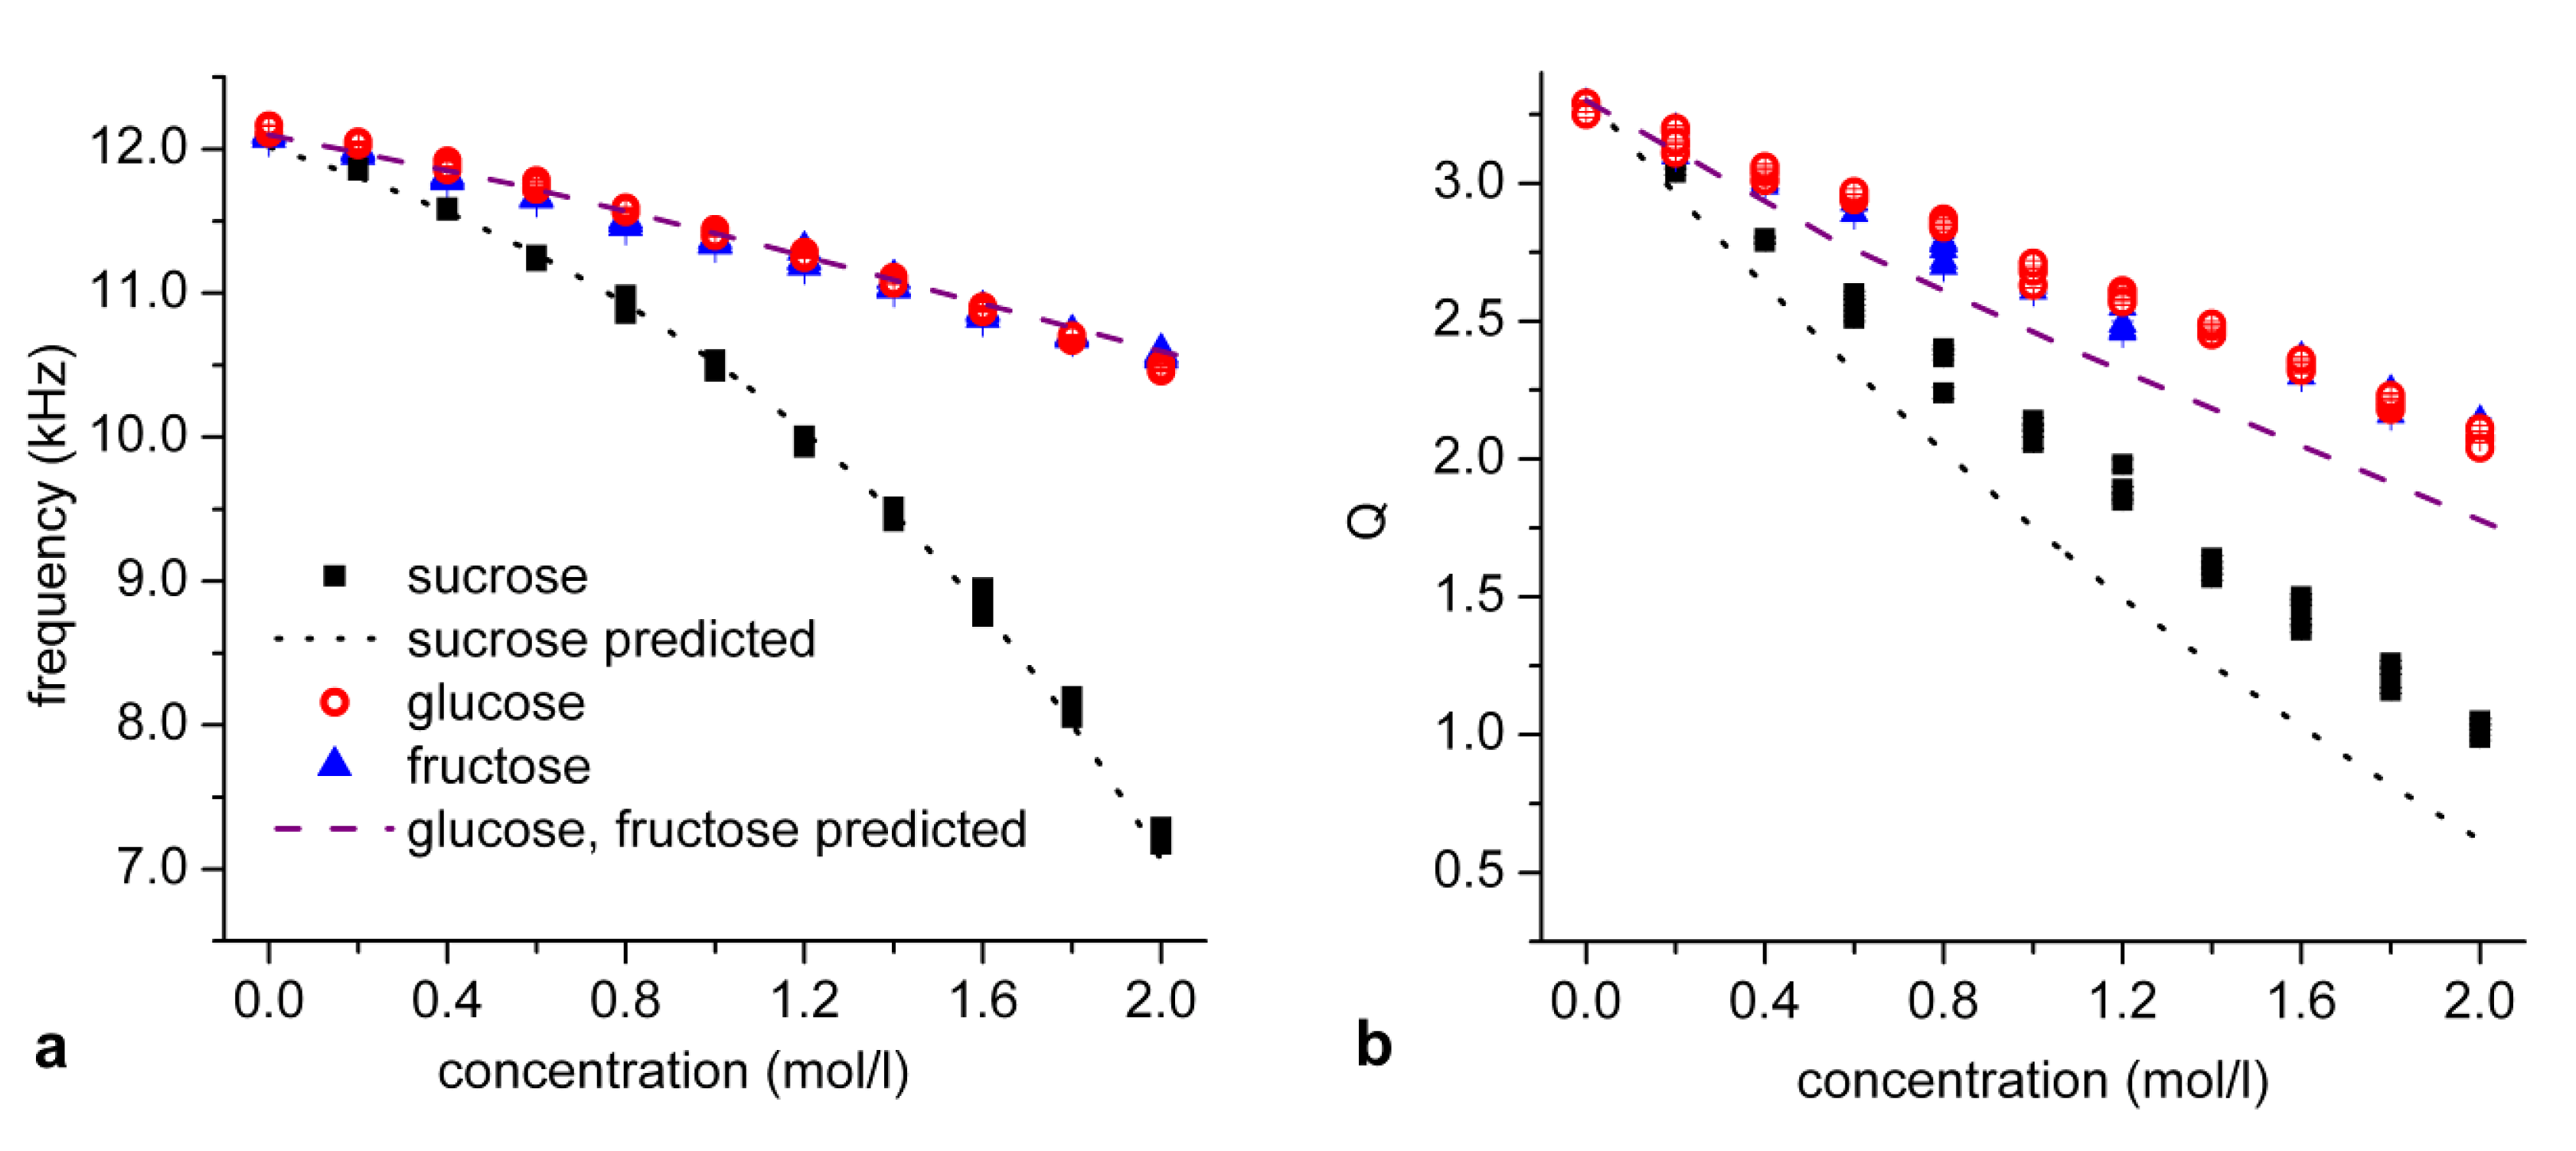
Figure 4 shows the resonant frencies and the quality factors Q for the 29 kHz E-type cantilever in comparison to theoretical values predicted on the basis of literature values. The experimental values for the quality factor Q and resonant frequency f = ω/2π were obtained by fitting the squared response of an oscillator as given by equations (1) to the power spectral density of the cantilever deflection signal. To predict the theoretical values ftheo and Qtheo the viscosities and densities of the solutions were taken from reference [20] and inserted into equations (2) and (3). For sucrose, additional literature values were taken from Refs. [2-4].
For zero concentration, i.e. in pure water, all measurements showed the same frequency and quality factor within the limits of the experimental error. With increasing concentration the resonant frencies decreased as illustrated in fig. 4 (a). For the glucose measurements the resonances decreased from 12.10 kHz in pure water to 10.50 kHz in 2.0 mol/l solution with a maximum error of 20 Hz. The fructose measurements showed a slightly smaller slope. The resonant frequency decreased to 10.6 kHz (± 20 Hz) in 2.0 mol/l solution. In sucrose solution, the resonant frequency dropped to 10.20 kHz (± 30 Hz) in 1.0 mol/l solution and to 6.85 kHz (± 50 Hz) in 2.0 mol/l solution. An exponential behaviour of the frequency reduction was observed in the case of sucrose solution. The frequency change in the solution of the disaccharide sucrose was significantly larger than in the monosaccharides fructose and glucose. This difference can be explained by the higher molecular weight and the bigger size of the sucrose molecule. In general, the relations between concentration and resonant frencies well matched the theoretical predictions of the resonant frequencies.
As indicated in fig. 4 (b) the quality factor also decreased with increasing concentrations. The experimental error was 15 % as obtained from the deviation between the fit and the extremal measurement values. The quality factor in glucose and fructose solution decreased from its maximum value of Q = 2.45 in pure water to a minimum of Q = 1.65 at 2 mol/l. In the sucrose, the quality factor decreased to Q = 1.67 at 1.0 mol/l and Q = 0.91 at 2.0 mol/l concentration. In general, the measured quality factors were larger than the predicted quality factors Qtheo. The systematic deviation between both increased from less than 10 % at low concentrations to 50% for highly concentrated sucrose.
4.3. Influence of laser heating
As discussed in the previous section there was a systematic discrepancy between theoretically predicted and experimentally measured Q-factors. Such a deviation could be a sign of a heating up of the solutions during the measurement process since viscosities are reduced at higher temperatures. This assumption is also supported by experiments reported by Kim and Kihm [13], who showed that the change of resonant frequency of a microcantilever at increasing temperatures is mainly explained by a reduced viscosity. In our measurement system, no mechanical energy is coupled into the liquid. The detection laser is the only possible source of heat. Thus, UV/Vis-absorption spectra were acquired in order to estimate the amount of energy coupled into the liquid by laser heating. In general, the absorbance A is proportional to the concentration and the path length, as it is predicted by the Beer-Lambert law
where α(λ) denotes the wavelength dependent absorption coefficient, l the path length and c the concentration of the solution. Briefly, the absorbance increases linearly with the concentration and the path length. The spectra in figure 5 show an absorbance of 0.02 at 635 nm wavelength on a path length of 1 mm in 1 mol/l sucrose. The absorbance increased to 0.06 in 2 mol/l sucrose solution.
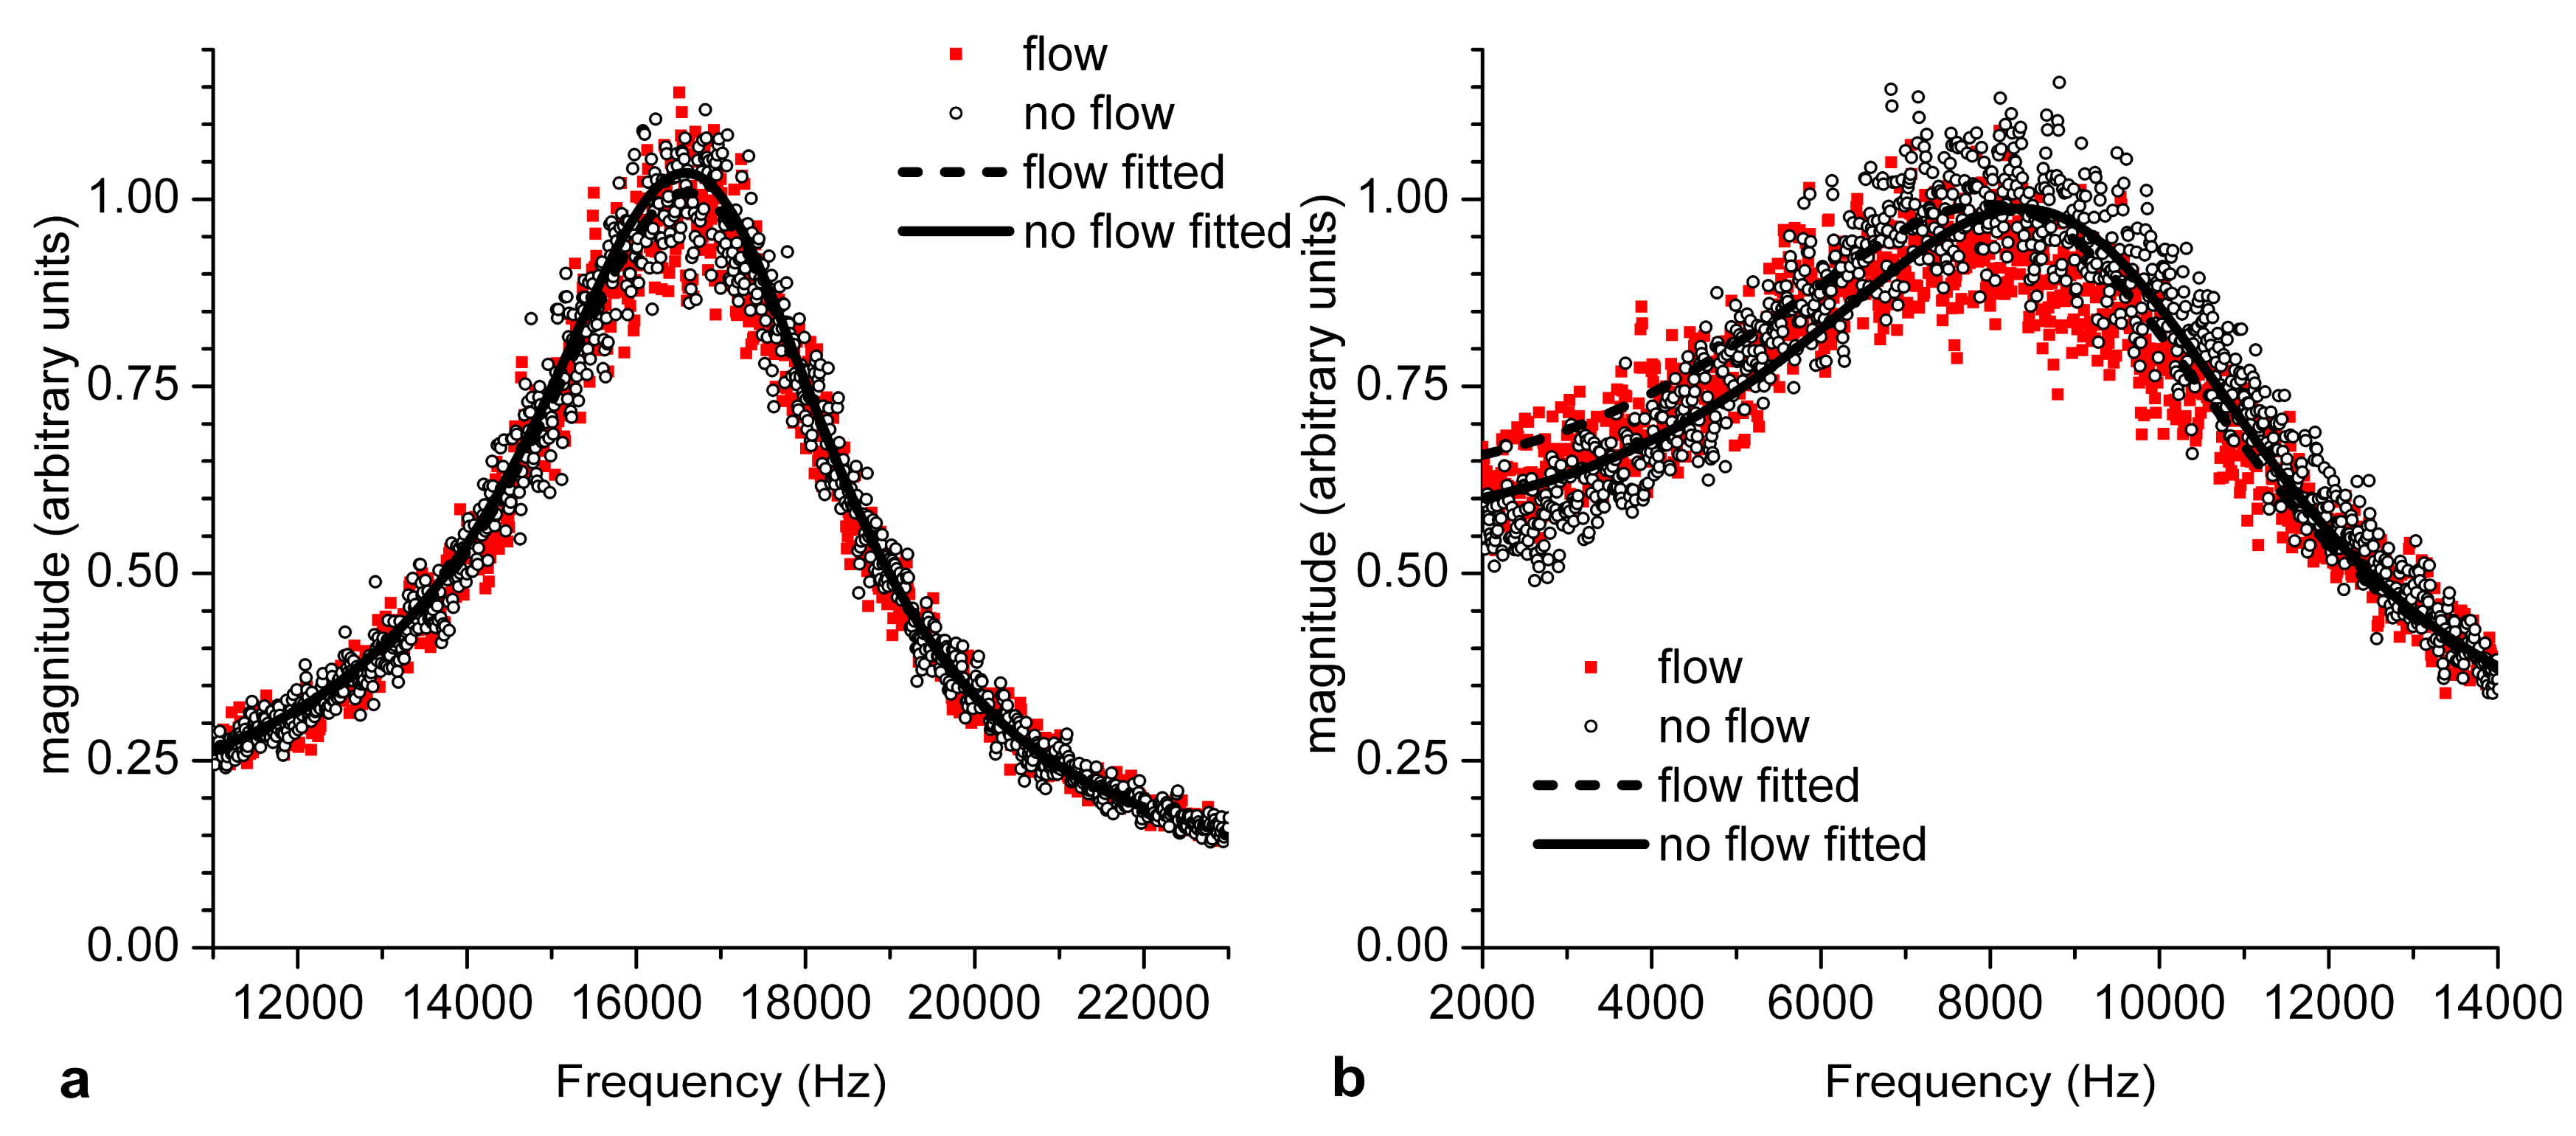
To test the effects of local heating on resonant frequency and Q-factor, additional measurements were performed without flow and under a steady flow. To rule out hydrodynamic effects pure water was used in the control experiment. As shown in figure 6 (a) no frequency shift could be observed. Figure 6 (b) shows the typical shift of the resonant frequency at a liquid flow of 3 μl/s for the D-type cantilevers. After switching on the steady flow of 3 μl/s the mean value of the resonant frequency and quality factor dropped from 9.85 kHz to 9.70 kHz and from Q = 1.37 to Q = 1.3, respectively. A statistical analysis of five independent measurements proved the statistical significance of the shifts. The change in resonant frequency corresponds to an increase in viscosity of about 1.2 mPas. With the relation between temperature and viscosity of sucrose solutions taken from references [21, 22], the increased viscosity can be explained by a heating of 1.2° C of the probed fluid volume. Measurements with the softer cantilevers (E-type) also showed the same trend, although less pronounced. We obtained a mean resonant frequency of 6.85 kHz without flow and of 6.84 kHz at a flow of 3 μl/s. The Q-factors decreased from a mean value of 1.04 for measurements without flow to a mean value of 0.93 under steady flow.
The most likely reason for the frequency shift in concentrated sugar solutions due to the increased flow is the influence of laser heating on the actual viscosity of the fluid in the vicinity of the cantilever. This heating effect is reduced by the convective heat transport connected with the fluid flow. As the control experiment in water indicates, the effect of the flow itself on the cantilever vibration seems to be negligible (see also Etchart et al. [16] for a similar discussion). The effect of the liquid flow was too small to increase the resonant frencies. After switching the flow off, the resonant frequency recovered to the no-flow value faster than it could be resolved by the measurement process. The fast increase of the resonant frequency can be explained by the small volumes that have to be heated by the laser to affect the motion of the cantilever. As discussed by Oden et al. [2] only a very small volume around the cantilever contributes to its movement. The radius of the fluid volume that influences the motion of the cantilever is about 30 μm for a cantilever with a width of 20 μm. The radius of the focussed laser spot is about 40 μm, thus heating the entire relevant volume.
Thus, only a part of the discrepancy between the experimental data and the theoretical predictions at concentrations higher than one mol/l could be explained by the heating effect of the laser. A noticeable deviation remained between theory and experiment which could only be corrected by a phenomenological master function that will be introduced in the following section. This observation leads to the conclusion, that at high sugar concentrations – which imply Q-factors close to one – the analysis based on the harmonic oscillator is less precise and needs to be improved. Here, more accurate hydrodynamic models for the oscillation of a microcantilever in a viscous fluid are needed.
4.4. Empirical correction
Due to the nonlinear dependence of the density and viscosity of the quality factor, calculations based on the equation (1-5) would also result in values for the viscosity and density with errors of up to 10 % in the biological relevant concentration range up to 0.8 mol/l. For highly concentrated solutions the systematic error would even reach 100 % at a concentration of 2 mol/l. In order to allow for a precise calculation of viscosity and density a correction function was derived from the relation between the theoretical quality factors Qtheo and the mean of the measured quality values Q as shown in Figure 7 (a). From the experimental data a master curve was obtained by regression with the Levenberg-Marquardt algorithm. The ation for the regression was a three point exponential growth function
For sucrose the correction parameters were y0 = -1.007, A = 1.093 and t = 2.129. For fructose and glucose the regression resulted in similar parameters, y0 = -0.880, A = 1.092 and t = 2.201. As can also be seen in fig 7 (b), there is only a slight variation of the master curve for the different sugar solutions. The correction function eq. (7) permits to correct measured values in order to match theoretical predictions. The relative difference between Q and Qtheo is less than 1.5 %. By using the corrected quality factor Q* for the calculation of viscosity, the deviation between the predicted and measured values could be reduced to less than 5 % as illustrated in figure 7(b). The calculation of density could be greatly improved as well, with deviations not exceeding 10 % over the entire concentration range in comparison to deviations of more than 110% for the uncorrected values. At this point should also be emphasized, that the master curve is purely phenomenological and its parameters have to be obtained for each type of cantilever individually. Nevertheless this procedure provides a valuable tool to calibrate the measurement system. After calibration, the microfluidic sensor allows for a reliable viscosity measurement.
5. Conclusions
An integrated microfluidic system for the measurement of density and viscosity of sugar solutions was designed and tested. The measurement system was optimized for the use of a consumer computer soundcard as analogue to digital converter. It was designed to be sensitive enough to rely on stochastic cantilever fluctuations induced by environmental noise and Brownian motion. Resonant frequency and quality factor of the cantilever were obtained by analysis of the noise spectrum of the deflection signal. The integrated system also limits the rired fluid volume to less than a micro-litre and allows for characterization of sugar solutions at various concentrations.
A very good agreement between the experimental resonant frequency values and theoretical predictions was found. In the biologically relevant range of sugar concentrations (up to 0.8 mol/l) the measured viscosity values stayed within an error range of less than 10 %. At higher concentrations larger deviations from theoretical values occur and laser heating becomes a noticeable issue. In order to account for these deviations a phenomenological master curve was introduced to correct the measured values. By using a master curve as calibration function reliable viscosity measurements can be achieved in the biologically relevant range with errors smaller than 5 %.
The analysis of the stochastic cantilever oscillations together with the use of consumer computer hardware limits the cost for the measurement hardware since no active actuation is rired. This low-cost approach is of course not limited to rheological measurements since the detection of added mass is also feasible. Thus, low cost cantilever sensor systems will certainly find their applications in cost sensitive areas such as education and training or massively parallel testing in highly integrated fluidic systems.
Acknowledgments
Financial support by the German Federal Ministry of Education and Research (BMBF, Grant 03N8706) is gratefully acknowledged.
References
- Lindholm, U.S.; Kana, D. D.; Chu, W.-H.; Abramson, H. N. Elastic vibration characteristics of cantilever plates in water. J. Ship Res. 1965, 9, 11–22. [Google Scholar]
- Oden, P. I.; Chen, G. Y.; Steele, R. A.; Warmack, R. J.; Thundat, T. Viscous Drag Measurements Utilizing Microfabricated Cantilevers. Appl. Phys. Lett. 1996, 68, 3814–3816. [Google Scholar]
- Ahmed, N.; Nino, D. F.; Moy, V. T. Measurement of Solution Viscosity by Atomic Force Microscopy. Rev. Sci. Instrum. 2001, 72, 2731–2734. [Google Scholar]
- Bergaud, C.; Nicu, L. Viscosity Measurements Based on Experimental Investigations of Composite Cantilever Beam Eigenfrencies in Viscous Media. Rev. Sci. Instrum. 2000, 71, 2487–2491. [Google Scholar]
- Xu, X.; Raman, A. Comparative dynamics of magnetically, acoustically, and Brownian motion driven microcantilevers in liquids. J. Appl. Phys. 2007, 102, 034303. [Google Scholar]
- Sader, J. E. frequency Response of Cantilever Beams Immersed in Viscous Fluids with Applications to the Atomic Force Microscope. J. Appl. Phys. 1998, 84, 64–76. [Google Scholar]
- Sader, J. E.; Chon, J. W. M.; Mulvaney, P. Calibration of Rectangular Atomic Force Microscope Cantilevers. Rev. Sci. Instrum. 1999, 70, 3967–3969. [Google Scholar]
- Boskovic, S.; Chon, J. W. M.; Mulvaney, P.; Sader, J. E. Rheological Measurements Using Microcantilevers. J. Rheol. 2002, 46, 891–899. [Google Scholar]
- Clarke, R. J.; Cox, S. M.; Williams, P. M.; Jensen, O. E. The drag on a microcantilever oscillating near a wall. J. Fluid Mechanics 2005, 545, 397–426. [Google Scholar]
- Green, C. P.; Sader, J. E. frequency response of cantilever beams immersed in viscous fluids near a solid surface with applications to the atomic force microscope. J. Appl. Phys. 2005, 98, 114913. [Google Scholar]
- Basak, S.; Raman, A.; Garimella, S. V. Hydrodynamic loading of microcantilevers vibrating in viscous fluids. J. Appl. Phys. 2006, 99, 114906. [Google Scholar]
- Agoston, A.; Keplinger, F.; Jakoby, B. Evaluation of a vibrating micromachined cantilever sensor for measuring the viscosity of complex organic liquids. Sens. Act. A 2005, 123-24, 82–86. [Google Scholar]
- Kim, S.; Kihm, K. D. Experimental verification of the temperature effects on Sader's model for multilayered cantilevers immersed in an aqueous medium. Appl. Phys. Lett. 2006, 89, 061918. [Google Scholar]
- McLoughlin, N.; Lee, S. L.; Hahner, G. Simultaneous determination of density and viscosity of liquids based on resonance curves of uncalibrated microcantilevers. Appl. Phys. Lett. 2006, 89, 184106. [Google Scholar]
- Papi, M.; Arcovito, G.; De Spirito, M.; Vassalli, M.; Tiribilli, B. Fluid viscosity determination by means of uncalibrated atomic force microscopy cantilevers. Appl. Phys. Lett. 2006, 88, 194102. [Google Scholar]
- Etchart, I.; Chen, H.; Dryden, P.; Jundt, J.; Harrison, C.; Hsu, K.; Marty, F.; Mercier, B. MEMS Sensors for Density-Viscosity Sensing in a Low-Flow Microfluidic Environment. Sens. Act. A 2007. [Google Scholar] [CrossRef]
- Lubarsky, G. V.; Hahner, G. Calibration of the normal spring constant of microcantilevers in a parallel fluid flow. Rev. Sci. Instrum. 2007, 78, 095102. [Google Scholar]
- Giaquinta, R. T. Phloem Loading of Sucrose. Ann. Rev. Plant Physiol. Plant Mol. Biol. 1983, 34, 347–387. [Google Scholar]
- Chon, J. W. M.; Mulvaney, P.; Sader, J. E. Experimental validation of theoretical models for the frequency response of atomic force microscope cantilever beams immersed in fluids. J. Appl. Phys. 2000, 87, 3978–3988. [Google Scholar]
- Powell, C. W. R. The viscosity of sugar solutions. J. Chem. Soc. 1914, 105, 1–23. [Google Scholar]
- Bubnik, Z.; Kadlek, P.; Urban, D.; Bruhns, M. Sugar Technologists Manual; Bartens: Berlin, 1995; p. 164. [Google Scholar]
- Gilli, R. Calculation on pure sucrose solutions. http://www.seas.upenn.edu/courses/belab/be309/SucroseCalculator.html 17. Dec. 2007.
Figure 1.
(a) Photograph and (b) drawing of the cantilever sensor system. Important components are the signal pre-conditioning electronics (1), the laser (2), the camera (3) and the photo diode (4). The microfluidic system is placed on top of an adjustable support (5).
Figure 1.
(a) Photograph and (b) drawing of the cantilever sensor system. Important components are the signal pre-conditioning electronics (1), the laser (2), the camera (3) and the photo diode (4). The microfluidic system is placed on top of an adjustable support (5).

Figure 2.
Photograph of the measurement chamber in a 20 mm × 20 mm × 3.3 mm copper block.

Figure 3.
Power spectral density of the deflection signal obtained with the 39 kHz D-type cantilever in air (black), water (red) and 2 mol/l sucrose solution (green). The magnitudes were normalized to the area beneath the curve, i.e. the total power.
Figure 3.
Power spectral density of the deflection signal obtained with the 39 kHz D-type cantilever in air (black), water (red) and 2 mol/l sucrose solution (green). The magnitudes were normalized to the area beneath the curve, i.e. the total power.

Figure 4.
Resonant frequency and quality factor Q of the 29-kHz-sensor (E-type) in various solutions as indicated. The dashed lines indicate predicted values. (a) A good agreement between predicted and measured resonant frencies was obtained. (b) The predicted Q-factors systematically underestimate the measured values.

Figure 5.
UV/VIS absorbance spectrum of sucrose solutions over 10 mm path length. The absorbance at 635 nm wavelength is about 0.05 for the 2 mol/l concentration and decreases with the concentration.
Figure 5.
UV/VIS absorbance spectrum of sucrose solutions over 10 mm path length. The absorbance at 635 nm wavelength is about 0.05 for the 2 mol/l concentration and decreases with the concentration.

Figure 6.
Effect of liquid flow on the power spectrum. Data were acquired using the 39 kHz D-type cantilever at a bulk temperature of 25 °C. Black circles indicate data obtained without flow while red circles were acquired at a steady flow of 3 μl/s. The lines represent the corresponding fits. (a) Control experiment in water. The resonant frequency was not affected by the flow (b) In 2.0 mol/l sucrose solution the resonant shifts 150 Hz to lower frencies under flow conditions.

Figure 7.
(a) Correlation between the measured quality factor Q and theoretical values Qtheo for the three sugar solutions. From the regression of the plots a correction function was derived. The best fit was achieved with an exponential model. The dotted line represents identity. (b) Viscosity calculated from corrected values Q* for sucrose, fructose and glucose in comparison to the literature data.

© 2008 by MDPI Reproduction is permitted for noncommercial purposes.
Share and Cite
MDPI and ACS Style
Hennemeyer, M.; Burghardt, S.; Stark, R.W. Cantilever Micro-rheometer for the Characterization of Sugar Solutions. Sensors 2008, 8, 10-22. https://doi.org/10.3390/s8010010
AMA Style
Hennemeyer M, Burghardt S, Stark RW. Cantilever Micro-rheometer for the Characterization of Sugar Solutions. Sensors. 2008; 8(1):10-22. https://doi.org/10.3390/s8010010
Chicago/Turabian StyleHennemeyer, Marc, Stefan Burghardt, and Robert W. Stark. 2008. "Cantilever Micro-rheometer for the Characterization of Sugar Solutions" Sensors 8, no. 1: 10-22. https://doi.org/10.3390/s8010010