Ad Hoc Modeling of Root Zone Soil Water with Landsat Imagery and Terrain and Soils Data

1
Department of Geosciences, 921 S. 8th Ave Stop 8072, Idaho State University, Pocatello, Idaho 83209-8072, USA
2
Land Resources and Environmental Sciences Department, PO Box 173120, Montana State University, Bozeman, MT 59717-3120, USA
*
Author to whom correspondence should be addressed.
Sensors 2008, 8(1), 314-326; https://doi.org/10.3390/s8010314
Submission received: 15 November 2007
/
Accepted: 9 January 2008
/
Published: 21 January 2008
(This article belongs to the Special Issue Remote Sensing of Natural Resources and the Environment)
Abstract
:Agricultural producers require knowledge of soil water at plant rooting depths, while many remote sensing studies have focused on surface soil water or mechanistic models that are not easily parameterized. We developed site-specific empirical models to predict spring soil water content for two Montana ranches. Calibration data sample sizes were based on the estimated variability of soil water and the desired level of precision for the soil water estimates. Models used Landsat imagery, a digital elevation model, and a soil survey as predictor variables. Our objectives were to see whether soil water could be predicted accurately with easily obtainable calibration data and predictor variables and to consider the relative influence of the three sources of predictor variables. Independent validation showed that multiple regression models predicted soil water with average error (RMSD) within 0.04 mass water content. This was similar to the accuracy expected based on a statistical power test based on our sample size (n = 41 and n = 50). Improved prediction precision could be achieved with additional calibration samples, and range managers can readily balance the desired level of precision with the amount of effort to collect calibration data. Spring soil water prediction effectively utilized a combination of land surface imagery, terrain data, and subsurface soil characterization data. Ranchers could use accurate spring soil water content predictions to set stocking rates. Such management can help ensure that water, soil, and vegetation resources are used conservatively in irrigated and non-irrigated rangeland systems.
1. Introduction
Ranchers in the Northern Great Plains (NGP) make difficult economic decisions every spring. Ranchers must predict the amount of forage their pastures will produce in order to set stocking rates for the coming growing season [1]. These forage production estimates are based largely on a combination of guess work and expert knowledge that might be heavily influenced by the successes or failures of the previous growing seasons.
Annual forage production is significantly correlated with two factors in non-irrigated, semi-arid rangelands like those in the NGP: the amount of water stored in the soil preceding the growing season and the amount of precipitation that falls during the growing season [2, 3]. It is not feasible to predict the amount of rain that will fall in an upcoming summer. It might be possible, however, to model and map the spatial distribution of spring, pre-growing season soil water content.
Spring soil water content maps are a potential precision range management application. Though precision range management is not at the stage of application of precision farming, there is a growing collection of ranchers that are becoming technologically savvy. These ranchers are interested in using GPS, GIS, and remotely sensed imagery for ranch management, resource inventory, and conservation purposes. Substantial challenges have existed, however, for applying satellite image based precision agriculture to range management [see, e.g., 4, 5]. Moderate-resolution imagery, which is generally needed to cover the geographic extents involved in range management, for example, has generally been inadequate to measure many of the factors necessary to evaluate range condition. Recent developments, however, have shown this type of imagery useful for evaluating factors related to biomass condition and percent of bare soil, raising hope for increased development of precision range management techniques [4]. Development of a method for modeling and mapping spring soil water content that implements these geospatial tools would both aid ranchers interested in using precision agriculture techniques for management tasks such as setting stocking rates and contribute to the advancement of precision agriculture and precision conservation in ranching culture.
A precision range modeling application must be based on publicly available data and be easily implemented at a ranch scale to be useful. Semi-arid rangeland spring soil water content can be conceptually modeled using a water balance approach. Inputs (precipitation and runon) must equal outputs (evapotranspiration, drainage, and runoff) minus change in storage (soil water content). It is difficult to directly measure any of these factors at a ranch scale. There are, however, several publicly available remote sensing and GIS-based products that are potentially useful as surrogates for these factors. Three data sources that might be useful for the spatially explicit estimation of pre-growing season soil water content are Landsat imagery, 30-m resolution digital elevation models (DEMs), and digitized soil surveys with associated attribute data available from the U.S. National Cooperative Soil Survey (NCSS).
Landsat multispectral satellite imagery might be used to account for the empirical relationship between evapotranspiration and the spatial distribution of soil water. Landsat imagery has been used to estimate accurately leaf area [6], which in turn should be highly correlated to evapotranspiration [7]. Empirical relationships between evapotranspiration and soil water content are site-and-date-specific, but are considerably easier to develop at a ranch scale than mechanistic modeling approaches. Such empirical models avoid the radiometric correction and universal calibration issues that mechanistic remote sensing-based models must confront. Satellite imagery also has been used to directly estimate soil water [e.g., 8], but the characteristics of the imagery have resulted in a focus on surface soil water, which is highly important for certain applications, but not particularly valuable for estimating plant growth, which is a function of water at plant rooting depths.
DEMs can be used to derive hydrologically important topographic variables such as slope and aspect. Topographic variables can be used to account for relative amounts of evapotranspiration across a landscape [9]. Terrain has been shown to be a better predictor of soil water content in wet versus dry conditions [9, 10]. Soil water content in semi-arid Montana environments, however, has been found to have limited correlation with terrain subdivisions and topographic indices [10, 11].
Soil water distribution might be more closely related to hydrologically important soil characteristics, such as texture, than to topographic variables in semi-arid Montana rangelands [10]. NCSS soil surveys provide one source of spatially explicit soil attribute data that might be appropriate for modeling soil water at a ranch scale. Soil surveys, however, have limited accuracy [12]. Attribute data is often interpolated and/or extrapolated from a handful of lab characterized pedons for an entire survey area [13]. The addition of site-specific soils data to soil water content models based on soil survey and terrain data has been recommended for future research in semi-arid Montana agricultural systems [10].
The overall goal of this study was to assess the ability of Landsat and ancillary soil and terrain data to model accurately spring soil water content in semi-arid rangelands of the NGP. This was carried out in the context of relatively easily developed, site- and date-specific ad hoc empirical models developed for two Montana ranches. The first objective of the study was to test whether soil water could be predicted accurately with the models. The second objective was to consider the relative influence of Landsat and ancillary predictor variables. Two questions were considered in regard to the second objective: (1) Is Landsat imagery a useful predictor of soil water content at the plant rooting zone? (2) Do the terrain and soil ancillary data sources provide predictive ability in addition to the Landsat imagery?
2. Site and Methods
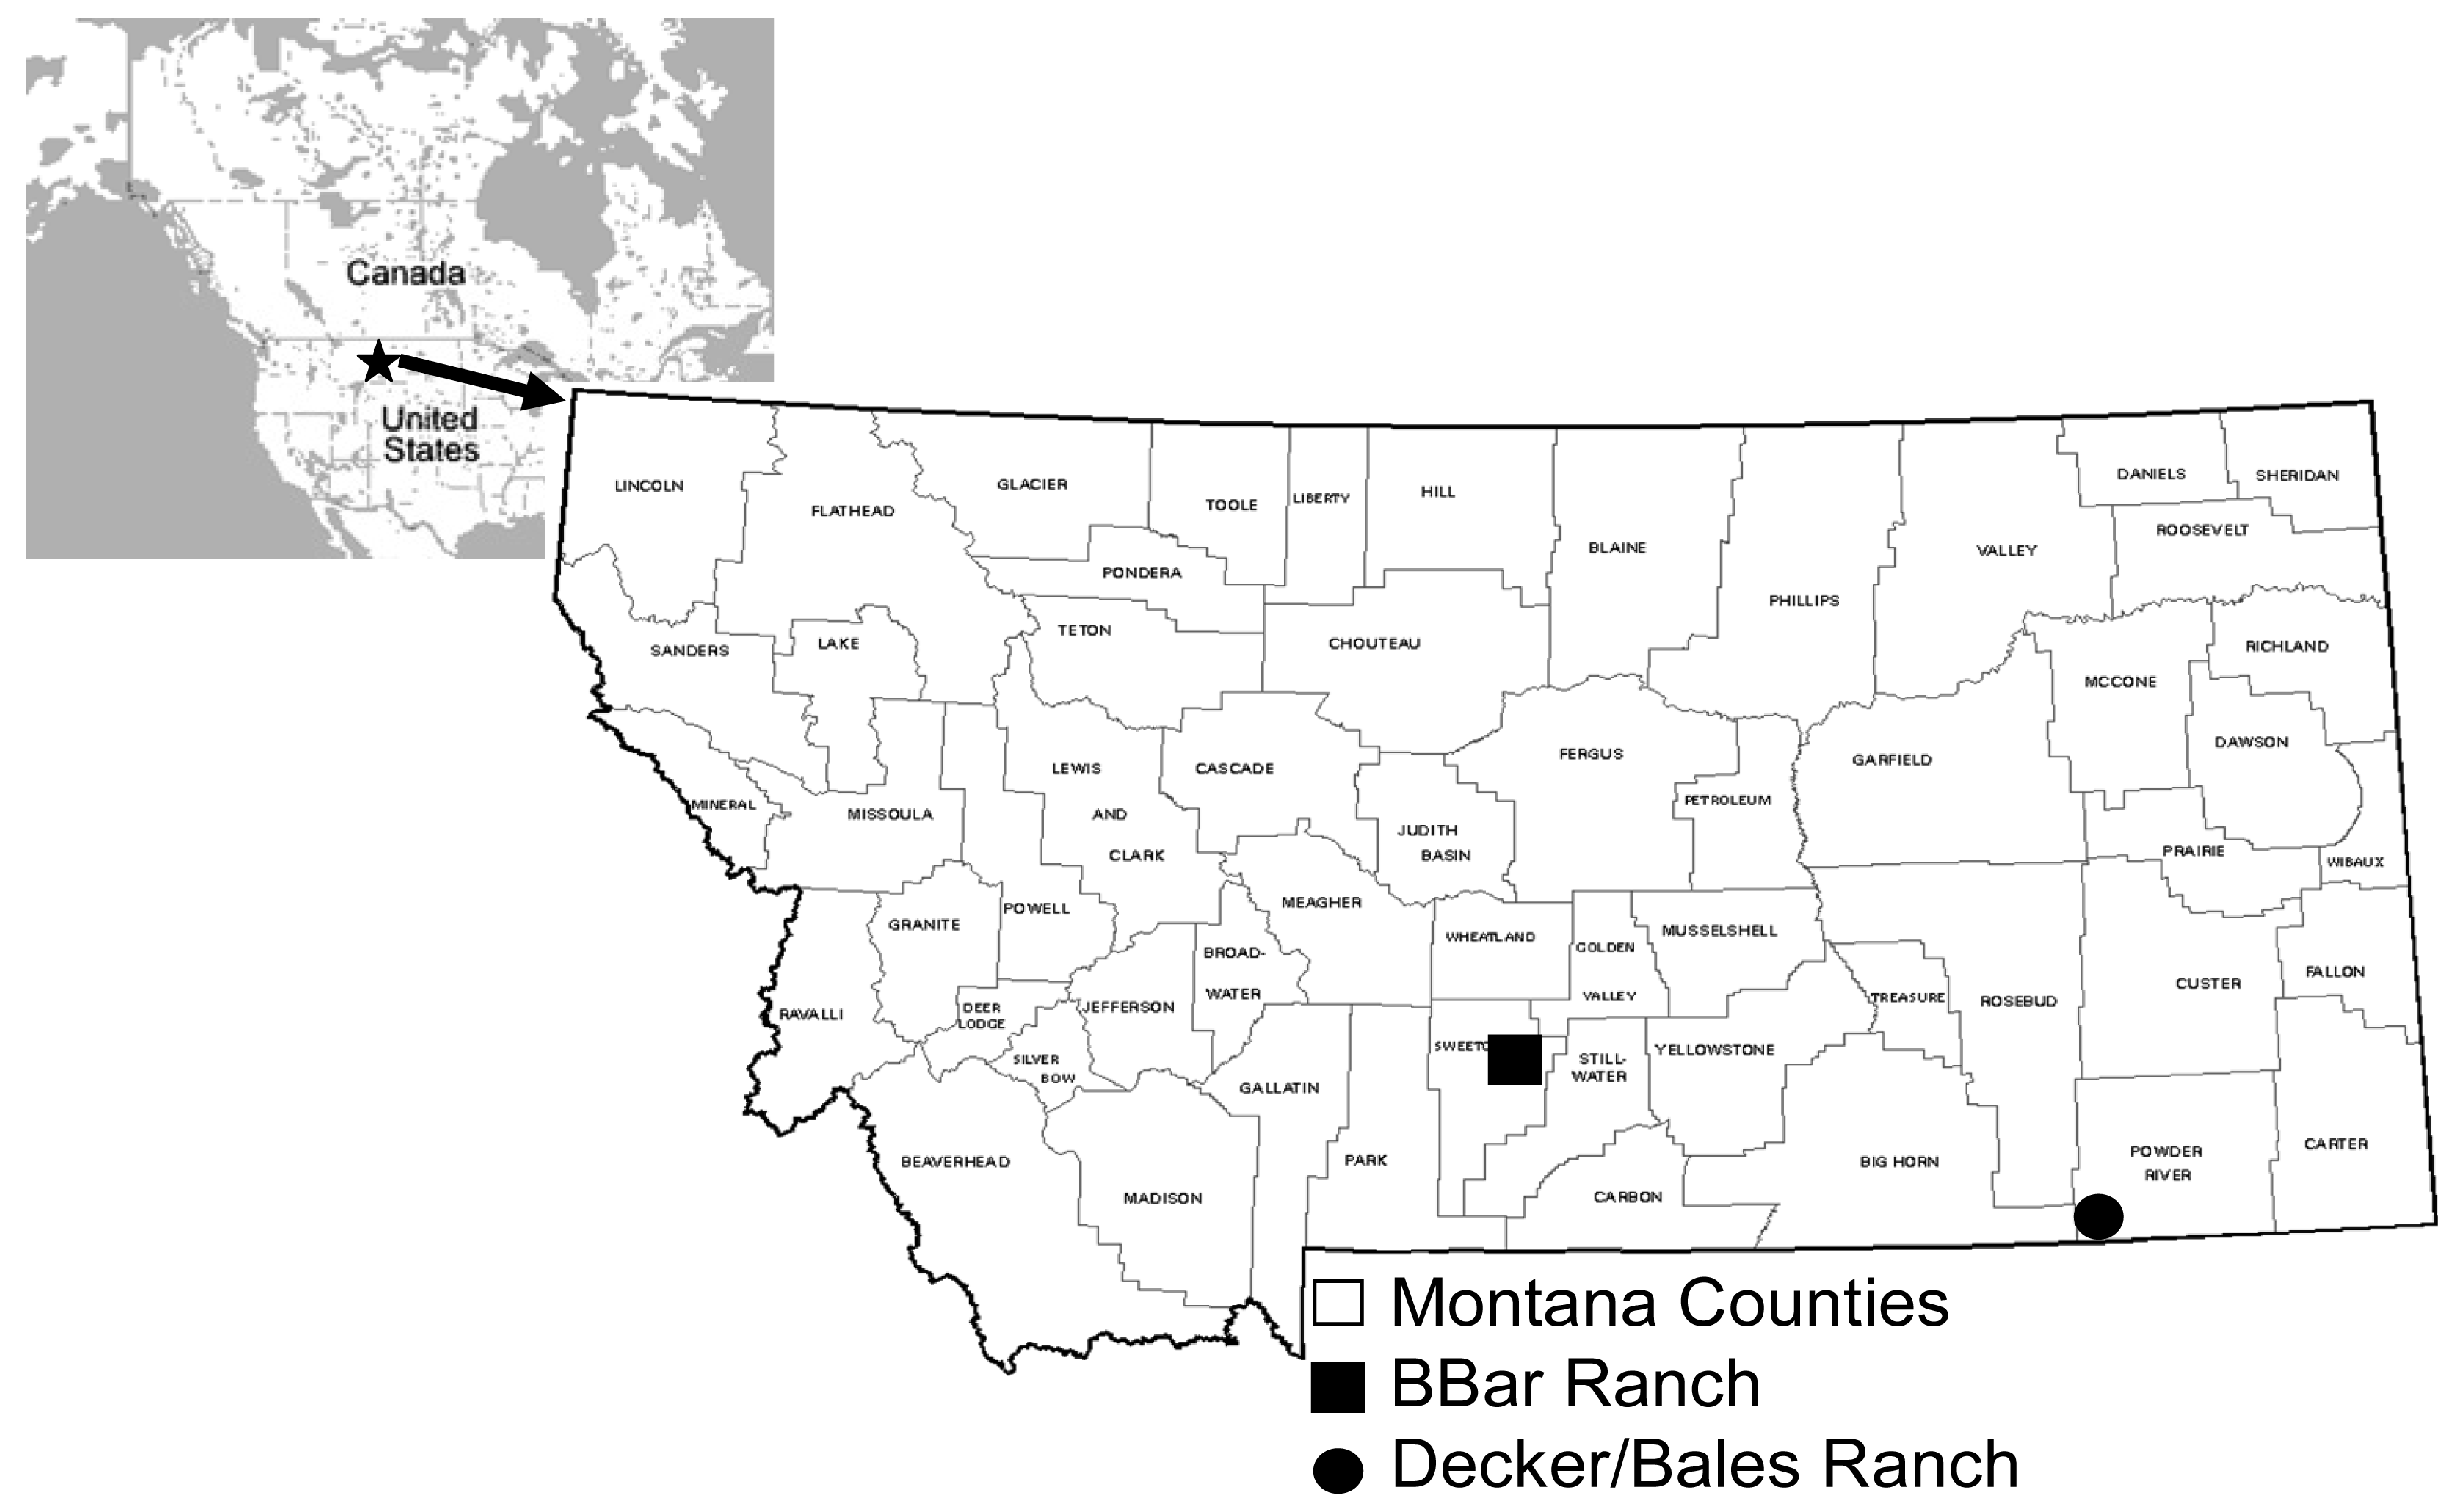
Fieldwork and modeling were carried out for two study sites: the Decker/Bales ranch and the BBar ranch (Figure 1). The Decker/Bales ranch, located in southwestern Powder River County in southeastern Montana, is approximately 100 km2. The landscape is part of Montana's non-glaciated plains and is characterized by dissected sedimentary layers that form a low relief, fluvially incised landscape. Range vegetation consists of grassland communities of western wheatgrass (Agropyron smithii Rydb.), needle and thread (Stipa comata Trin. & Rupr.), blue grama (Bouteloua gracilis Willd. ex Kunth), and big sagebrush (Artemisia tridentata Nutt.) [14]. Soils include loamy, calcareous Ustorthents formed in siltstones, clayey, calcareous Ustorthents formed in shales, fine to coarse-loamy Haplustalfs formed in slope alluvium, loamy-skeletal Haplustalfs formed in scoria beds, and fine Natrustalfs that are often associated with prairie dog communities [14, 15]. The area receives approximately 30 cm of mean annual precipitation, the soil temperature regime is on the boundary between Mesic and Frigid, and the soil moisture regime is on the boundary between Ustic and Aridic [16].
The BBar ranch is approximately 30 km2 and is located in northern Sweet Grass County in south-central Montana (Figure 1). It lies in a valley near the Rocky Mountain front in the westernmost extent of Montana's non-glaciated plains. The landscape consists of rolling, sedimentary bedrock-controlled hills vegetated with grassland communities of western wheatgrass, little bluestem (Andropogon scoparius Michx.), needle and thread, and blue grama [14]. Soils at this site range from fine Argiustolls on backslopes, footslopes, and toeslopes, to loamy-skeletal Ustorthents on summit and shoulder positions, as well as fine Natrustalfs on toeslopes and valley floor positions, and fine and fine-loamy Torrifluvents in drainageways [14, 15]. The area receives approximately 35 cm of mean annual precipitation, the soil temperature regime is Frigid, and the moisture regime is Ustic [17].
A statistical power test [18] was performed on a small preliminary data set of depth of moist soil measurements from the Decker/Bales ranch (n=11). Depth of moist soil for this data set was measured at several routinely monitored pastures by one of the ranch's owners with a Paul Brown push probe in April, 2003. The data set had a mean of 74 cm of moist soil and a standard deviation of 9.6 cm of moist soil. The power test showed that 41 points were necessary to be able to detect a significant difference of 7.6 cm of moist soil. At least 41 points for model development and 41 points for validation were targeted for each study area during sampling.
Soil survey maps were used to choose a set of sample locations that was representative of the variability in soil type as well as the variability in slope, aspect, landform, and landform position at each ranch. Random points were selected within each soil survey map unit, with at least one location for each named map unit. Navigation to the points was accomplished with a GPS receiver with an accuracy of < 1 m. A hand auger was used to collect soil samples in 10 cm increments to 100 cm depth at each sample location. Samples were not collected from 60-70 cm and 80-90 cm for efficiency.
A total of 100 locations were sampled at the Decker/Bales ranch and 82 locations were sampled at the BBar ranch. Sampling was completed during the first week of May 2004 at the Decker/Bales ranch and during the second week of May 2004 at the BBar ranch. Mass water content (θ) was measured for each sample and used as the response variable for water content modeling at both study locations.
The satellite imagery predictor variables were bands 1-7 from a Landsat 5 TM scene selected from the previous growing season for each study site. Scenes were selected by proximity to the expected peak of growing season biomass production and by cloud free quality. A scene from 1 August 2003 was selected for the BBar site and a scene from 3 August 2003 was selected for the Decker/Bales ranch. Satellite image band values were extracted for the individual pixels corresponding to each sample site.
Terrain predictor variables were derived from a seamless, 30-m USGS DEM. Percent slope and aspect layers were created in ARCGIS using the spatial analyst surface function. Aspect was transformed to the cosine of aspect from degrees from north.
Soil survey predictor variables were created from digitized soil maps and associated attribute data. These data have been found to be appropriate in scale for use with Landsat-based imagery [4]. Maps of individual soil characteristics were developed from the soil survey attribute data in ARCGIS. Percent clay content and percent soil organic matter (SOM) were calculated as depth-weighted average values for the entire profile. Maps of depth to root restrictive layer (cm), plant available water holding capacity (AWC) by volume (cm3/cm3), and equivalent depth (cm) of plant available water (PAW) were also created based on soil survey data.
Sample data for each ranch were split randomly into two equally sized data sets (n = 50 for Decker/Bales and n = 41 for BBar) prior to modeling soil water content. One data set for each ranch was used for model calibration and the other for independent validation. Multiple regression models were constructed stepwise by predicting θ with the possible predictor variables of Landsat bands, DEM-derived slope and aspect layers, and the set of soil survey variables.
Two models were developed, one for each ranch. The best performing models for the calibration data were selected for each ranch. Independent model validation consisted of predicting water content for the reserved data set. Least squares regressions of the validation water content as a function of predicted values were constructed, and scatter plots of the relationship containing points, regression lines, and 1:1 lines (slope = 1, intercept = 0) were examined. Mean squared deviation (MSD) and root mean square deviation (RMSD) were calculated for the predicted versus observed values and the MSD was broken into components of standard bias (SB), non-unity (NU), and lack of correlation (LC) [19]. SB quantifies the proportion of the MSD related to the deviance of the least squares fit from a 1:1 relationship in the y direction (intercept). NU quantifies the proportion of the MSD related to the deviance of the least squares fit from a 1:1 relationship in the slope of the fitted line. LC quantifies the proportion of the MSD related to the scatter of the points in relation to the 1:1 line.
Hypothesis tests were used to test for significant differences between predicted and observed validation soil water content. The Levene's test was used to test whether predicted and observed sample populations had significantly different variances [20]. The Mann-Whitney test of the paired predicted and validation samples was used to test whether the mean of the differences between the samples was statistically significantly different than zero [20].
3. Results and Discussion
Regression models constructed for both study sites (Table 1) contained at least one variable from the Landsat, DEM, and soil data sources. The model developed for the BBar site explained 21% more variability in soil water content than the model developed for the Decker/Bales site.
The model for each site predicted θ with an average prediction error (RMSD) within 0.04 gravimetric water content (Table 2). This was similar for many of the soils at both study sites to the expected margin of error of 7.6 cm of moist soil predicted using the statistical power test at the outset of the study.
No statistically significant difference between predicted and observed water content was found for the BBar model (Table 2). Predicted and observed water contents were statistically significantly different for the Decker/Bales model (Table 2).
Correlation coefficients for predictor variables and soil water content (Tables 3 and 4) provided insight into the relative influence of the four predictor data sources. The strongest correlations with soil water content at the BBar ranch were for Landsat bands and plant available water holding capacity. At the Decker/Bales ranch, Landsat bands were again the most strongly correlated variables, although band 4 (near infrared) was less so, while slope and soil organic matter were relatively strongly correlated. There was also substantial correlation between Landsat bands and certain other predictor variables, most notably for both site slope and soil organic matter.
The variables included in the final models were at multiple scales. The thermal band from Landsat 5, for example, was at a coarser scale than the remaining bands and terrain variables (120 m as opposed to 30 m), while soil map units encompass large and varying numbers of 30-m pixels. This meant that, to the extent the thermal band and soils data were included in our final models, the variability that was accounted for by those data was modeled at a coarser scale than sources of variability attributable to other Landsat data and topographic variables. This will affect the precision of any soil water maps produced from these models, but was also inherent in our validation analysis, so does not negate the results presented.
3.1. Can soil water be predicted accurately with site-and-date-specific empirical models?
Water content was predicted within the statistically expected average prediction error. The statistical power built into the study resulted in errors that were a substantial percentage of measured soil water, however, primarily because sampling occurred during the sixth year of drought conditions, which resulted in very low average soil water. Greater prediction precision might be necessary for such conditions or for other purposes. This approach, however, enables a manager to determine the practical advantages of precision of predictions versus number of samples needed. The samples required for this study required one day of sampling per ranch.
3.2. Is Landsat imagery a useful predictor of soil water content?
Landsat imagery from the peak of the previous growing season explained the most variability in soil water content of all data sources. The Landsat variables appeared to detect vegetation and ground surface patterns that were related to soil water distribution at both ranches.
Landsat bands 3 and 4 were the most common predictor variables as individual predictors and in interaction terms. The positive near infrared (band 4) coefficient and negative red (band 3) coefficient in the model for the Decker/Bales ranch indicated that locations with more growing season green biomass had higher spring soil water contents, since vegetation reflects highly in near infrared and absorb heavily red wavelengths [21]. This might suggest that water-collecting landscape positions, or positions that held more water due to soil characteristics such as texture and depth, might have supported both higher plant productivity in the previous growing season and also higher soil water content in the spring. This is the opposite of an evapotranspiration driven interpretation where areas of lower leaf area with resulting limited evapotranspiration might have been expected to conserve soil water for later seasons, such as in a fallow agricultural field [22].
The negative red (band 3) and near infrared (band 4) coefficients for the model developed at the BBar site suggest that spring soil water content decreased with an increase in both red and near infrared reflectance during the previous growing season. Band 3 and 4 reflectances have been shown to decrease with increased surface soil water content on fallow agricultural surfaces [23]. Reflectance for both bands has been suggested to be high for both increased cover of senescent litter [23] and exposed bare soil [24, 25]. The negative coefficients for bands 3 and 4 in the BBar models might suggest that spring soil water content was more related to surface water content, senescent vegetation cover, and/or bare soil than abundance of healthy green biomass during the previous growing season. The semi-arid, droughty conditions during our study suggest, however, that there was minimal surface water content, so we believe this explanation is remote in this instance. The different band 3 and 4 responses between the two sites indicates that, while Landsat imagery can be an important predictor for soil water, a single model might not be appropriate and our approach to site-specific, ad hoc models might be more appropriate.
Landsat thermal response (band 6) was a useful predictor of spring soil water content at Decker/Bales when bands 3 and 4 were in the model. Emittance measured by the thermal band might be influenced by ground surface temperature and water content [21]. Remote sensing in the thermal range has been used to link ground surface temperature with evapotranspiration rates [26]. Plants that have adequate water are cooler than if under water deficit. High band 6 emittance at the peak of the previous growing season might have suggested higher surface temperatures. This might have indicated water-limited areas or areas with high exposed bare soil and low vegetation cover. Higher evaporation rates can lead to greater soil water depletion and lower soil water content in later seasons [22].
3.3. Do the terrain ancillary data sources provide predictive ability in addition to the Landsat imagery?
The slope and aspect variables were more strongly correlated with Landsat and soil predictor variables than with soil water. Slope was substantially correlated with Landsat bands 3 and 4. It was used as a predictor in interaction terms with these variables for the BBar model. Aspect was used by the model developed for the Decker/Bales ranch and was as strongly correlated with Landsat band 7 (middle infrared) as it was with soil water content at this ranch. The positive coefficient for aspect in the Decker/Bales model suggests that southerly aspects had lower soil water contents and northerly aspects had relatively higher soil water contents, an expected relationship in the mid-latitudes of Northern Hemisphere as southern slopes receive more direct solar radiation resulting in higher evaporation rates [27].
The sign of the coefficient for the percent slope variable at the BBar ranch suggests that water content was lower on steeper slopes. Water content is generally expected to be lower on steeper slopes due to surface and sub-surface flow [9, 28] and because steeper slopes tend to have shallower soils due to colluvial processes. The redistribution of soil water by sub-surface flow, however, probably is not substantial in semi-arid environments where soil water content might not be highly influenced by terrain [10, 11]. The water content and slope relationship might have been mitigated by soil characteristics such as texture, SOM, and depth, as well as vegetation characteristics [29, 30].
4. Summary and Conclusions
This study found that site- and date-specific, ad hoc empirical models based on Landsat imagery, USGS DEMs, and NCSS soil surveys could be used to predict spring soil water content in Montana semi-arid rangelands within a statistically expected level of accuracy. Drought conditions might require higher precision and, therefore, greater calibration sampling. Soil water in semi-arid environments is generally expected to be highly variable and the level of variability further affects the level of calibration sampling required. This approach, however, is one of general applicability and allows the land manager the ability to evaluate the relative value of increased precision versus sampling intensity prior to beginning the modeling process.
Our results in terms of the performance of the predictor variable data sources provided important insights, especially considering the expected difficulty of modeling soil water in a semi-arid system. Landsat imagery was found to be a strong predictor of soil water relative to the terrain and soil ancillary data sources. Soil survey variables explained additional variability in soil water that was unexplained by the Landsat variables.
Ranchers or their consultants seeking to apply these methods in the future will need to assemble several data sources. Moderate-resolution imagery is needed that includes at least the red and near infrared portions of the spectrum, while our results indicate that other portions of the spectrum, such as thermal infrared, might also be valuable. All other moderate-resolution satellite imagery sources, of which there are many ( www.asprs.org/news/satellites/ASPRS_DATABASE_090706.pdf), include both the red and near infrared bands, however access to moderate-resolution thermal data could be problematic. Both topographic and soils data appear to be important in ad hoc soil water modeling, are publically available, and easily accessible ( http://gisdata.usgs.net/website/Seamless and http://soildatamart.nrcs.usda.gov, respectively). A statistical sample size test is a necessary prerequisite. This test requires knowledge of the variability of soil water, which can be estimated with a small sample and verified with the full sample, as well as a decision as to the desired level of precision. Once the collected samples have been measured for soil water content, multiple regression models developed on a site and time specific basis can be calculated and used for mapping soil water across a given site.
Ranchers in the NGP could benefit from a modeling approach that produces accurate predictions of spring soil water content. Water content predictions could be used to estimate forage production, set stocking rates, and ensure the rangeland resource is neither over- nor under-utilized. Accurate predictions of spring soil water could also be used to conserve and budget water in both non-irrigated and irrigated systems.
Soil water is often modeled via subsurface processes. In the NGP, spring soil water might be more readily empirically relatable to land surface patterns than to subsurface soil characteristics. This study showed that soil water prediction in these environments was successful within the statistical power expected from our models with a combination of land surface imagery, terrain data, and subsurface soil characterization data.
References
- Holochek, J.L. An approach for setting the stocking rate. Rangelands 1988, 10, 10–14. [Google Scholar]
- Neff, E.L.; Wight, J. R. Overwinter soil water recharge and herbage production as influenced by contour furrowing on Eastern Montana rangelands. Journal of Range Management 1977, 30, 193–195. [Google Scholar]
- Rogler, G.; Haas, H. J. Range production as related to soil moisture and precipitation on the Northern Great Plains. Journal of the American Society of Agronomy 1946, 378–389. [Google Scholar]
- Maynard, C.L.; Lawrence, R. L.; Nielsen, G. A.; Decker, G. Ecological site descriptions and remotely sensed imagery as a tool for rangeland evaluation. Canadian Journal of Remote Sensing 2007, 33, 109–115. [Google Scholar]
- Hunt, E.R.; Everitt, J. H.; Ritchie, J. C.; Moran, S. M.; Booth, D. T.; Anderson, G. L.; Clark, P. E.; Seyfried, M. S. Applications and research using remote sensing for rangeland management. Photogrammetric Engineering & Remote Sensing 2003, 69, 675–693. [Google Scholar]
- Qi, J.; Kerr, Y.H.; Moran, M. S.; Weltz, M.; Huete, A. R.; Sorooshian, S.; Bryant, R. Leaf area index estimates using remotely sensed data and BRDF models in a semi-arid region. Remote Sensing of Environment 2000, 73, 18–30. [Google Scholar]
- Obrist, D.; Verburg, P.S.; Young, M. H.; Coleman, J. S.; Schorran, D. E.; Arnone, J. A. Quantifying the effects of phenology on ecosystem evapotranspiration in planted grassland mesocosms using EcoCELL technology. Agricultural and Forest Meteorology 2003, 118, 173–183. [Google Scholar]
- Garcia, M.; Villagarcia, L.; Contreras, S.; Domingo, F.; Puigdafabregas, J. Comparison of three operative models for estimating the surface water deficit using ASTER reflective and thermal data. Sensors 2007, 7, 860–883. [Google Scholar]
- Western, A.W.; Grayson, R. B.; Bloschl, G. Scaling of soil moisture: a hydrologic perspective. Annual Review of Earth and Planetary Sciences 2002, 30, 149–180. [Google Scholar]
- Kozar, B. J.; Long, D. S.; Wraith, J. M. Relationship between soil water content and computed terrain attributes in glacial till semiarid landscapes. Precision Agriculture. in press.
- Landon, M. A. Soil and terrain attributes for evaluation of leaching in a Montana farm field. M.S. Thesis, Montana State University, Bozeman, Montana, 1995. [Google Scholar]
- Burrough, P.A.; Beckett, P. H. T.; Jarvis, H. G. The relation between cost and utility in soil survey (I-III). Soil Science Society of America Journal 1971, 22, 368–381. [Google Scholar]
- Hudson, B. The soil survey as a paradigm based science. Soil Science Society of America Journal 1992, 56, 836–841. [Google Scholar]
- Montagne, C.; Munn, L. C.; Nielsen, G. A.; Rogers, J. W.; Hunter, H. E. Soils of Montana; Montana Agricultural Experiment Station, Montana State University: Bozeman, Montana, 1982. [Google Scholar]
- Veseth, R.; Montagne, C. Geologic Parent Materials of Montana Soils; Bulletin 721; Montana Agricultural Experiment Station and United States Department of Agriculture, Soil Conservation Service: Bozeman, Montana,, 1980. [Google Scholar]
- Soil Survey Staff. Soil Survey Powder River Area Montana; United States Department of Agriculture, Soil Conservation Service: Washington, D.C., 1971. [Google Scholar]
- Soil Survey Staff. Soil Survey (SSURGO) database for Sweet Grass County Area, Montana; United States Department of Agriculture, Natural Resources Conservation Service: Fort Worth, Texas, 2004. http://soildatamart.nrcs.usda.gov.
- Pfaffenberger, R. C.; Patterson, J. H. Statistical Methods; Richard D. Irwin Inc.: Homewood, Illinois, 1981. [Google Scholar]
- Gauch, H.G.; Hwang, J. T.; Fivk, G. W. Model evaluation by comparison of model-based predictions and measured values. Agronomy Journal 2003, 95, 1442–1446. [Google Scholar]
- Feng, C-X. J.; Yu, Z-G. S.; Wang, J-H. J. Validation and data splitting in predictive regression modeling of honing surface roughness data. International Journal of Production Research 2005, 43, 1555–1571. [Google Scholar]
- Jensen, J. R. Introductory Digital Image Processing: A Remote Sensing Perspective; Prenctice Hall: Englewood Cliffs, New Jersey, 1996. [Google Scholar]
- Hatfield, J.L.; Sauer, T. J.; Prueger, J. H. Managing soils to achieve greater water use efficiency: a review. Agronomy Journal 2001, 93, 271–280. [Google Scholar]
- Moran, S.M.; Hymer, D. C.; Qi, J.; Kerr, K. Comparison of ERS-2 SAR and Landsat TM imagery for monitoring agricultural crop and soil conditions. Remote Sensing of Environment 2002, 79, 243–252. [Google Scholar]
- Asner, G.P.; Wessman, C. A.; Bateson, C. A.; Privette, J. L. Impact of tissue, canopy, and landscape factors on the hyperspectral reflectance variability of arid ecosystems. Remote Sensing of Environment 2000, 74, 69–84. [Google Scholar]
- Hill, J.; Schutt, B. Mapping complex patterns of erosion and stability in dry Mediterranean ecosystems. Remote Sensing of Environment 2000, 74, 557–569. [Google Scholar]
- Schmugge, T.J.; Kustas, W. P.; Ritchie, J. C.; Jackson, T. J.; Rango, A. Remote sensing in hydrology. Advances in Water Resources 2002, 25, 1367–1385. [Google Scholar]
- Hanna, A.Y.; Harlan, P. W.; Lewis, D. T. Soil available water as influenced by landscape position and aspect. Agronomy Journal 1982, 74, 999–1004. [Google Scholar]
- Grayson, R.B.; Western, A. W.; Chiew, F. H. S. Preferred states in spatial soil moisture: local and nonlocal controls. Water Resources Research 1997, 33, 2897–2908. [Google Scholar]
- Pachepsky, Y.A.; Timlin, D. J.; Rawls, W. J. Soil water retention as related to topographic variables. Soil Science Society of America Journal 2001, 65, 1787–1795. [Google Scholar]
- Chamran, F.; Gessler, P.E.; Chadwick, O. A. Spatially explicit treatment of soil-water dynamics along a semi-arid catena. Soil Science Society of America Journal 2002, 66, 1571–1583. [Google Scholar]
Figure 1.
Study site locations in Montana, and Montana's location in North America. BBar ranch is located in Sweet Grass County and Decker/Bales ranch is in Powder River County.
Figure 1.
Study site locations in Montana, and Montana's location in North America. BBar ranch is located in Sweet Grass County and Decker/Bales ranch is in Powder River County.


Table 1.
Average soil profile (100 cm) θm (profile) models using soil survey data that were selected for validation for the BBar and Decker/Bales (D/B) ranches. Band numbers represent Landsat TM 5 bands. Slope is percent topographic slope. Aspect is cosine transformation of topographic aspect in degrees from north. Clay is entire profile weighted average percent clay of soil survey map unit major component. All models are significant at p-value < 0.05 and all variables are significant at p-value < 0.05 unless noted with #. R2 values, adjusted for degrees of freedom, are presented.
| Ranch | Model | Adjusted R2 |
|---|---|---|
| BBar | Profile = 0.7840 + -0.0146(band3) # + -0.0040(band4) + -0.0376(slope) + 0.0012(clay) + 0.0001(band32) # + -0.0004(slope*band3) + 0.0009(slope*band4) | 0.64 |
| D/B | Profile = 0.7080 + -0.0296(band3) + 0.0084(band4) + 0.0120(aspect) + 0.0007(clay) + 0.0004(band32)+ -0.000003(band4*band32) + -0.0022(band6)# | 0.43 |
Table 2.
Validation statistics for models in Table 1. Models were validated with half of the data set at each ranch (41 validation samples for BBar and 50 for Decker/Bales (D/B) ranch). Levene and Mann-Whitney statistics are p-values.
| Model | RMSD | Bias | MSD | SB | NU | LC | r2 | Levene | Mann-Whitney |
|---|---|---|---|---|---|---|---|---|---|
| BBar | 0.039 | 0.005 | 0.002 | 0.0000 | 0.0000 | 0.0015 | 0.54 | 0.81 | 0.35 |
| D/B | 0.040 | 0.006 | 0.002 | 0.0000 | 0.0005 | 0.0011 | 0.00 | 0.00 | 0.14 |
Table 3.
Correlation coefficients for soil water content (water) and selected predictor variables at the BBar ranch. Bands refer to Landsat 5 Thematic Mapper image bands, awc refers to plant available water holding capacity, clay refers to percent clay content, depth refers to depth to root restrictive layer, som refers to percent soil organic matter, and paw refers to plant available water.
| water | band 1 | band 2 | band 3 | band 4 | band 5 | band 6 | band 7 | |
|---|---|---|---|---|---|---|---|---|
| water | 1.00 | |||||||
| band 1 | -0.55 | 1.00 | ||||||
| band 2 | -0.56 | 0.95 | 1.00 | |||||
| band 3 | -0.60 | 0.93 | 0.93 | 1.00 | ||||
| band 4 | 0.15 | -0.35 | -0.31 | -0.34 | 1.00 | |||
| band 5 | -0.59 | 0.81 | 0.82 | 0.89 | -0.28 | 1.00 | ||
| band 6 | -0.44 | 0.74 | 0.72 | 0.81 | -0.50 | 0.76 | 1.00 | |
| band 7 | -0.58 | 0.89 | 0.89 | 0.94 | -0.36 | 0.97 | 0.80 | 1.00 |
| slope | -0.15 | 0.30 | 0.26 | 0.22 | -0.16 | 0.14 | 0.26 | 0.20 |
| aspect | -0.07 | -0.04 | -0.02 | -0.06 | -0.05 | -0.06 | -0.14 | -0.05 |
| awc | -0.10 | 0.17 | 0.13 | 0.24 | -0.09 | 0.25 | 0.16 | 0.20 |
| clay | 0.09 | -0.14 | -0.21 | -0.13 | -0.17 | -0.07 | -0.02 | -0.05 |
| depth | 0.08 | -0.31 | -0.34 | -0.28 | -0.01 | -0.19 | -0.17 | -0.21 |
| som | -0.13 | 0.21 | 0.22 | 0.16 | 0.03 | 0.20 | 0.07 | 0.17 |
| paw | 0.04 | -0.12 | -0.17 | -0.10 | -0.20 | -0.06 | 0.01 | -0.06 |
Table 4.
Correlation coefficients for soil water content (water) and selected predictor variables at the Decker/Bales ranch. Bands refer to Landsat 5 Thematic Mapper image bands, awc refers to plant available water holding capacity, clay refers to percent clay content, depth refers to depth to root restrictive layer, som refers to soil organic matter, and paw refers to plant available water.
| water | band 1 | band 2 | Band 3 | band 4 | band 5 | band 6 | band 7 | |
|---|---|---|---|---|---|---|---|---|
| water | 1.00 | |||||||
| band 1 | -0.23 | 1.00 | ||||||
| band 2 | -0.22 | 0.90 | 1.00 | |||||
| band 3 | -0.20 | 0.86 | 0.96 | 1.00 | ||||
| band 4 | -0.17 | 0.59 | 0.75 | 0.82 | 1.00 | |||
| band 5 | -0.28 | 0.79 | 0.78 | 0.80 | 0.60 | 1.00 | ||
| band 6 | -0.24 | 0.50 | 0.41 | 0.33 | 0.01 | 0.51 | 1.00 | |
| band 7 | -0.21 | 0.83 | 0.77 | 0.74 | 0.42 | 0.92 | 0.59 | 1.00 |
| slope | -0.08 | -0.05 | -0.11 | -0.18 | -0.27 | -0.21 | -0.02 | -0.11 |
| aspect | 0.15 | -0.10 | -0.07 | -0.05 | 0.00 | -0.13 | -0.08 | -0.15 |
| awc | -0.22 | 0.09 | 0.08 | 0.07 | -0.01 | 0.02 | 0.08 | 0.06 |
| paw | -0.12 | 0.08 | 0.13 | 0.14 | 0.17 | 0.19 | 0.07 | 0.15 |
| clay | 0.10 | 0.01 | -0.02 | 0.01 | -0.15 | -0.05 | 0.09 | 0.01 |
| som | 0.09 | -0.19 | -0.16 | -0.17 | -0.11 | -0.20 | -0.10 | -0.17 |
| depth | 0.01 | 0.01 | 0.08 | 0.10 | 0.20 | 0.18 | 0.03 | 0.10 |
© 2008 by MDPI Reproduction is permitted for noncommercial purposes.
Share and Cite
MDPI and ACS Style
Sankey, J.B.; Lawrence, R.L.; Wraith, J.M. Ad Hoc Modeling of Root Zone Soil Water with Landsat Imagery and Terrain and Soils Data. Sensors 2008, 8, 314-326. https://doi.org/10.3390/s8010314
AMA Style
Sankey JB, Lawrence RL, Wraith JM. Ad Hoc Modeling of Root Zone Soil Water with Landsat Imagery and Terrain and Soils Data. Sensors. 2008; 8(1):314-326. https://doi.org/10.3390/s8010314
Chicago/Turabian StyleSankey, Joel B., Rick L. Lawrence, and Jon M. Wraith. 2008. "Ad Hoc Modeling of Root Zone Soil Water with Landsat Imagery and Terrain and Soils Data" Sensors 8, no. 1: 314-326. https://doi.org/10.3390/s8010314