Sensitivity of PZT Impedance Sensors for Damage Detection of Concrete Structures

1
School of Civil and Environmental Engineering, Nanyang Technological University, 50 Nanyang Avenue, Singapore 639798
2
Institute for Infrastructure and Environment, School of Engineering and Electronics, University of Edinburgh, Edinburgh EH9 3JL, UK
*
Authors to whom correspondence should be addressed.
Sensors 2008, 8(1), 327-346; https://doi.org/10.3390/s8010327
Submission received: 23 November 2007
/
Accepted: 15 January 2008
/
Published: 21 January 2008
(This article belongs to the Special Issue Sensors for Urban Environmental Monitoring)
Abstract
:Piezoelectric ceramic Lead Zirconate Titanate (PZT) based electro-mechanical impedance (EMI) technique for structural health monitoring (SHM) has been successfully applied to various engineering systems. However, fundamental research work on the sensitivity of the PZT impedance sensors for damage detection is still in need. In the traditional EMI method, the PZT electro-mechanical (EM) admittance (inverse of the impedance) is used as damage indicator, which is difficult to specify the effect of damage on structural properties. This paper uses the structural mechanical impedance (SMI) extracted from the PZT EM admittance signature as the damage indicator. A comparison study on the sensitivity of the EM admittance and the structural mechanical impedance to the damages in a concrete structure is conducted. Results show that the SMI is more sensitive to the damage than the EM admittance thus a better indicator for damage detection. Furthermore, this paper proposes a dynamic system consisting of a number of single-degree-of-freedom elements with mass, spring and damper components to model the SMI. A genetic algorithm is employed to search for the optimal value of the unknown parameters in the dynamic system. An experiment is carried out on a two-storey concrete frame subjected to base vibrations that simulate earthquake. A number of PZT sensors are regularly arrayed and bonded to the frame structure to acquire PZT EM admittance signatures. The relationship between the damage index and the distance of the PZT sensor from the damage is studied. Consequently, the sensitivity of the PZT sensors is discussed and their sensing region in concrete is derived.
1. Introduction
The development of real-time, in-situ structural health monitoring (SHM) and damage detection techniques has been studied to prevent catastrophic failures and to reduce the cost of maintenance and inspecting tasks. The impedance-based SHM technique has been developed by using the electromechanical (EM) coupling property of the piezoelectric materials [1]. It has involved into a new nondestructive evaluation (NDE) method. This method utilizes the electro-mechanical impedance (EMI) of the piezoelectric materials, which is directly related to the mechanical impedance of the host structure. And the structural mechanical impedance (SMI) will be affected by the presence of structural damage. A PZT sensor can produce electrical charges when subjected to a strain field and conversely mechanical strain when an electric field is applied. The theoretical model of the PZT driven dynamic structural system was first proposed by Liang et al. [2]. This one-dimensional has subsequently developed by many other researchers [3-7] and applied to the health monitoring of various engineering systems [8-14].
The prominent effects of structural damages on the PZT admittance (the inverse of impedance) signatures are the lateral and vertical shifting of the baseline signatures, which are the main damage indicators. Statistical techniques have been employed to associate the damage with the changes in the EM admittance signatures, such as the root mean square deviation (RMSD) [15], the relative deviation [8], the difference of transfer function between the damaged and undamaged conditions and the mean absolute percent deviation [16]. Comparison of these statistical indices showed that the RMSD is the most robust and representative index for assessing damage progression, thus it will be used in this study. On the other hand, Hu and Yang [17] used an alternative method for damage diagnosis based on the changes in SMI, which was extracted from the EM admittance signature of the PZT sensor by means of signature decomposition. The sensitivity of the SMI based RMSD and the EM admittance based RMSD to structural damage will be compared in this paper. Furthermore, the reliable sensing region of the PZT sensors based on these two RMSD indices will be derived.
The EMI method has been successfully applied for various engineering structures for damage detection. However, the conventional EMI method can only be used to predict the existence of the structural damage but not to further investigate the influence of the damage on the structural properties. Thus, this paper proposes a dynamic system model to associate the damage state with the changes of structural properties. This dynamic system consists of a number of single-degree-of-freedom (SDOF) elements with mass, spring and damper components. The unknown parameters of mass, stiffness and damping in each SDOF element are derived using a genetic algorithm (GA) by fitting the SMI of the dynamic system with that extracted from the experimentally measured PZT EM admittance signature for various damage states. Therefore, the dynamic system possesses the same SMI as the host structure or part of the host structure monitored by PZT sensors. Consequently, the changes of dynamic system parameters for various damage states represent the changes of structural properties associated with the damage state.
For the above purposes, an experimental study is carried out on a two-storey concrete frame subjected to base vibrations that simulate earthquake. Different base vibrations are applied such that various damages (cracks) are induced in the structure. A number of PZT sensors are regularly arrayed and bonded to the frame structure to acquire the PZT EM admittance signatures, from which the SMI can be extracted. Subsequently, the RMSD indices based the EM admittance and SMI are calculated and compared for various damage states. The relationship between the RMSD damage index and the distance of the PZT sensor from the damage is studied. Therefore, the sensitivity of the PZT sensors is discussed and their sensing region in concrete is derived. Finally, the changes of structural properties caused by damage are analyzed.
2. Electro-Mechanical Impedance (EMI)
The EMI damage detection method is based on the principle of EM coupling effect between the host structure and the bonded PZT sensor. Liang et al. [2] proposed an EM model of the PZT bonded structure system. In this one dimensional model, the host structure was simplified as a skeletal structure and the PZT sensor as a thin bar undergoing axial vibration with its interaction with the structure only at the driven point. Therefore, the whole structural system can be represented by its driven point mechanical impedance. Incorporating the dynamic force equilibrium and the PZT constitutive equations, the EM admittance of the PZT sensor can be expressed as
where Za and Z are the mechanical impedances of the PZT and the host structure, respectively; j is the imaginary unit; ω is the angular frequency of the driving voltage; wa, la and ha are the width, length and thickness of the PZT sensor, respectively; Y̅E = YE (1 + jn) is the complex Young's modulus of the PZT material at zero electric field; d32 is the coupling piezoelectric constant between the z and y directions at zero stress;
is the complex dielectric constant at zero stress; η and δ denote the mechanical loss factor and the dielectric loss factor of the PZT material, respectively; and κ is the wave number which is related to the angular frequency of excitation ω by
where ρ is the material density of the structure.
The electromechanical admittance Y(ω) consists of the real and imaginary parts. The real part is called the conductance and denoted by G, and the imaginary part is called susceptance and denoted by B. Therefore, the complex electromechanical admittance of the PZT sensor can be expressed as
Eq. (1) indicates that the EM admittance is directly related to the mechanical impedance of the host structure. The variation in the PZT EM admittance over a range of frequencies is analogous to that of the frequency response functions of a structure, which contains vital information regarding the health state of the structure. Since all other PZT properties remain constant, it is the structural mechanical impedance Z that uniquely determines the overall admittance signature. Therefore, any change in the EM admittance signature is an indication of a change in the structural integrity which may be caused by the presence of structural damage.
3. Extraction of SMI
The complex mechanical impedances of the PZT sensor and the host structure are expressed as
where xa and ya are the real and imaginary parts of the mechanical impedance of the PZT sensor, respectively; and x and y the real and imaginary parts of the structural impedance, respectively.
4. RMSD for EM Admittance and SMI
While the admittance response plots provide a qualitative approach for damage identification, the quantitative assessment of damage is traditionally made by the use of a scalar damage metric. In the earlier work, an effective statistical algorithm, which is based on frequency-by-frequency comparison, was presented as RMSD. The RMSD index is defined as
where
is the conductance of the PZT measured at the healthy condition of the structure, and
is the corresponding post-damage value at the ith measurement point. In the RMSD damage index chart, the larger the difference between the baseline reading and the subsequent reading, the greater the numerical RMSD value is. The RMSD damage index values denote the changes of structural dynamic properties. These changes may be caused by the variations in the geometrical conditions, the environmental temperature and the presence of structural damage. For a damage detection technique, larger RMSD values detected by a PZT sensor indicate the higher sensitivity to structural damage of this PZT sensor.
We can also calculate the RMSD index of the PZT susceptance using Eq. (15) by replacing G with B. The RMSD values of the real part and imaginary parts of the SMI at the PZT driven point can be calculated using Eq. (15), by replacing G with x and y respectively. Since the driven point structural impedance extracted from the measured PZT admittance eliminates the contributions from the PZT sensor, it is able to reveal the health status of the structure more directly, so is its RMSD value.
5. Modeling of SMI by a Dynamic System
The concept of SMI is analogous to the electrical impedance. The SMI at a given point can be defined as the ratio of a sinusoidal force applied to the system at that point to the velocity at the same point. For an SDOF mass-spring-damper element subjected to an excitation force shown in Figure 1, the SMI is
where the subscript ‘o’ denotes the amplitudes of the variables. Using complex notation, analogous to that used in classical electricity, the SMI can be expressed as
For a complex structural system, the above SMI model can be easily extended to be a multiple-degree-of-freedom (MDOF) system by combining a number of SDOF elements. For a parallel connection system, the combined SMI, Zp can be expressed as the sum of the impedances, Zi of each element.
For a series connection system, the combined SMI, Zs can be expressed as
6. Structural Parameters Identification Using Genetic Algorithm
The original GA was developed based on the Darwinian theory of natural evolution [19]. Later on, the more practical form of GAs was described in [20,21]. GAs and their variations have been applied in structural optimization and design, as well as structural vibration control [22-28]. Differing from the conventional search techniques, GAs are stochastic search techniques starting with an initial population of randomly generated candidate solutions encoded as chromosomes. The chromosomes evolve through successive generations. During each generation, offspring are created from the parents by means of crossover and mutation. A new generation is formed by selecting chromosomes according to their level of fitness in the problem domain. Fitter chromosomes have higher possibilities of being selected. After a number of generations, the algorithms converge to the best chromosome which hopefully represents the optimal solution to the problem. A modified GA developed in [28] is used in this study to search for the optimal values of structural parameters in the dynamic system.
The GAs attempt to find the best solution to a given problem by minimizing an objective evaluation function which is called fitness function. In order to formulate the structural parameter identification problem into an optimization problem for the GA to solve, it is necessary to specify an objective function which is used to provide a measure of how individuals have performed in the problem domain. The fittest individuals will have the lowest numerical value of the associated objective function.
Structural damage, especially local damage, is typically related to changes in the structural physical parameters. Therefore, to recognize the changes of structural parameters is a direct way to predict structural damage and also an effective way to assess the severity of the damage. Towards this goal, a model of driven point structural impedance with pending structural parameters should be set up. In this study, the proposed model is an MDOF system constructed by the connection of a number of SDOF elements as described in the former section. In this model, the structural impedance is a function of excitation frequency with unknown structural parameters, i.e., the mass mi, the stiffness ki and the damping coefficient ci of each SDOF element. On the other hand, by means of decomposition we can obtain the signature of structural impedance from the experimentally measured PZT EM admittance. For an effective impedance model, the modeled structural impedance and the measured structural impedance should be approximately of the same value under the same excitation frequency. Since the real part of the structural mechanical impedance is more sensitive to the structural damages, the objective function for identifying structural parameters is defined as
where mi, ki and ci (i=1…n) are the unknown mass, stiffness and damping coefficients of each SDOF element used to construct the MDOF model; n is the total number of the SDOF elements in the model; xi and yi (i=1…p) are the real and imaginary parts of the structural mechanical impedance under the excitation frequency of the ith sample point; p is the total number of sample points; and the superscripts ‘e’ and ‘t’ denote the experimental data and theoretical data of the corresponding variables respectively. The GAs are applied to search for the optimal values of the unknown structural parameters in the MDOF model system such that the fitness function in Eq. (20) is minimal.
Using the GAs, the optimal values of structural parameters in the model of the PZT driven point structural impedance can be derived according to the measured EM admittance signatures. For damage assessment, these optimal values obtained before and after the appearance of structural damage are compared to study the effects of damage on the structural properties, which are specified to be mass, stiffness and damping in this study. To quantify the effects of damage, the summation of the deviation of a certain parameter in each element is expressed as
where Δm, Δk and Δc are the sum of the deviation of mass, stiffness and damping coefficients in each SDOF element respectively; and the superscripts ‘b’ and ‘a’ denote the values at the health state and the damage state respectively.
5. Experimental Set-up and Procedure
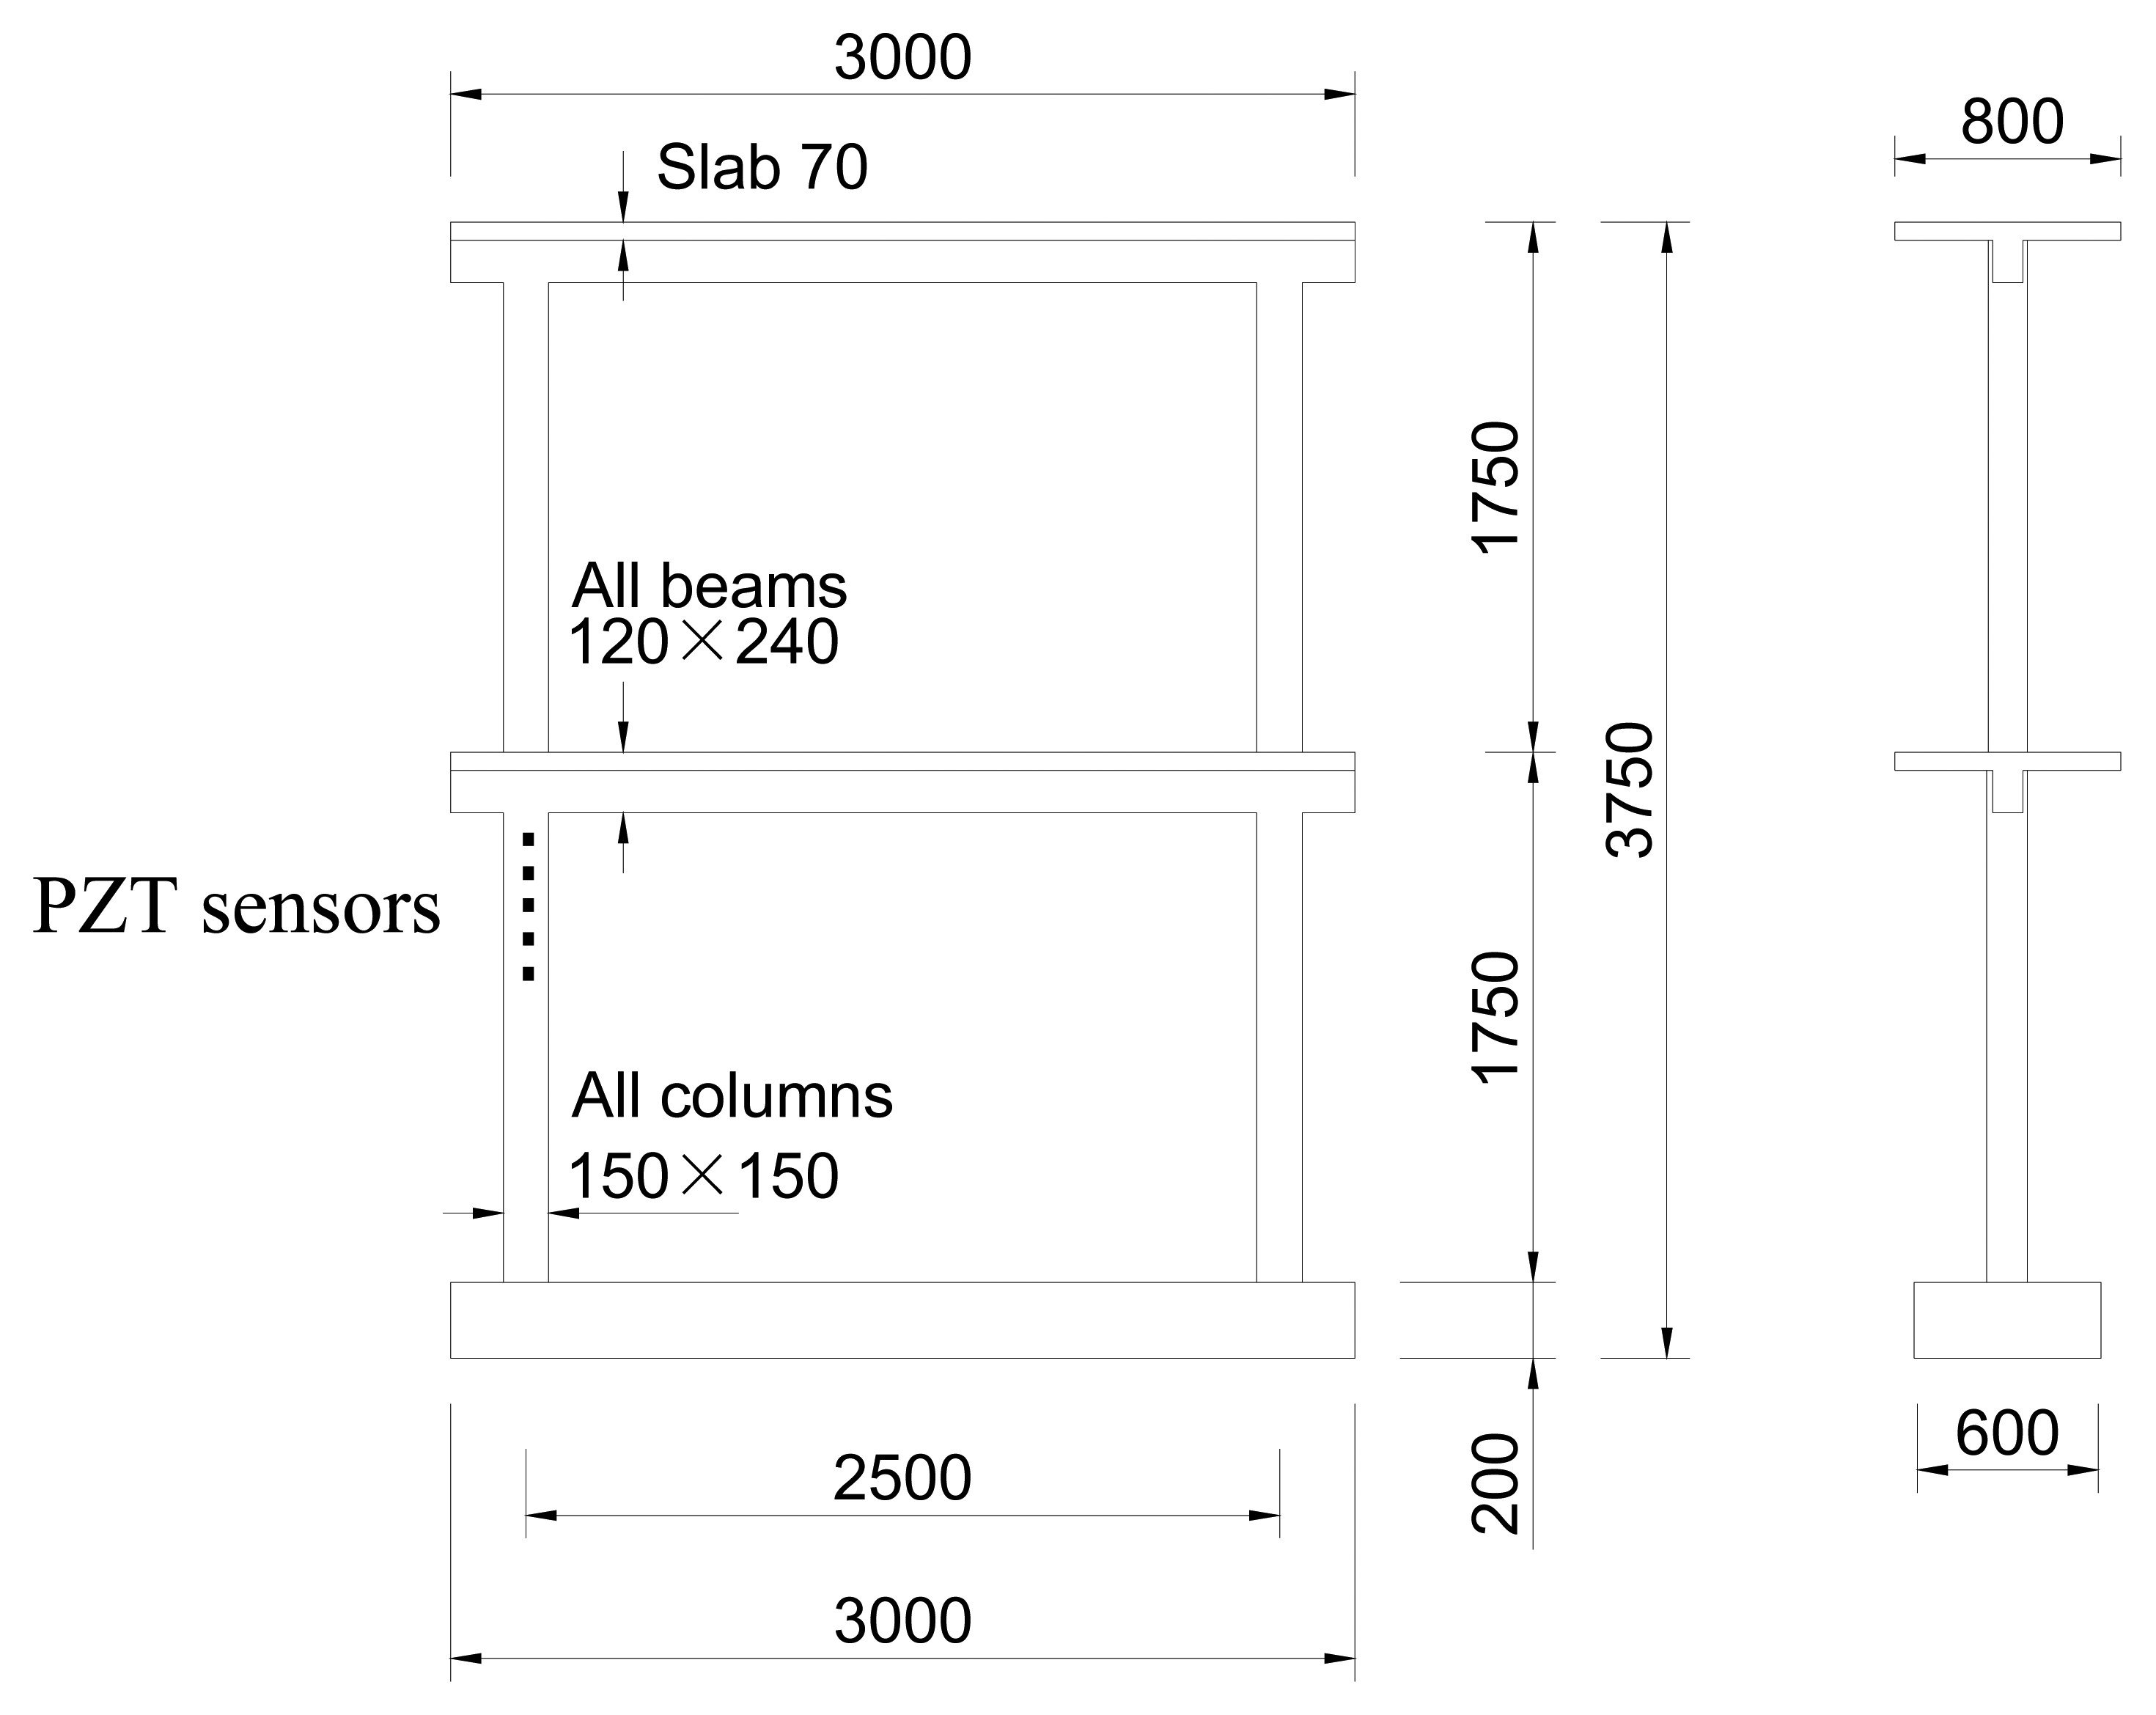
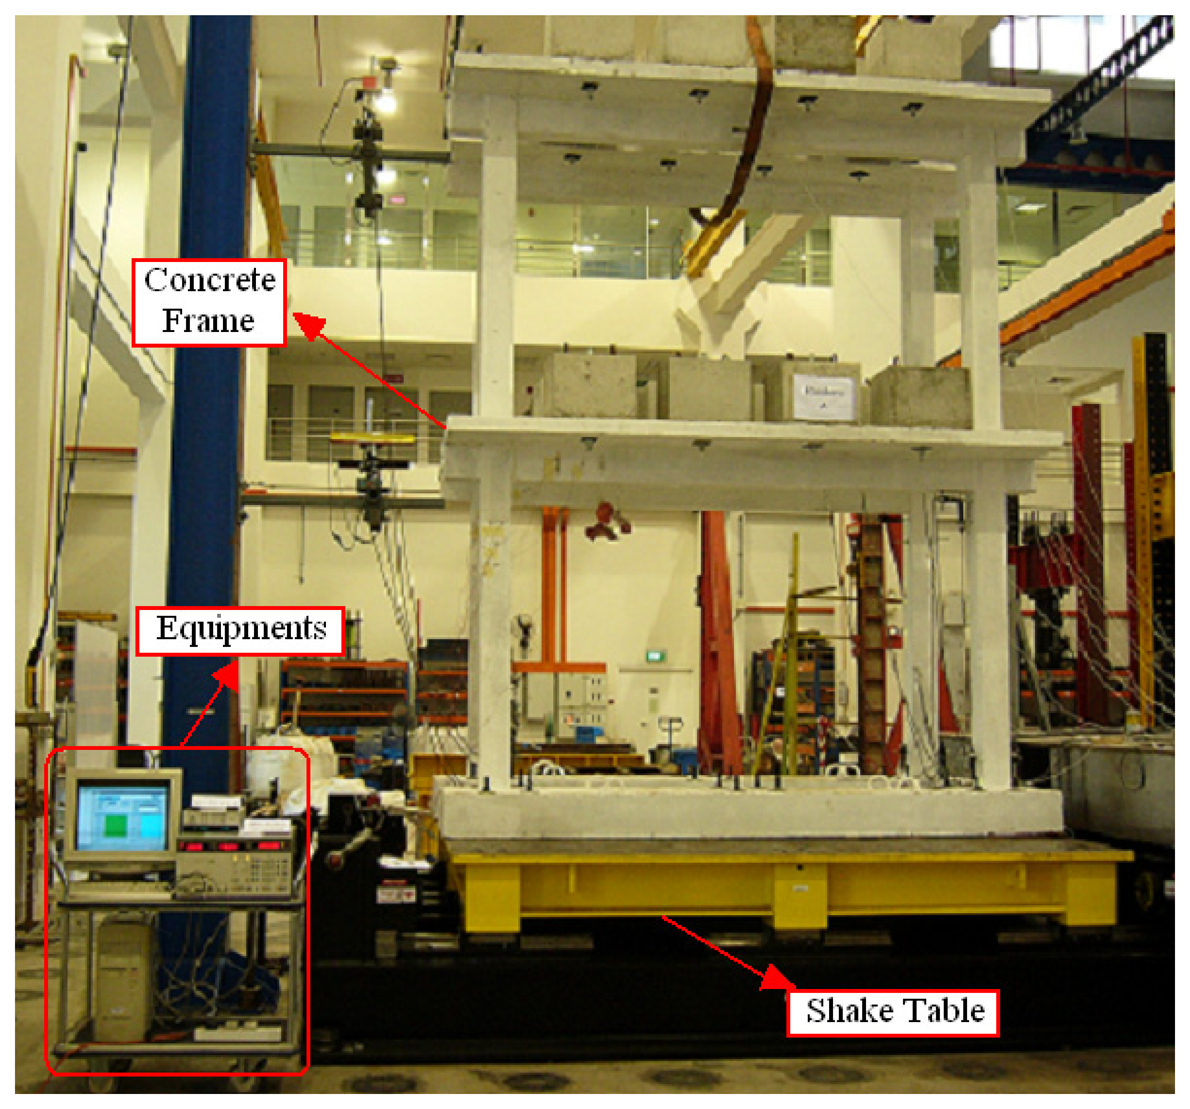
In this study, an experiment was carried out on a two-storey concrete frame instrumented with five PZT sensors, as shown in Figure 2, where the dimensions and sizes of various structural members, i.e., the beams and columns, are indicated. The five PZT sensors were regularly bonded to one of the columns on the first floor of the frame structure. The suitable locations of the PZT sensors were determined based on the structural analysis and the engineering experience that cracks most probably appear at the joint section between the columns and beams. Therefore, the PZT sensors were bonded close to a joint and along a column in order to capture the information of vital structural damages. The dimensions and material properties of the PZT sensors are listed in Table 1 and their locations are listed in the second column of Table 2. The concrete frame structure is placed on a shake table which generates base vibrations to simulate the earthquake. The concrete frame and the equipments used in this experiment are shown in Figure 3. The five PZT sensors were individually connected to different channels of a switch box, which was used to make a multiple connections between the HP 4192A Impedance Analyzer and the PZT sensors. The Impedance Analyzer excited the PZT sensors and simultaneously recorded the admittance signatures received by the PZT sensors. A sinusoidal sweep voltage with amplitude of 1 volt is applied to the PZT sensors over various frequency ranges. The Impedance Analyzer was then connected to a personal computer to store the data. In order to facilitate the automation of testing, the program VEE Pro v.6.01 was used to control the Impedance Analyzer via a GPIB interface card installed in the computer.
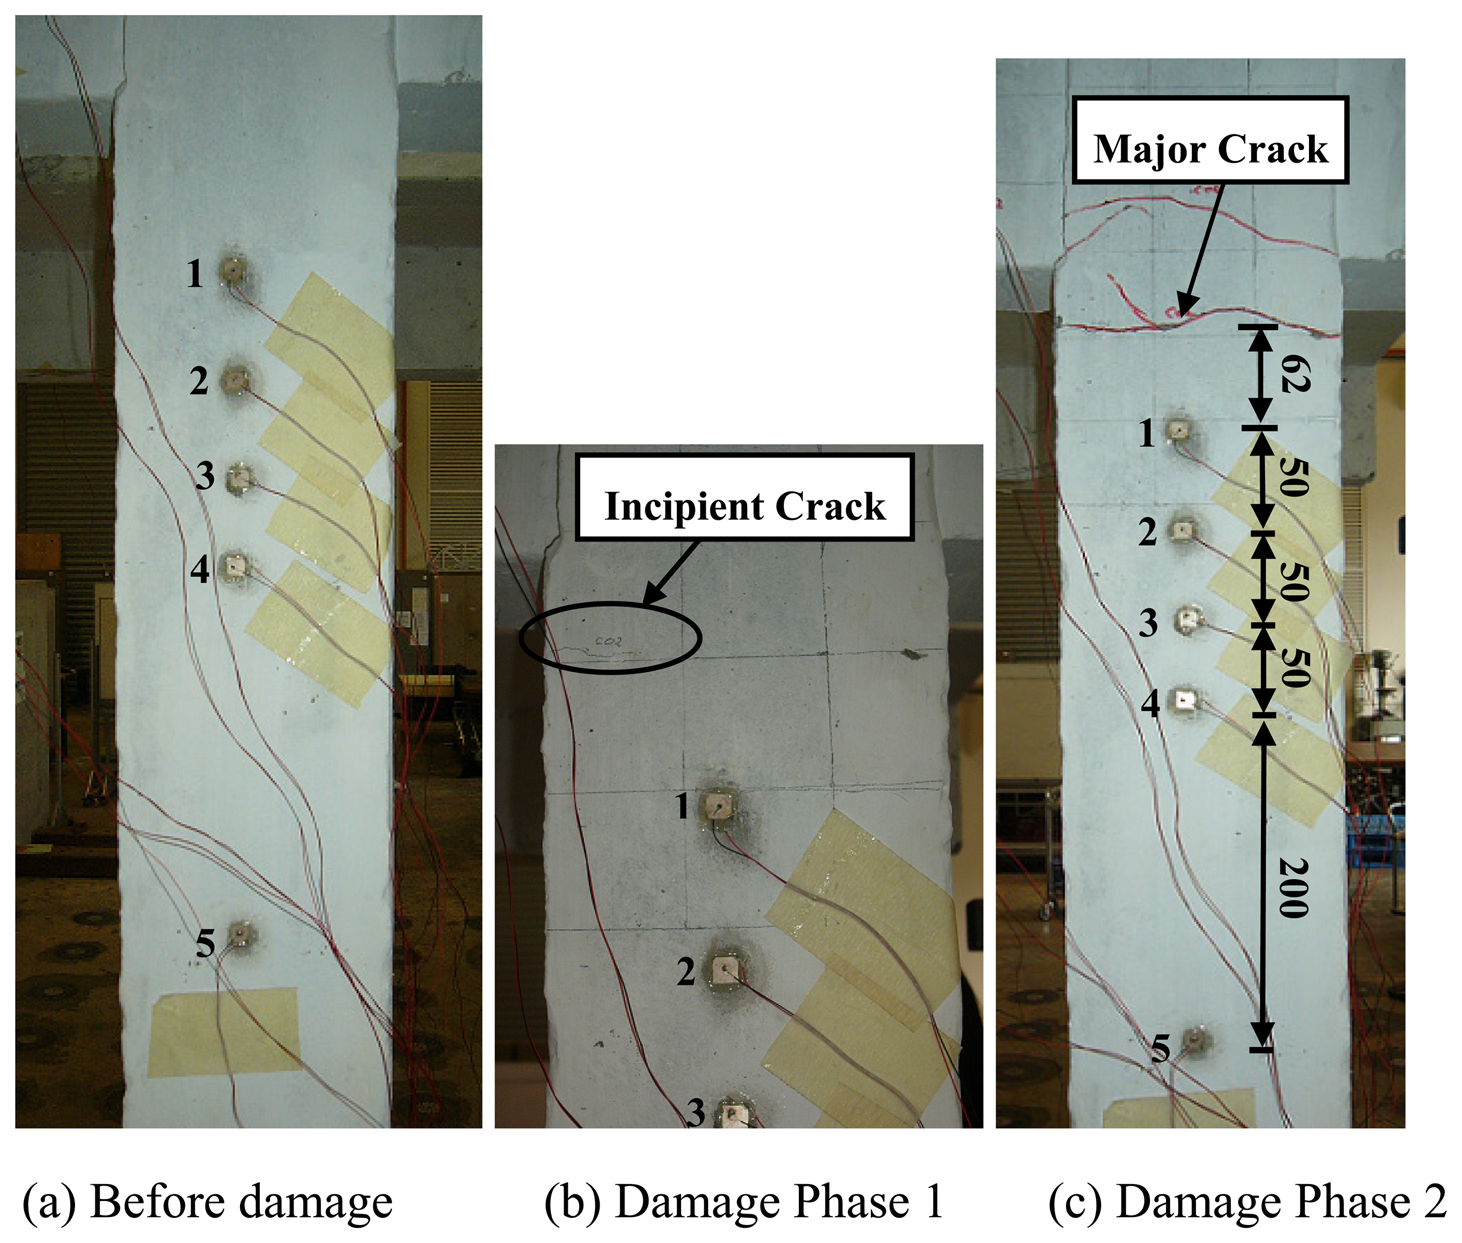
The test loads were applied in the form of the horizontal base motions with different frequencies. The test was performed in several phases and the sequences of the applied base motions are listed in Table 3. The concrete frame structure was subjected to two main vibration phases, namely phase 2 and phase 4 as listed in Table 3. The other three random vibration phases were used for structural identification. After vibration phase 2, incipient damages occurred in the structure, and some are visible. After vibration phase 4, major cracks appeared in the structure, especially at the joint section. The appearance of cracks on the column where the PZT sensors were installed is shown in Figure 4. The five PZT sensors were scanned before the base-loading in order to record the baseline signatures for the health condition. Under the conditions of incipient damage as shown in Figure 4(b) and severe damage as shown in Figure 4(c), the PZT sensors were individually scanned to acquire the post-damage signatures. The distances of the five PZT sensors from the main crack shown in Figure 4(c) are listed in the third column of Table 2.
6. Results and Discussion
6.1 PZT sensing region in concrete structure
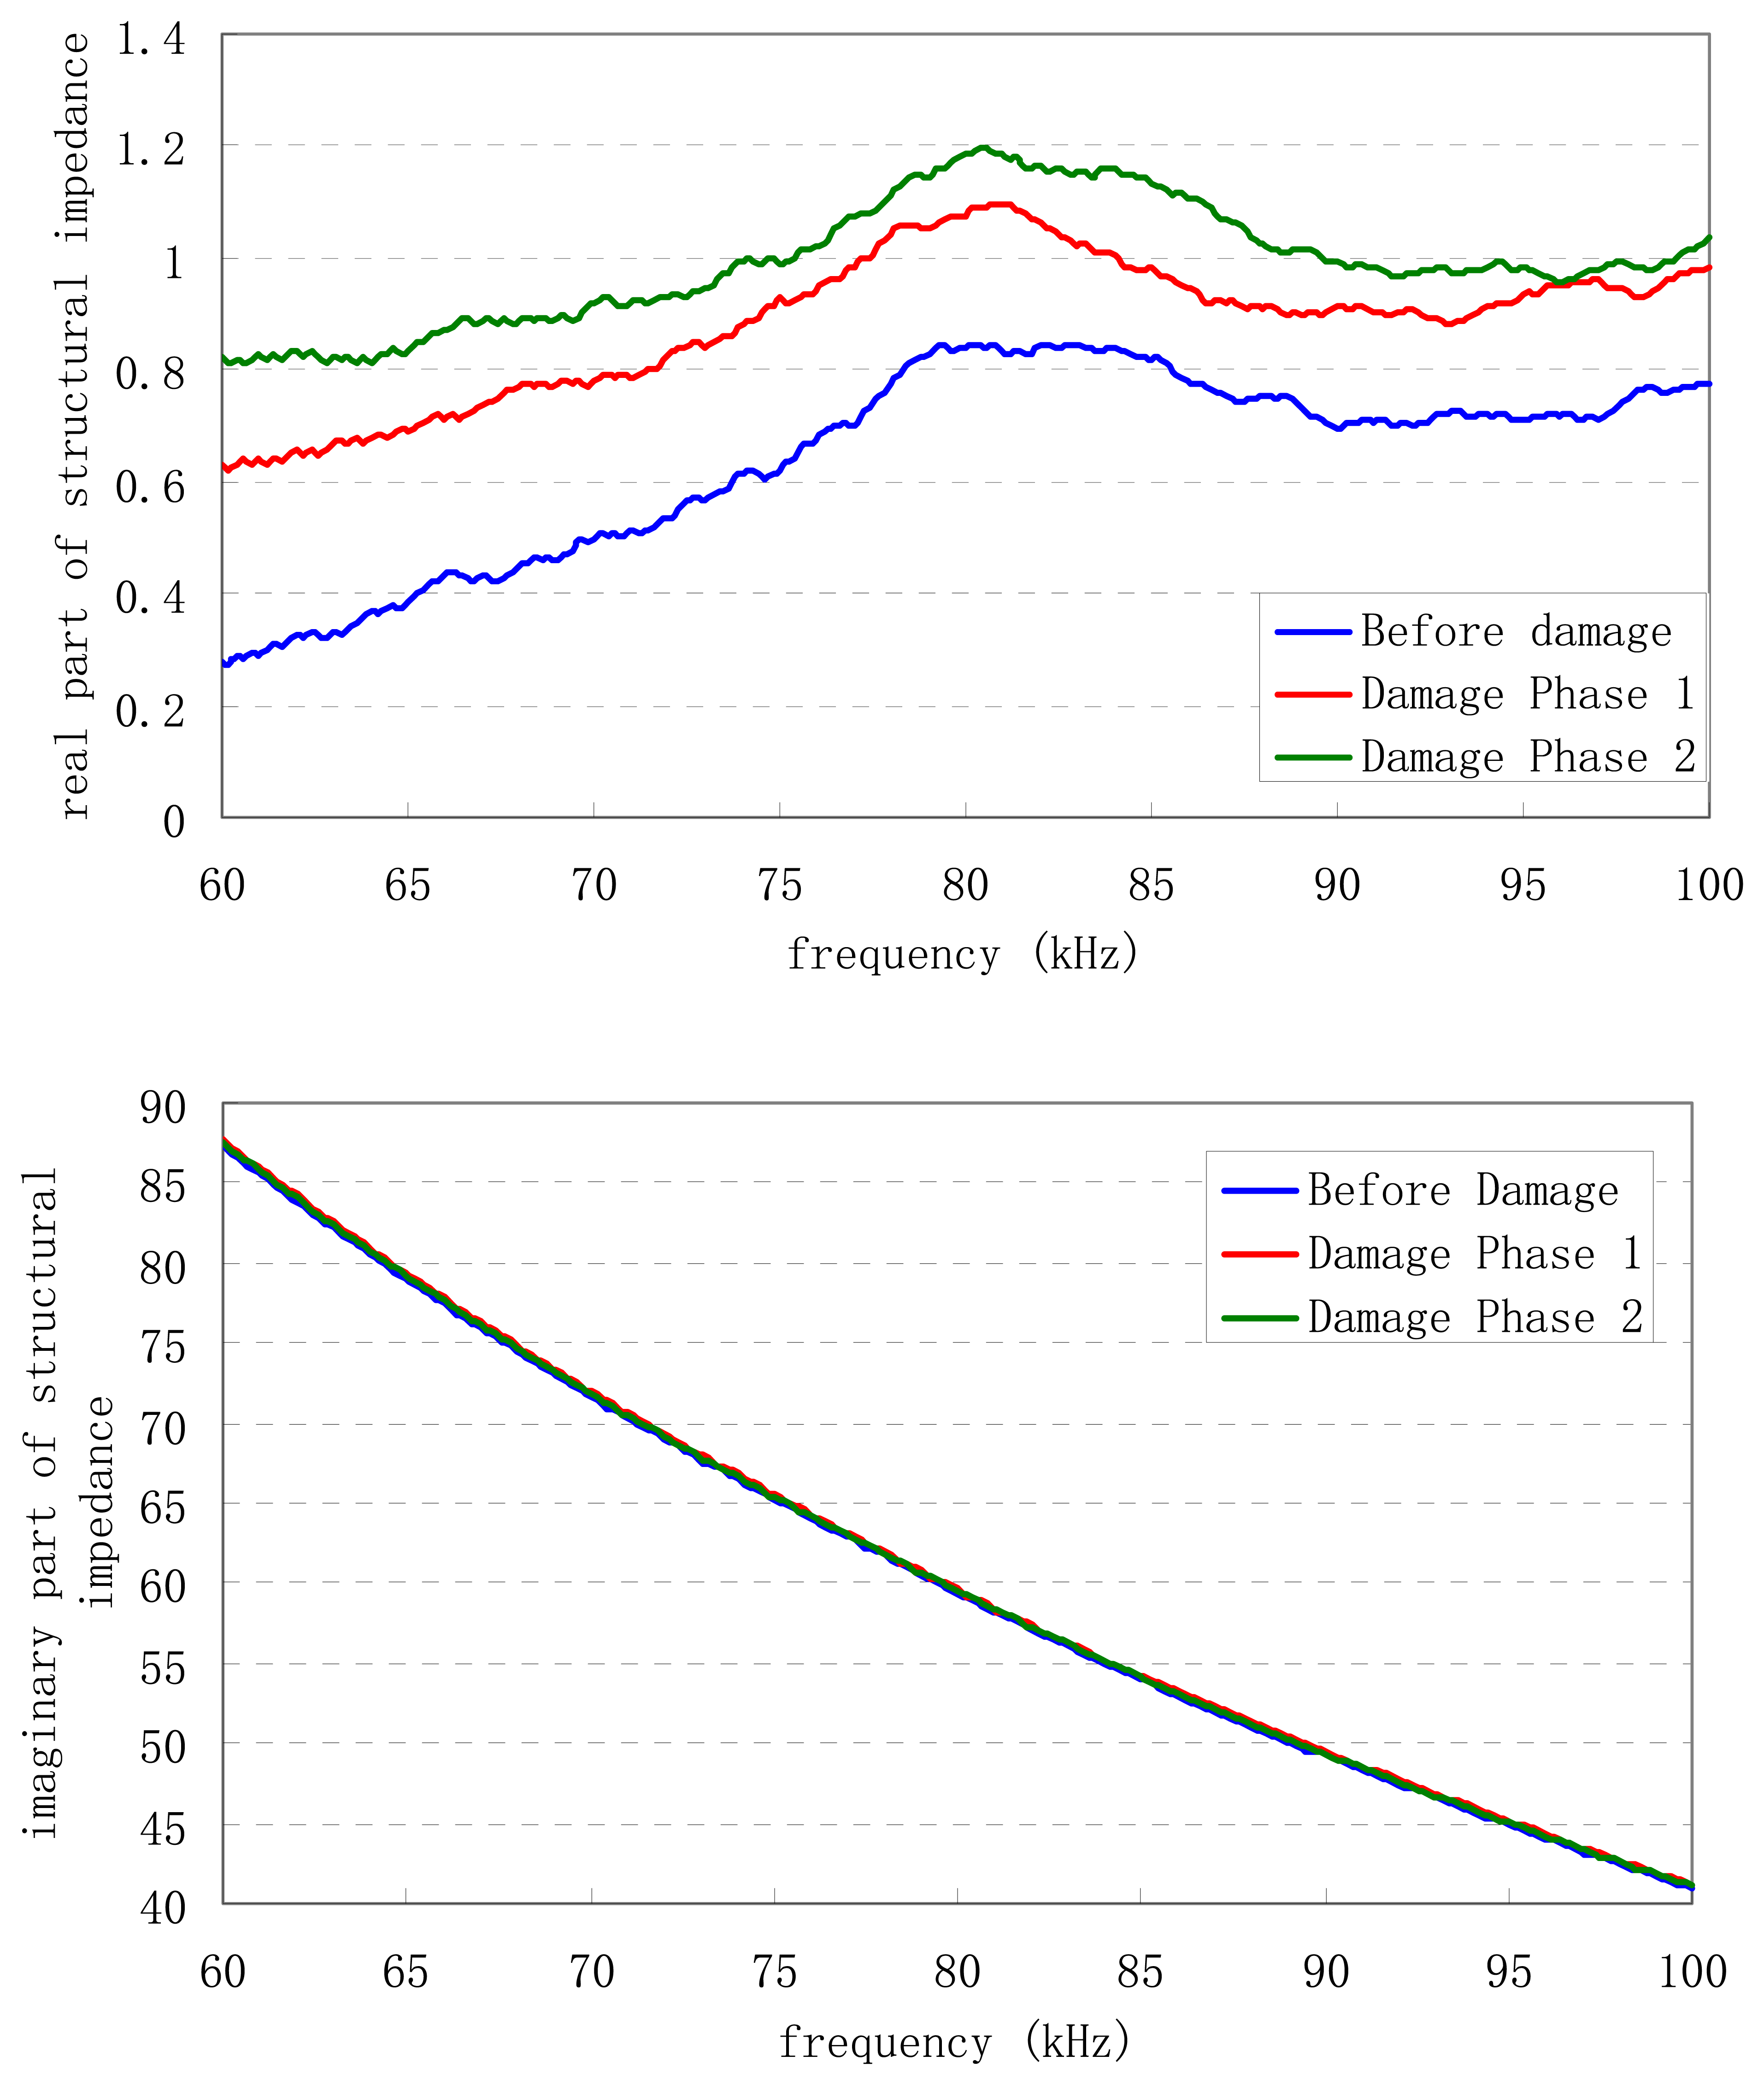
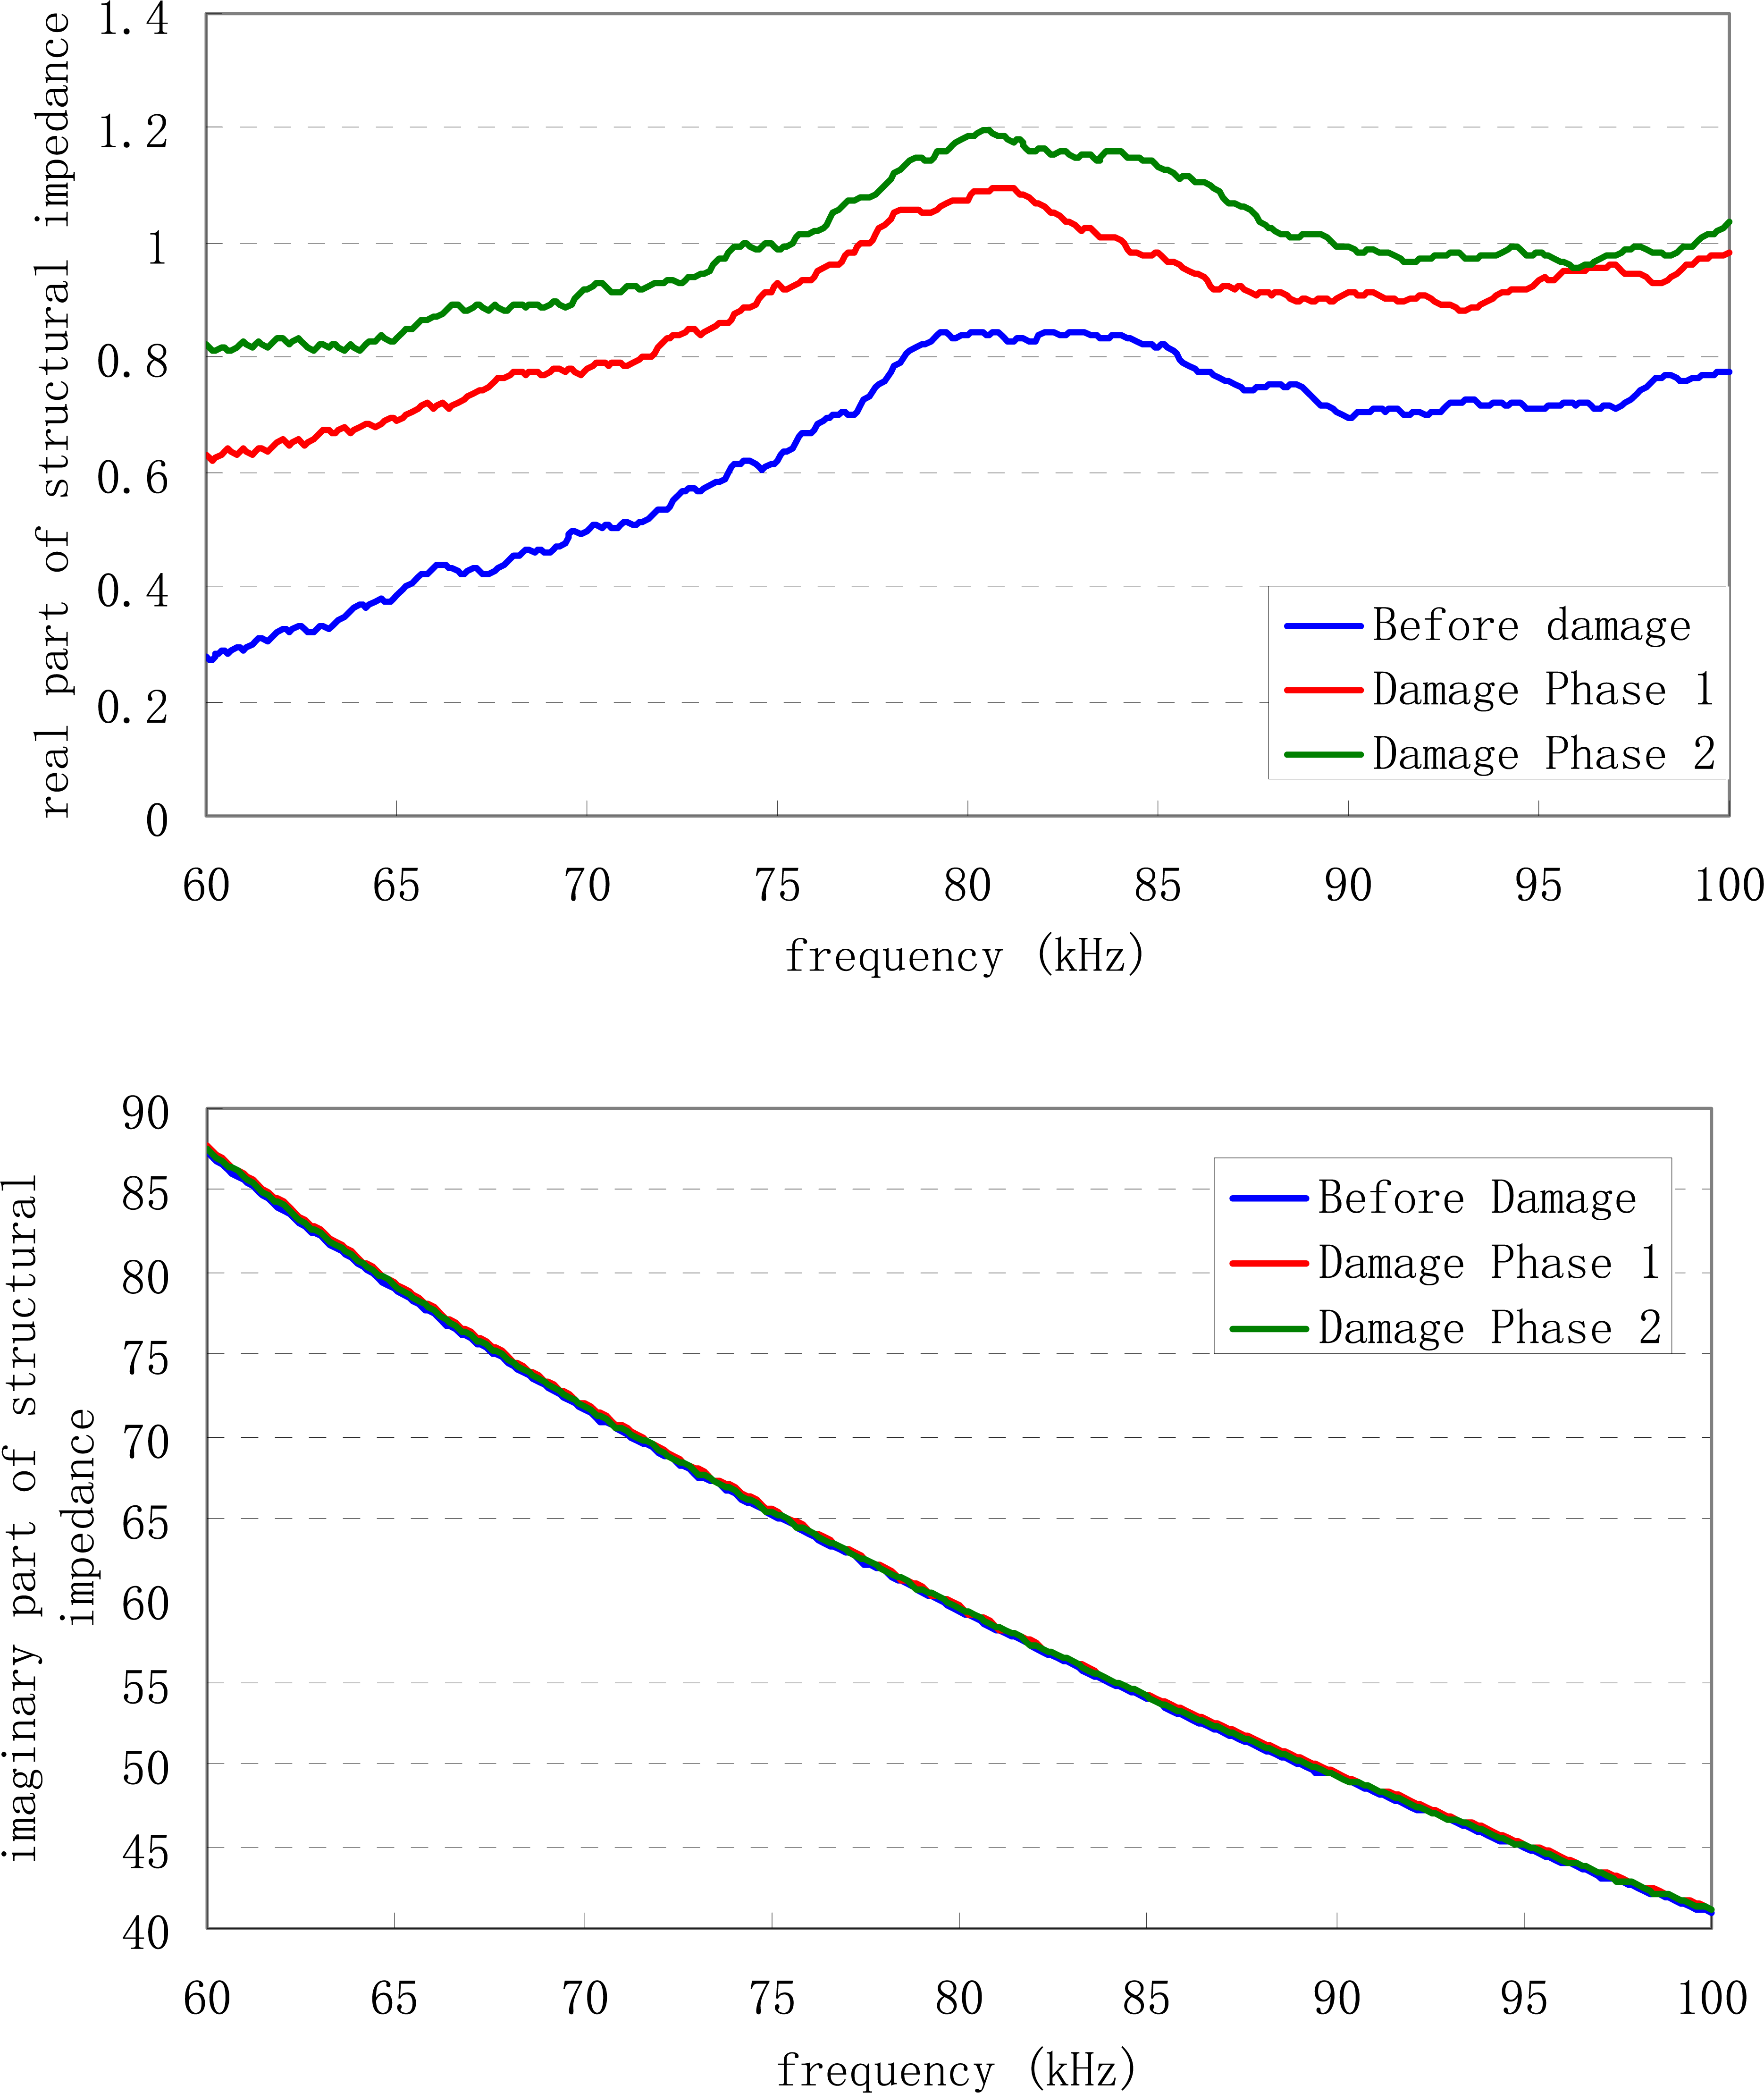
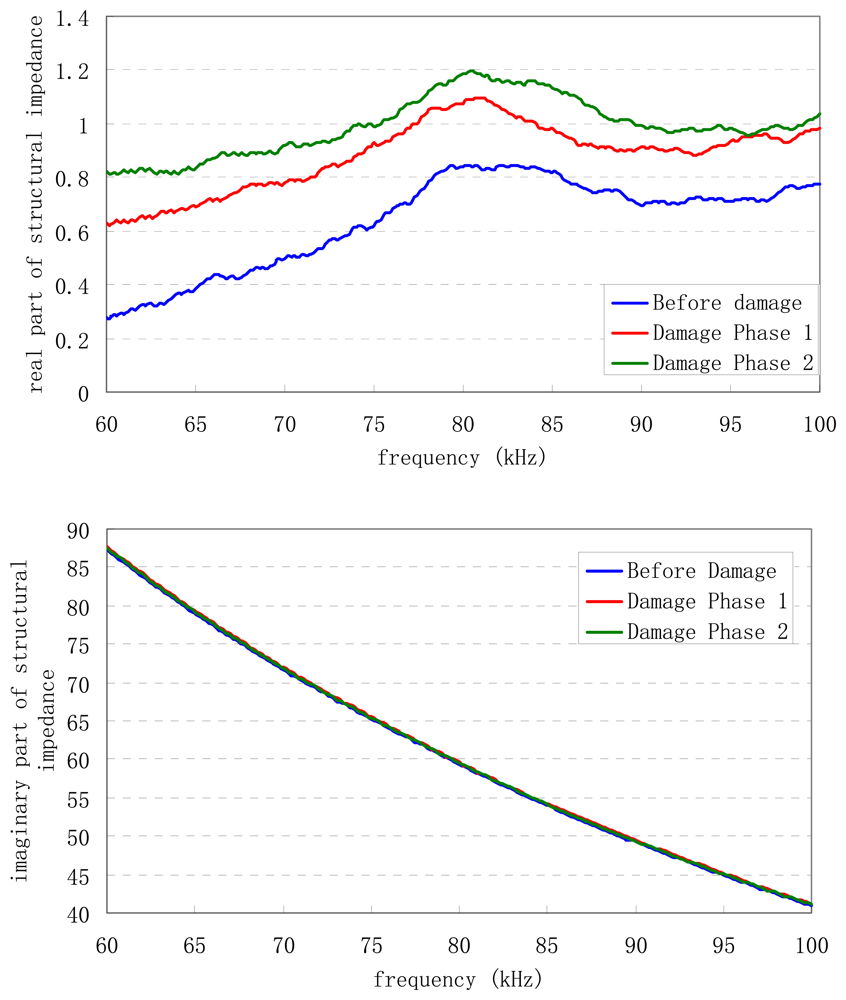
Using the Impedance Analyzer, the conductance and susceptance signatures of the PZT sensors can be obtained. Before damage and after each of the two damage phases, these five PZT sensors were scanned to record the signatures of the PZT EM admittance. Signatures captured by one of the PZT sensors (Patch 4) are illustrated in Figure 5. According to the measured signatures, the PZT driven point structural impedances were calculated by Eq. (12) and illustrated in Figure 6.
As pointed out by Park et al [29], the sensitivity for damage detection of the impedance-based SHM method is closely related to the frequency band selected. In order to detect the damage effectively, it is necessary for the wavelength of the excitation to be smaller than the characteristic length of the damage. In this study, the frequency range of 60-100 kHz (Figure 5) for the concrete structure is determined by trial-and-error. The PZT patches were first scanned over a wide frequency range of 10 kHz to 400 kHz to acquire the admittance signatures. It was then identified that 60-100 kHz is a suitable frequency range for the tested concrete structure.
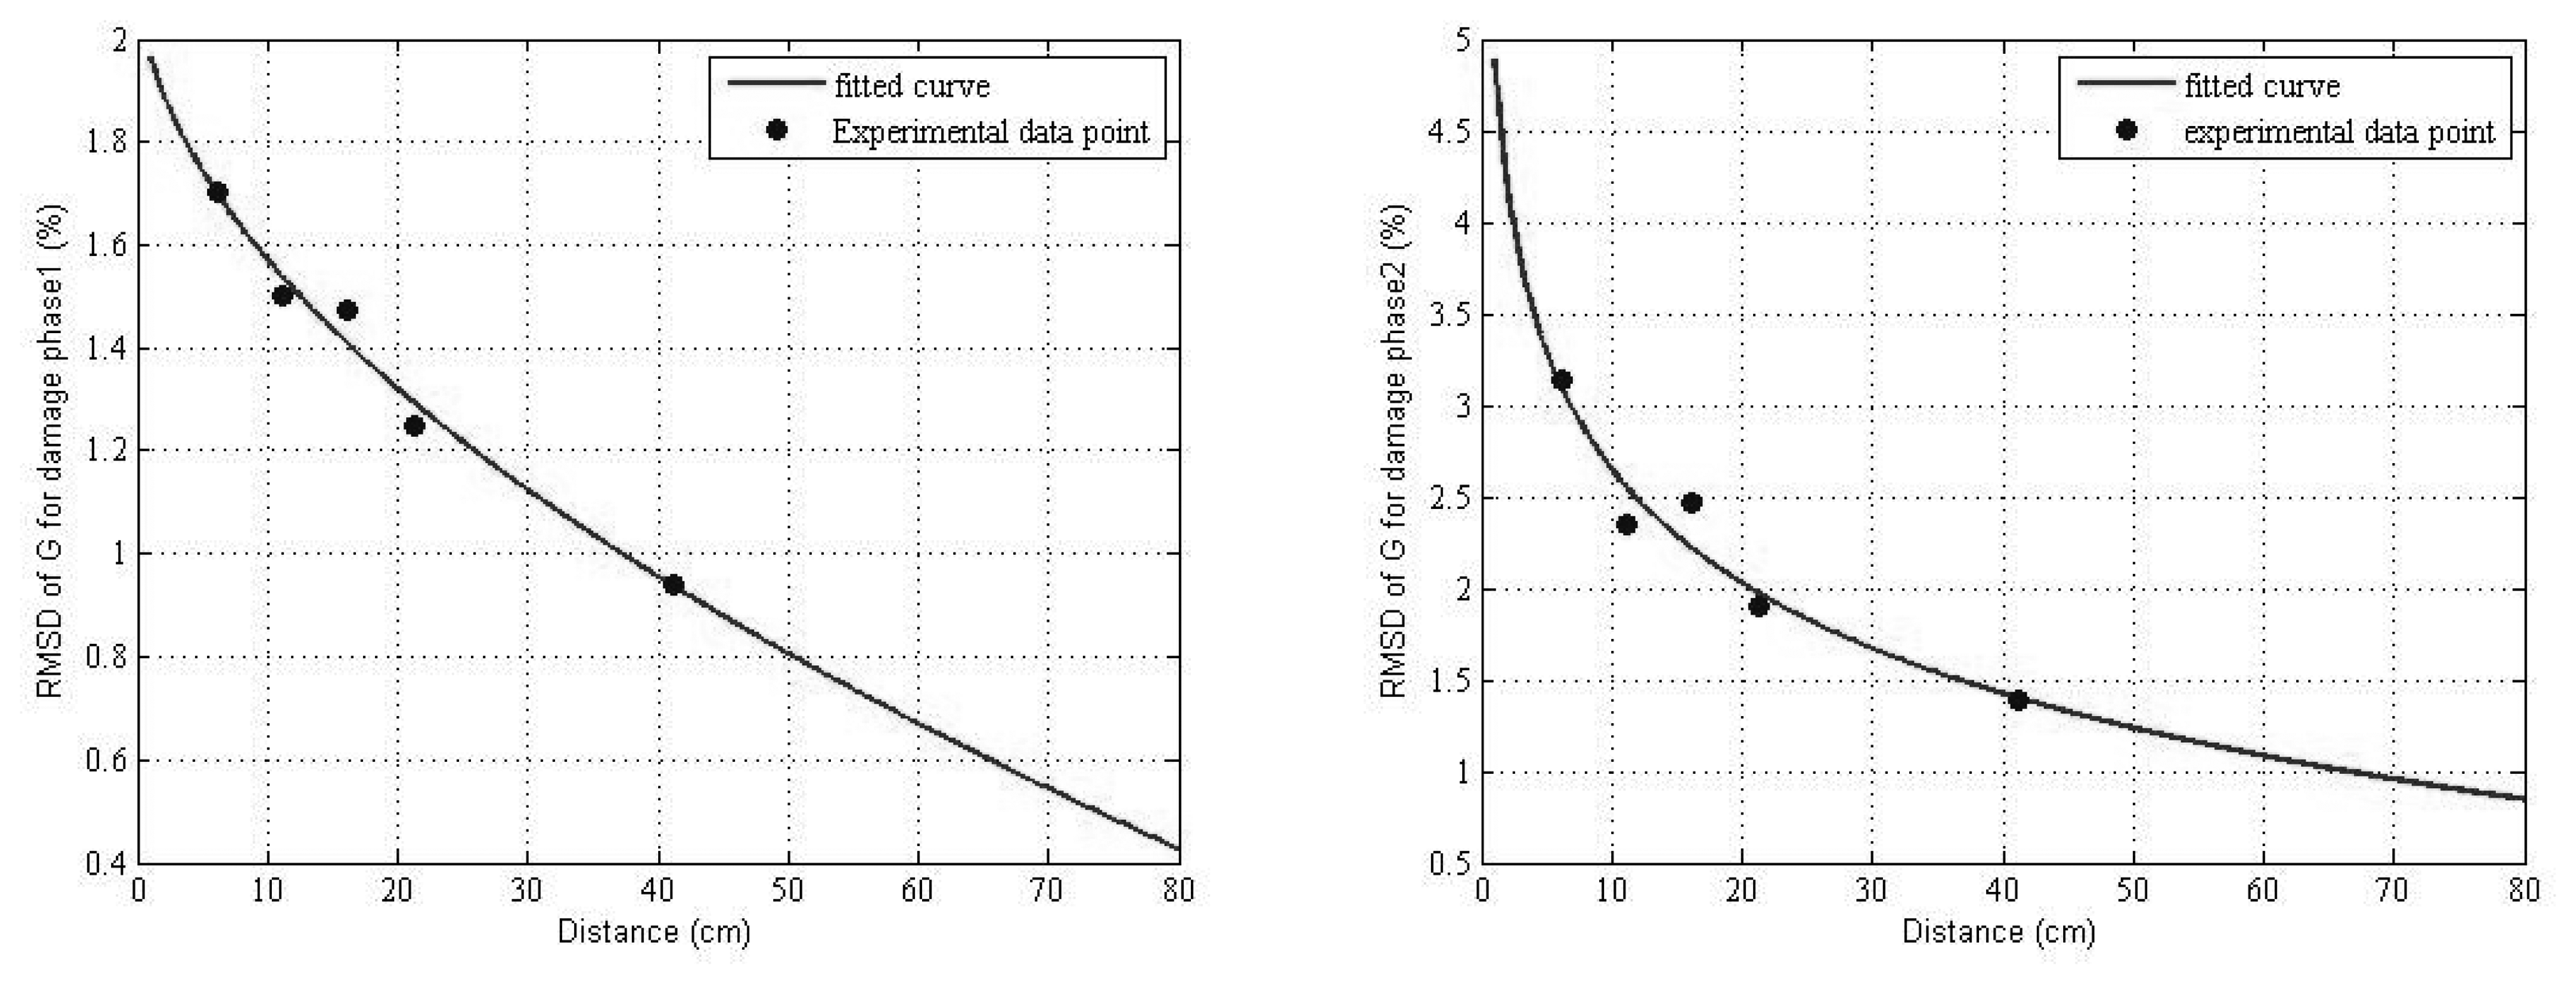
Figure 7 illustrates the RMSD damage indices calculated from the PZT admittance and the structural impedance, where G and B denote the real and imaginary parts of the PZT admittance, respectively; and x and y the real and imaginary parts of the driven point structural impedance, respectively. The damage indices in Figure 7 are calculated for all the five PZT sensors at two damage phases with respect to the baseline signature. The calculated damage index values are also listed in Table 4. It can be observed that the RMSD values of both G and x exhibit a decreasing trend as the distance of PZT from the main crack increases since patch 1 is the closest to the main crack and patch 5 the farthest. However, the damage indices for B and y do not show a uniformly decreasing trend. This indicates that damage indices calculated form the real part of PZT admittance (G) and the real part of structural impedance (x) are more effective for damage detection than those calculated from the imaginary parts (B and y). For further analysis, the RMSD values of G and x for each PZT sensor are plotted against the distance of the PZT sensor from the damage area in Figures 8 and 9, respectively.
These five PZT sensors were instrumented at the locations of 62 mm, 112 mm, 162 mm, 212 mm and 412 mm away from the main crack respectively, as shown and marked in Figure 4(c). Curve fitting has been conducted when plotting Figures 8 and 9. For each damage phase, the RMSD values for both G and x signatures present a decreasing trend as the distance increases. For both damage phases, the largest RMSD values for both G and x are observed on PZT patch 1 which is of the nearest distance to the main crack and the lowest values on PZT patch 5 which is of the farthest distance to the main crack. It reflects that as the distance of the PZT patch from damage increases, the sensitivity of the PZT patch to damage decreases. Further, from Figures 8 and 9, we can also observe that the RMSD values for damage phase 2 are all larger than the corresponding values for damage phase 1. Therefore, the more severe the damage, the more sensitive the PZT sensor is.
In the EMI technique, the PZT generated waves propagate through the structure. The waves will be reflected when meeting the discontinuities such as the structural damages. The reflected waves contain the information of the structural health situation and can be detected by the PZT sensors. Because of the effect of the material and structural damping, the waves attenuate when propagating through the structure. When the distance between the PZT sensor and the structural damage is too far, the PZT sensor may exhibit a very small damage index even if the damage is severe. This means that the PZT sensor loses its sensitivity to damage, in other words, PZT reaches its sensing limit. From the fitted curves in Figures 8 and 9, PZT's sensing region for structural health monitoring of concrete can be deduced. According to the engineering experience for the EMI technique, the minimum RMSD value which can be viewed as a reliable indicator of the existence of structural damage can be set as 1%. Utilizing this criterion, for incipient damage as the damage phase 1 in this study, the sensing region of G-based index method is about 38 cm and the sensing region of x-based index method is about 78 cm. For severe damage as the damage phase 2 in this study, the sensing region of G-based method is about 65 cm and the sensing region of x-based method is about 90 cm. Therefore, the x-based damage index provides higher sensitivity, thus larger sensing region for the PZT sensors. In conclusion, to fully utilize the potential of the PZT sensors for damage detection, the RMSD index based on the real part of the structural impedance is recommended.
6.2 Changes of structural parameters caused by damages
6.2.1 Application of GAs
All the EM admittance signatures captured by the five PZT sensors were used to derive the optimal values of the structural parameters of the MDOF model system. In this study, by means of trial and error the model of a parallel connection of a number of SDOF mass-spring-damper elements was used to successfully fit the signatures of structural impedance extracted from the measured PZT EM admittance. The main idea for the optimization problem in this study is to minimize the differences between the modeled structural impedances and the experimentally measured ones by searching the proper values for the structural parameters using the GAs.
The number of SDOF elements used to construct the structural impedance model is 32. Correspondingly, the total number of the unknown structural parameters in this model is 96, with the consequence as m1, k1, c1, m2, k2, c2,……m32, k32, c32. Each parameter is coded into 20-bit binary number and then the 96 parameters are translated into a chromosome of 1920 bits length. A GA with single-point crossover is employed with the probability of crossover of 0.8, probability of mutation of 0.01 and the population size of 50. As GA is essentially a stochastic search algorithm, all the results presented hereafter are obtained from the best of 10 GA runs.
The structural impedance is meant for the PZT driven point, therefore it varies at different locations where the PZT sensor are bonded. Figure 10 shows the theoretically modeled and experimentally measured signatures of the structural impedance at the location where PZT patch 4 was bonded for three structural health states, i.e., no damage, incipient damage, and severe damage. The signatures for the locations where the other four PZT sensors were attached are very similar to Figure 10 and thus not shown for conciseness. From Figure 10 we can observe that for the three structural health states, the theoretical and experimental results of the driven point structural impedance match very well. These results validate the proposed model for driven point structural impedance, which is composed of the series connection of 32 SDOF elements. It also validates the feasibility of GAs for acquiring the optimal solutions for structural parameters.
6.2.2 Convergence Performance
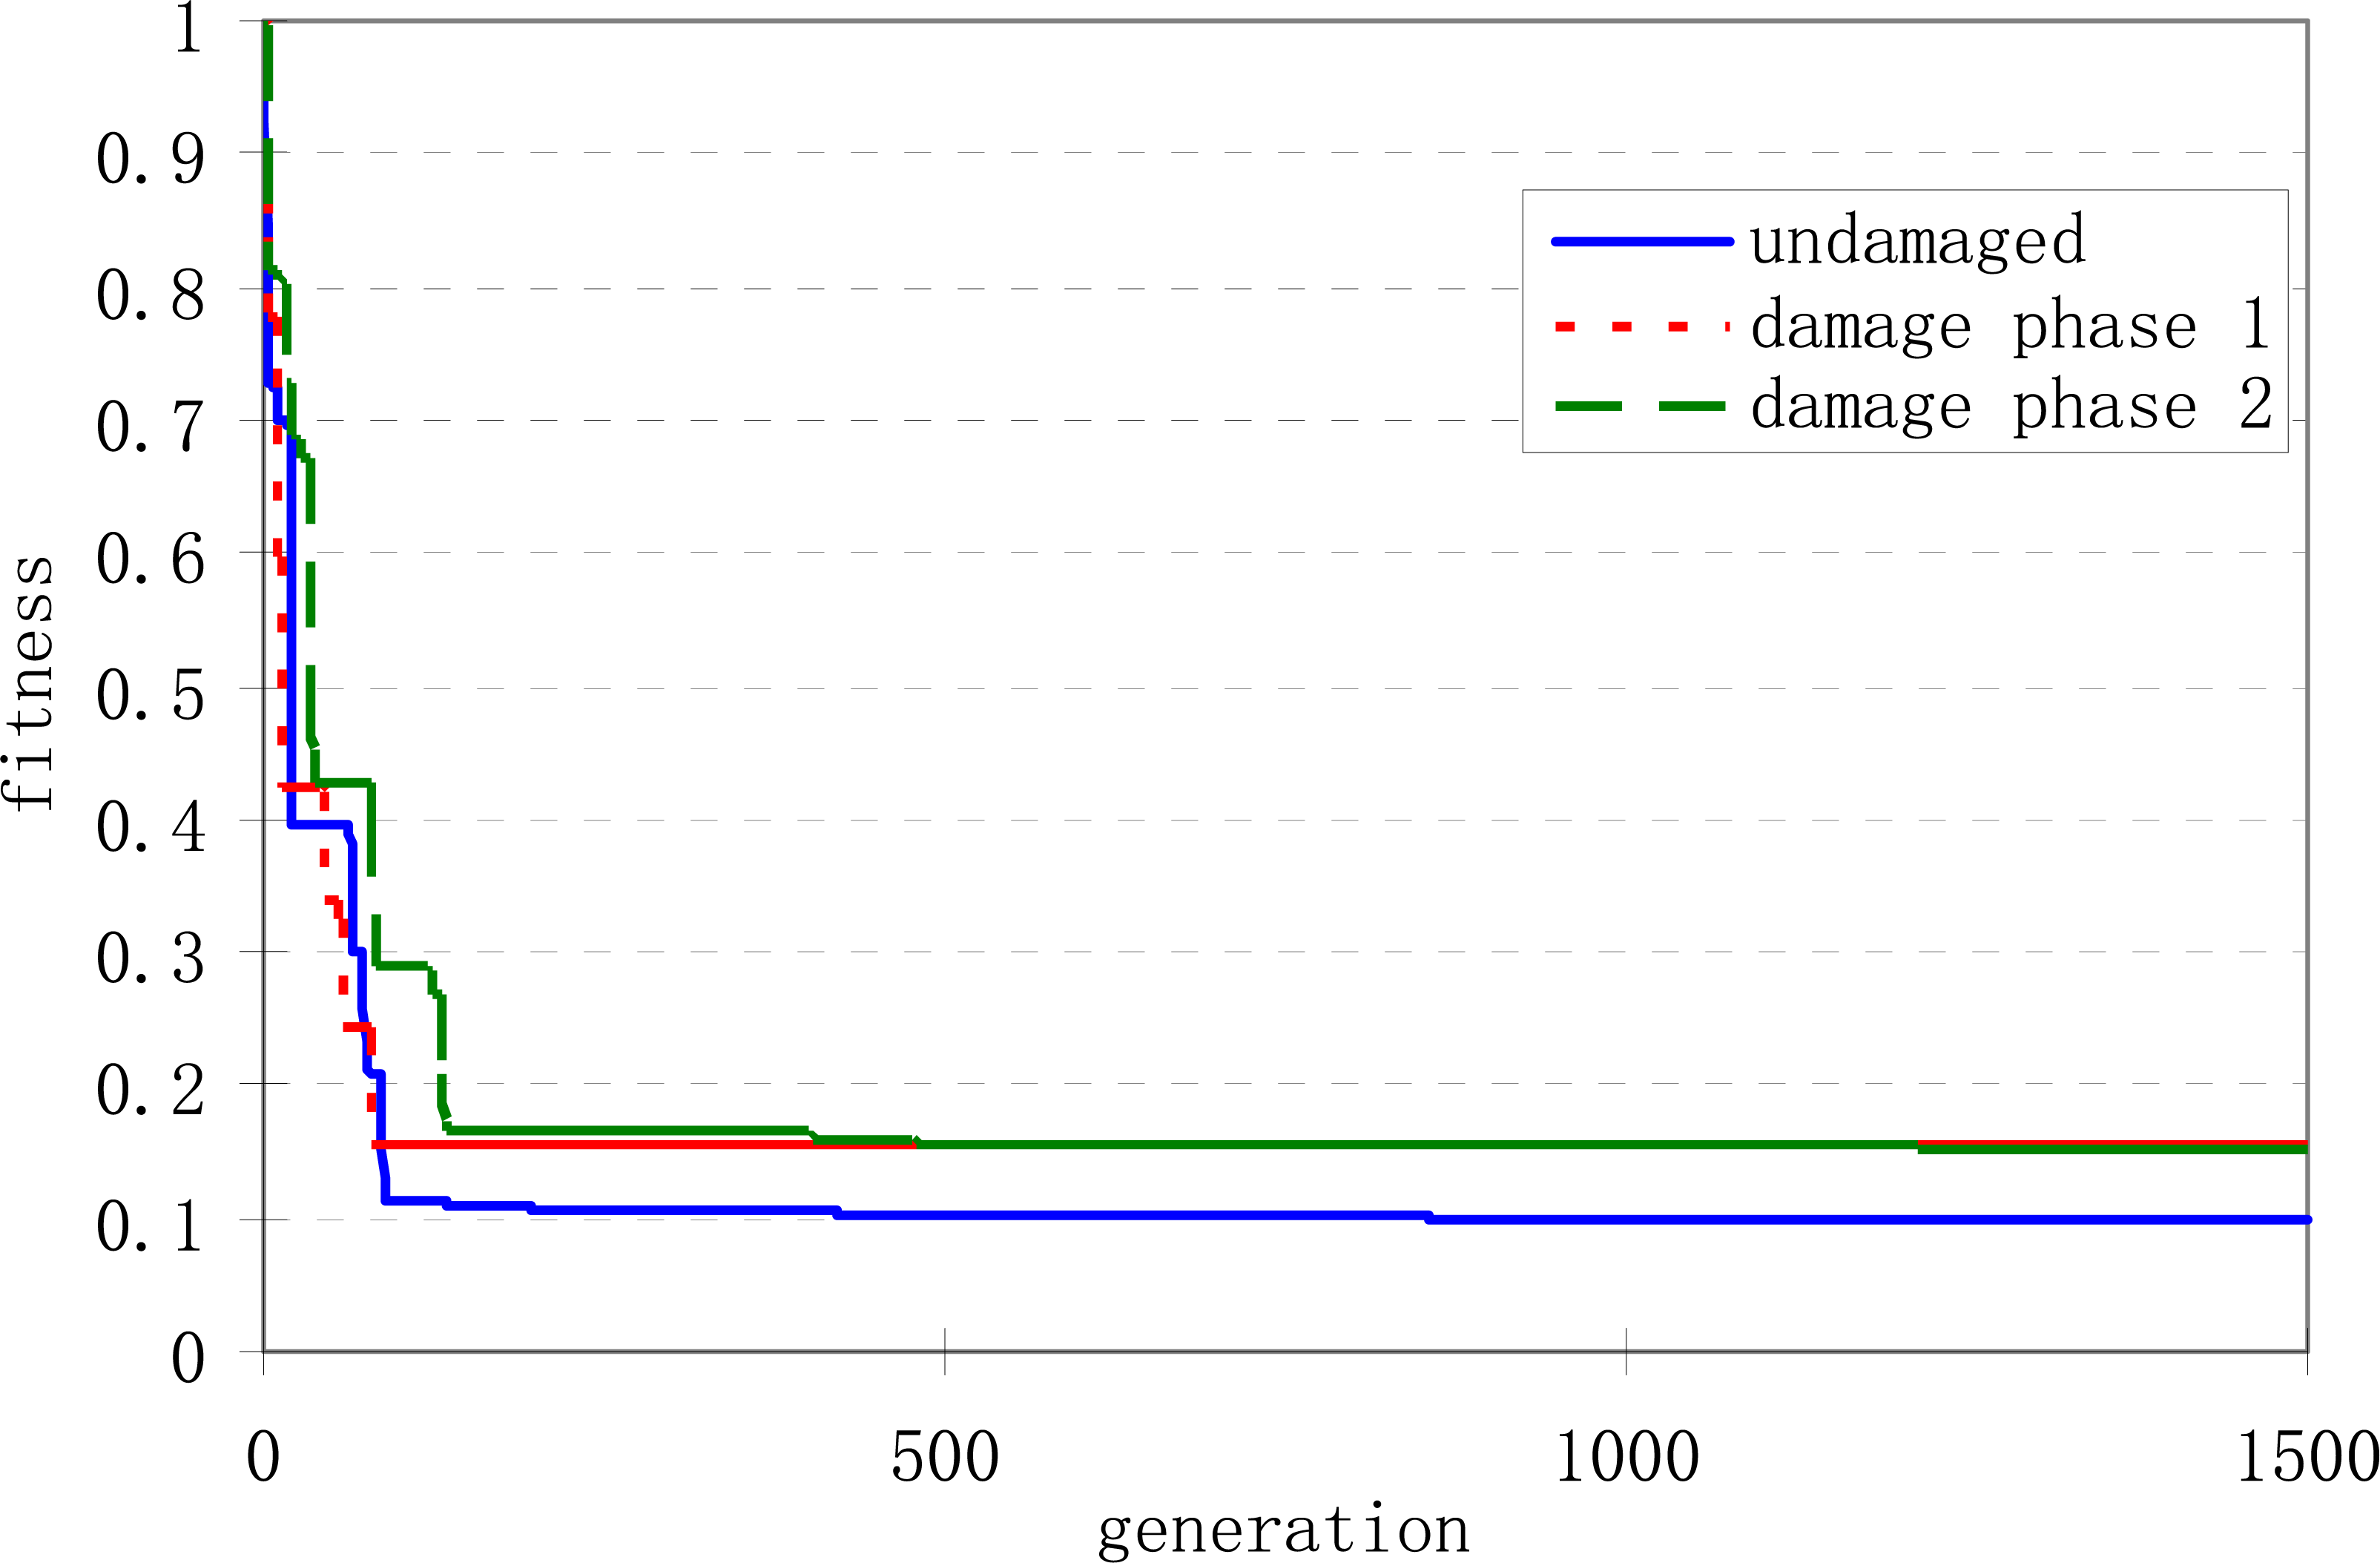
To evaluate the performance of the GAs for identification of structural parameters in the proposed structural impedance model, a study of the convergence of the fitness value should be performed. The convergence performances for the case of PZT patch 4 under three structural health states are shown in Figure 11. In general, the convergence is stable and at the final stage of searching, the convergence of performance slows down significantly, which is typical for the GAs. Therefore, for all these three cases, the performance of the GAs in searching the optimal values of the structural parameters is satisfactory.
6.2.3 Sensitivity to Damage Detection
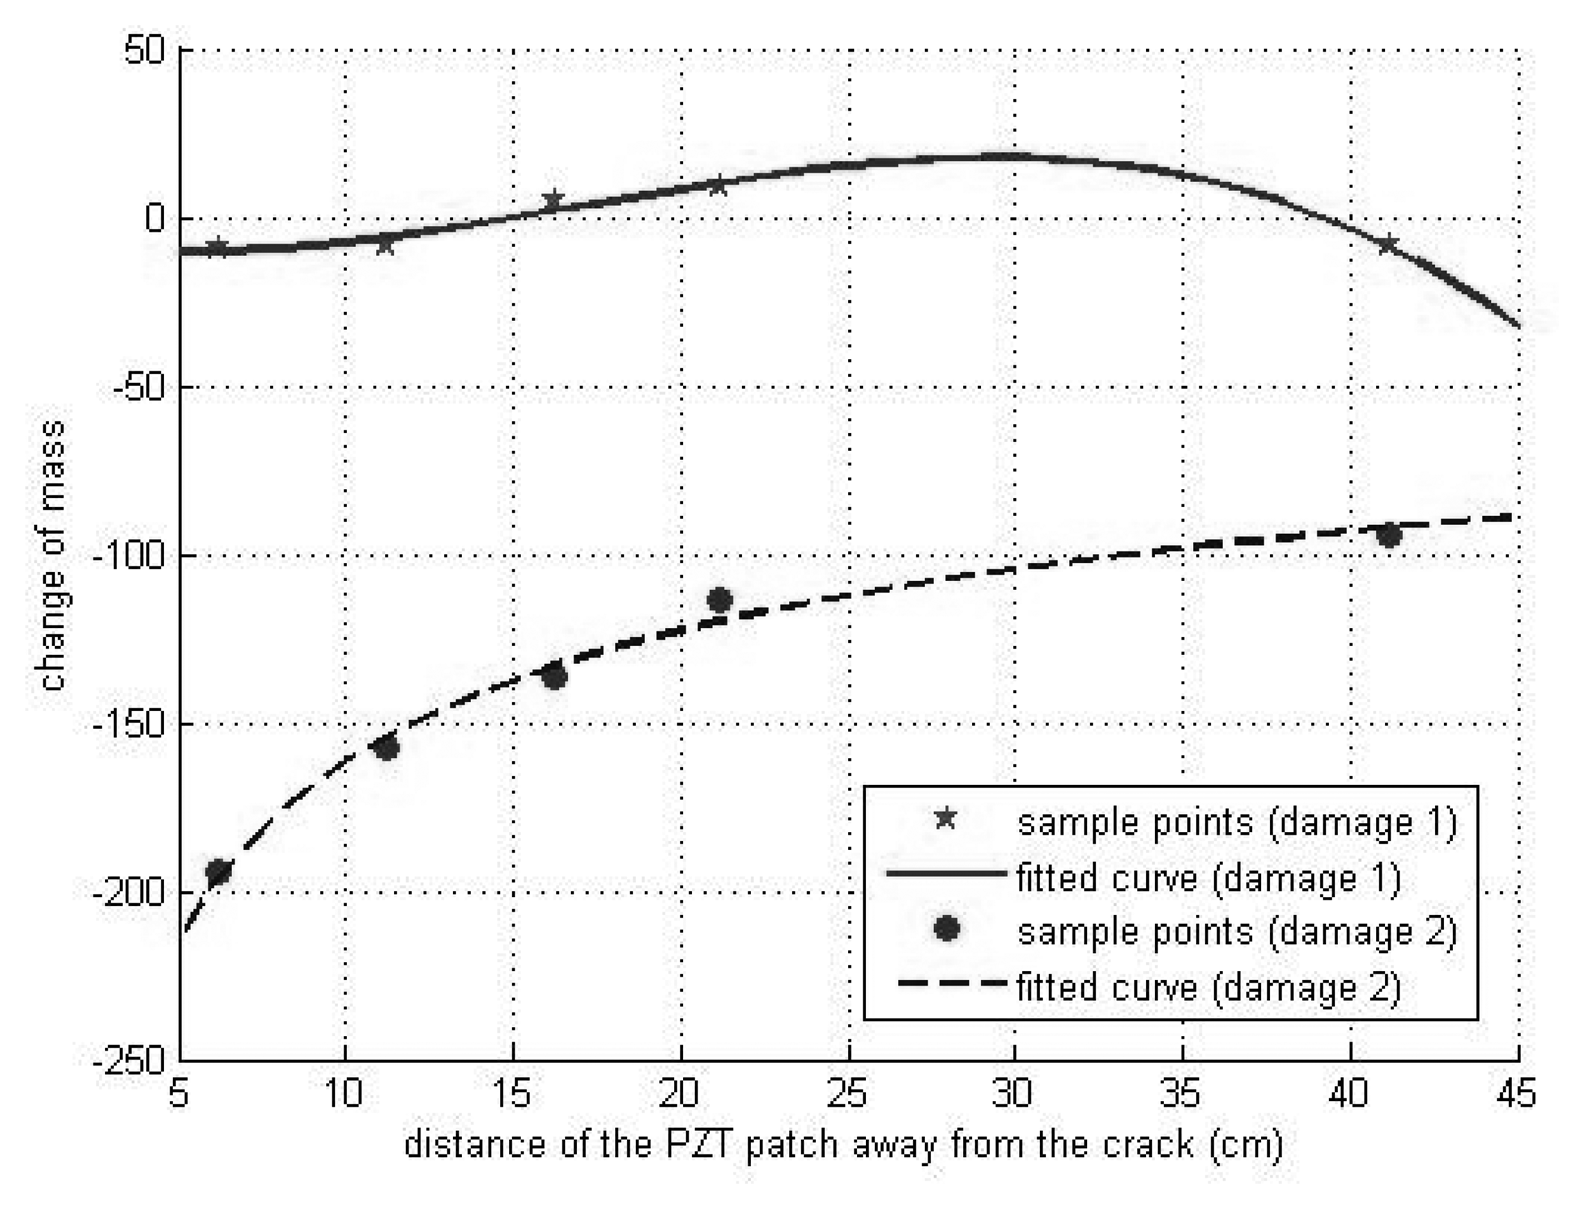
In order to relate the damage states to the quantitative changes of the structural properties, the optimal values of the structural parameters in the model are derived by the GAs, and the changes of each structural parameter are calculated as described in (16)-(18). Under the two structural damage states in this experiment, the changes of each structural parameter are calculated and illustrated in Figures 12, 13 and 14.
Figure 12 shows the changes of damping coefficient in the driven-point structural impedance model under two damage states. As all the values of the changes are positive, it can be concluded that the damping of the PZT driven points increases after the appearance of the structural damages. And at the same distance of PZT sensor from the damage, the absolute changes of damping are relatively larger for damage phase 2 than those for damage phase 1. It can be concluded that the more severe the damage, the more changes of the damping will be. From this figure, we can also observe that the larger the distance, the smaller the absolute value of the change is. This result indicates that the PZT sensor with larger distance from the damage is of lower sensitivity to the damage.
Figure 13 shows the changes of stiffness in the driven-point structural impedance model under the two damage states. As all the values of the changes are negative, it means that the stiffness of the driven points decreases after the appearance of the structural damages. And for the same distance of PZT sensor from the damage, the absolute changes of stiffness for damage phase 2 are mostly larger than those for damage phase 1. Similarly, it can be concluded that a severer damage will render more changes in stiffness, which is much easier to be detected by the PZT sensor. This figure again confirms that the PZT sensor with larger distance from the damage is less sensitive to the damage.
Figure 14 shows the changes of mass in the driven-point structural impedance model under the two damage states. For damage phase 1, the changes of mass exhibit no regularity, and vary around zero line. This indicates that the incipient damage has very limited effect on the mass. For damage phase 2, the changes are all negative, which shows that the severe damage leads to the reduction of the driven point mass. Since the absolute values of changes decrease as the distance of the PZT sensor from the damage increases, we can conclude again that the sensitivity of the PZT sensor to structural damage decreases as the distance increases.
It worth mentioning that the EMI technique is temperature sensitive [30] since the variation in temperature induces the shift of peaks in the admittance signature, especially at high frequency range. A convenient but robust empirical based compensation technique has been proposed by Park et al [31] to minimize the temperature effect on the admittance signature. The present experimental study was carried out at the room temperature. The variation in temperature is minor and its effect on admittance signature is ignored.
7. Conclusion
The RMSD indices based on the raw PZT admittance and the structural impedance which is extracted from the raw admittance signature have been evaluated for a concrete frame structure. Experimental results demonstrate the capability of the PZT sensors to detect incipient and severe damages in concrete. The damage indices based on the real parts of the structural impedance and the PZT admittance are more suitable for damage detection than those based on the imaginary parts. Moreover, the damage index based on the real part of the structural impedance is more sensitive to damage since it excludes PZT's contribution to the measured admittance signature. Using this index, the sensing region of the PZT sensor is determined to be 70-90 cm for the concrete material, while using the index based on the raw PZT admittance, the sensing region is only 40-60 cm.
A model of the PZT driven point structural impedance for quantitative detection of the influence of the damage on the structural properties using the GAs has also been presented. The structural parameters in the model are derived by minimizing an objective function based on the experimentally measured data of PZT EM admittance. Optimal values for each structural parameter derived before and after the appearance of structural damages are compared to analyze the changes of structural properties caused by the damage. A model of a series connection of 32 SDOF mass-spring-damper elements has been successfully used to fit the experimentally measured data. It is worth mentioning that the structural impedance model may be composed of the SDOF elements by different ways of connection, depending on the material of the structure and the excitation frequency. Using the GAs, the changes of the structural parameters caused by the structural damage in the model have been derived and analyzed. The results have demonstrated that the appearance of damage leads to increase in damping and decrease in stiffness and mass at the driven point, and that the model is more sensitive to the severe damage. It has also been concluded that the PZT sensor with larger distance from the damage is less sensitive to the damage. And this conclusion coincides with the previous studies of PZT sensing region based on the damage index techniques.
References and Notes
- Sun, F.; Chaudhry, Z.; Liang, C.; Rogers, C.A. Truss Structure Integrity Identification Using PZT Sensor-Actuator. Journal of Intelligent Material Systems and Structure 1995, 6, 134–139. [Google Scholar]
- Liang, C.; Sun, F.P.; Rogers, C.A. Coupled Electromechanical Analysis of Adaptive Material Systems-Determination of the Actuator Power Consumption and System Energy Transfer. Journal of Intelligent Material Systems and Structures 1994, 5, 12–20. [Google Scholar]
- Liang, C.; Sun, F.P.; Rogers, C.A. Electromechanical Impedance Modeling of Active Material Systems. Smart Materials and Structures 1996, 5, 171–186. [Google Scholar]
- Yang, Y.W.; Xu, J.F.; Soh, C.K. Generic Impedance-Based Model for Structure-Piezoceramic Interacting System. J of Aerospace Engineering 2005, 18, 93–101. [Google Scholar]
- Hu, Y.H.; Yang, Y.W. Wave Propagation Modeling of PZT Sensing Region for Structural Health Monitoring. Smart Materials and Structures 2007, 16, 706–716. [Google Scholar]
- Annamdas, V.G.M.; Yang, Y.W.; Soh, C.K. Influence of Loading on Electromechanical Admittance of Piezoceramic Sensors. Smart Materials and Structures 2007, 16, 1888–1897. [Google Scholar]
- Yang, Y.W.; Hu, Y.H. Electromechanical Impedance Modeling of PZT Sensors for Health Monitoring of Cylindrical Shell Structures. Smart Materials and Structures 2008, 17, 015005. [Google Scholar]
- Ayres, J.W.; Lalande, F.; Chaudhry, Z.; Rogers, C.A. Qualitative Impedance-Based Health Monitoring of Civil Infrastructures. Smart Materials and Structures 1998, 7, 599–605. [Google Scholar]
- Park, G.; Cudney, H.; Inman, D.J. Impedance-Based Health Monitoring of Civil Structural Components. Journal of Infrastructure Systems 2000, 6, 153–160. [Google Scholar]
- Park, G.; Cudney, H.; Inman, D.J. An Integrated Health Monitoring Technique Using Structural Impedance Sensors. Journal of Intelligent Material Systems and Structures 2000, 11, 448–455. [Google Scholar]
- Giurgiutiu, V.; Zagrai, A.N.; Bao, J.J. Piezoelectric Wafer Embedded Active Sensors for Aging Aircraft Structural Health Monitoring. Structural Health Monitoring 2002, 1, 41–61. [Google Scholar]
- Xu, J.F.; Yang, Y.W.; Soh, C.K. Electromechanical Impedance-Based Structural Health Monitoring with Evolutionary Programming. Journal of Aerospace Engineering 2004, 17, 182–193. [Google Scholar]
- Yang, Y.W.; Bhalla, S.; Wang, C.; Soh, C.K.; Zhao, J. Monitoring of Rocks Using Smart Sensors. Tunnelling and Underground Space Technology 2007, 22, 206–221. [Google Scholar]
- Yang, Y.W.; Annamdas, V.G.M.; Wang, C.; Zhou, Y.X. Application of multiplexed FBG and PZT impedance sensors for health monitoring of rocks. Sensors 2008, 8, 271–289. [Google Scholar]
- Giurgiutiu, V.; Rogers, C.A. Recent Advancement in the Electromechanical Impedance Method for Structural Health Monitoring and NDE. Proceedings of SPIE 1998, 3329, 536–547. [Google Scholar]
- Tseng, K.K.H.; Naidu, A.S.K. Non-Parametric Damage Detection and Characterization Using Piezoceramic Material. Smart Materials and Structures 2001, 11, 317–329. [Google Scholar]
- Hu, Y.H.; Yang, Y.W. Sensing Region of PZT Transducers Bonded to Concrete. Proceedings of SPIE 2007, 6529. art no. 652907. [Google Scholar]
- Kreyszig, E. Advanced Engineering Mathematics, 8th Ed. ed; Wiley: New York, 1999. [Google Scholar]
- Holland, J. Adaptation in Natural and Artificial Systems; The University of Michigan Press: Ann Arbor, MI, 1975. [Google Scholar]
- Goldberg, D. Genetic Algorithms in Search, Optimization and Machine Learning; Addison-Wesley: New York, 1989. [Google Scholar]
- Grefenstette, J. Genetic Algorithm for Machine Learning; Kluwer Academic: Norwell, MA, 1994. [Google Scholar]
- Soh, C.K.; Yang, Y.W. Genetic Programming Based Approach for Structural Optimization. Journal of Computing in Civil Engineering 2000, 14, 31–37. [Google Scholar]
- Yang, Y.W.; Soh, C.K. Fuzzy Logic Integrated Genetic Programming for Structural Optimization and Design. Journal of Computing in Civil Engineering 2000, 14, 249–254. [Google Scholar]
- Krishnamoorthy, C.S.; Venkatesh, P.P.; Sudarshan, R. Object-Oriented Framework for Genetic Algorithms with Application to Space Truss Optimization. Journal of Computing in Civil Engineering 2002, 16, 66–75. [Google Scholar]
- Fairbairn, E.M.R.; Silvoso, M.M.; Filho, R.D.T.; Alves, J.L.D.; Ebecken, N.F.F. Optimization of Mass Concrete Construction Using Genetic Algorithm. Computers & Structures 2004, 82, 281–299. [Google Scholar]
- Jin, Z.L.; Yang, Y.W.; Soh, C.K. Application of Fuzzy GA for Optimal Vibration Control of Smart Cylindrical Shells. Smart Materials and Structures 2005, 14, 1250–1264. [Google Scholar]
- Yang, Y.W.; Jin, Z.L.; Soh, C.K. Integrated Optimal Design of Vibration Control System for Smart Beams Using Genetic Algorithms. Journal of Sound and Vibration 2005, 282, 1293–1307. [Google Scholar]
- Yang, Y.W.; Jin, Z.L.; Soh, C.K. Integrated Optimization of Control Systems for Smart Cylindrical Shells Using a Modified GA. Journal of Aerospace Engineering 2006, 19, 68–79. [Google Scholar]
- Park, S.; Ahmad, S.; Yun, C.-B.; Roh, Y. Multiple Crack Detection of Concrete Structures Using Impedance-Based Structural Health Monitoring Techniques. Experimental Mechanics 2006, 46, 609–618. [Google Scholar]
- Koo, K.Y.; Park, S.; Lee, J.-J.; Yun, C.-B.; Inman, D.J. Impedance-Based Structural Health Monitoring Considering Temperature Effects. Proceedings of SPIE 2007, 6532, 65320C. [Google Scholar]
- Park, G.; Kabeya, K.; Cudney, H.H.; Inman, D.J. Impedance-Based Structural Health Monitoring for Temperature Varying Applications. JSME International Journal 1999, 42, 249–258. [Google Scholar]
Figure 1.
A SDOF system under dynamic excitation
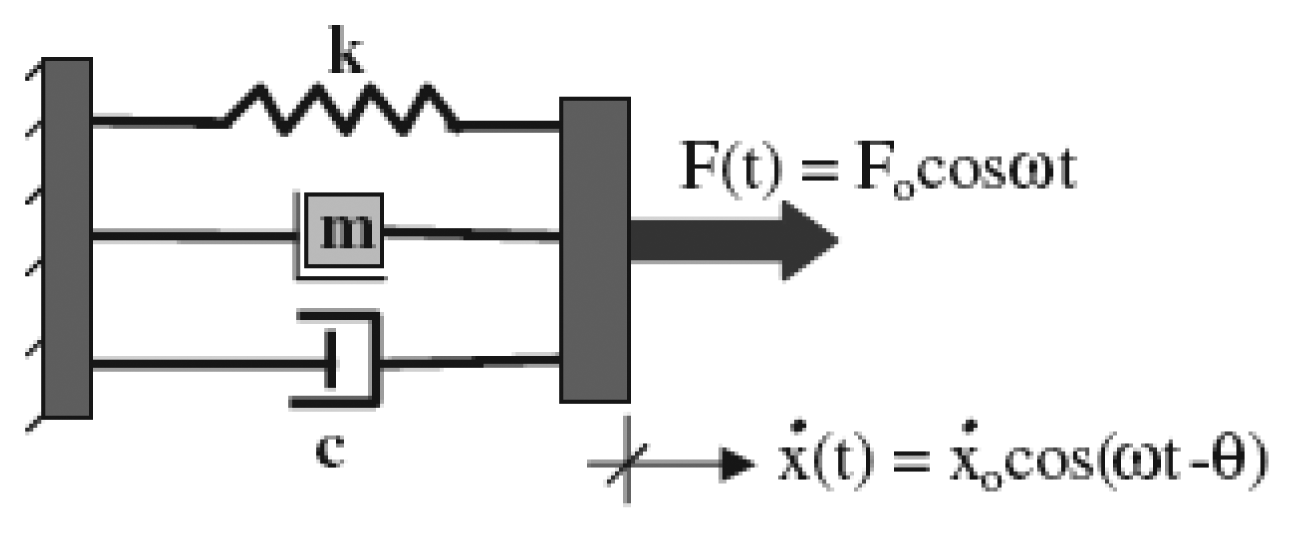
Figure 2.
Dimensions of concrete frame (Unit: mm)

Figure 3.
Configuration of equipments and test structure.

Figure 4.
Situation of the column before and after damage (unit mm).

Figure 5.
Admittance signatures of PZT patch 4.
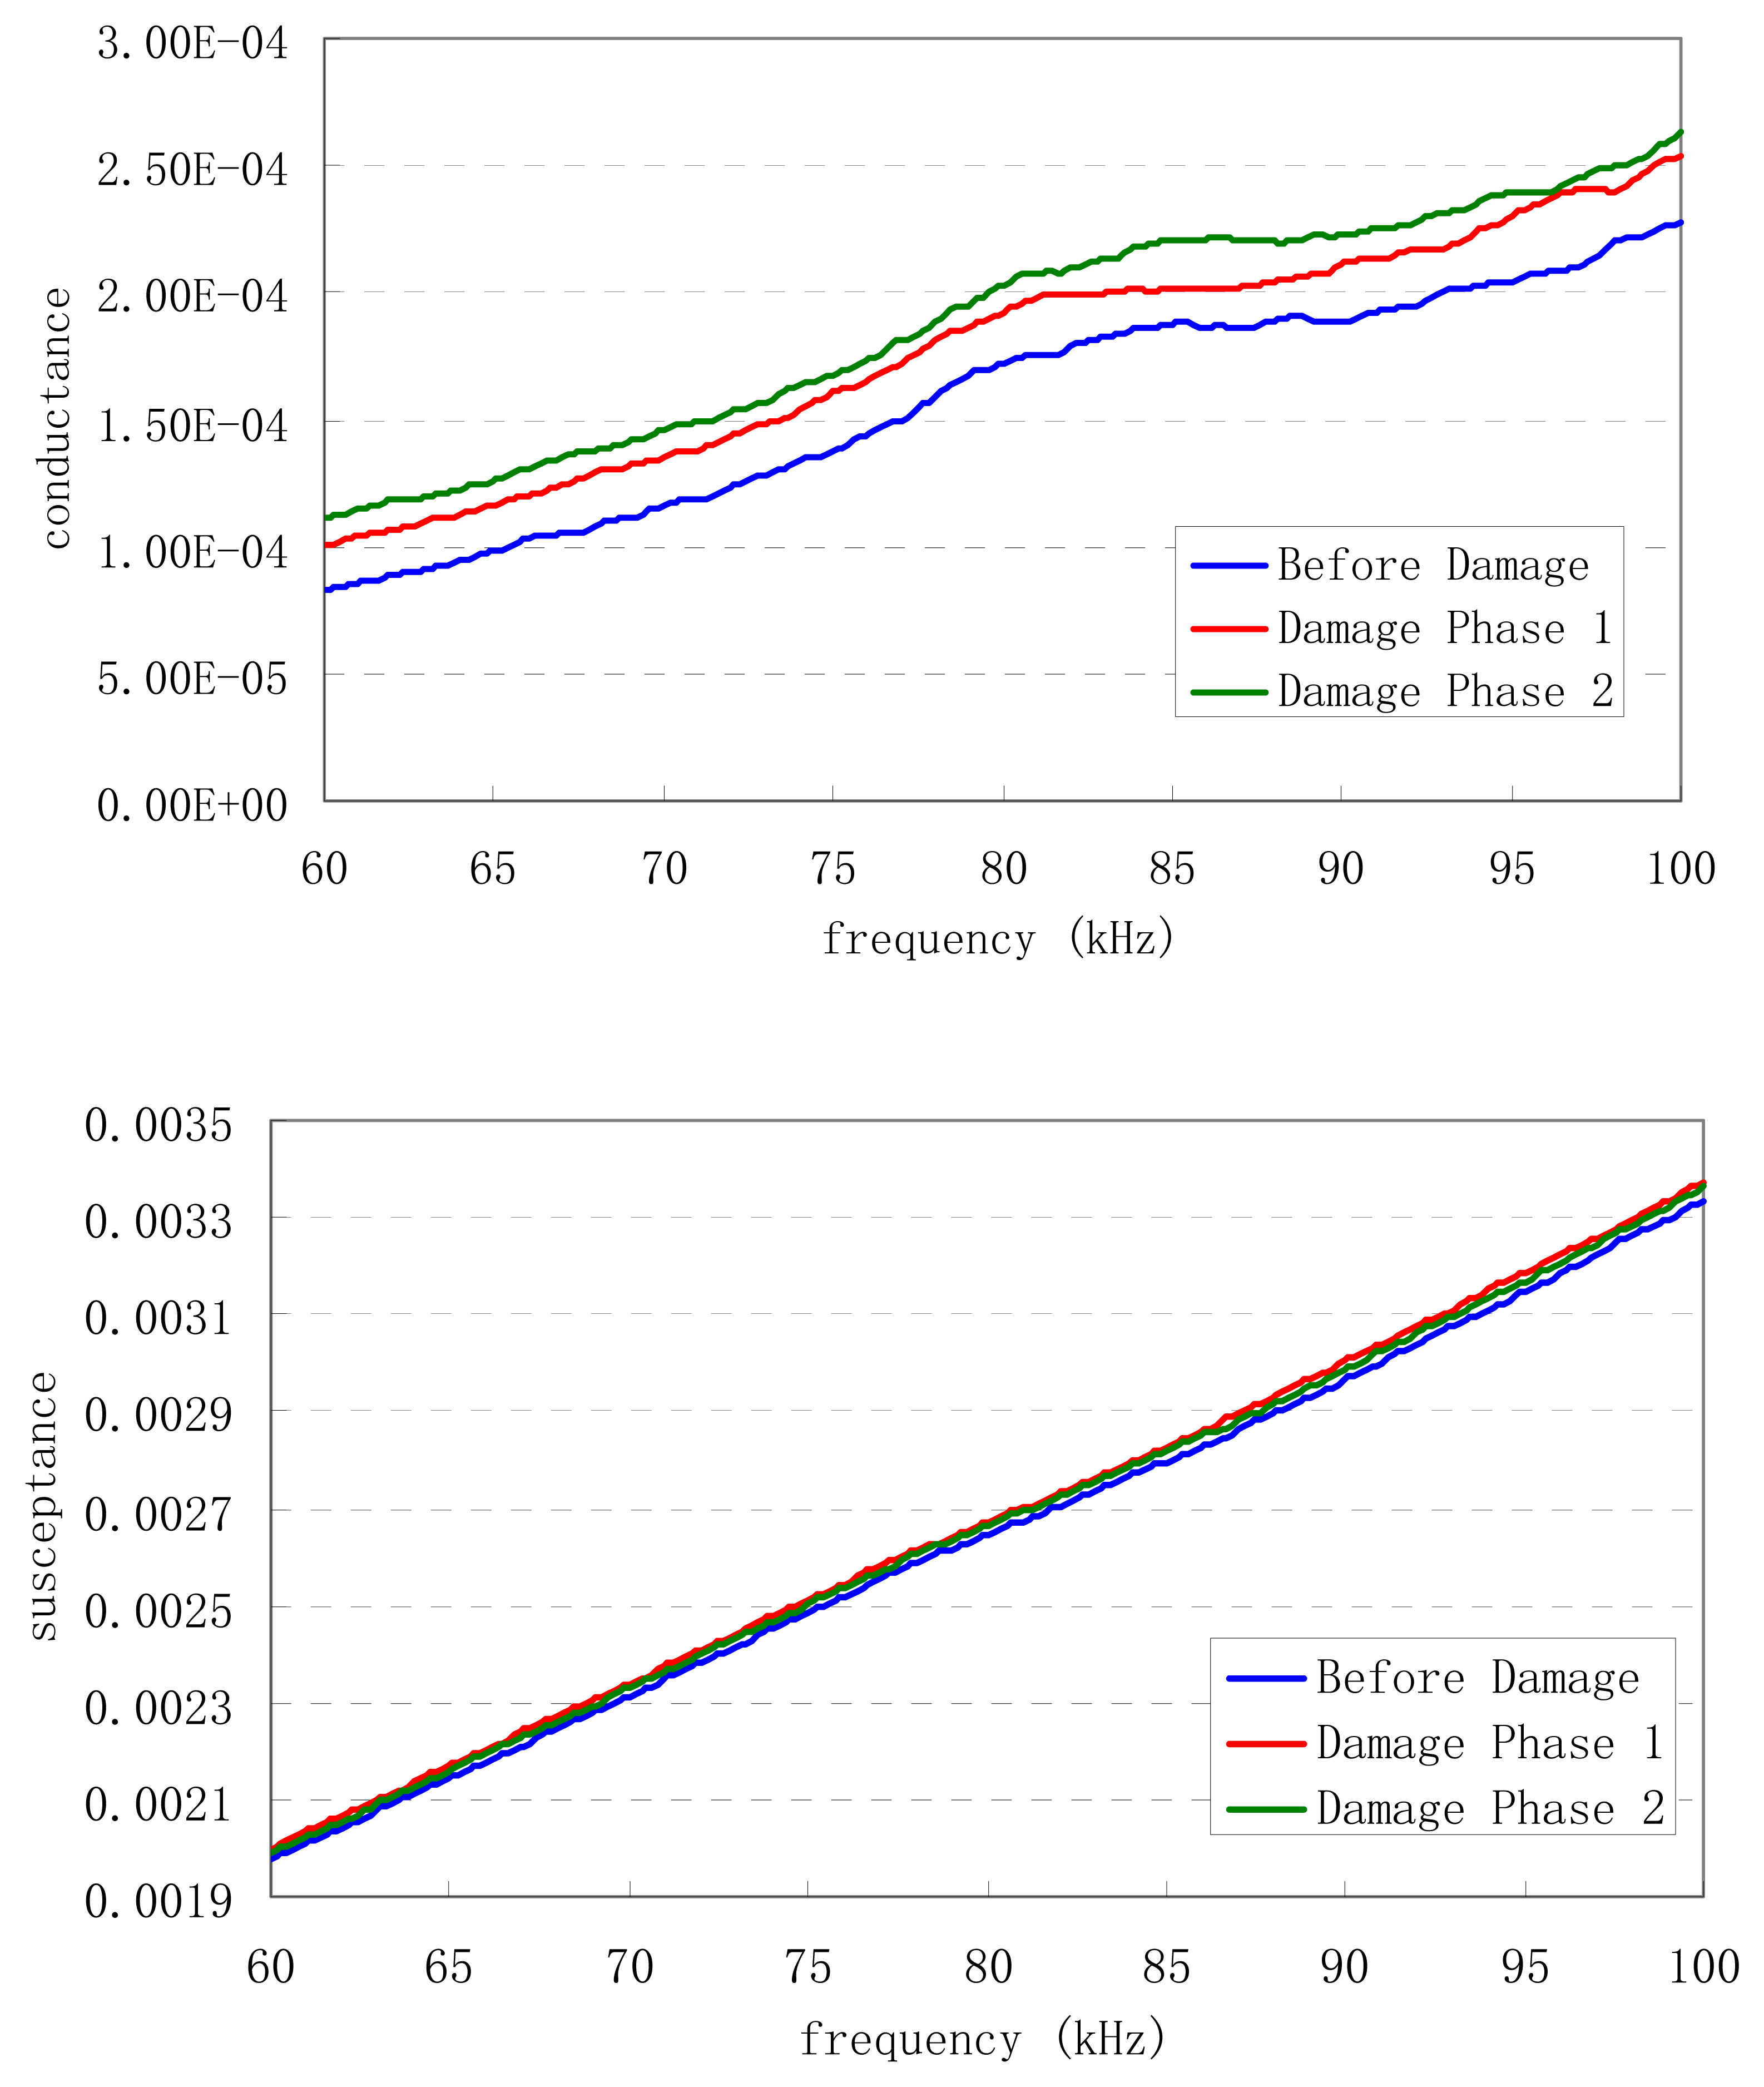
Figure 6.
SMI signatures extracted from EM admittance signatures detected by PZT patch 4.

Figure 7.
Damage indices for all PZT patches.
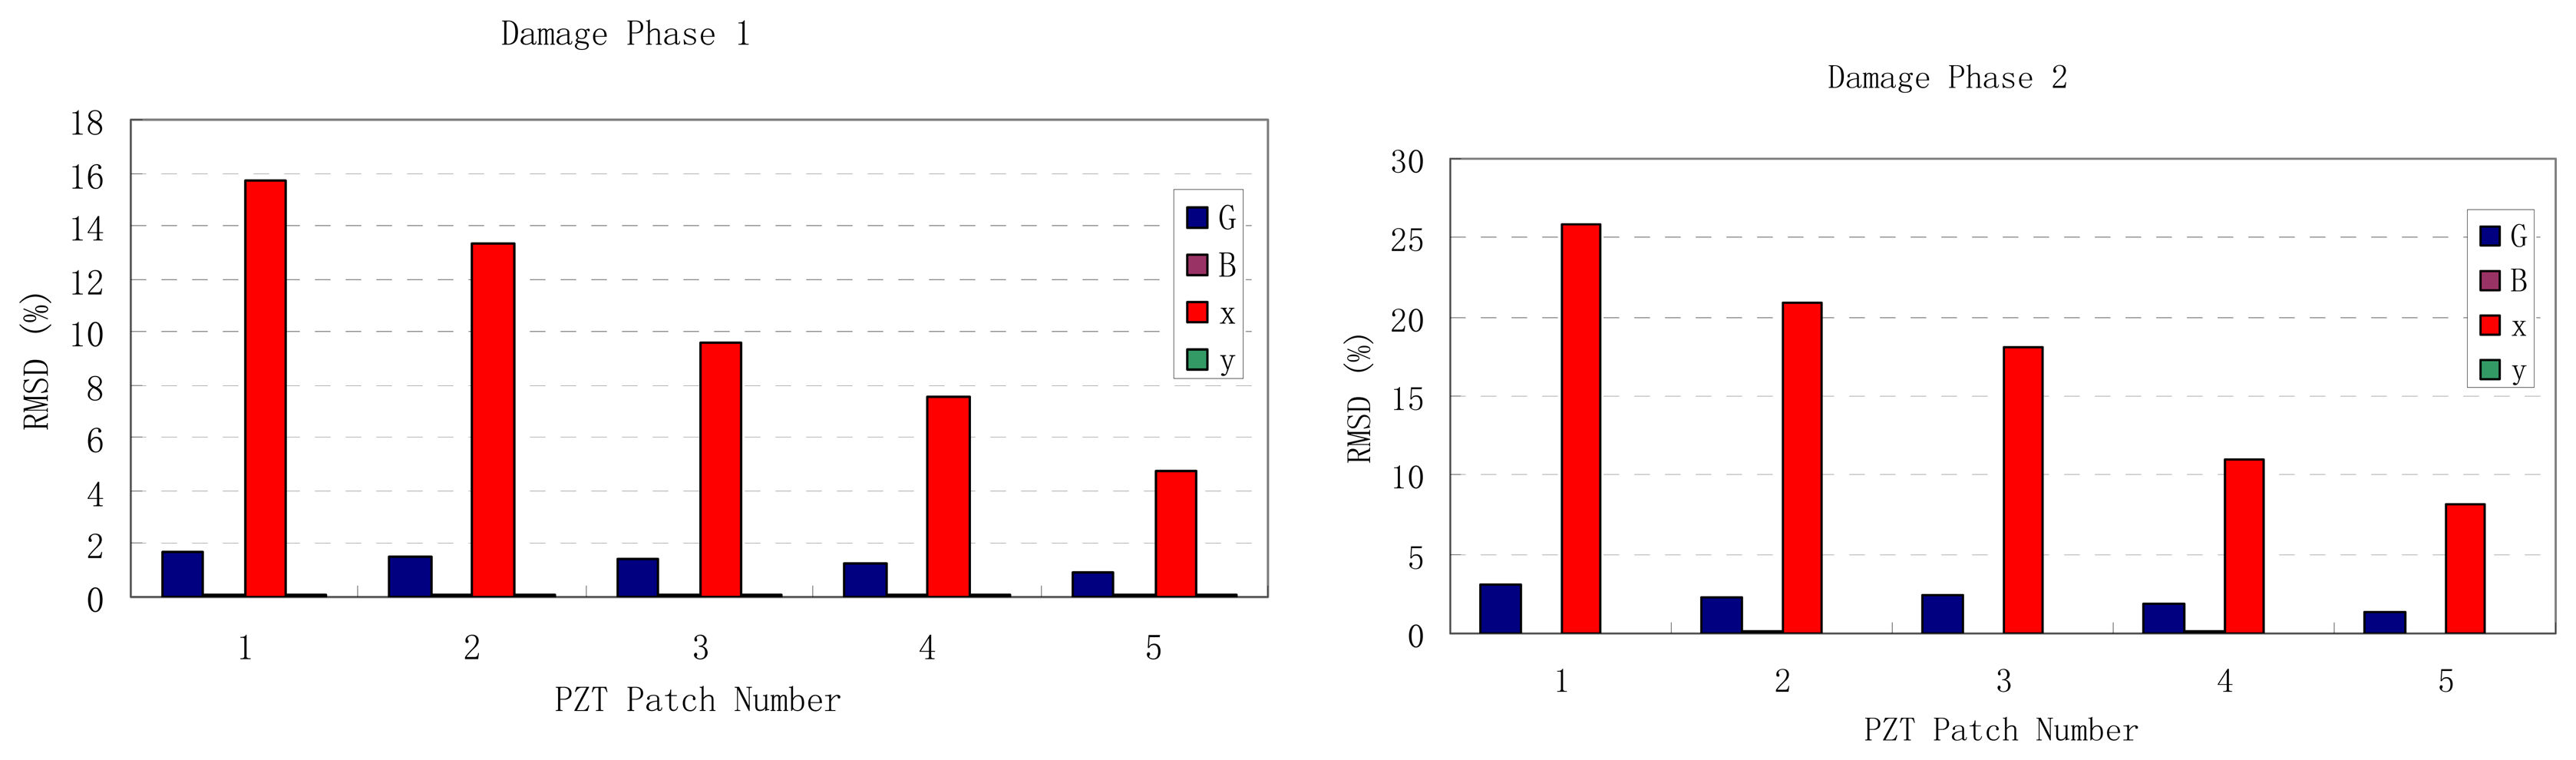
Figure 8.
RMSD values of G for two damage phases vs distance of PZT from crack.

Figure 9.
RMSD values of x for two damage phases vs distance of PZT from crack.
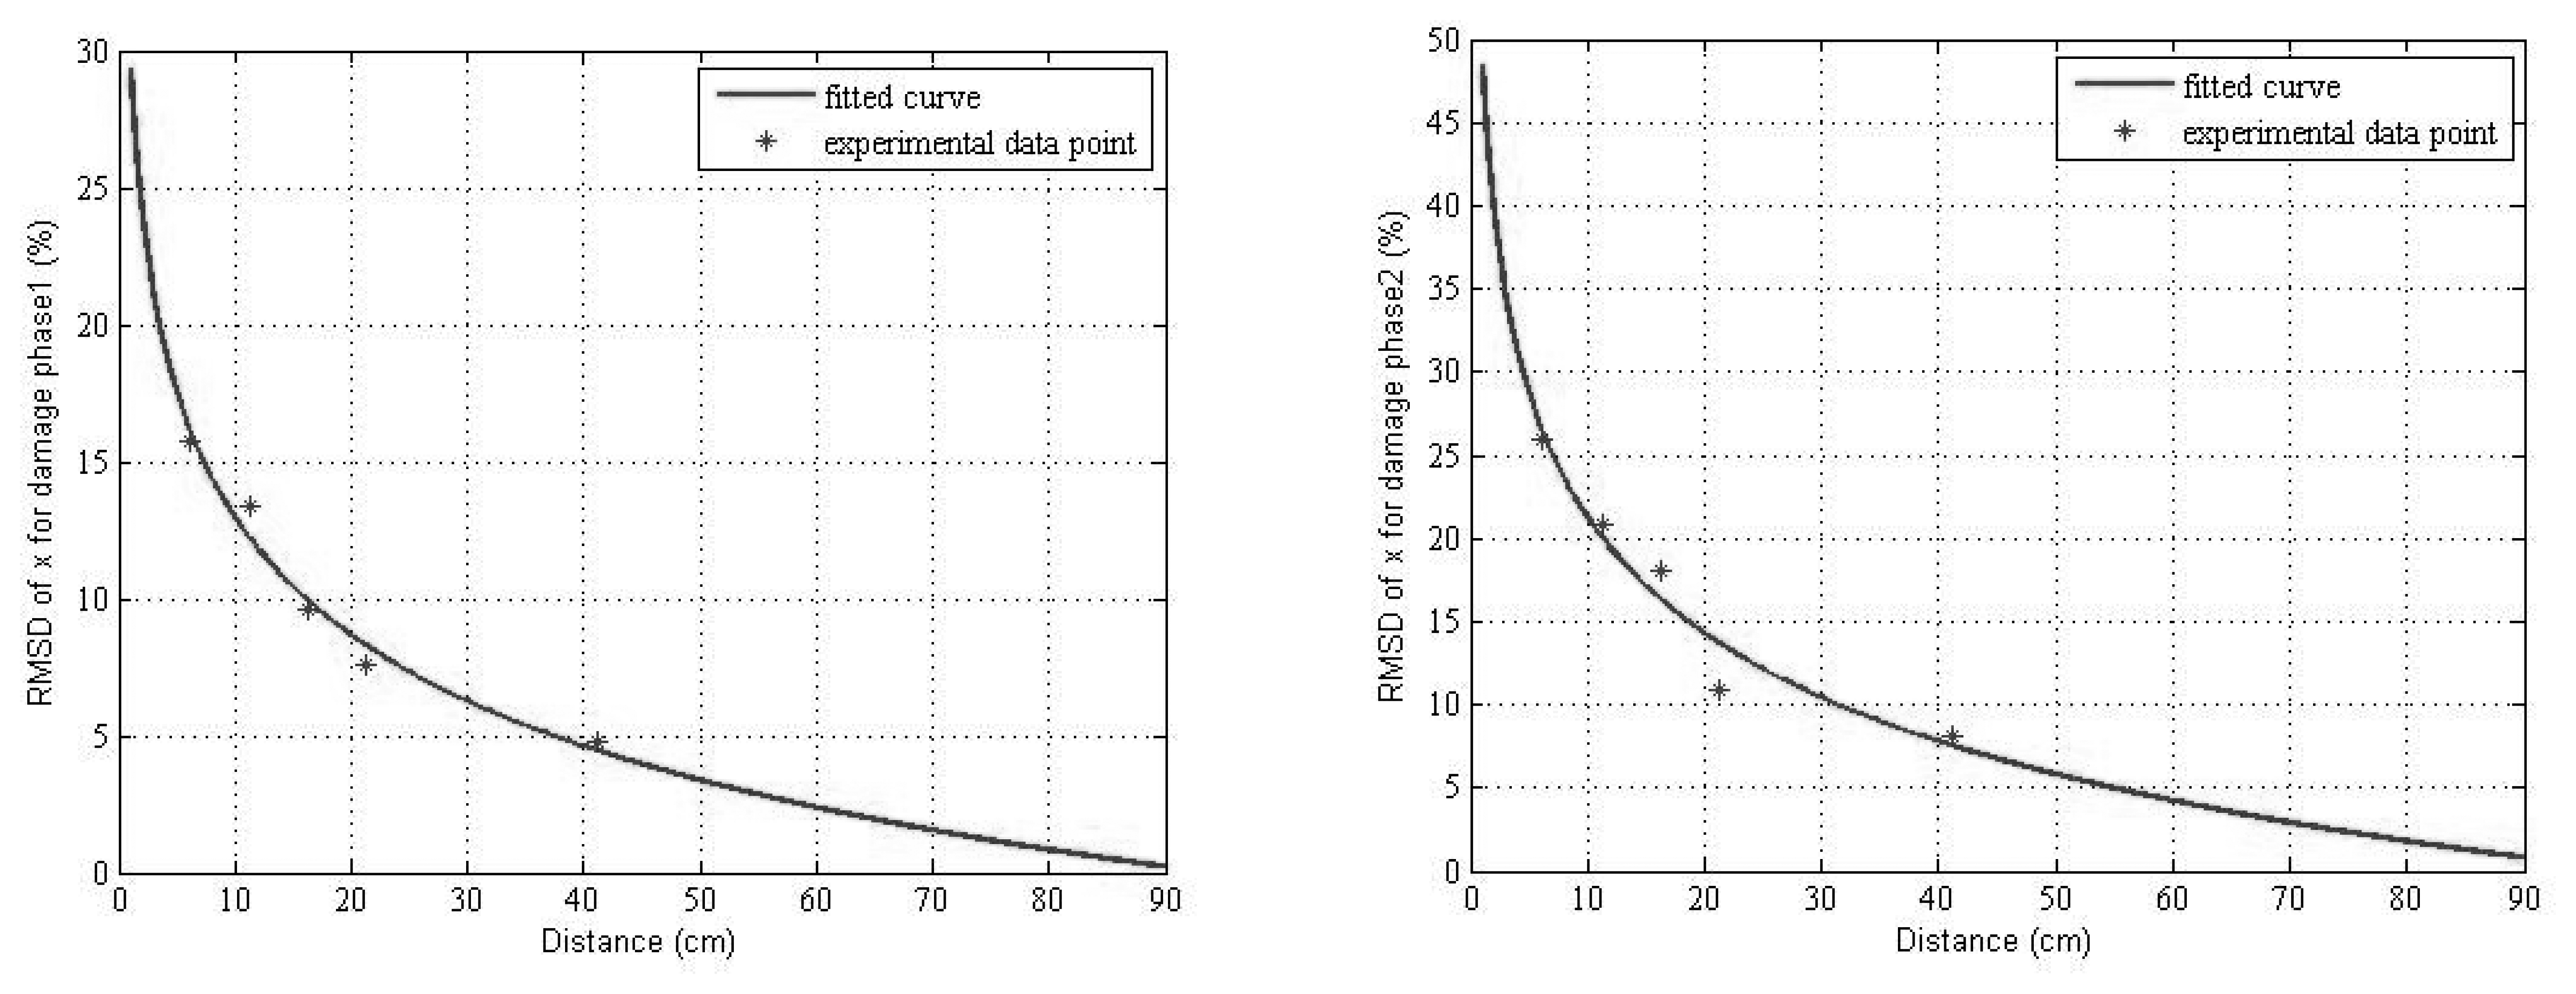
Figure 10.
Theoretical and experimental results of real part of SMI for three damage states.
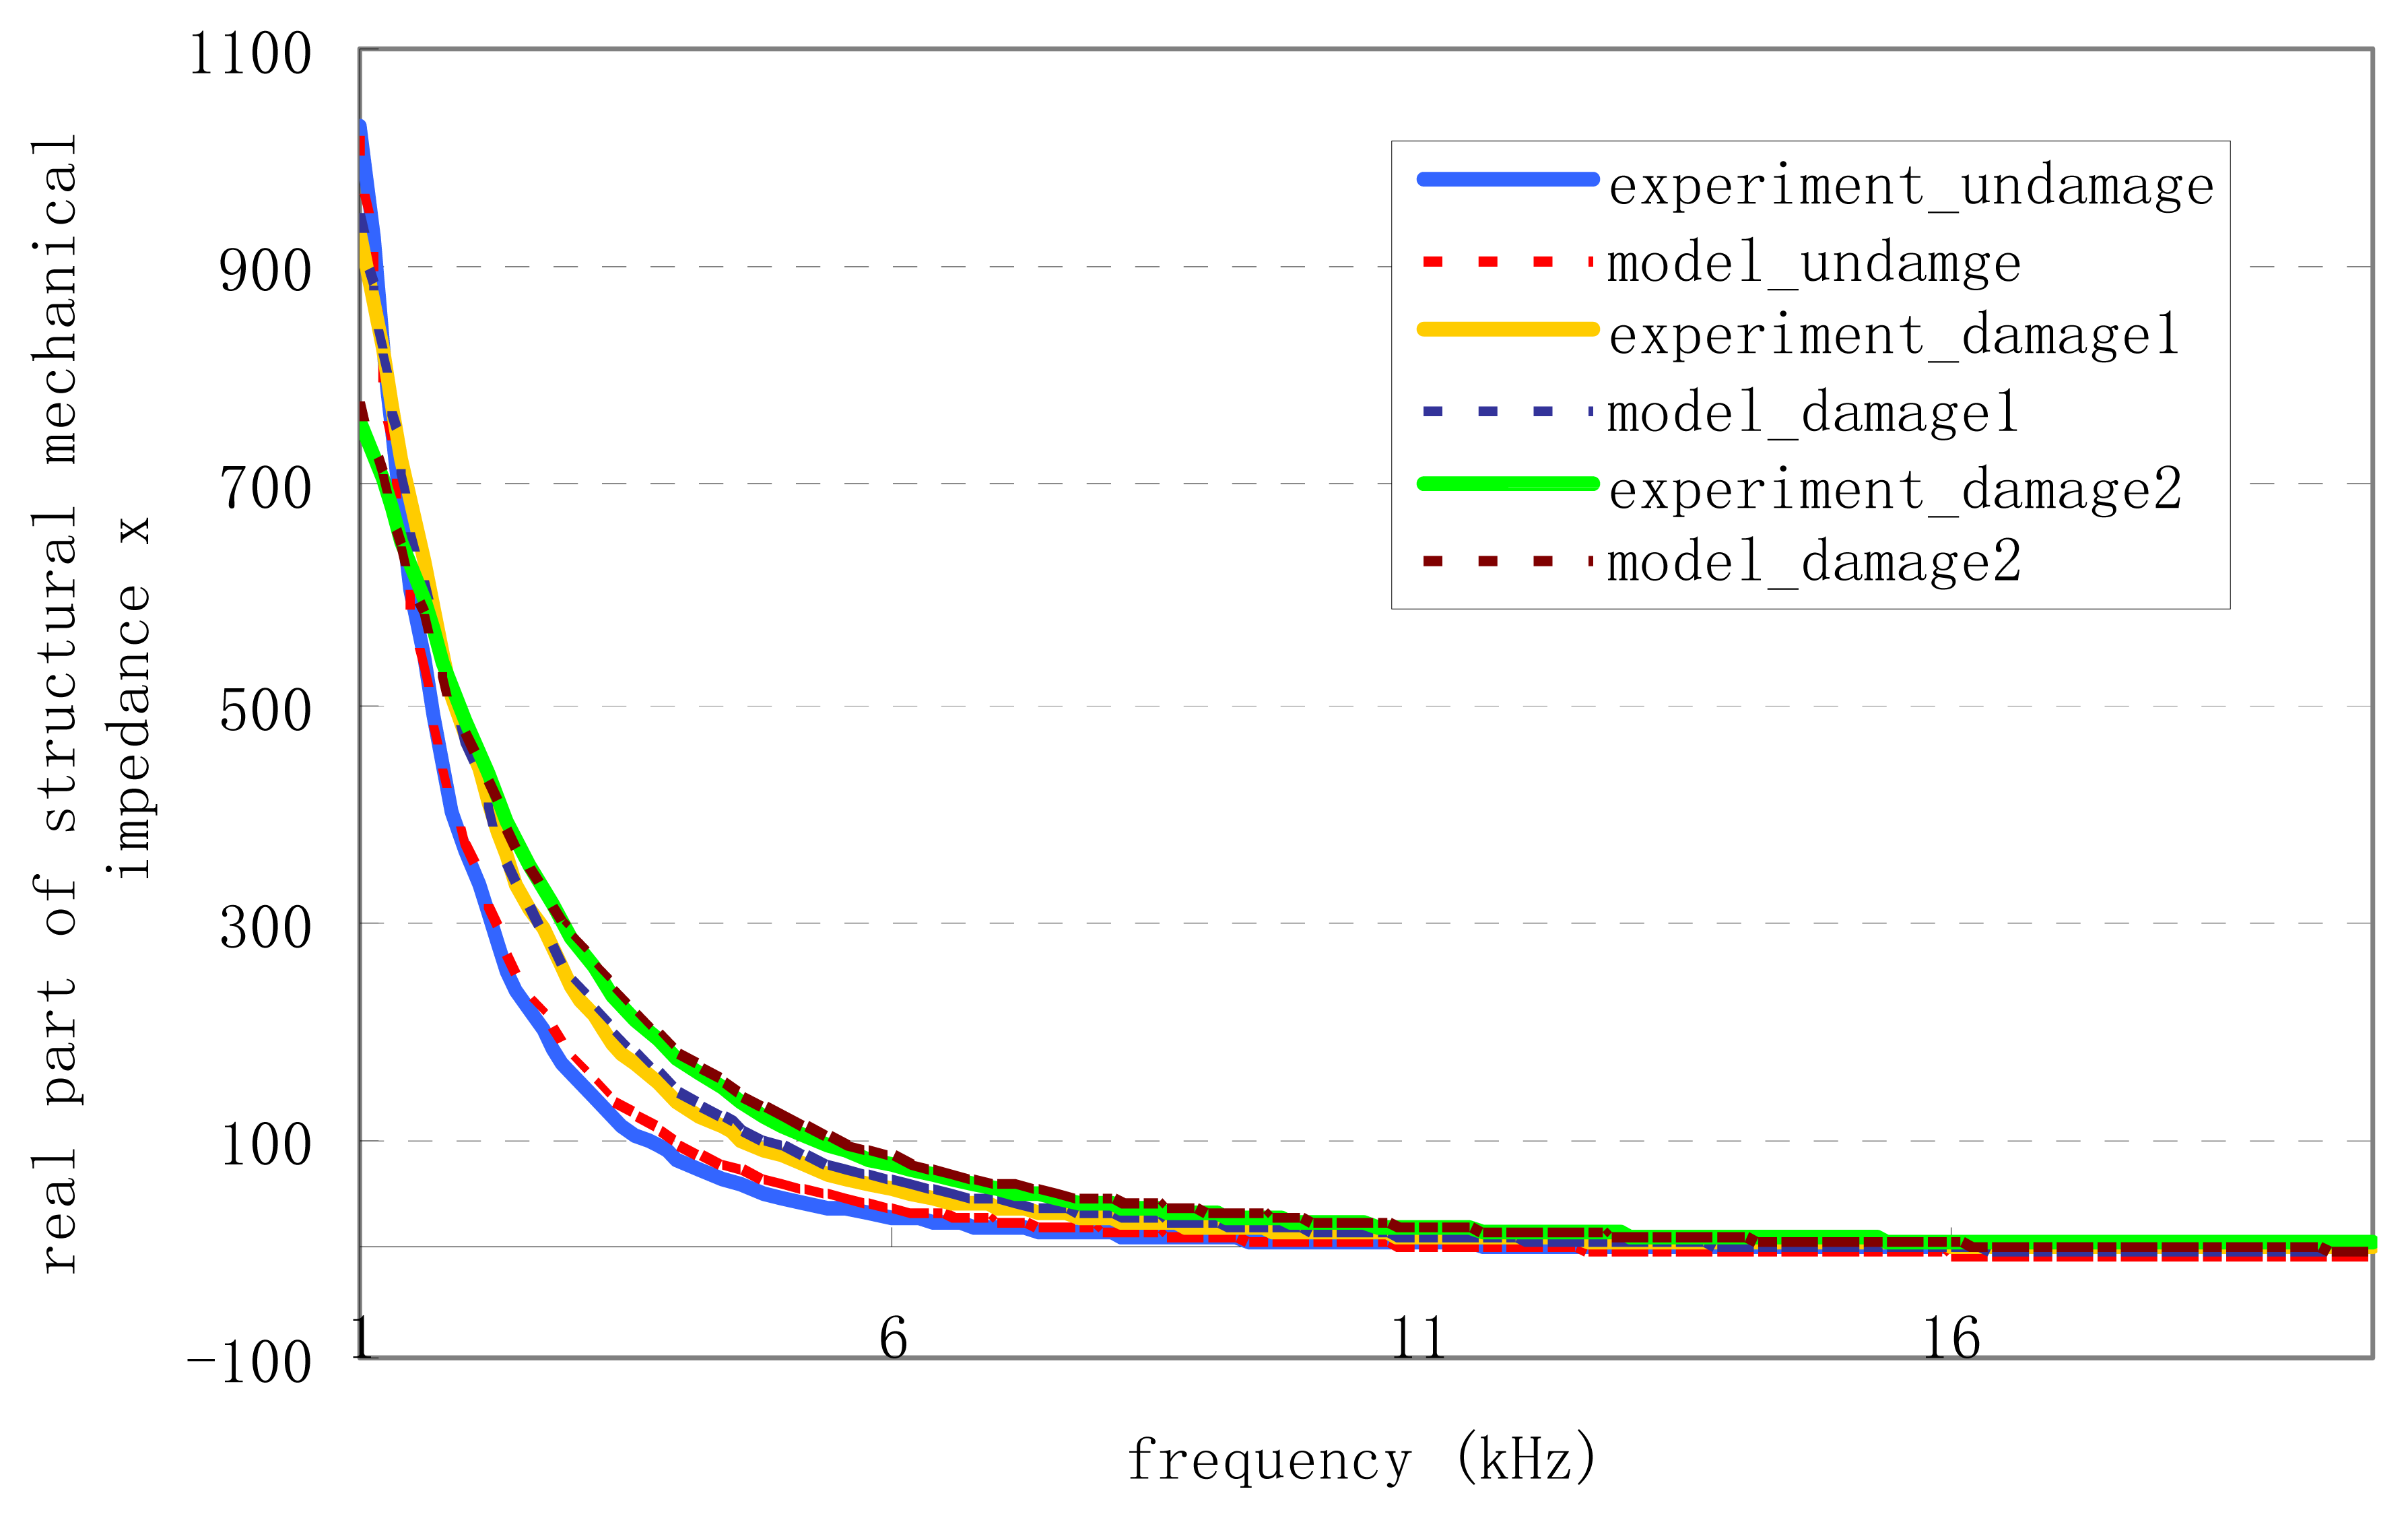
Figure 11.
Convergence performance of GA.
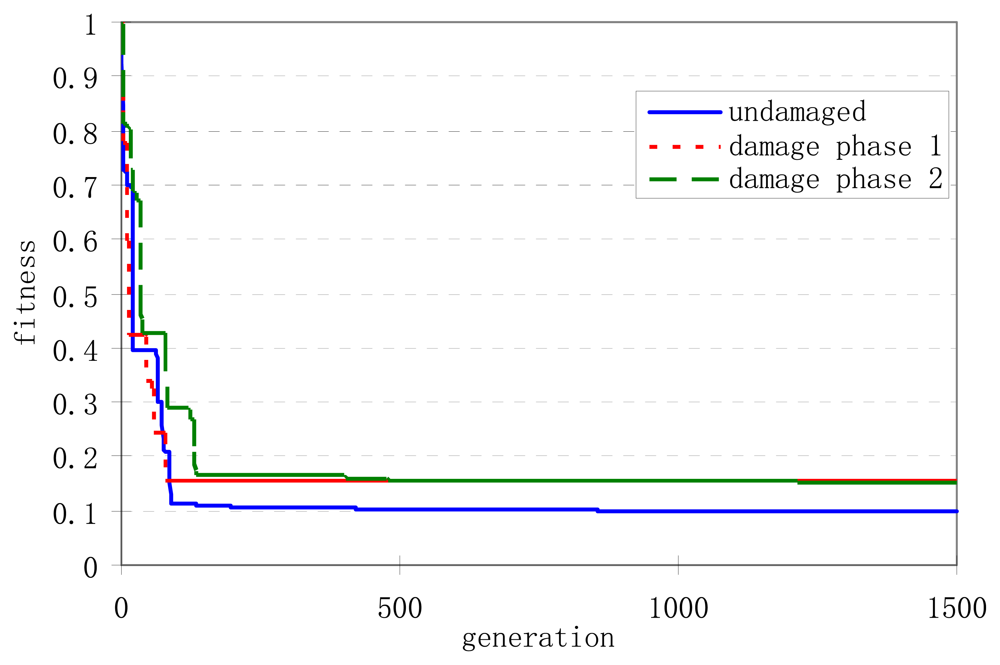
Figure 12.
Detected changes of damping in SMI model for the driven points with different distances from the damage for two damage states.
Figure 12.
Detected changes of damping in SMI model for the driven points with different distances from the damage for two damage states.
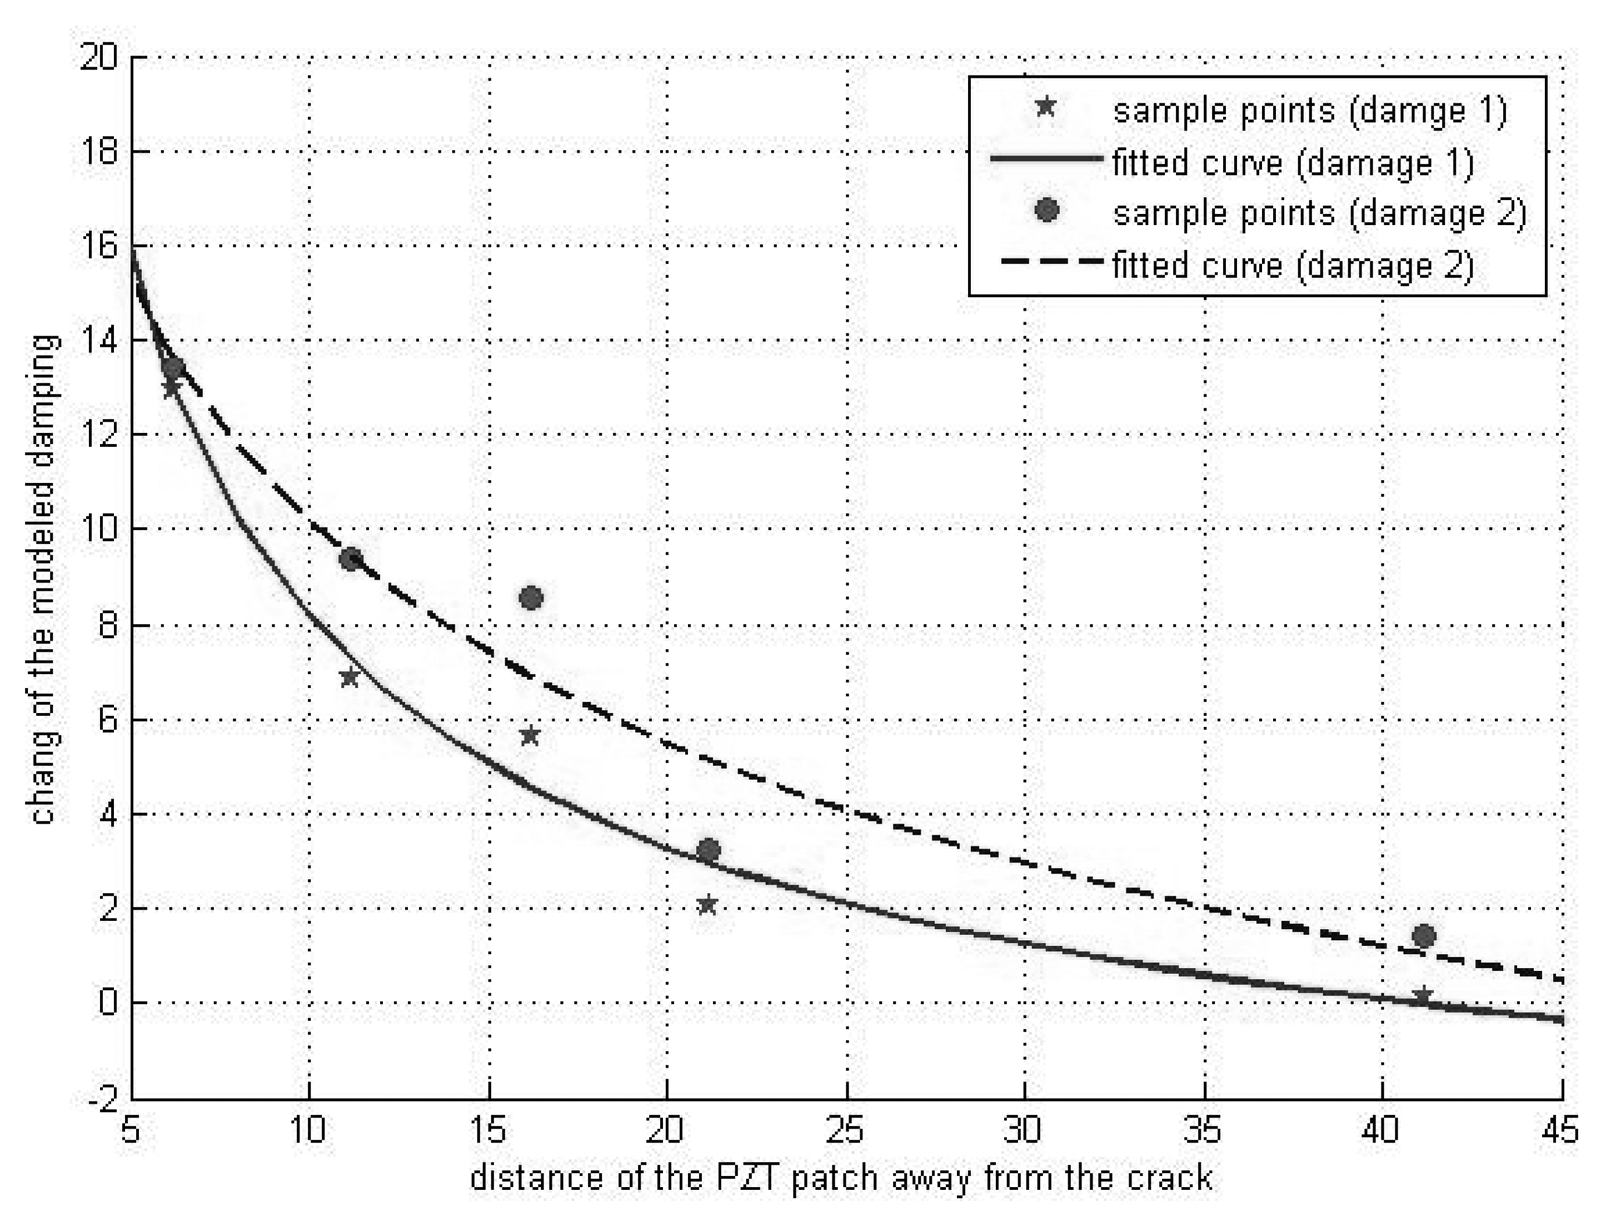
Figure 13.
Detected changes of stiffness in SMI model for the driven points with different distances from the damage for two damage states.
Figure 13.
Detected changes of stiffness in SMI model for the driven points with different distances from the damage for two damage states.
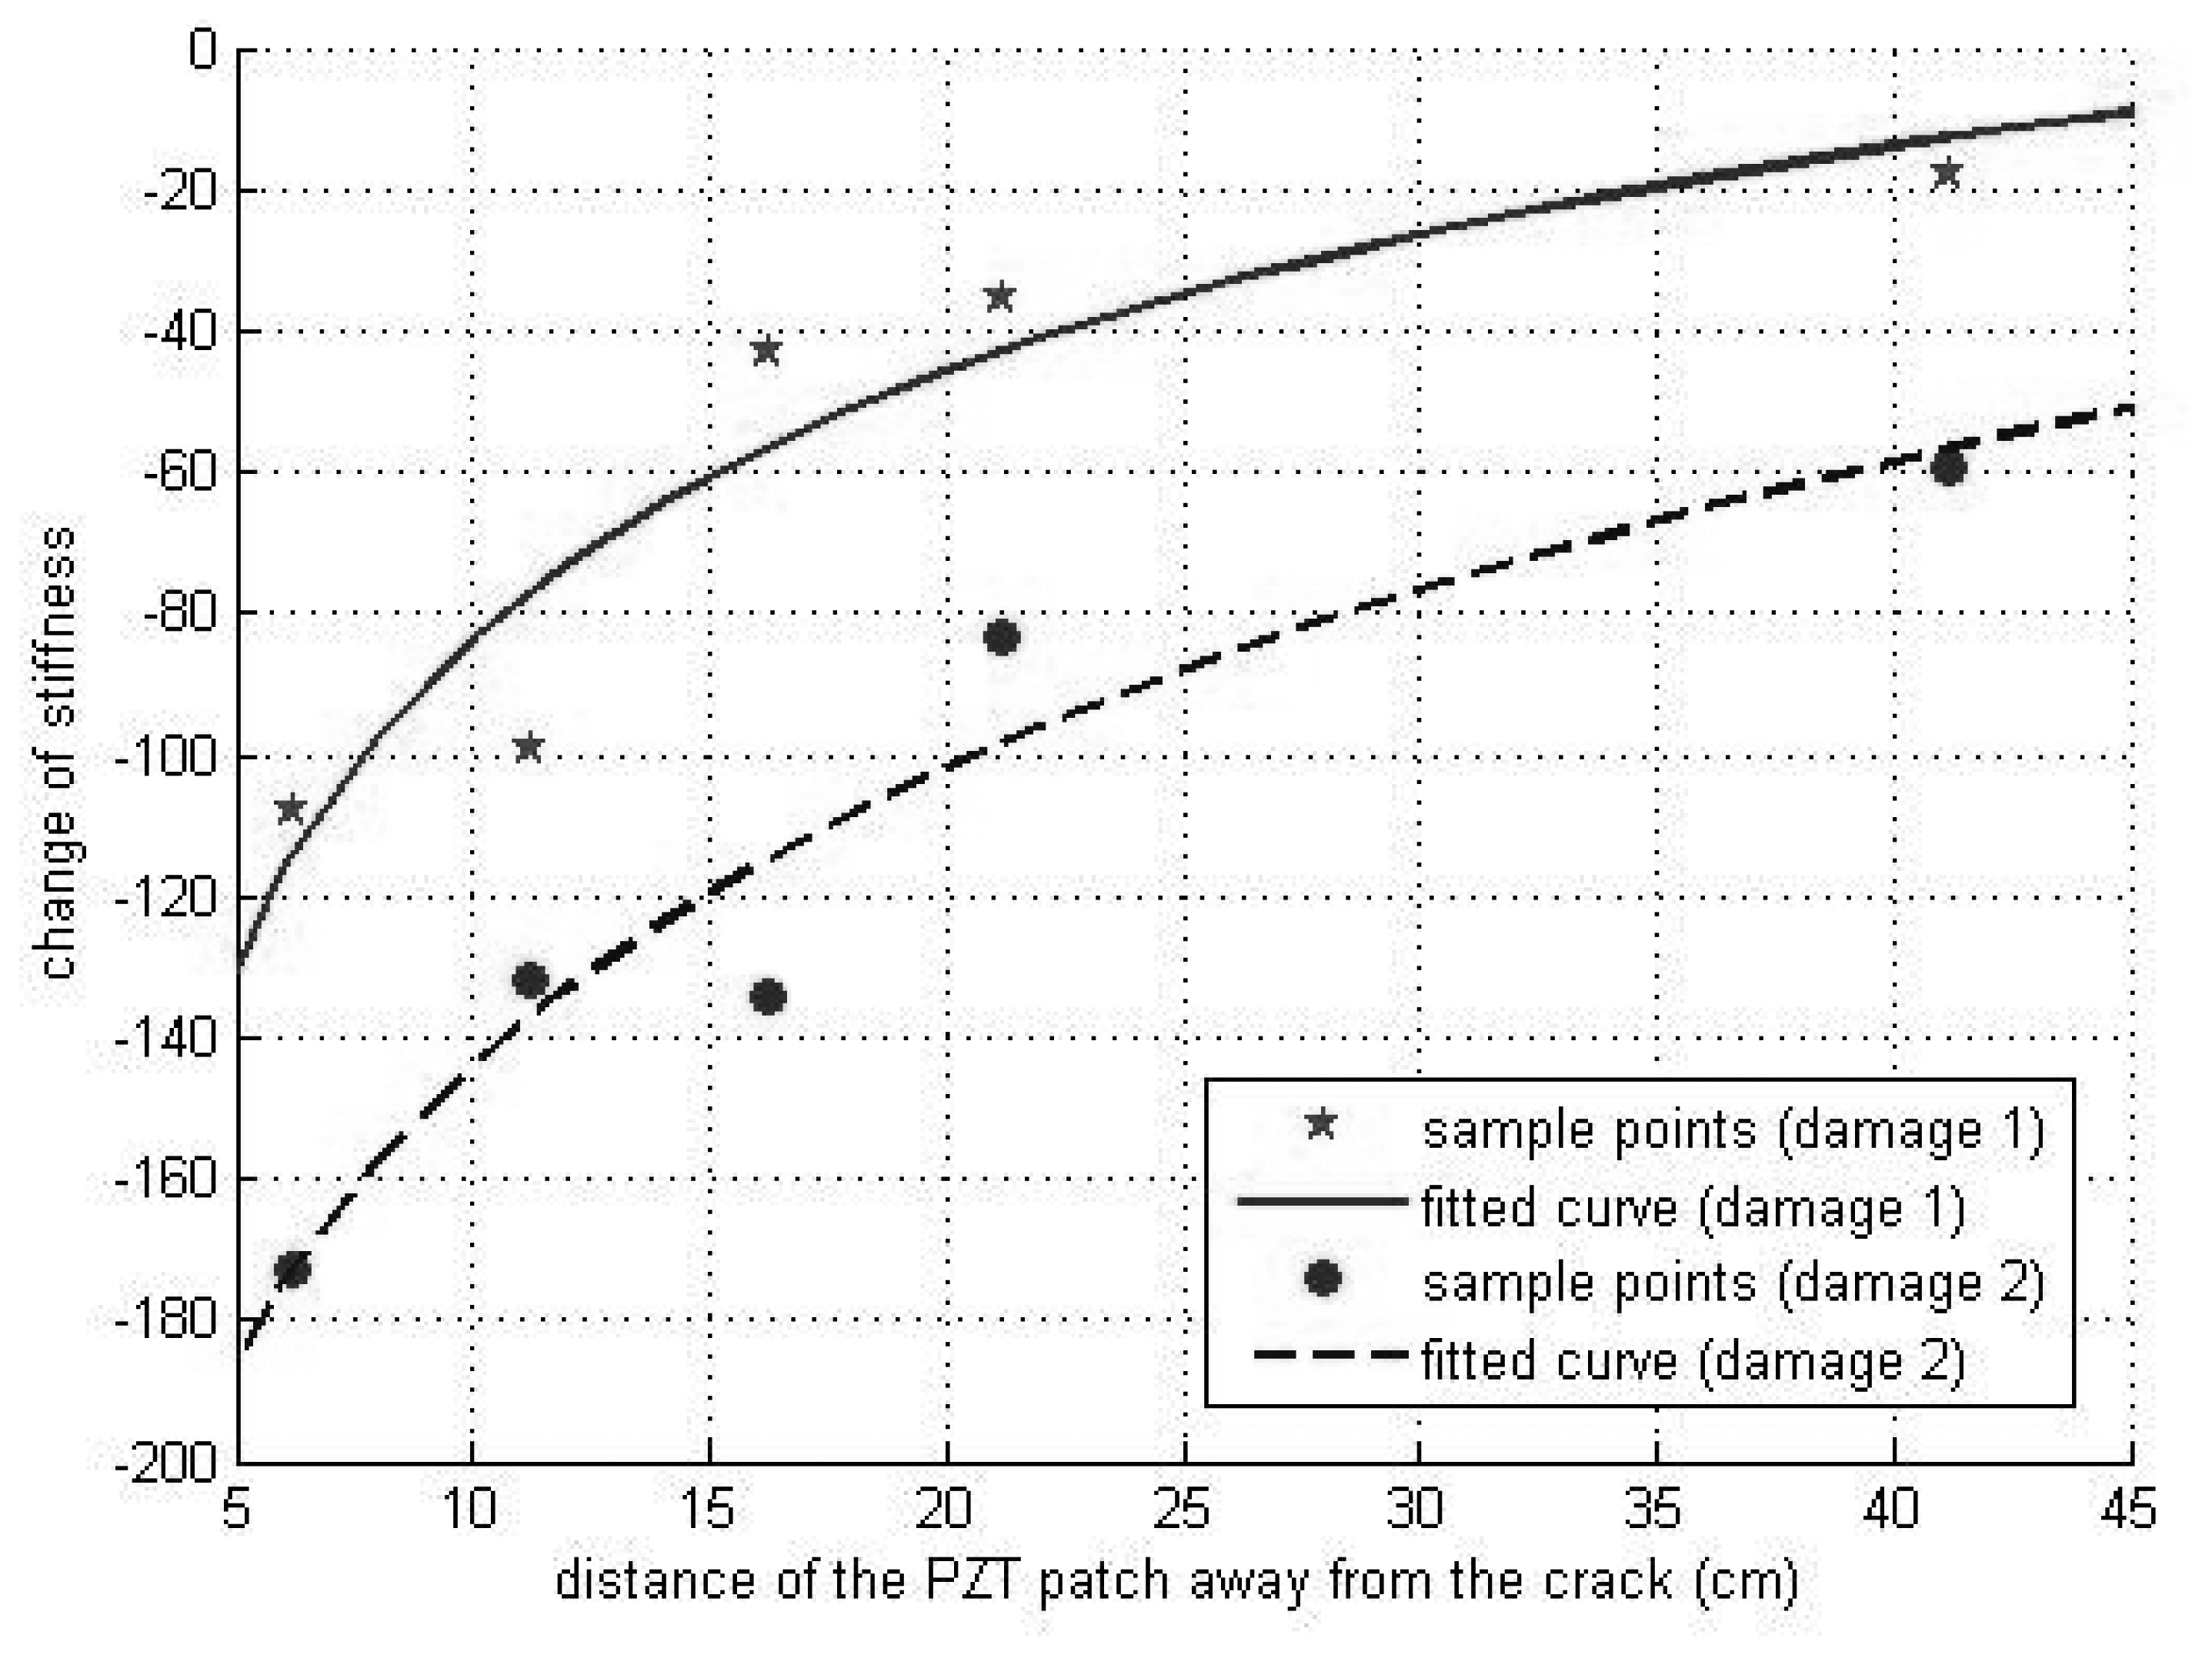
Figure 14.
Detected changes of mass in the impedance model for the driven points with different distances from the damage for two damage states.
Figure 14.
Detected changes of mass in the impedance model for the driven points with different distances from the damage for two damage states.

| Symbol | Quantity | Value |
|---|---|---|
| la | length | 10 mm |
| wa | width | 10 mm |
| ha | thickness | 0.2 mm |
| Y | Young's modulus | 66.7 GPa |
| η | loss factor | 0.005 |
| ρ | mass density | 7800 kg/m3 |
| d31 | strain constant | -2.10E-10 m/volt |
| ε33T | permittivity | 1.93E-08 fatad/m |
| δ | dielectric loss factor | 1.50E-02 |
| Patch Number | Distance from joint O along the column as shown in Figure 2 | Distance of the PZT patch from the main crack |
|---|---|---|
| 1 | 100 mm | 62 mm |
| 2 | 150 mm | 112 mm |
| 3 | 200 mm | 162 mm |
| 4 | 250 mm | 212 mm |
| 5 | 450 mm | 412 mm |
| Phase No. | Name | Description | Purpose |
|---|---|---|---|
| 1 | RND-A | Random, PGA=0.02g | Structural identification |
| 2 | CHL- | Chile, PGA=0.23g, | Moderate shaking |
| 3 | RND-B | Random, PGA=0.02g | Structural identification |
| 4 | CHL- | Chile, PGA=0.46g, | Sever shaking |
| 5 | RND-C | Random, PGA=0.02g | Structural identification |
| Damage Phase 1 | ||||
|---|---|---|---|---|
| PZT patch no. | RMSD of G | RMSD of B | RMSD of x | RMSD of y |
| 1 | 1.700904 | 0.079885 | 15.73118 | 0.077741 |
| 2 | 1.502574 | 0.106806 | 13.34286 | 0.098003 |
| 3 | 1.473301 | 0.086287 | 9.605244 | 0.063772 |
| 4 | 1.25146 | 0.11261 | 7.5918 | 0.095865 |
| 5 | 0.940053 | 0.116923 | 4.747043 | 0.117208 |
| Damage Phase 2 | ||||
| RMSD of G | RMSD of B | RMSD of x | RMSD of y | |
| 1 | 3.139675 | 0.061062 | 25.89481 | 0.049555 |
| 2 | 2.343378 | 0.073566 | 20.84959 | 0.064063 |
| 3 | 2.46278 | 0.058494 | 18.08281 | 0.047549 |
| 4 | 1.898626 | 0.071459 | 10.93107 | 0.054598 |
| 5 | 1.390455 | 0.056117 | 8.161555 | 0.045829 |
© 2008 by MDPI Reproduction is permitted for noncommercial purposes.
Share and Cite
MDPI and ACS Style
Yang, Y.; Hu, Y.; Lu, Y. Sensitivity of PZT Impedance Sensors for Damage Detection of Concrete Structures. Sensors 2008, 8, 327-346. https://doi.org/10.3390/s8010327
AMA Style
Yang Y, Hu Y, Lu Y. Sensitivity of PZT Impedance Sensors for Damage Detection of Concrete Structures. Sensors. 2008; 8(1):327-346. https://doi.org/10.3390/s8010327
Chicago/Turabian StyleYang, Yaowen, Yuhang Hu, and Yong Lu. 2008. "Sensitivity of PZT Impedance Sensors for Damage Detection of Concrete Structures" Sensors 8, no. 1: 327-346. https://doi.org/10.3390/s8010327