Article

Multi-instrumental Analysis of Tissues of Sunflower Plants Treated with Silver(I) Ions – Plants as Bioindicators of Environmental Pollution

by
Sona Krizkova
1,
Pavel Ryant
2,
Olga Krystofova
3,
Vojtech Adam
1,
Michaela Galiova
3,
Miroslava Beklova
5,
Petr Babula
6,
Jozef Kaiser
7,
Karel Novotny
3,
Jan Novotny
7,
Miroslav Liska
7,
Radomir Malina
7,
Josef Zehnalek
1,
Jaromir Hubalek
8,
Ladislav Havel
9 and
Rene Kizek
1,*
1
Department of Chemistry and Biochemistry, 2 Department of Agrochemistry, Soil Science, Microbiology and Plant Nutrition, CZ-613 00 Brno, Czech Republic
2
Department of Agrochemistry, Soil Science, Microbiology and Plant Nutrition, CZ-613 00 Brno, Czech Republic
3
Department of Chemistry, Faculty of Science, Masaryk University, Kamenice CZ-625 00 Brno, Czech Republic
4
Department of Animal Nutrition and Forage Production, CZ-613 00 Brno, Czech Republic
5
Department of Chemistry, Faculty of Science, Masaryk University, Kamenice CZ-625 00 Brno, Czech Republic
6
Department of Natural Drugs, Faculty of Pharmacy and University of Veterinary and Pharmaceutical Sciences, Palackeho 1-3, CZ-612 42 Brno, Czech Republic
7
Institute of Physical Engineering, Faculty of Mechanical Engineering, Brno University of Technology, Technicka 2896/2, CZ-616 69 Brno, Czech Republic
8
Department of Microelectronics, Faculty of Electrical Engineering and Communication, Brno University of Technology, Udolni 53, CZ-602 00 Brno, Czech Republic
9
Department of Plant Biology, Faculty of Agronomy, Mendel University of Agriculture and Forestry, Zemedelska 1, CZ-613 00 Brno, Czech Republic
*
Author to whom correspondence should be addressed.
Sensors 2008, 8(1), 445-463; https://doi.org/10.3390/s8010445
Submission received: 26 December 2007 / Accepted: 15 January 2008 / Published: 24 January 2008

Abstract

:
The aim of this work is to investigate sunflower plants response on stress induced by silver(I) ions. The sunflower plants were exposed to silver(I) ions (0, 0.1, 0.5, and 1 mM) for 96 h. Primarily we aimed our attention to observation of basic physiological parameters. We found that the treated plants embodied growth depression, coloured changes and lack root hairs. Using of autofluorescence of anatomical structures, such as lignified cell walls, it was possible to determine the changes of important shoot and root structures, mainly vascular bungles and development of secondary thickening. The differences in vascular bundles organisation, parenchymatic pith development in the root centre and the reduction of phloem part of vascular bundles were well observable. Moreover with increasing silver(I) ions concentration the vitality of rhizodermal cells declined; rhizodermal cells early necrosed and were replaced by the cells of exodermis. Further we employed laser induced breakdown spectroscopy for determination of spatial distribution of silver(I) ions in tissues of the treated plants. The Ag is accumulated mainly in near-root part of the sample. Moreover basic biochemical indicators of environmental stress were investigated. The total content of proteins expressively decreased with increasing silver(I) ions dose and the time of the treatment. As we compare the results obtained by protein analysis – the total protein contents in shoot as well as root parts – we can assume on the transport of the proteins from the roots to shoots. This phenomenon can be related with the cascade of processes connecting with photosynthesis. The second biochemical parameter, which we investigated, was urease activity. If we compared the activity in treated plants with control, we found out that presence of silver(I) ions markedly enhanced the activity of urease at all applied doses of this toxic metal. Finally we studied the effect of silver(I) ions on activity of urease in in vitro conditions.

1. Introduction

1.1 Silver ions and their effects on organisms
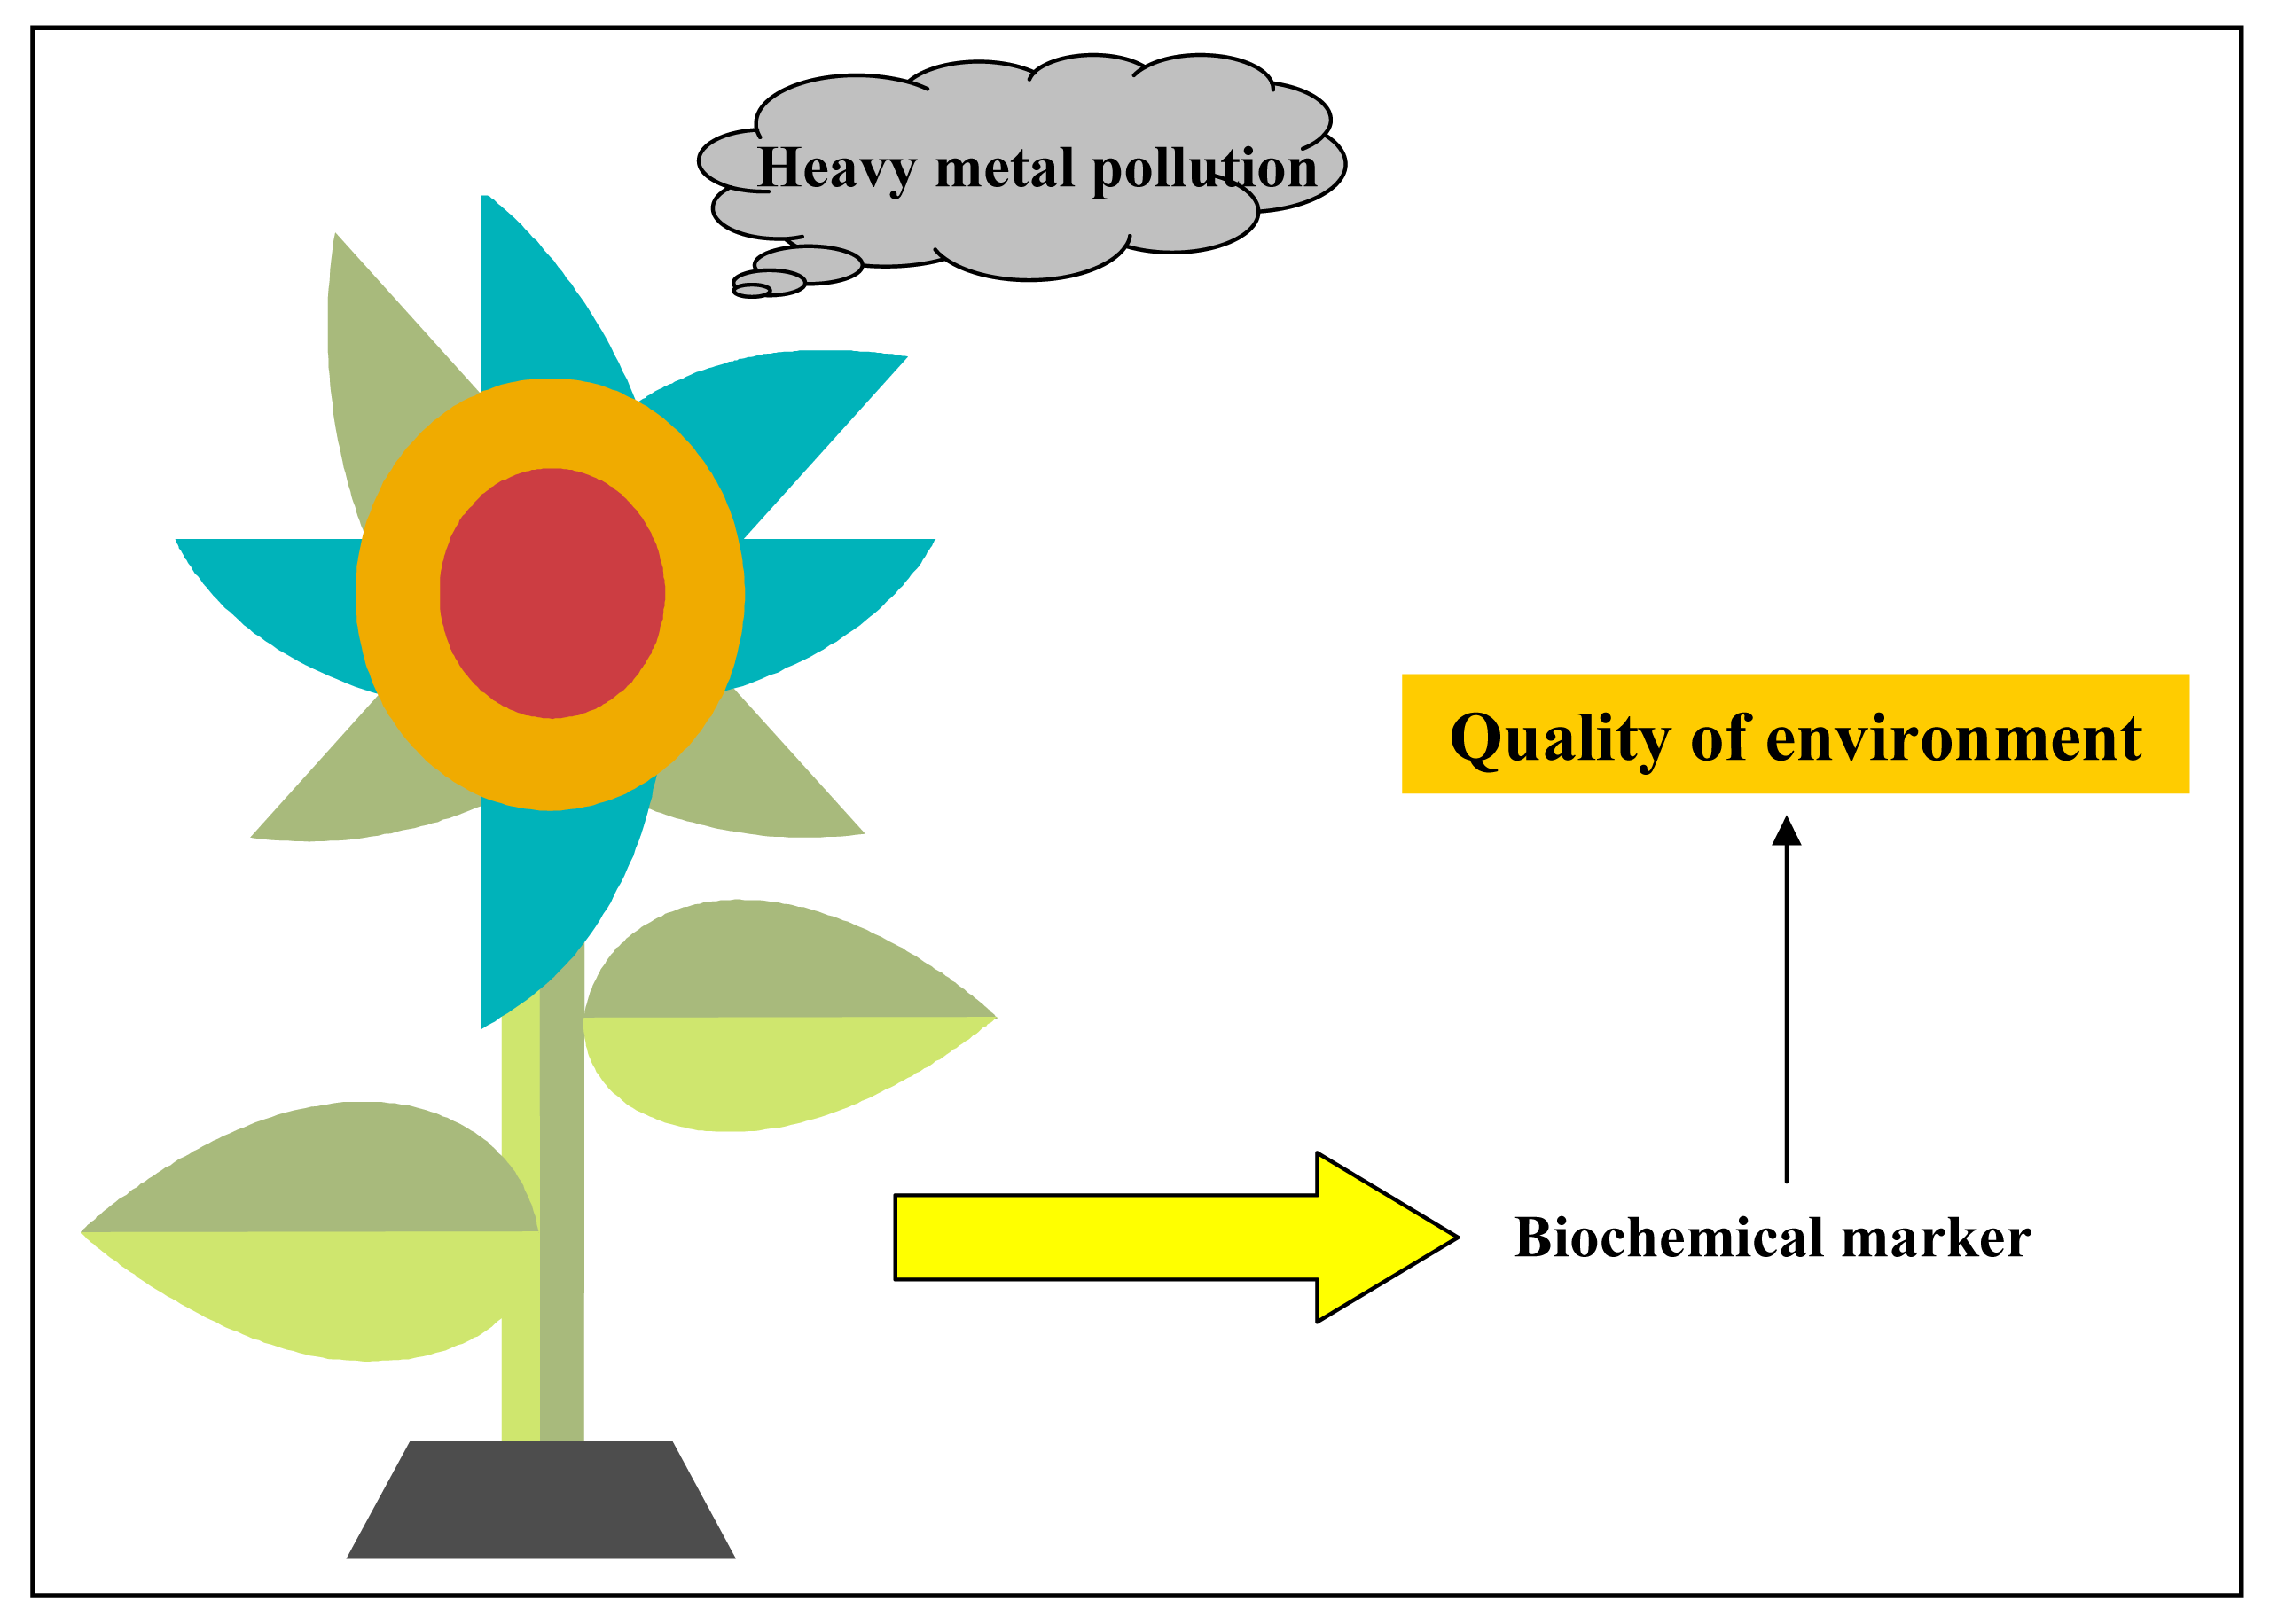
Due to many anthropogenic activities environment have been polluting by number of organic as well as inorganic compounds [1]. Therefore the concentration of these undesirable and in most cases highly toxic substances have enhanced [2]. The mechanism of their effects can be very heterogeneous. Because of these reasons the new procedures and technologies not only to monitor of levels of contamination but also to remediate the polluted environment have been still developing and suggesting. The ions of heavy metals and their compounds are considered as one of the most toxic substances polluting all parts of environment. Photographical industry, following electrochemistry and medicine are the main sources of one of the most toxic heavy metal ions, silver(I) ions. In water silver(I) can be found in many forms both as inorganic and organic compounds. Due to competing equilibria and kinetics in water hydrated silver ions, Ag+, may be also present in surface waters, which relates to the fact that Ag+ has been shown to be highly toxic to aquatic life [3-5]. In the light of these facts the foundation called “The Silver Council”, which was established in 1998, elaborated the basic characteristics of environmental norms for silver ions entering to environment from industry [6]. However the toxic effect of silver(I) ions on the organisms is still unclear.
There have been suggested several mechanisms of silver ions effects on vitally important functions and processes. One of the most discussed is the interactions between Ag+ and DNA, which have been studied by number of analytical methods (infrared and UV spectrometry, circular dichroism etc.) [7,8]. It was observed that silver ions bind rapidly on N7 guanine in dsDNA and, thus, interfere the replication processes [8].
It is generally known that prokaryotic as well as eukaryotic organisms intensively protect themselves against effects of heavy metals. The both groups of organisms have developed various strategies how they can detoxify xenobiotics. One of the common ones is synthesis of low molecular peptides and proteins rich in cysteine. In general plants synthesize peptides called phytochelatins [9,10] and animals low molecular proteins called metallothioneins [11].

1.2 Bio-indicators

Numerous of plant and animal species can be used as bio-indicators of heavy metals pollution of the environment [12-19]. Aquatic animals, most of all various species of fishes, are very suitable for these purposes [20-22]. Nevertheless the question is how to asses the quality of the environment of interest through using of such living bio-indicators [23]. To assess the quality of the environment the investigations of the changes in behaviour, morphology, habitation or changes of basic morphometric properties (body weight, colour, length, etc.) are often used. All these data are only of qualitative character and are hardly to obtain due to requirements on large population of the target specie and the time period of the experiment. On the other hand, experiments using plants can be appropriate way how to substitute animal tests because no harming of animals and low demands on equipment.

1.3 Silver ions analysis

A determination of silver(I) ions in waters is difficult because the formation of a number of silver complexes with inorganic as well as organic compounds that however depress the acute silver toxicity [6,24,25]. The determination of silver ions is usually carried out by atomic absorption spectrometry [26,27]. To enhance the sensitivity of an analysis the pre-concentration of the silver ions in a sample is need. These processes prolong the total time of the analysis as well as enhance the cost of such experiment [27-29]. The electrochemical methods are alternative analytic techniques that make the silver ions determination possible in nM concentrations, mainly using carbon electrodes [30-36]. The modification of the surface of the carbon electrodes represents a unique tool for detection of heavy metal ions, peptides, proteins, nucleic acids and others [37-46].
The aim of this work is to investigate sunflower plants response on stress induced by silver(I) ions. For this purpose we employed multi-instrumental apparatus to detect and investigate total protein content, urease activity, spatial distribution of the heavy metal ions, and physiological and anatomical changes in the treated plants.

2. Material and Methods

2.1 Chemicals and pH measurements

Urease EC 3.5.1.5 (Jack Beans, type III; 45 000 IU/g) was purchased from Sigma Aldrich (St. Louis, USA). Acetic acid was purchased from Fluka (USA). All other reagents used were purchased from Sigma Aldrich in ACS purity unless noted otherwise. Stock standard solutions were prepared by ACS water (Sigma-Aldrich, USA) and stored in the dark at temperature of -20 °C. Working standard solutions were prepared daily by dilution of the stock solutions. All solutions were filtered through a 0.45 μm Nylon filter discs (Millipore, Billerica, Mass., USA) prior to HPLC analysis. The pH value was measured using WTW inoLab Level 3 with terminal Level 3 (Weilheim, Germany), controlled by the personal computer program (MultiLab Pilot; Weilheim, Germany). The pH-electrode (SenTix-H, pH 0–14/3M KCl) was regularly calibrated by set of WTW buffers (Weilheim, Germany).

2.2 Plants, cultivation conditions and a sample preparation

Sunflower plants (Helianthus annuus L.) were used in our experiments. The sunflower seeds were germinated on wet filter paper in special vessels at 25 ± 2 °C in dark (box Chirana, Czech Republic). After 10 days, the sunflower seedlings were placed into vessels containing tap water and cultivated in Versatile Environmental Test Chamber (MLR-350 H, Sanyo, Japan) for eight days with 14 hours long daylight per day (maximal light intensity was about 100 μE.m-2s-1) at a temperature 22 °C and humidity 65 %. Further AgNO3 was added to the cultivation solution at final concentrations of 0 (control sample), 0.1, 0.5 and 1 mM. The sunflower plants placed in the vessels that contained tap water with addition of silver(I) ions were treated for five days. Seven plants from each experimental group were harvested at certain time intervals during the experiment, and their roots were rinsed three times in distilled water and 0.5 M EDTA. Prior to their analysis each harvested plant was divided into leaves, stem and root.

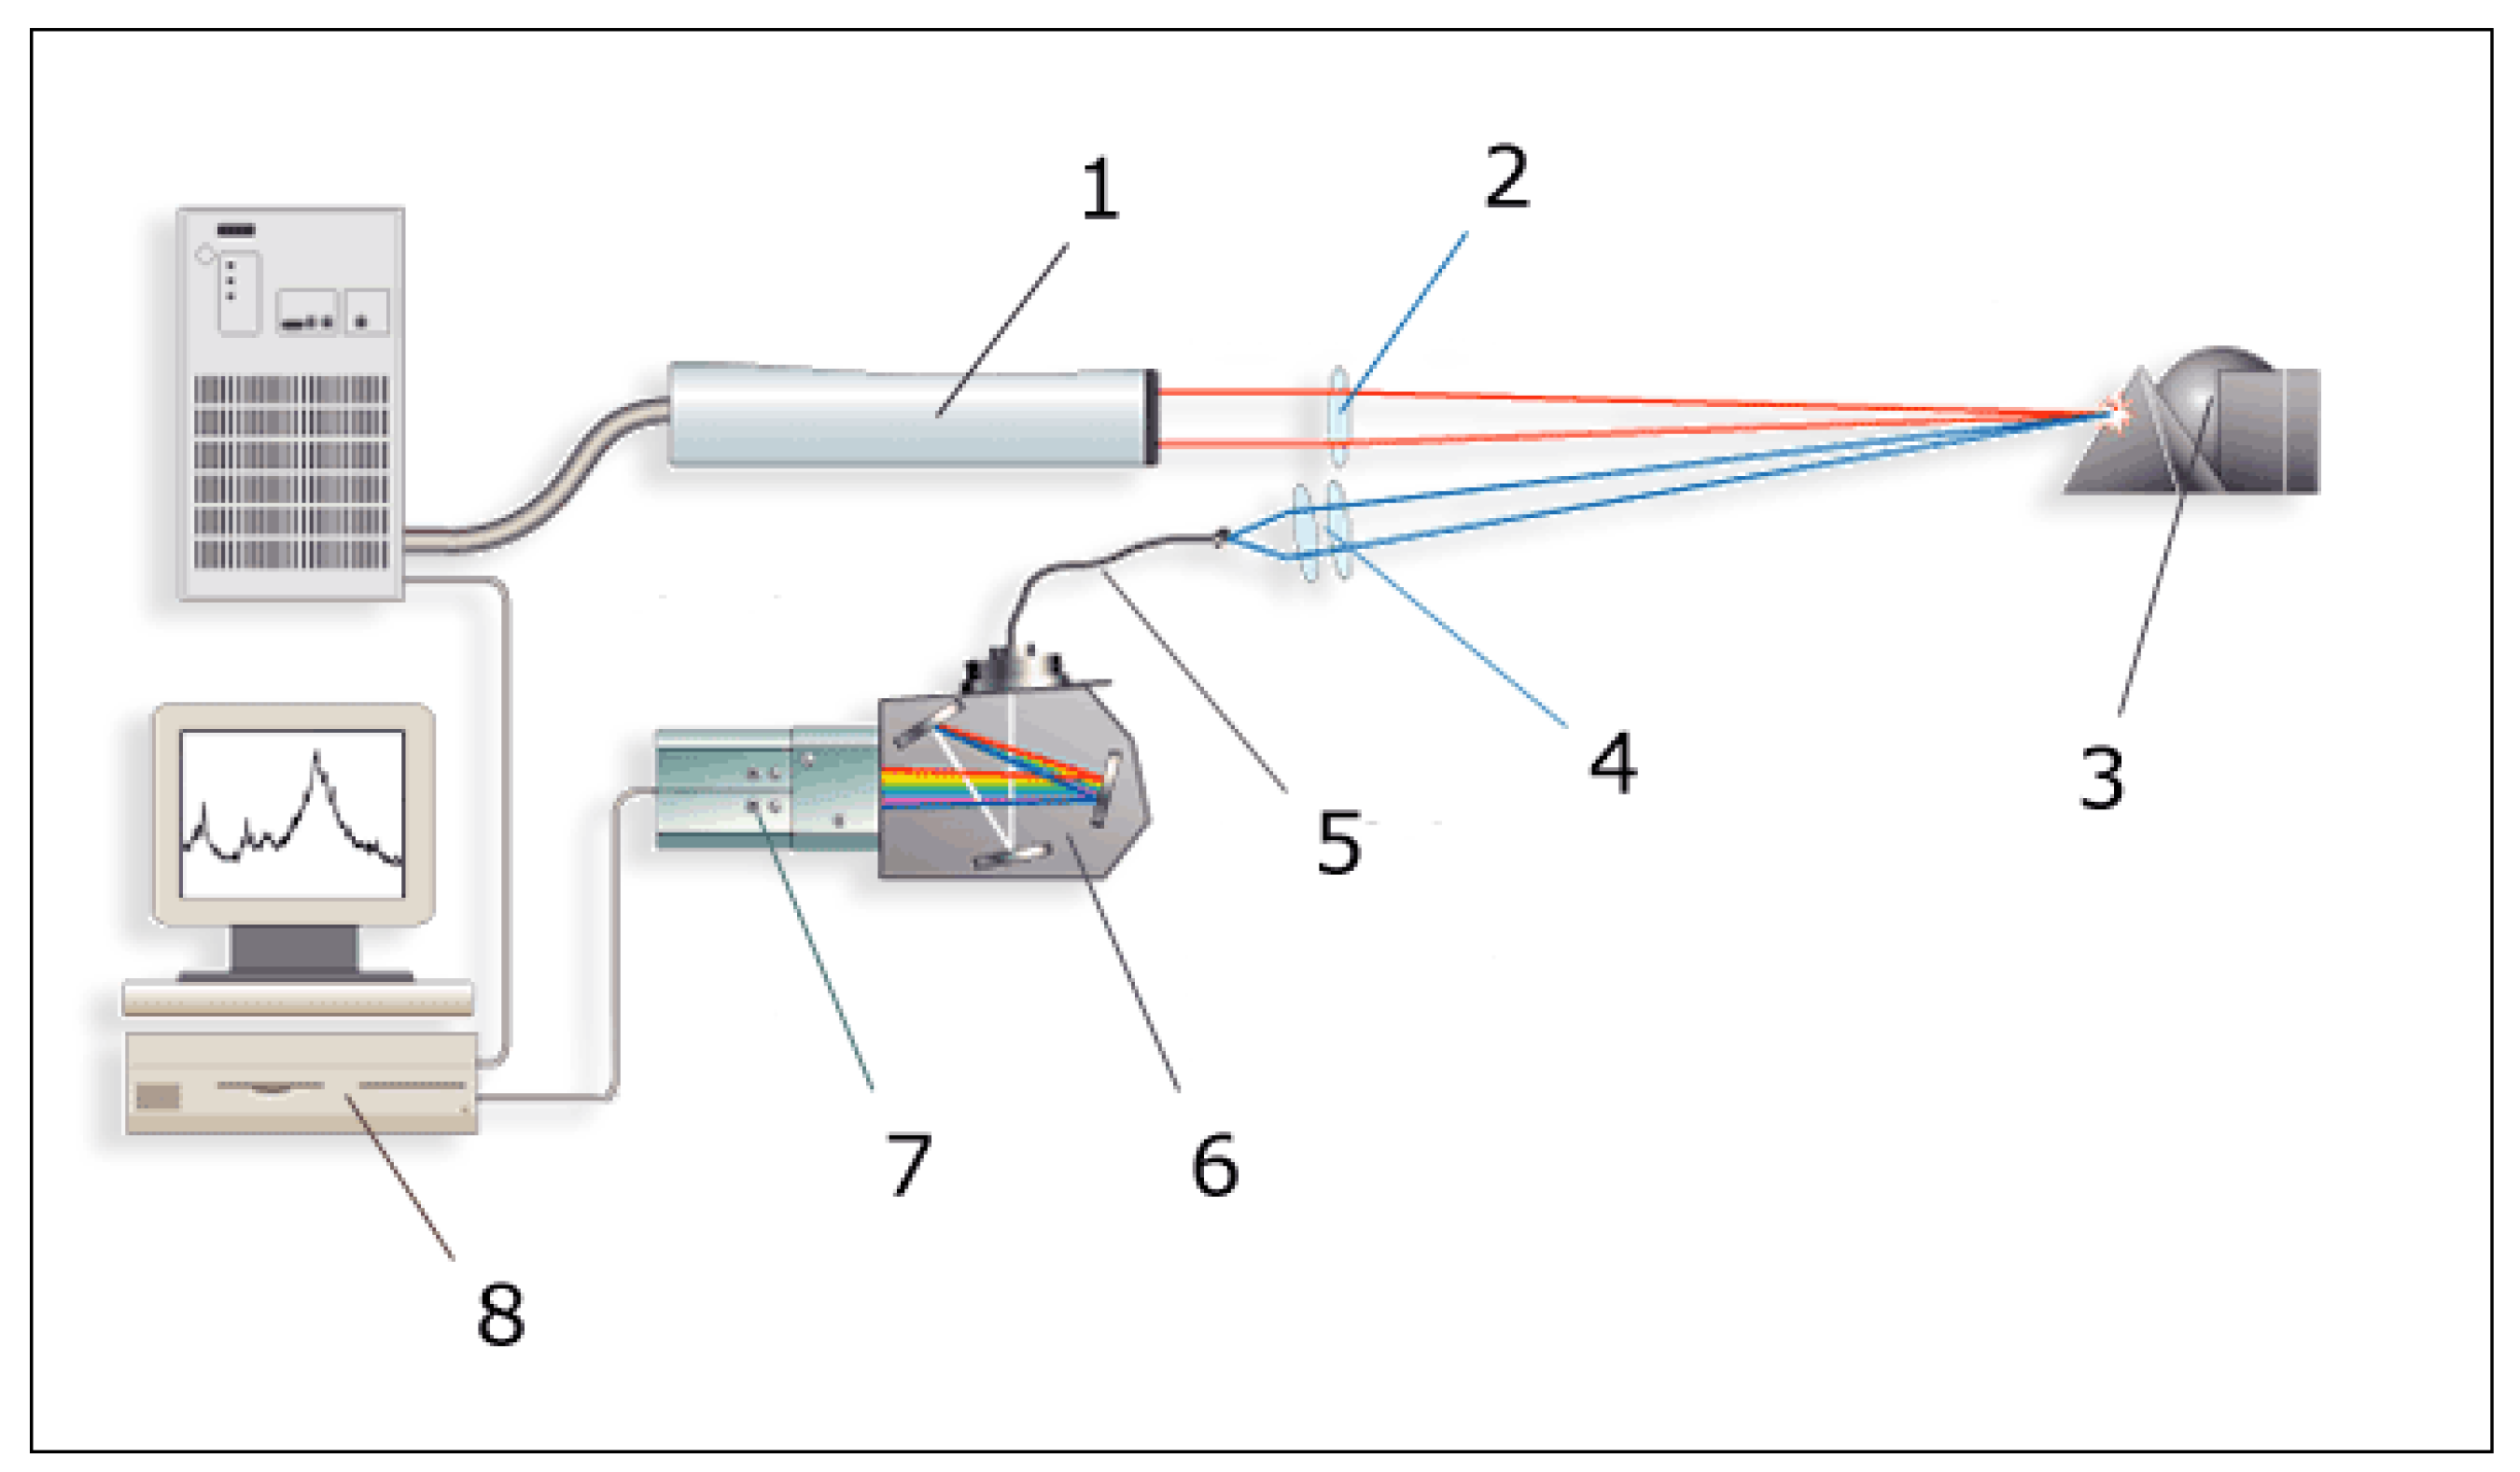
2.3 Laser spectrometry

The LIBS experimental setup used is shown in Fig. 1. The second harmonic (532 nm) of the Nd:YAG laser system (Brilliant B, Quantel, France) was used to create the LIBS micro-plasma by focusing the laser beam with a 16 mm focal-length glass doublet (Sill Optics, Germany). The laser pulse width was ∼ 5 ns and beam diameter 8 mm. The energy of the laser pulse (∼10 mJ at the sample) was set and controlled by an energy meter (Field Master LM-P10, Coherent, USA).
The sample was placed to the sample holder inside the ablation chamber (Tescan, Czech Republic) to the stage with precision movements (2 μm in x, y and z direction). The LIBS analysis was performed in air on atmospheric pressure. The ablation spot was targeted and controlled for each shot by a CCD camera placed outside of the chamber. For the temporally and spectrally resolved analysis the LIBS plasma radiation was collected with quartz objectives and transported by a 3 m fiber optic system onto the entrance slit of the 0.32 m monochromator (TRIAX 320, Jobin Yvon, France). In this study, the grating 2400 g/mm of the monochromator and 50 μm entrance slit were used. As a detector an ICCD camera (Horiba, Jobin Yvon, France) was employed. The camera was triggered by the Q-switch signal of the laser.

2.4 Automated spectrometric measurements

Spectrometric measurements were carried using an automated chemical analyser BS-200 (Mindray, China). Reagents and samples were placed on cooled sample holder (4 °C) and automatically pipetted directly into plastic cuvettes. Incubation proceeded at 37°C. Mixture was consequently stirred. The washing steps by distilled water (18 mΩ) were done in the midst of the pipetting. Apparatus was operated using software BS-200 (Mindray, China;.

2.4.1 Urease activity determination – An indophenol assay (Berthelot method)

Plant tissues samples (approximately 2 grams) were homogenized in mortar for five minutes. Then twenty millilitres of 30% ethanol was added and this solution was poured into a bottle (50 ml) and vortexed at 300 rpm, 8 °C for 30 minutes using vortex (GFL, Germany). The extract was centrifuged for 10 min at 5 000 g (Hettich, Geramy) and then the supernatant was collected. The supernatant (10 μl) was mixed with 448 μl of hypochlorite solution (12% NaOCl, 0.4 M Na2HPO4 and 0.37 M NaOH, adjusted to pH 12) and with 42 μl of phenol solution (sodium nitroprusside, 7% phenol). This mixture was stirred and incubated for 15 min at 37°C. After this incubation the differences of absorption at 630 and 670 nm were measured.

2.4.2 Protein determination – Biuret test

Weighed plant tissues (approximately 0.2 g) were transferred to a test-tube. Then, liquid nitrogen was added to the test-tube, and the samples were frozen to disrupt the cells. The frozen sample was transferred to mortar and spread for 1 min. Then exactly 1,000 μl of 0.2 M phosphate buffer (pH 7.2) was added to mortar, and the sample was spread for 5 min. The homogenate was transferred to a new test-tube. The frozen samples were homogenised by shaking on a Vortex–2 Genie for 5 min at 4 °C (Scientific Industries, USA) and sonicated using a Bandelin Sonopuls HD 2070 for 10 s at 7 W (Germany). The homogenate was centrifuged (14 000 × g) for 15 min at 4°C using a Universal 32 R centrifuge (Hettich-Zentrifugen, Germany). The supernatant was filtered through a 0.45 μm Nylon filter discs (Millipore, Billerica, Mass., USA) prior to analysis.
For determination of the total protein content the biuret solution (15 mM potassium sodium tartrate, 100 mM NaI, 15 mM KI and 5 mM CuSO4). As a standard albumin (1 mg in 1 ml of phosphate buffer, pH 7) was used. The measurement was done as follows: 180 μl of the biuret solution was mixed with 45 μl of real or standard sample; after stirring and incubating (10 min. at 37°C) the absorbance at 546 nm was measured.

2.5 Anatomical analysis of plant samples

The observations were performed with fresh stem sections of plants. Lignified cell walls were visualized by ultraviolet (UV) excitation without additional fluorescent staining. At each experimental group of plants 25 – 30 sections were evaluated. All observations were performed on fluorescent microscope (Olympus AX 70) equipped with broad spectrum UV excitation.

2.6 Statistical analysis

Data were processed using MICROSOFT EXCEL® (USA) and analyzed by the QCExpert software (TriloBite, Statistical Software, Czech Republic) using analysis of variance (ANOVA). Results are expressed as mean ± S.D. unless noted otherwise. Statistical significance of the differences between weight and area of clusters was determined. Differences with p < 0.05 were considered significant.

3. Results and Discussion

In the case of silver ions toxicity the attention is devoted to aquatic organisms [1,47-53], mainly to fishes due to extremely low lethal doses, which vary from units to ten of micrograms per litre [3,4,48-56]. On the other hand it is little known about the influence of silver ions on plants. It is well known that a presence of a toxic metal in a plant cell results in synthesis of stress plant peptides and proteins. These biologically active molecules can be used for evaluation of chronic as well as acute toxicity of a toxic metal or as biomarkers of assessment of environmental pollution (Fig. 2).

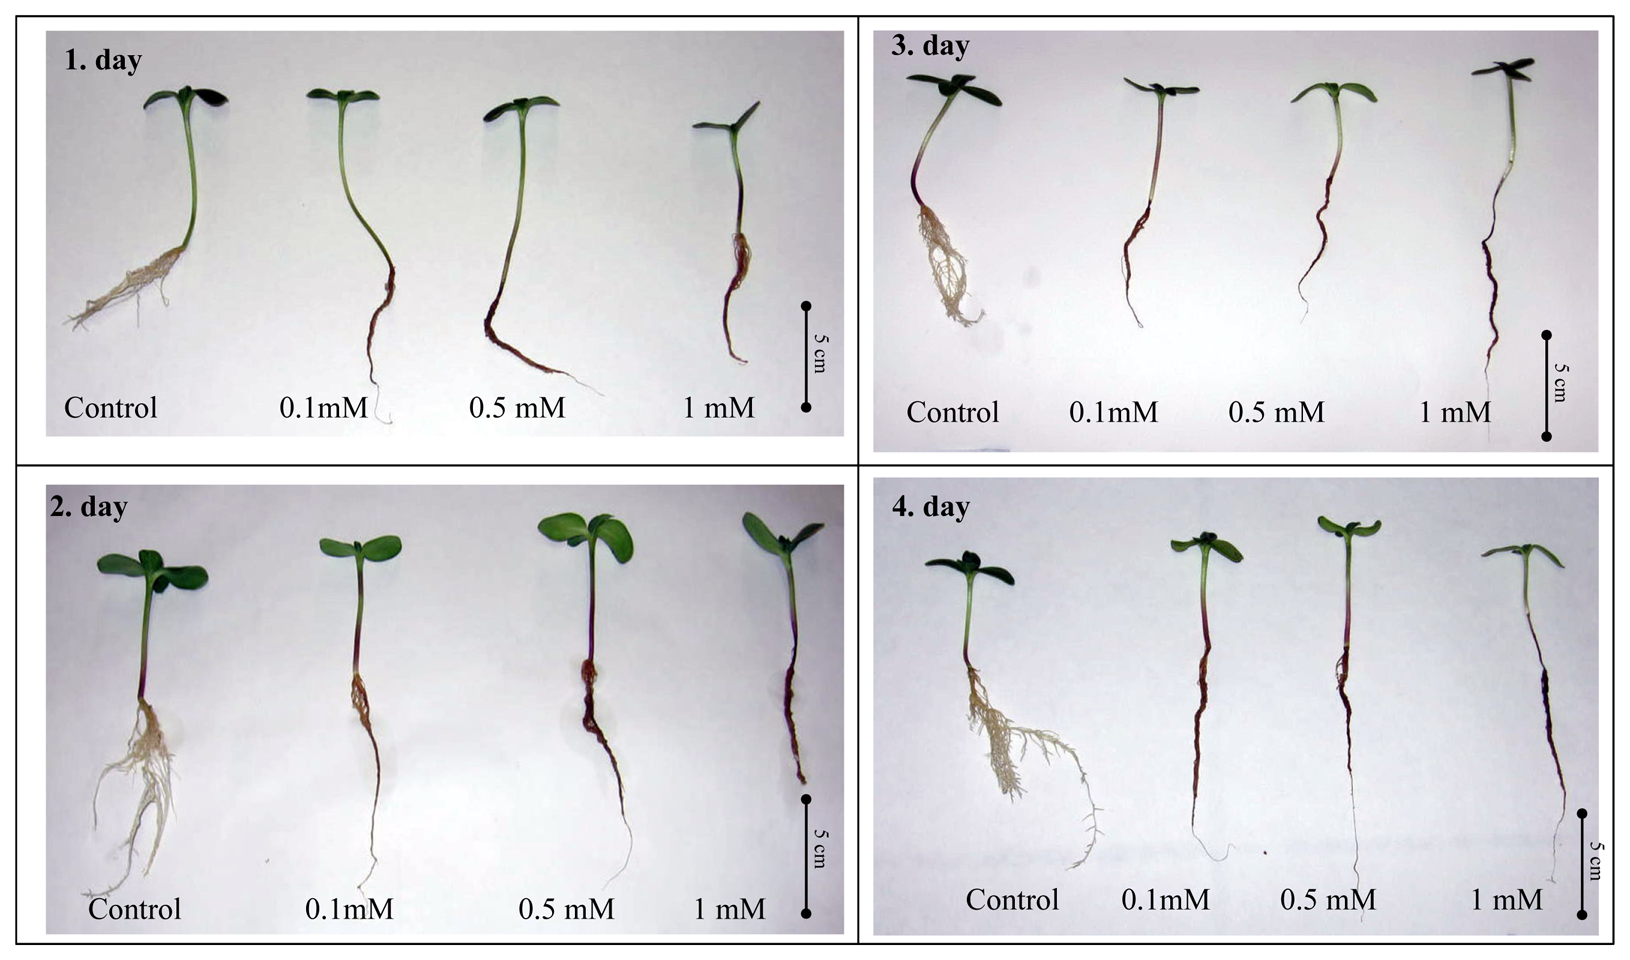
3.1 Physiological changes in sunflower plants exposed to silver(I) ions

To investigate influence of silver(I) ions on plant we selected sunflower plants (Helianthus annuus L., Asteraceae, syn. Compositae). The sunflower plants were exposed to silver(I) ions (0, 0.1, 0.5, and 1 mM) for 96 h. The images of the plants in time scale of the treatment are shown in Fig. 3. It clearly follows from the figures that the plants exposed to silver(I) ions embody growth depression; only control set of the plants demonstrates leaves growth. The root system of the plants exposed to silver(I) ions shows also physiological changes compared to control plants. Particularly we observed growth depression and coloured changes that indicate the entry of silver ions to the plants. Moreover the sunflower plants treated with silver(I) ions lack root hairs (Fig.3).

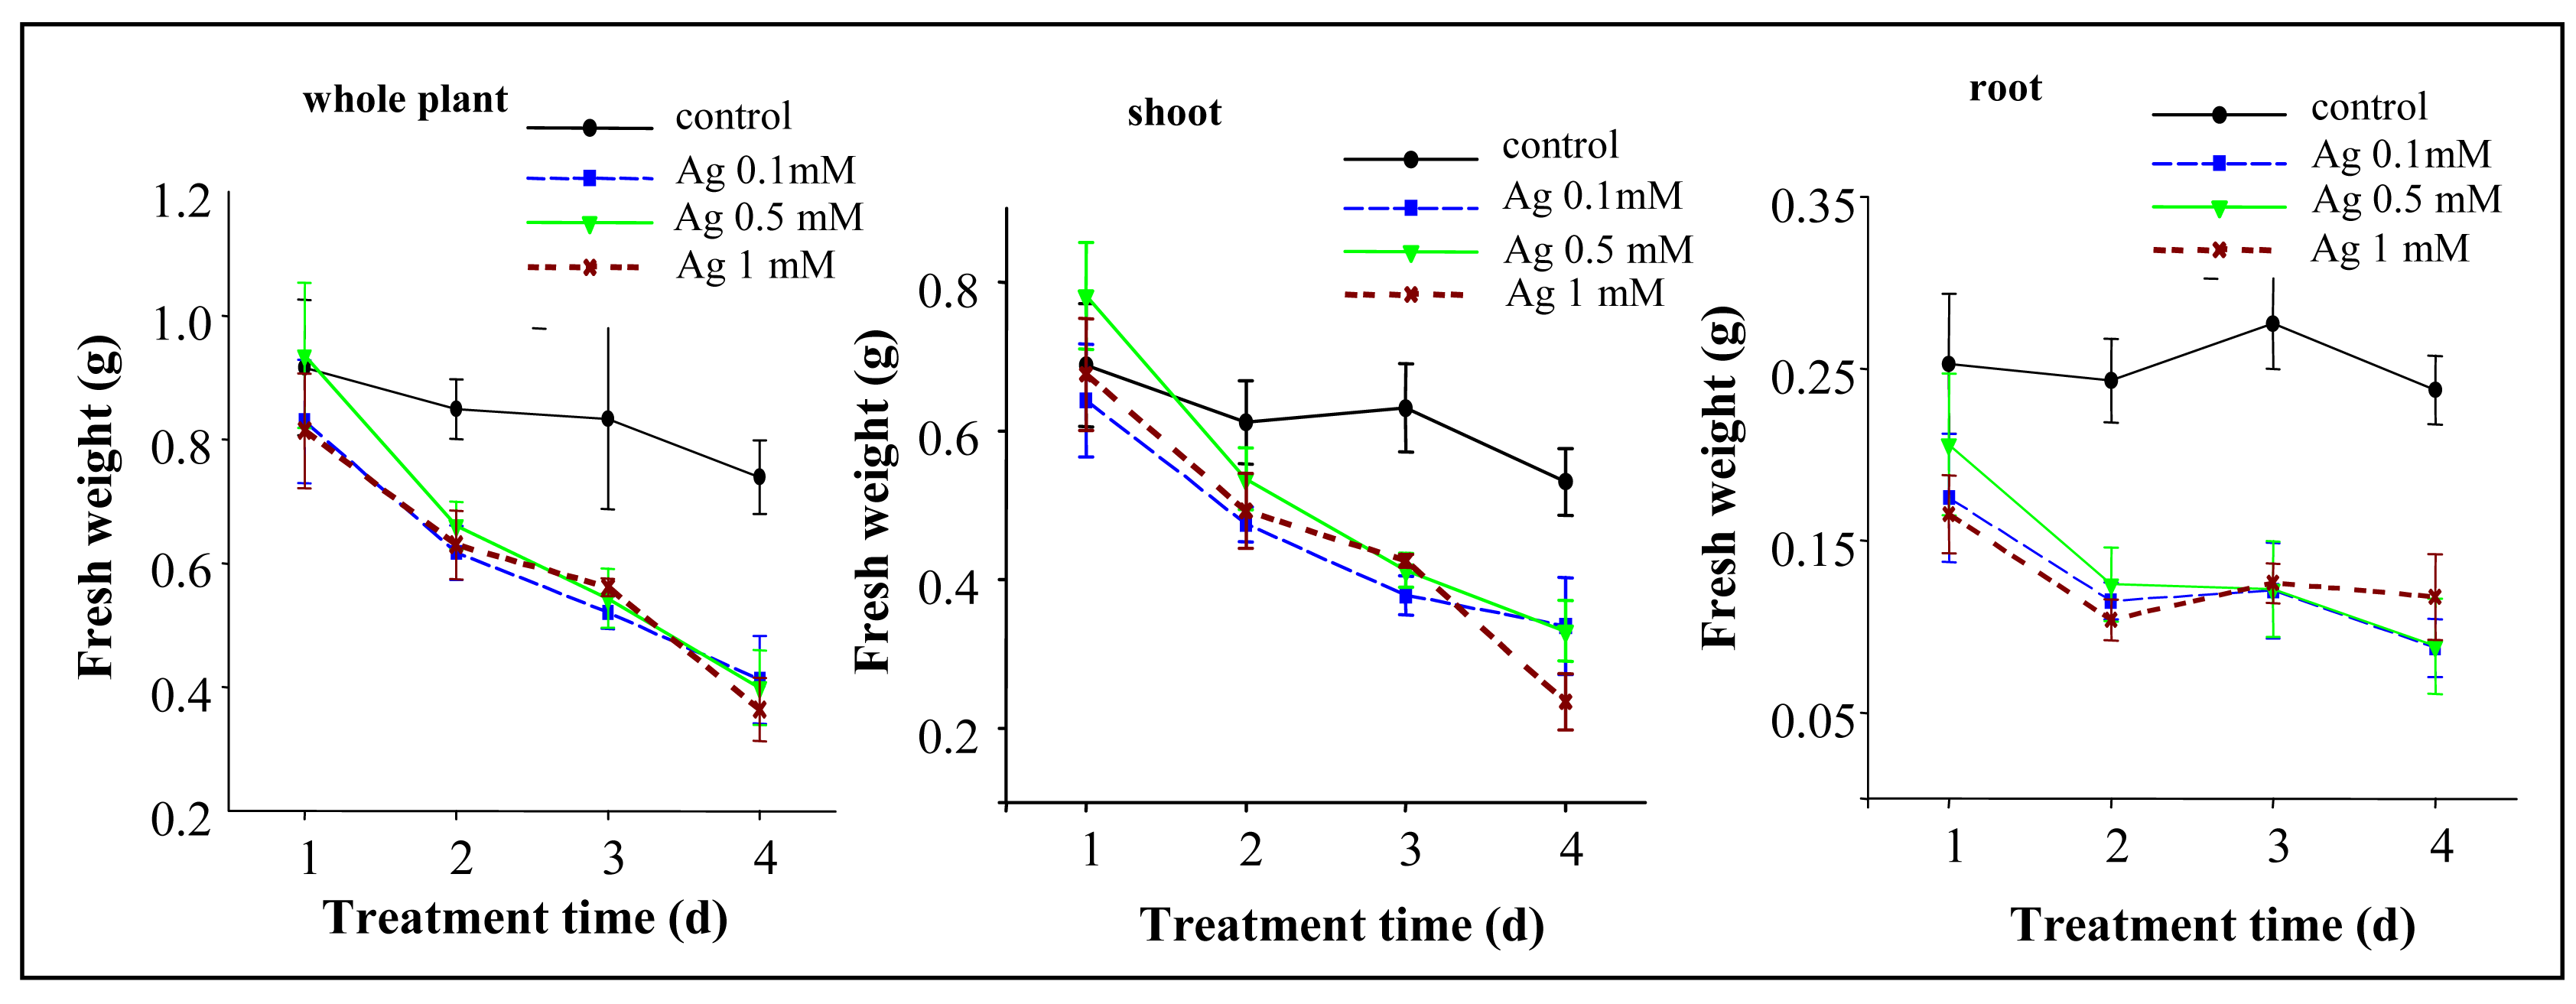
3.2 Changes in the treated plants fresh weight

At the end of each experimental day the part of the plants were harvested and weighed. Based on these results the growth curves were determined (Fig. 4). The control plants demonstrated moderate loss of fresh weight (Fig. 4 whole plant) because of their cultivation in distilled water without macro-and microelements supplement. This effect is mostly observable at shoots; root systems were more stimulated (Fig. 4). The influence of silver(I) ions on sunflower plants growth parameters was well evident. Rate of loss of plants fresh weight enhanced with the increasing silver(I) ions doses and with the time of the exposure. This effect was more evident at the shoot parts of the plants (hypocotyls, stems) in comparison with the root system. The decrease in the fresh weight is probably connected with an increase in a metabolic activity of the plants exposed to silver(I) ions due to very limited supply of inorganic as well as organic compounds needed for plant development. In addition we found that the content of chlorophylls (chlorophyll a and chlorophyll b) was lower in the plants treated with silver(I) ions compared to the control group of the plants. This indicates the damage of photosynthetic processes and the decrease of the total energetic metabolism of the plants treated with silver(I) ions.

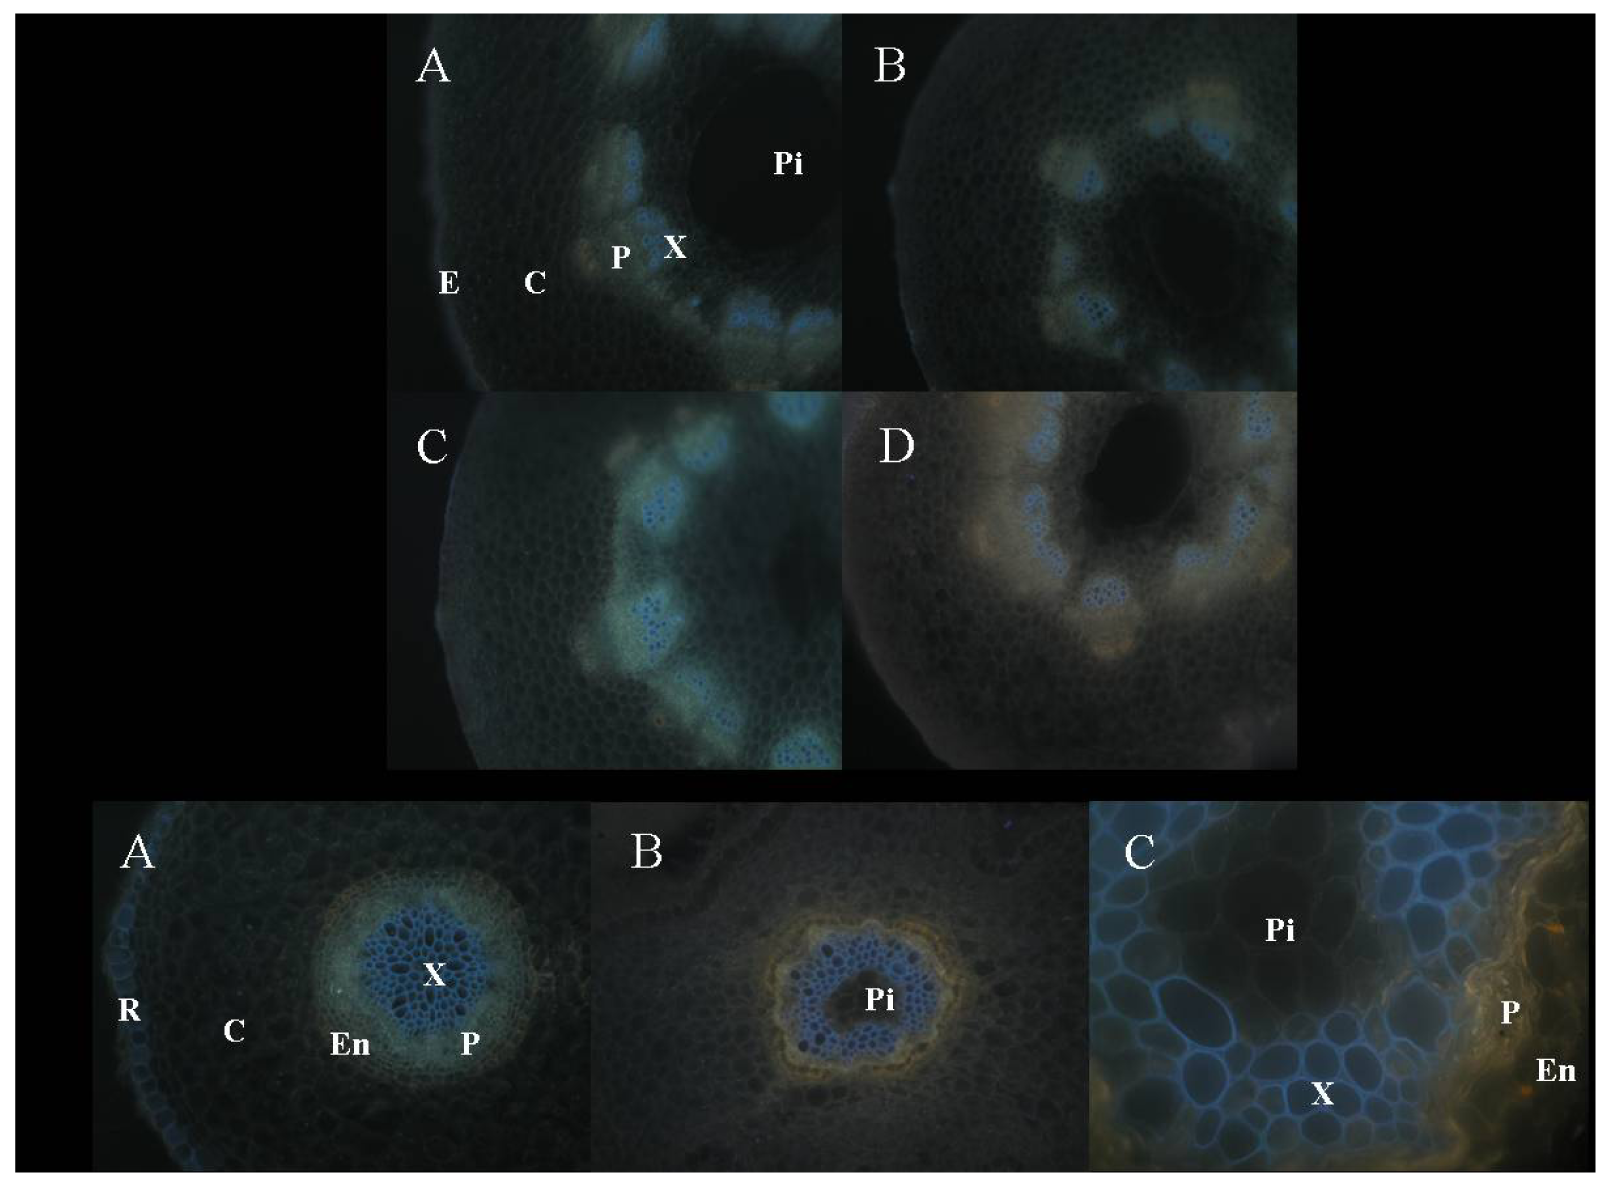
3.3 Anatomical changes of sunflower shoots (hypocotyls, stems) and roots

Using of autofluorescence of anatomical structures, such as lignified cell walls, it was possible to determine the changes of important shoot and root structures, mainly vascular bungles and development of secondary thickening. The differences in vascular bundles organisation, parenchymatic pith development in the root centre and the reduction of phloem part of vascular bundles are well observable (Fig. 5). The most important changes in hypocotyls anatomy were as follows: the increased robustness of cuticle, increase of lignification and suberinization of the cell walls of epidermis and outer cortex, and changes in new vascular bundles differentiation with increasing silver(I) ions dose. These hallmarks can be related to changes of water transport caused by silver(I) ions.
Very evident and characteristic changes were determined in root structure. With increasing silver(I) ions concentration the vitality of rhizodermal cells declined; rhizodermal cells early necrosed and were replaced by the cells of exodermis. Changes were well evident in the structure of stele, mainly in pith development. Deposition of silver in the pitch cell walls as well as in inner xylem parts was expressively evident in connection with increasing silver(I) ions concentration.

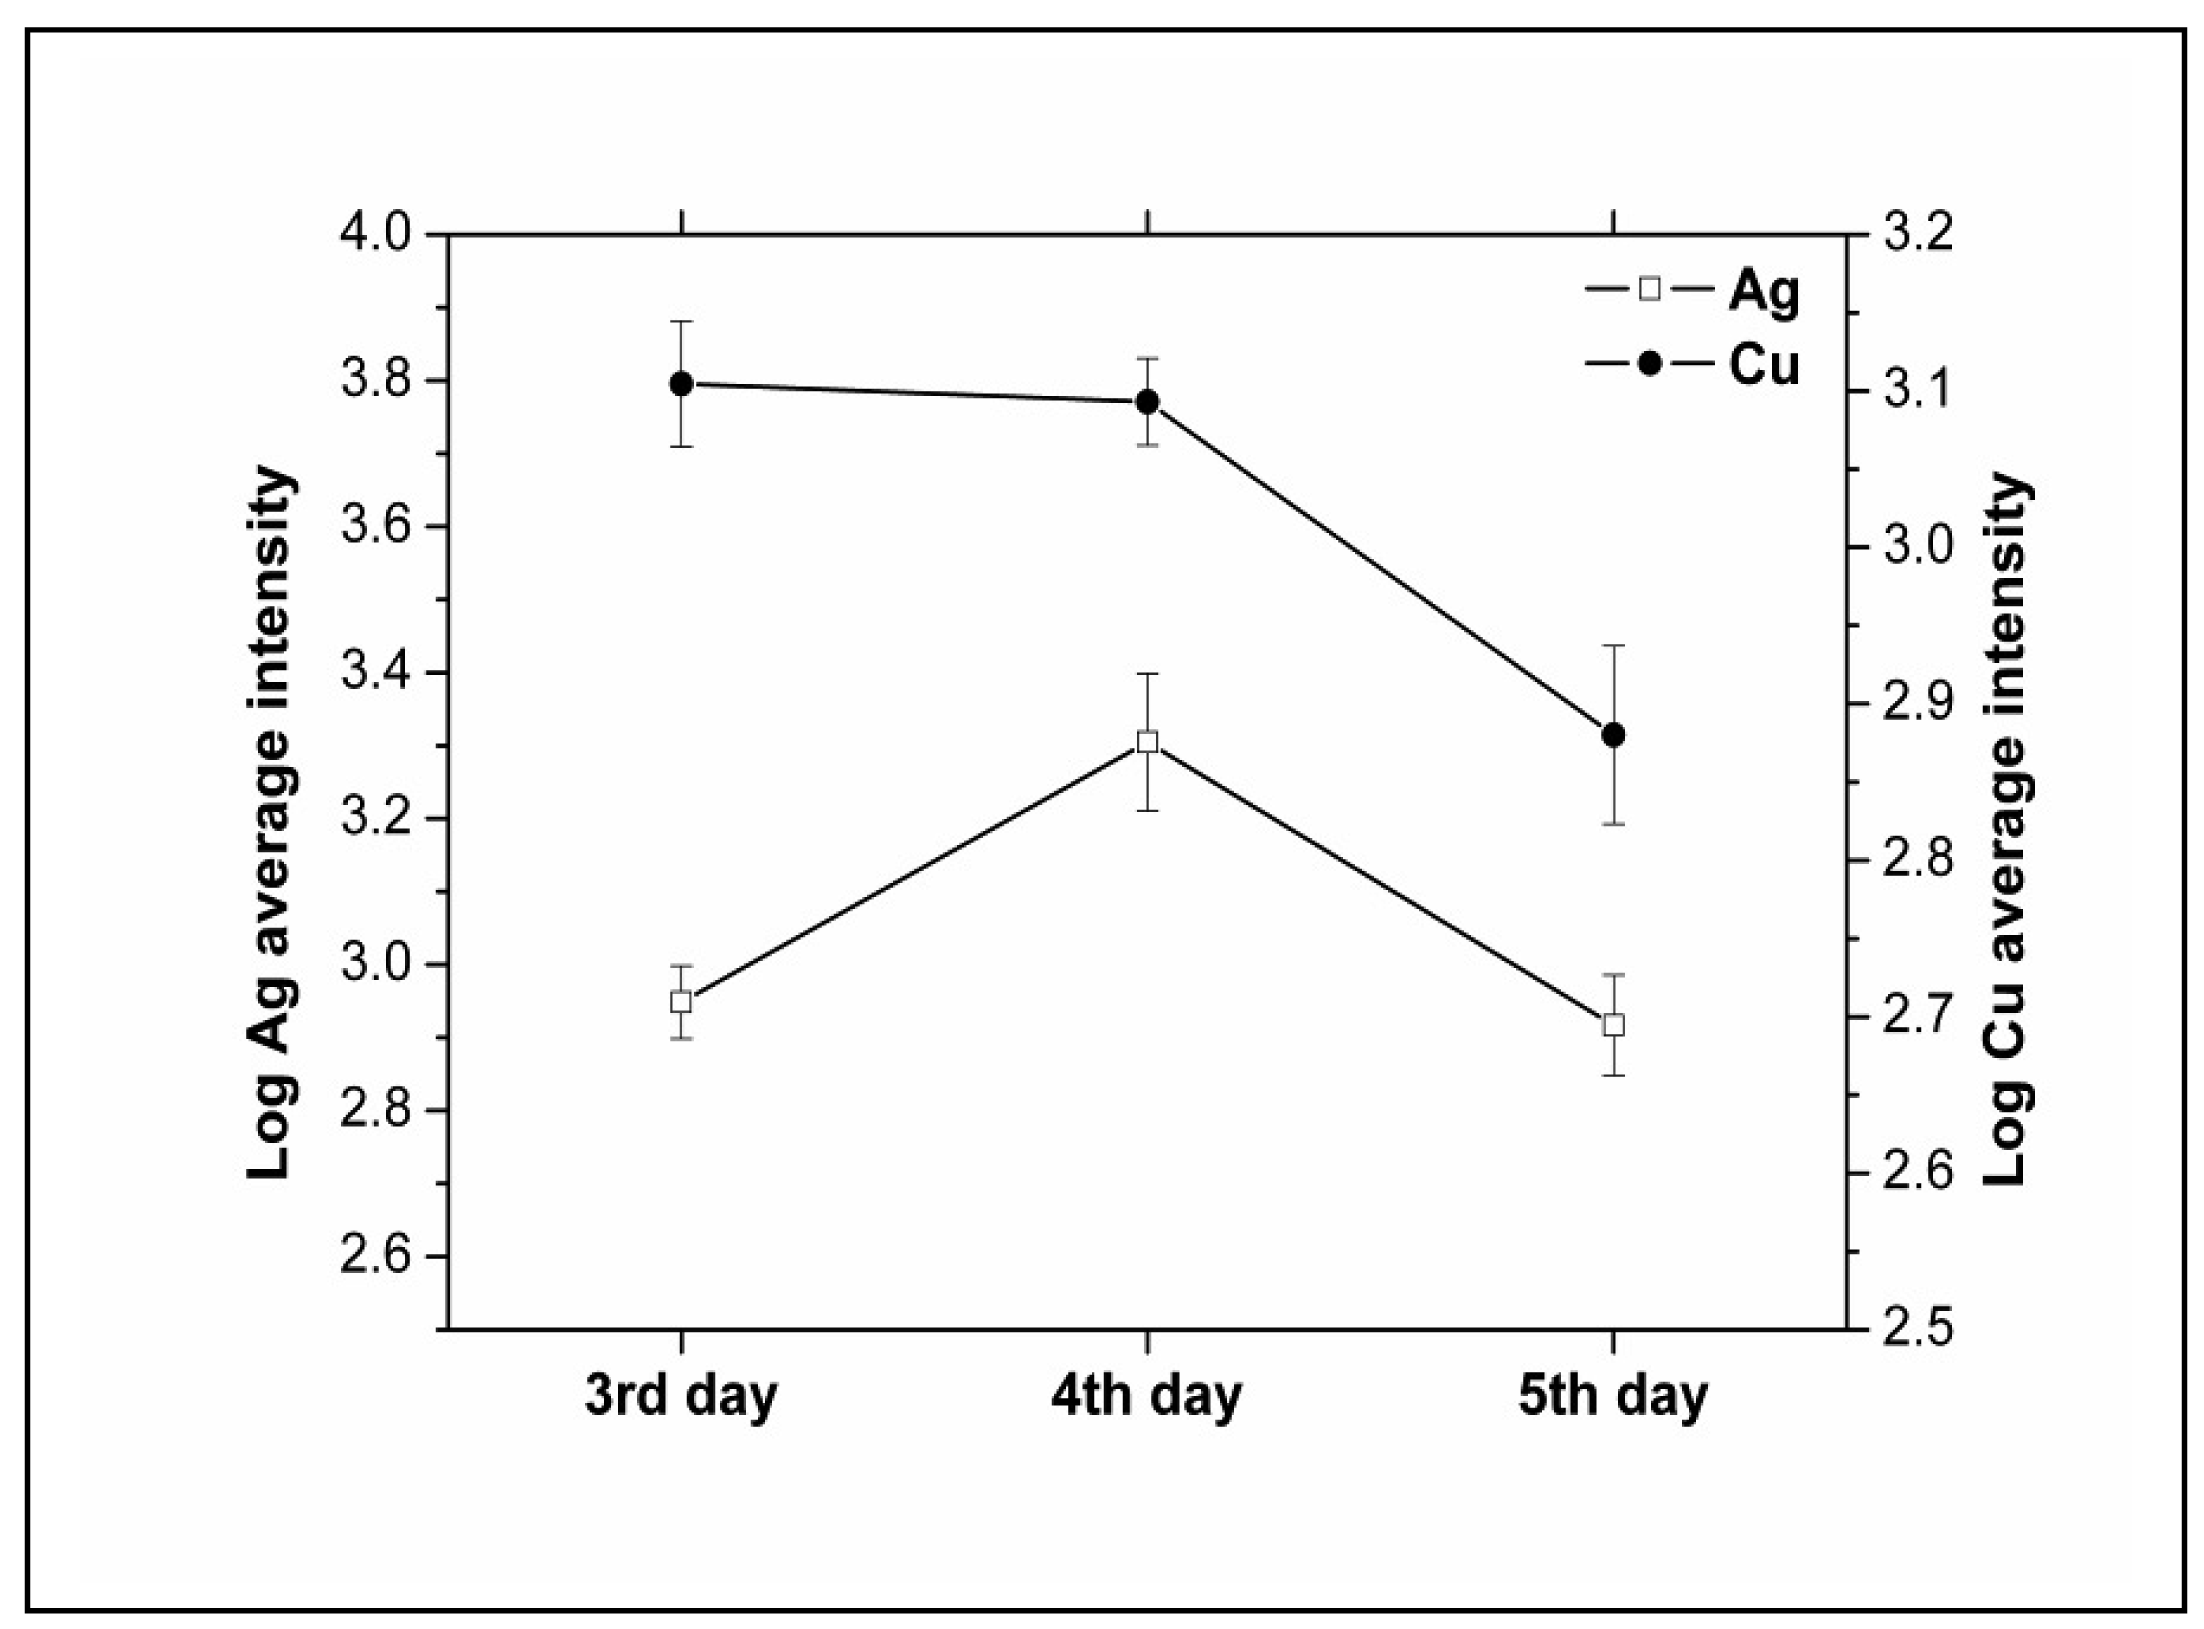
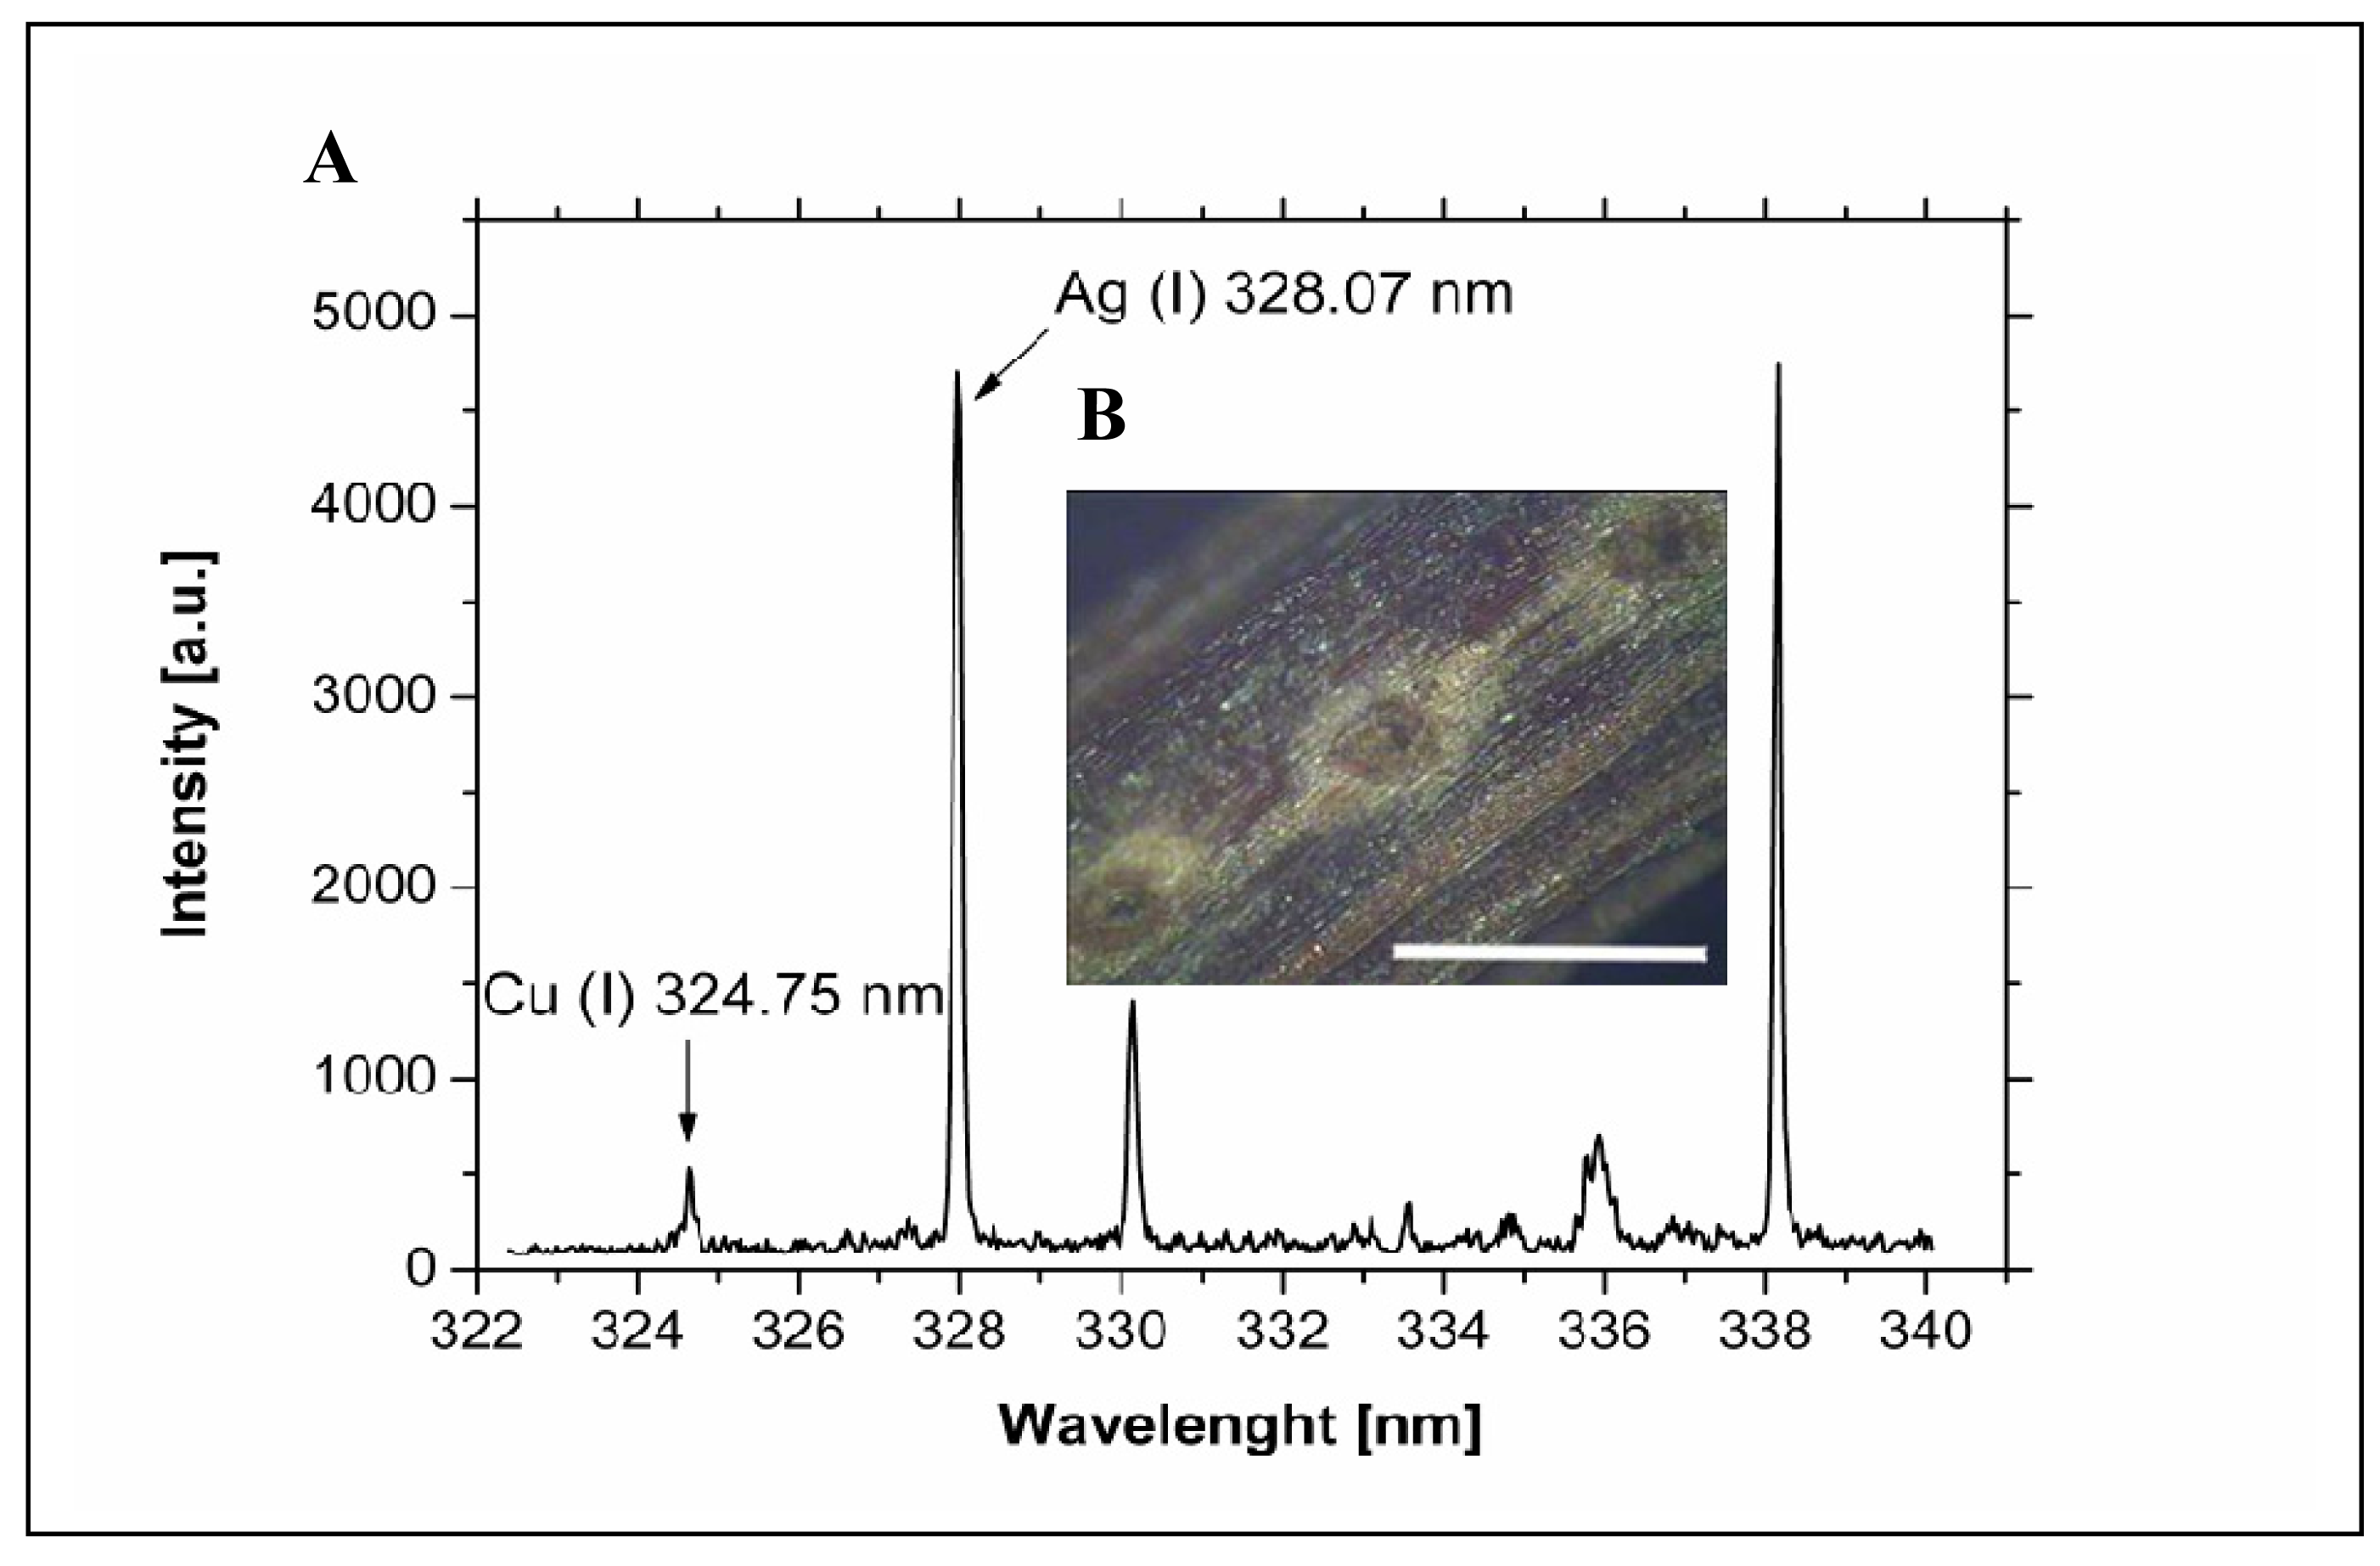
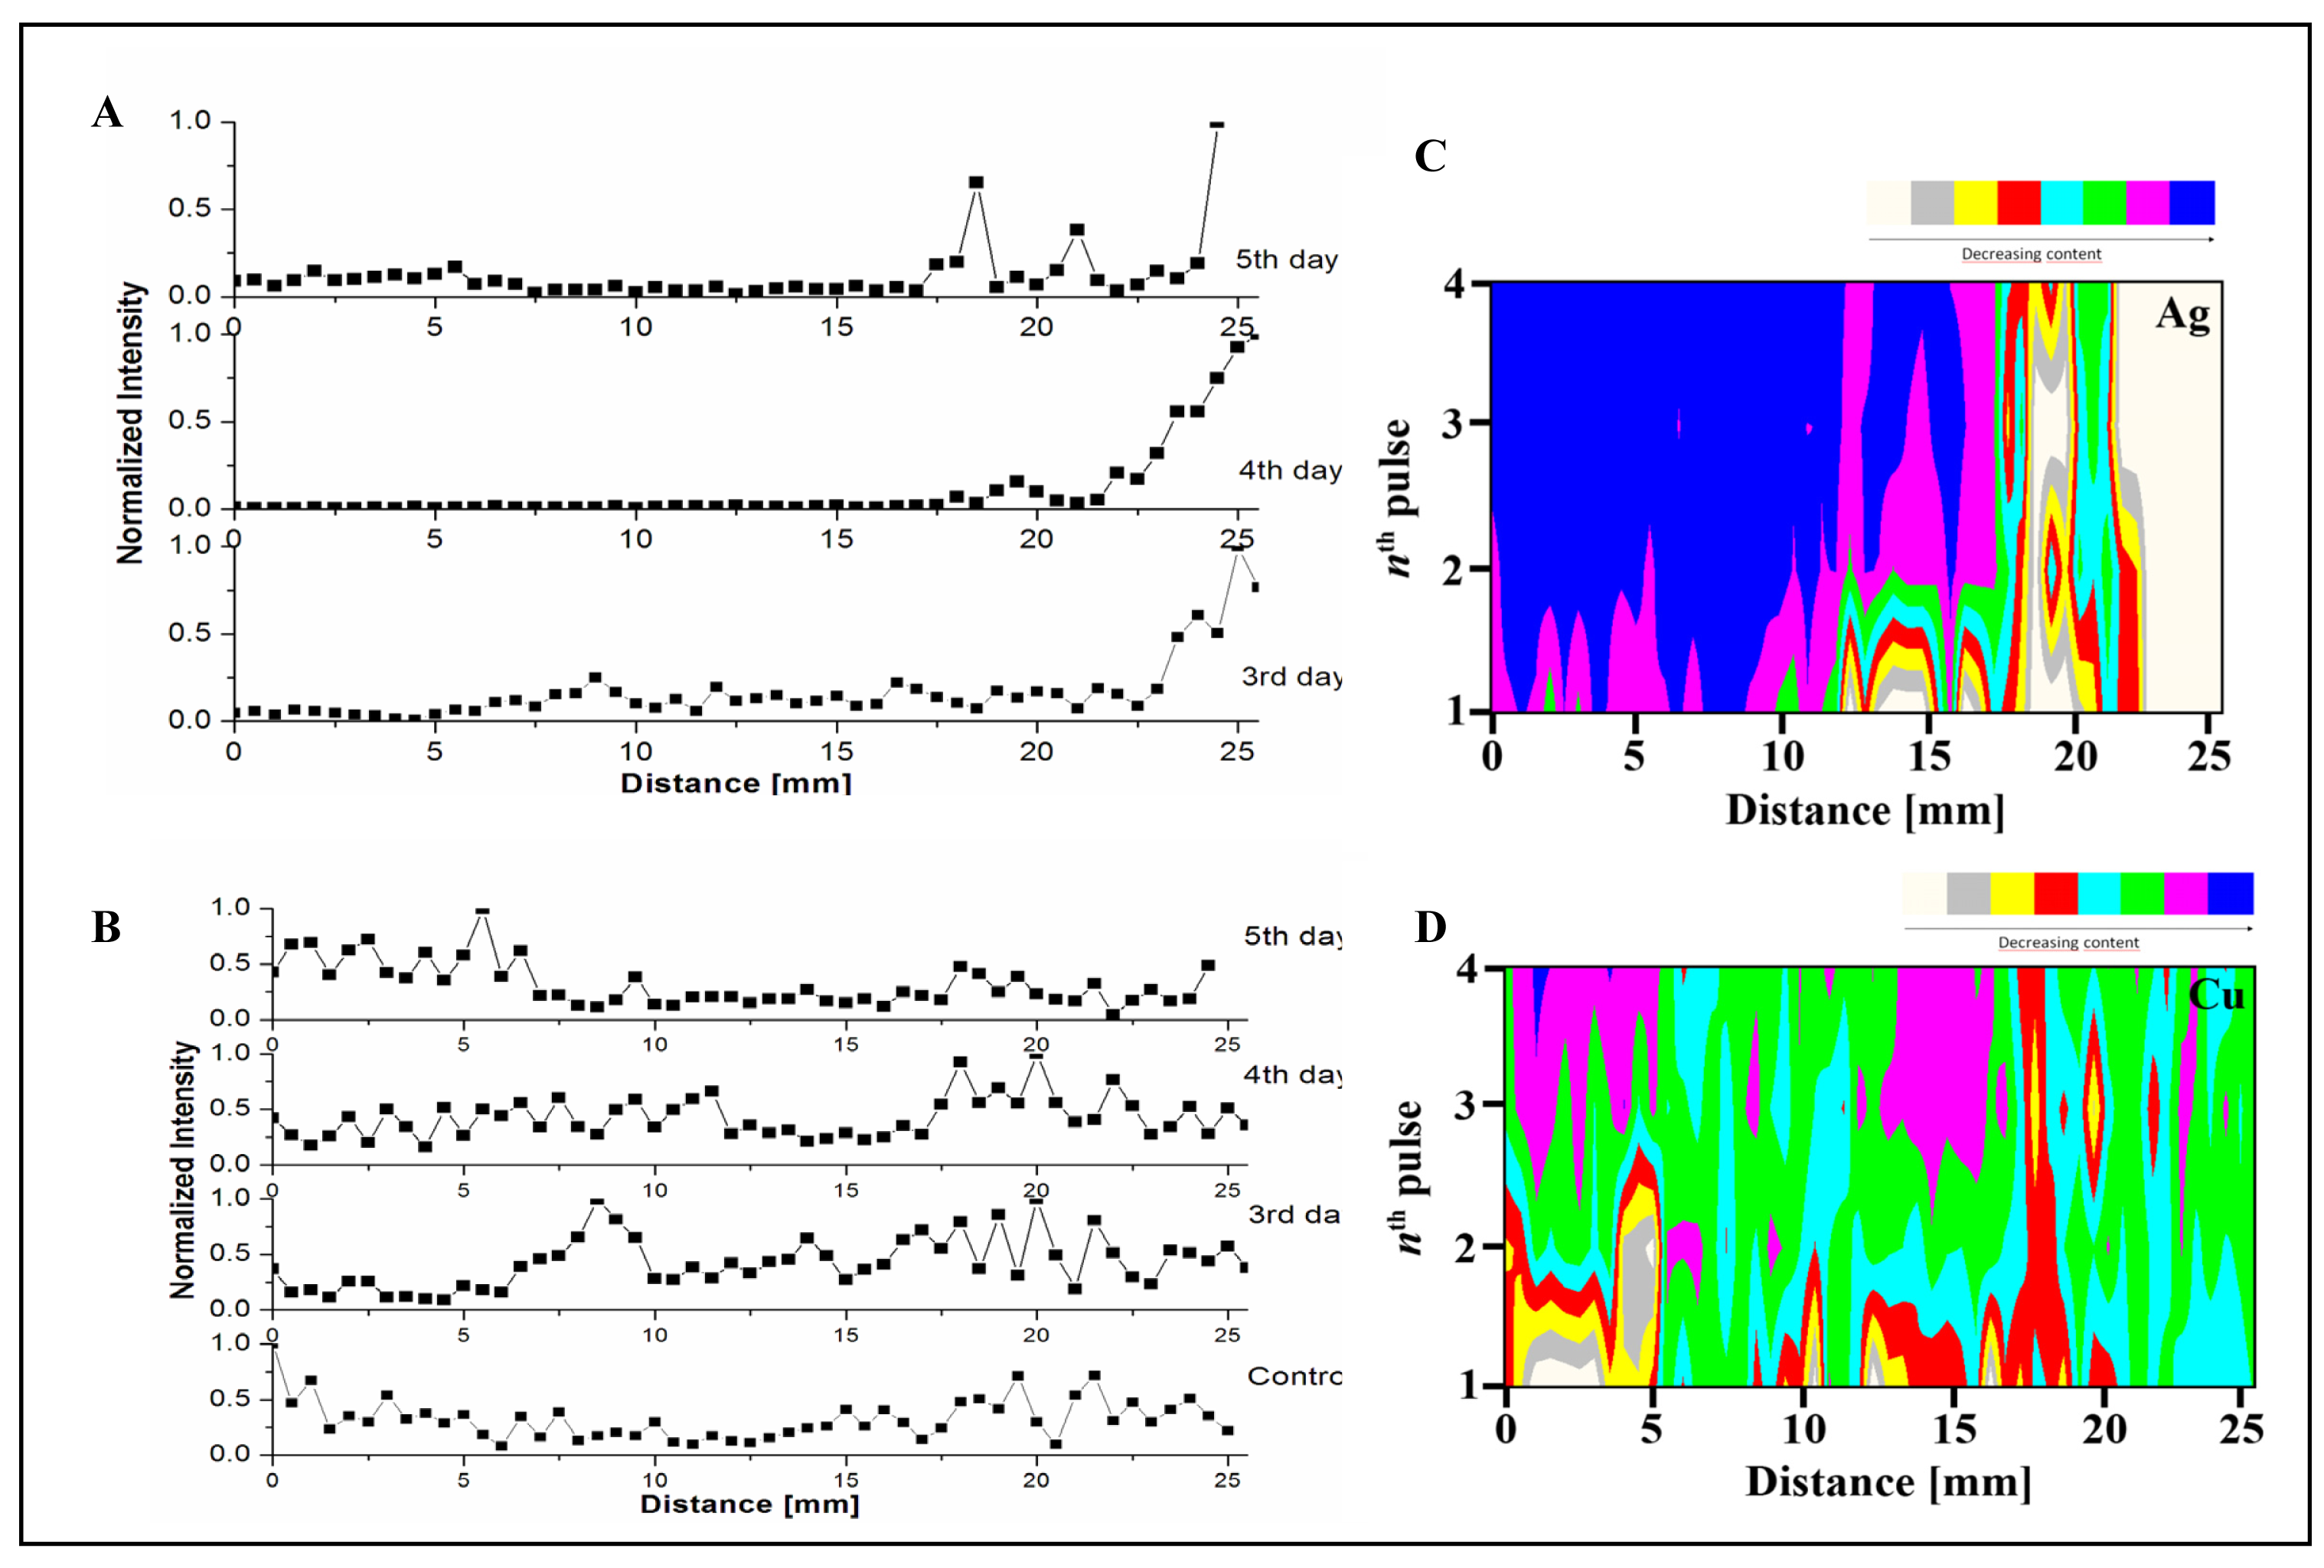
3.4 Spatial distribution of silver(I) ions in the plant tissues

Laser Induced Breakdown Spectroscopy (LIBS) is a simple spectrochemical sensor technology. LIBS utilises the emission of a high-temperature microplasma created by focusing a laser beam to the surface of the investigated sample. The spectrum of light emission is collected by a detector and its intensity at specific wavelengths is recorded [57]. The method allows real-time multi-element analysis in-situ and even remotely. The advantages of this method, i.e. usually none or very simple sample preparation, together with the capability of analysis with high spatial resolution [58] make it possible to utilize it in a wide-range of applications [57,58]. Basically, the achievable spatial resolution of LIBS is determined by the size of the laser craters produced within the material [57]. However, LIBS as a technique for simultaneous multi-elemental analysis is dating from the 1980s [59,60], as an emerging chemical sensor has picked up considerably during the past decade [57]. Recently, the LIBS was exploit among other for monitoring of accumulation of selected chemical elements in different structures of plant species [61-63].
The single-shot LIBS analysis was performed along the ∼25 mm long Helianthus annuus L. stem sections. The LIBS's ICCD detector was gated 1 μs after the Q-switch signal and the observation window was 10 μs. Typical LIBS spectrum is shown in Fig. 6aA), together with a photograph of LIBS ablation craters (Fig. 6B). For Ag and Cu detection the 328.07 nm Ag(I) and 324.75 nm Cu(I) lines were used, respectively. For the mapping the background was subtracted (for each shot) and the area under the selected peak (for appropriate chemical element) was calculated.
Figure 6 demonstrates the capability of LIBS to signalize the trends in accumulation of different elements in selected structures of the sample. To trace the uptake of Ag and Cu in the investigated area of the leaf samples, a statistical analysis was carried out on the intensity data set from each sample. Because the measured intensity values had a log-normal distribution the average of the logarithm of intensity values was calculated [64]. From these data we found that in the leaves of the plants the overall Cu content follows the changes in the Ag content.
The distribution of Cu and Ag along the stem sections for different days of treatment is shown in Figs. 7 and 8. The LIBS analysis was finished on the closer part of stem towards the root system (position ∼25 mm on the sample). These graphs clearly demonstrate the advantage of the spatially-resolved LIBS analysis. While the overall content of the Ag and Cu follows each other (Fig. 7), the spatial distribution of these elements is different. The Ag is accumulated mainly in near-root part of the sample (Fig. 8A), on contrary the Cu is spread more uniformly within the stem (Fig. 8B).
The possibility to utilize LIBS for 3D analysis of element distribution within the sample is examined in Fig. 8C,D. The different layers were monitored with four subsequent laser pulses. We should note that in spite to the fact that on the frame of this exploratory study the depth of ablation craters was not measured, the different distribution of elements within the analyzed layers is clearly observable. On the ongoing work an upgrade of the instrumental device for simultaneous LIBS – laser ablation inductively coupled plasma mass spectrometry (LA-ICP-MS) is planned. Utilizing such an apparatus, also the calibration for the main components will be possible, using selected calibration standards and measuring the depth of the ablation-craters.3.5 Biochemical indicators of environmental stress.

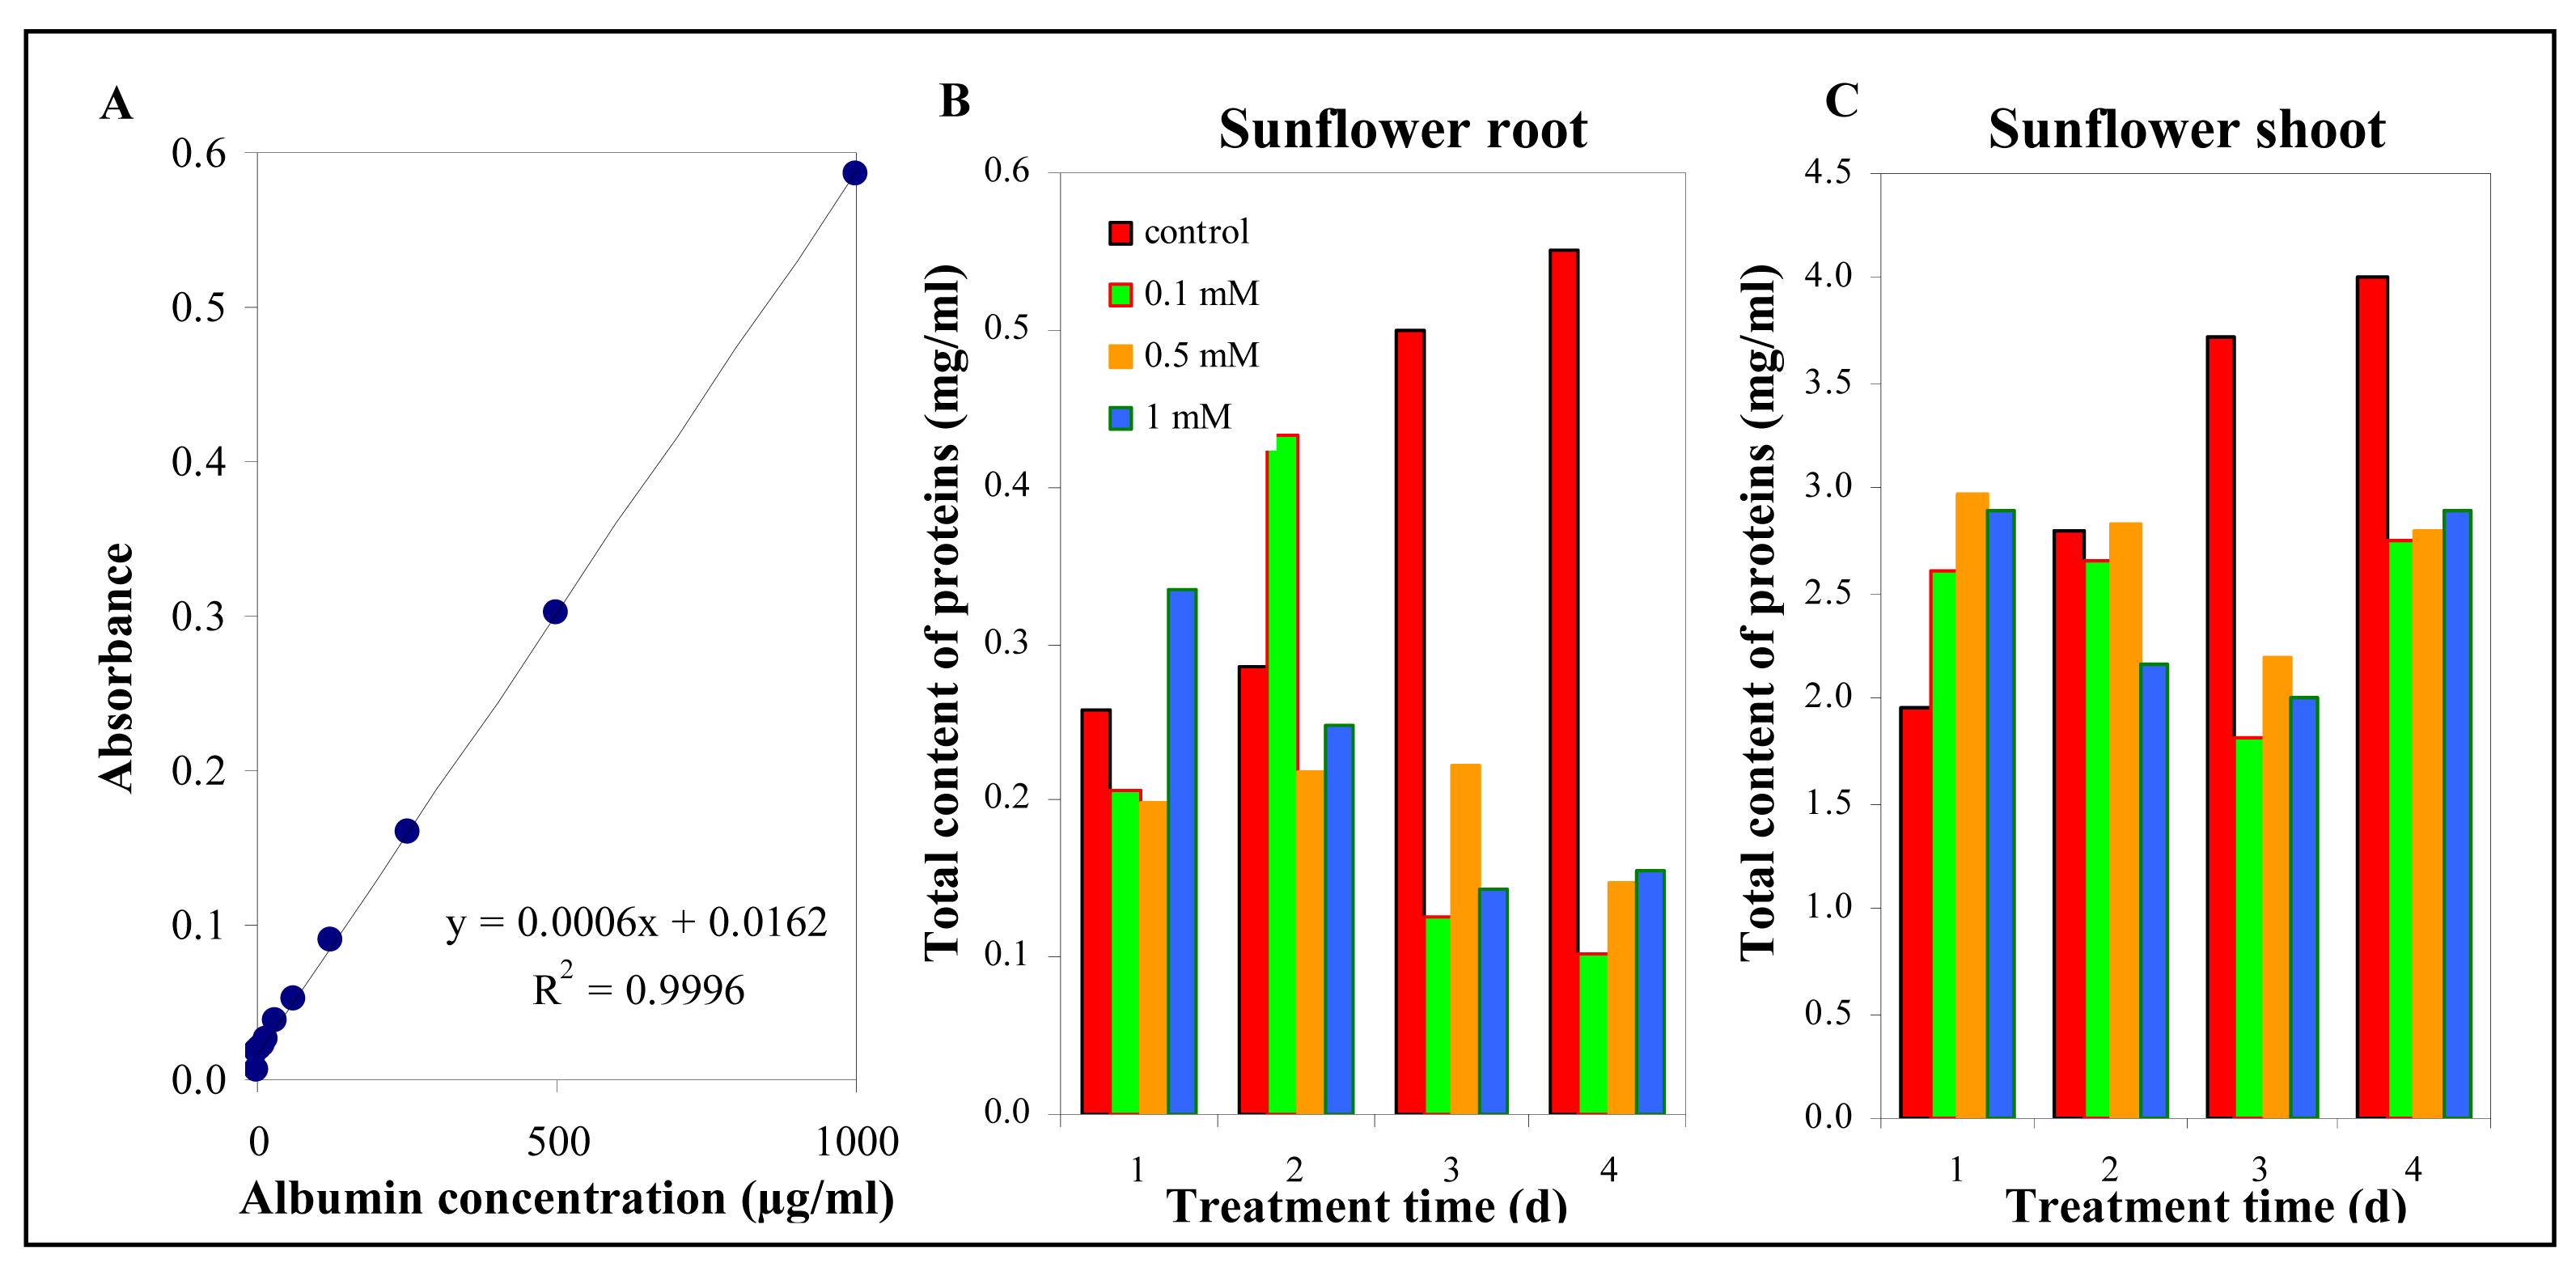
3.5.1 The total protein content

At the plants treated with silver(I) ions the changes were observable also in total content of proteins determined using biuret reaction. For this purpose automatic analyzer BS-200 was used. The calibration curve obtained (albumin was selected as standard) was strictly linear within the range from 1 to 1000 mg/ml (Fig. 9A). The level of water soluble proteins was markedly lower in root system, where also the difference between control plants and plants treated with silver(I) ions was mostly distinctive. In addition the total content of proteins expressively decreased with increasing silver(I) ions dose and the time of the treatment (Fig. 9B). Shoots of sunflower plants demonstrated less distinct proteins content in plants treated with silver(I) ions in comparison with root system (Fig. 9C). As we compare the results obtained by protein analysis – the total protein contents in shoot as well as root parts – we can assume on the transport of the proteins from the roots to shoots. This phenomenon can be related with the cascade of processes connecting with photosynthesis.

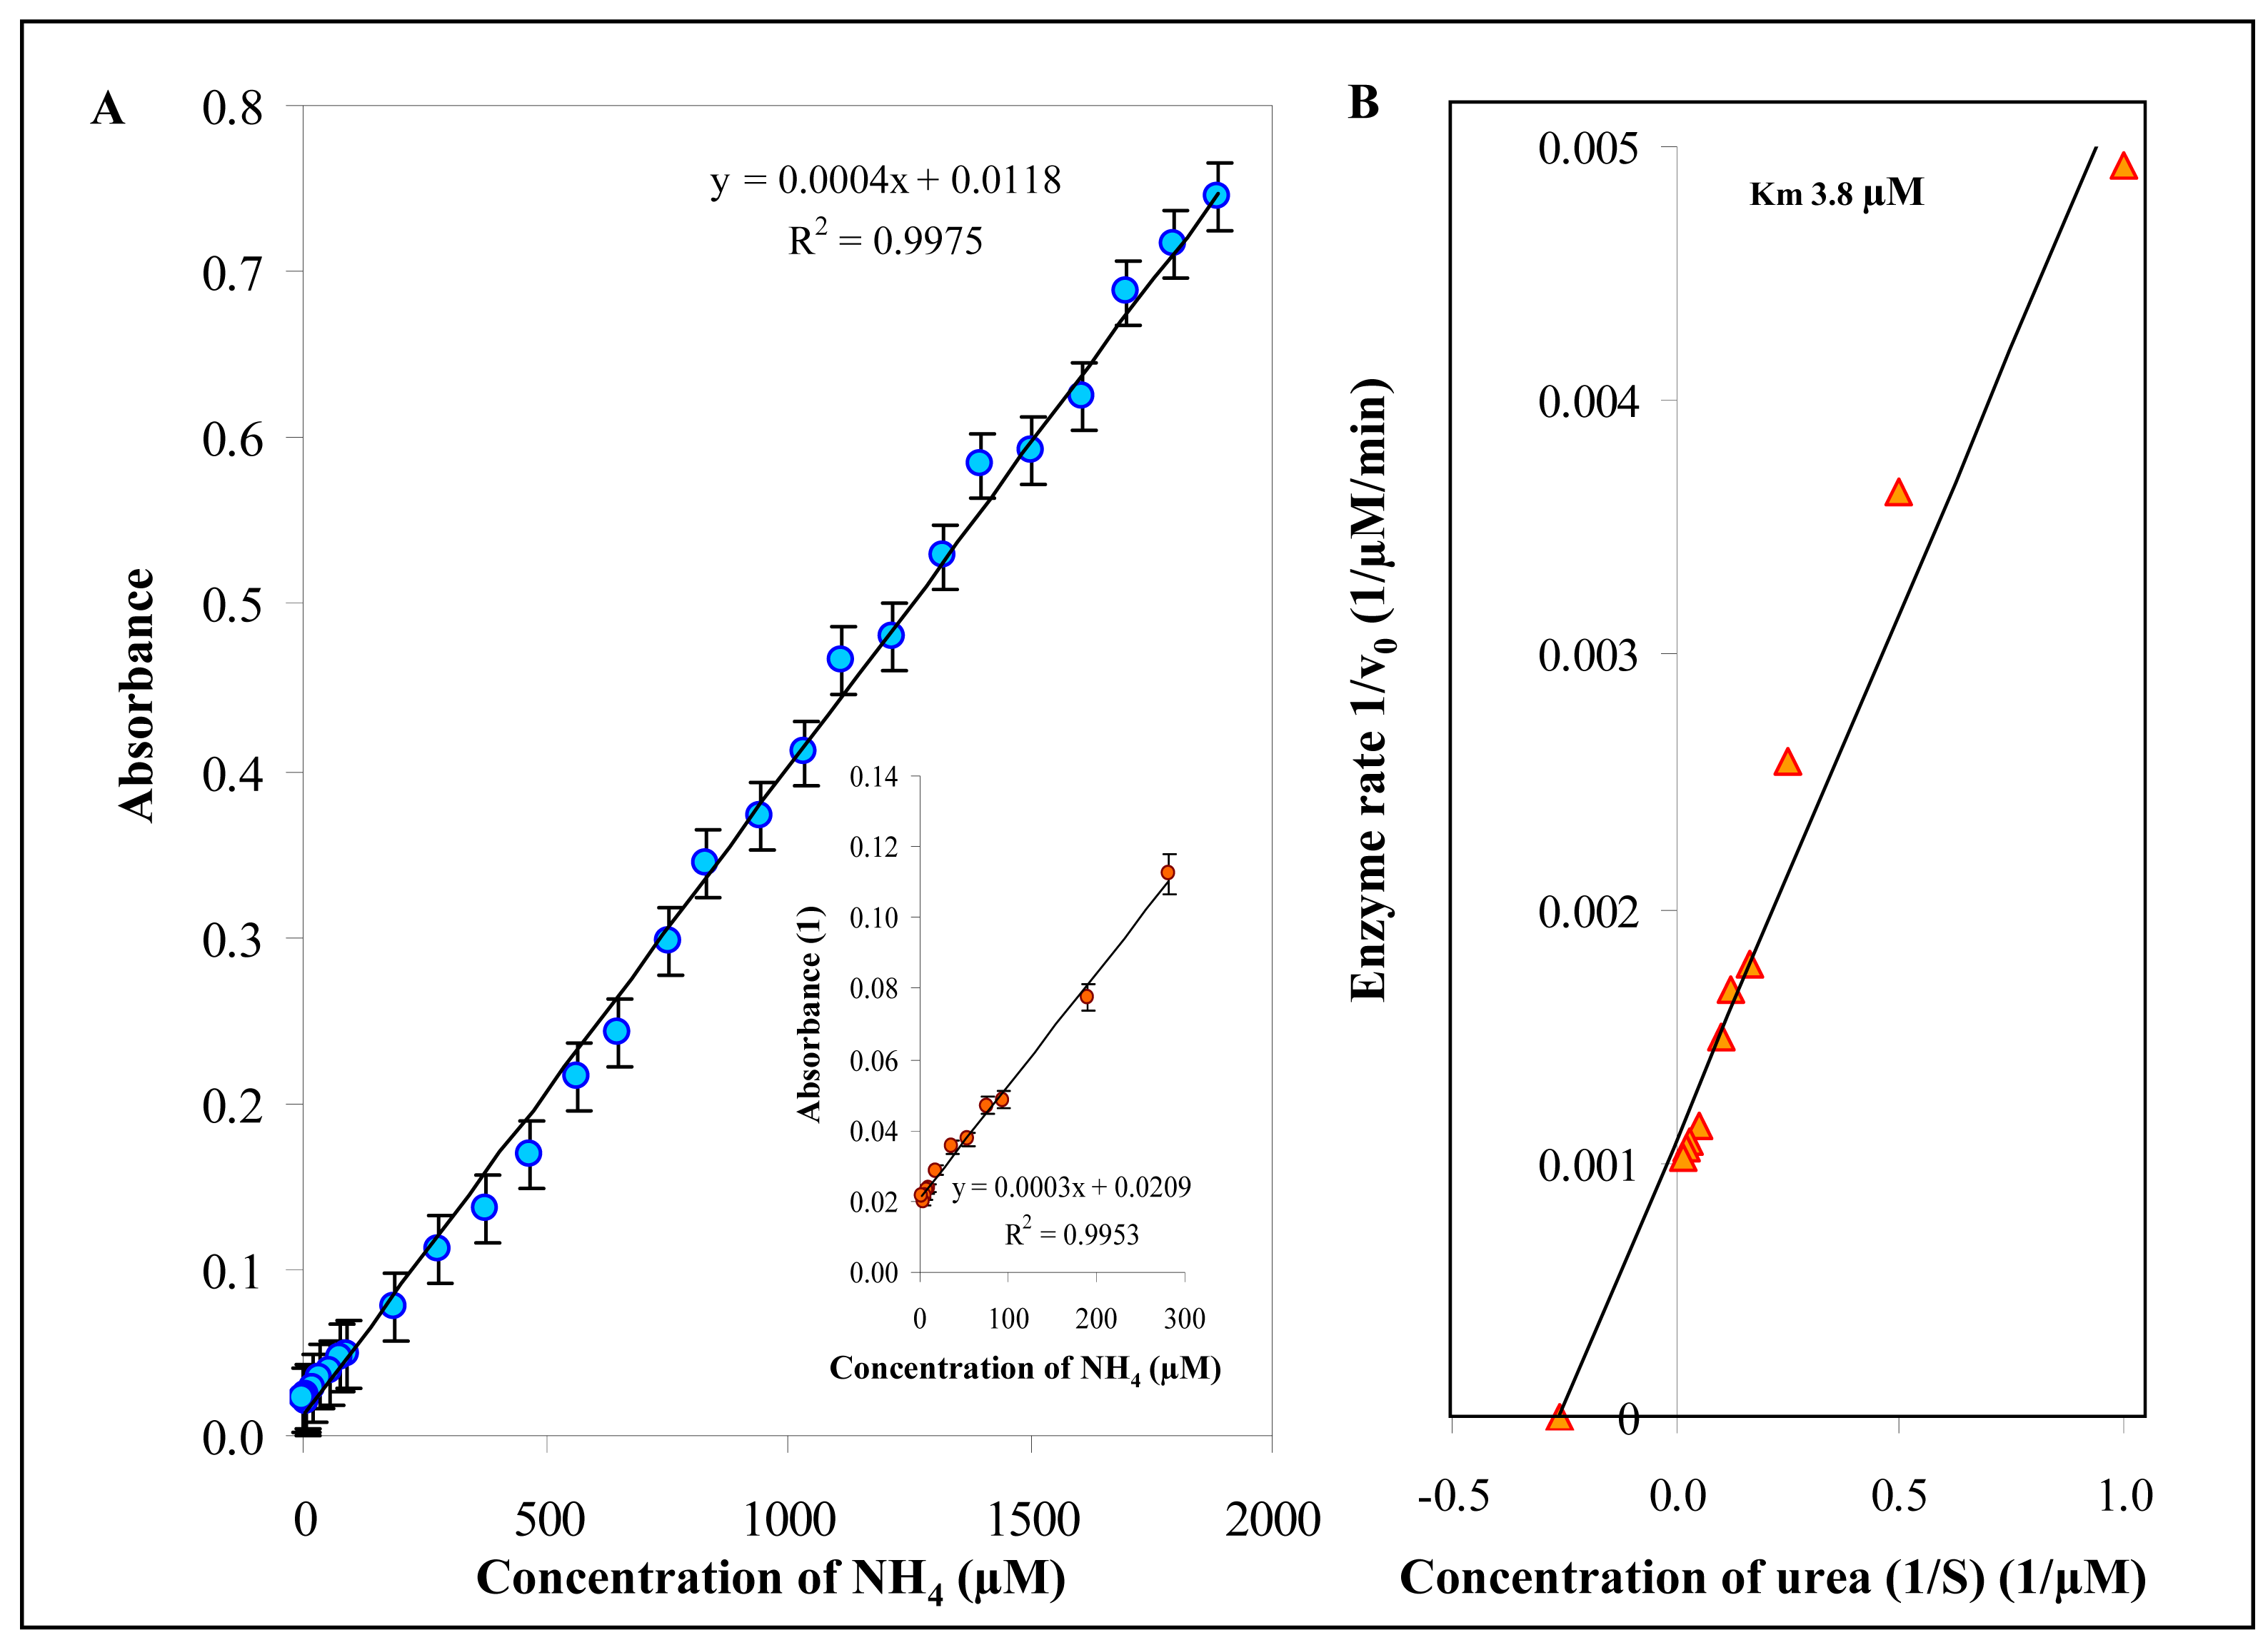
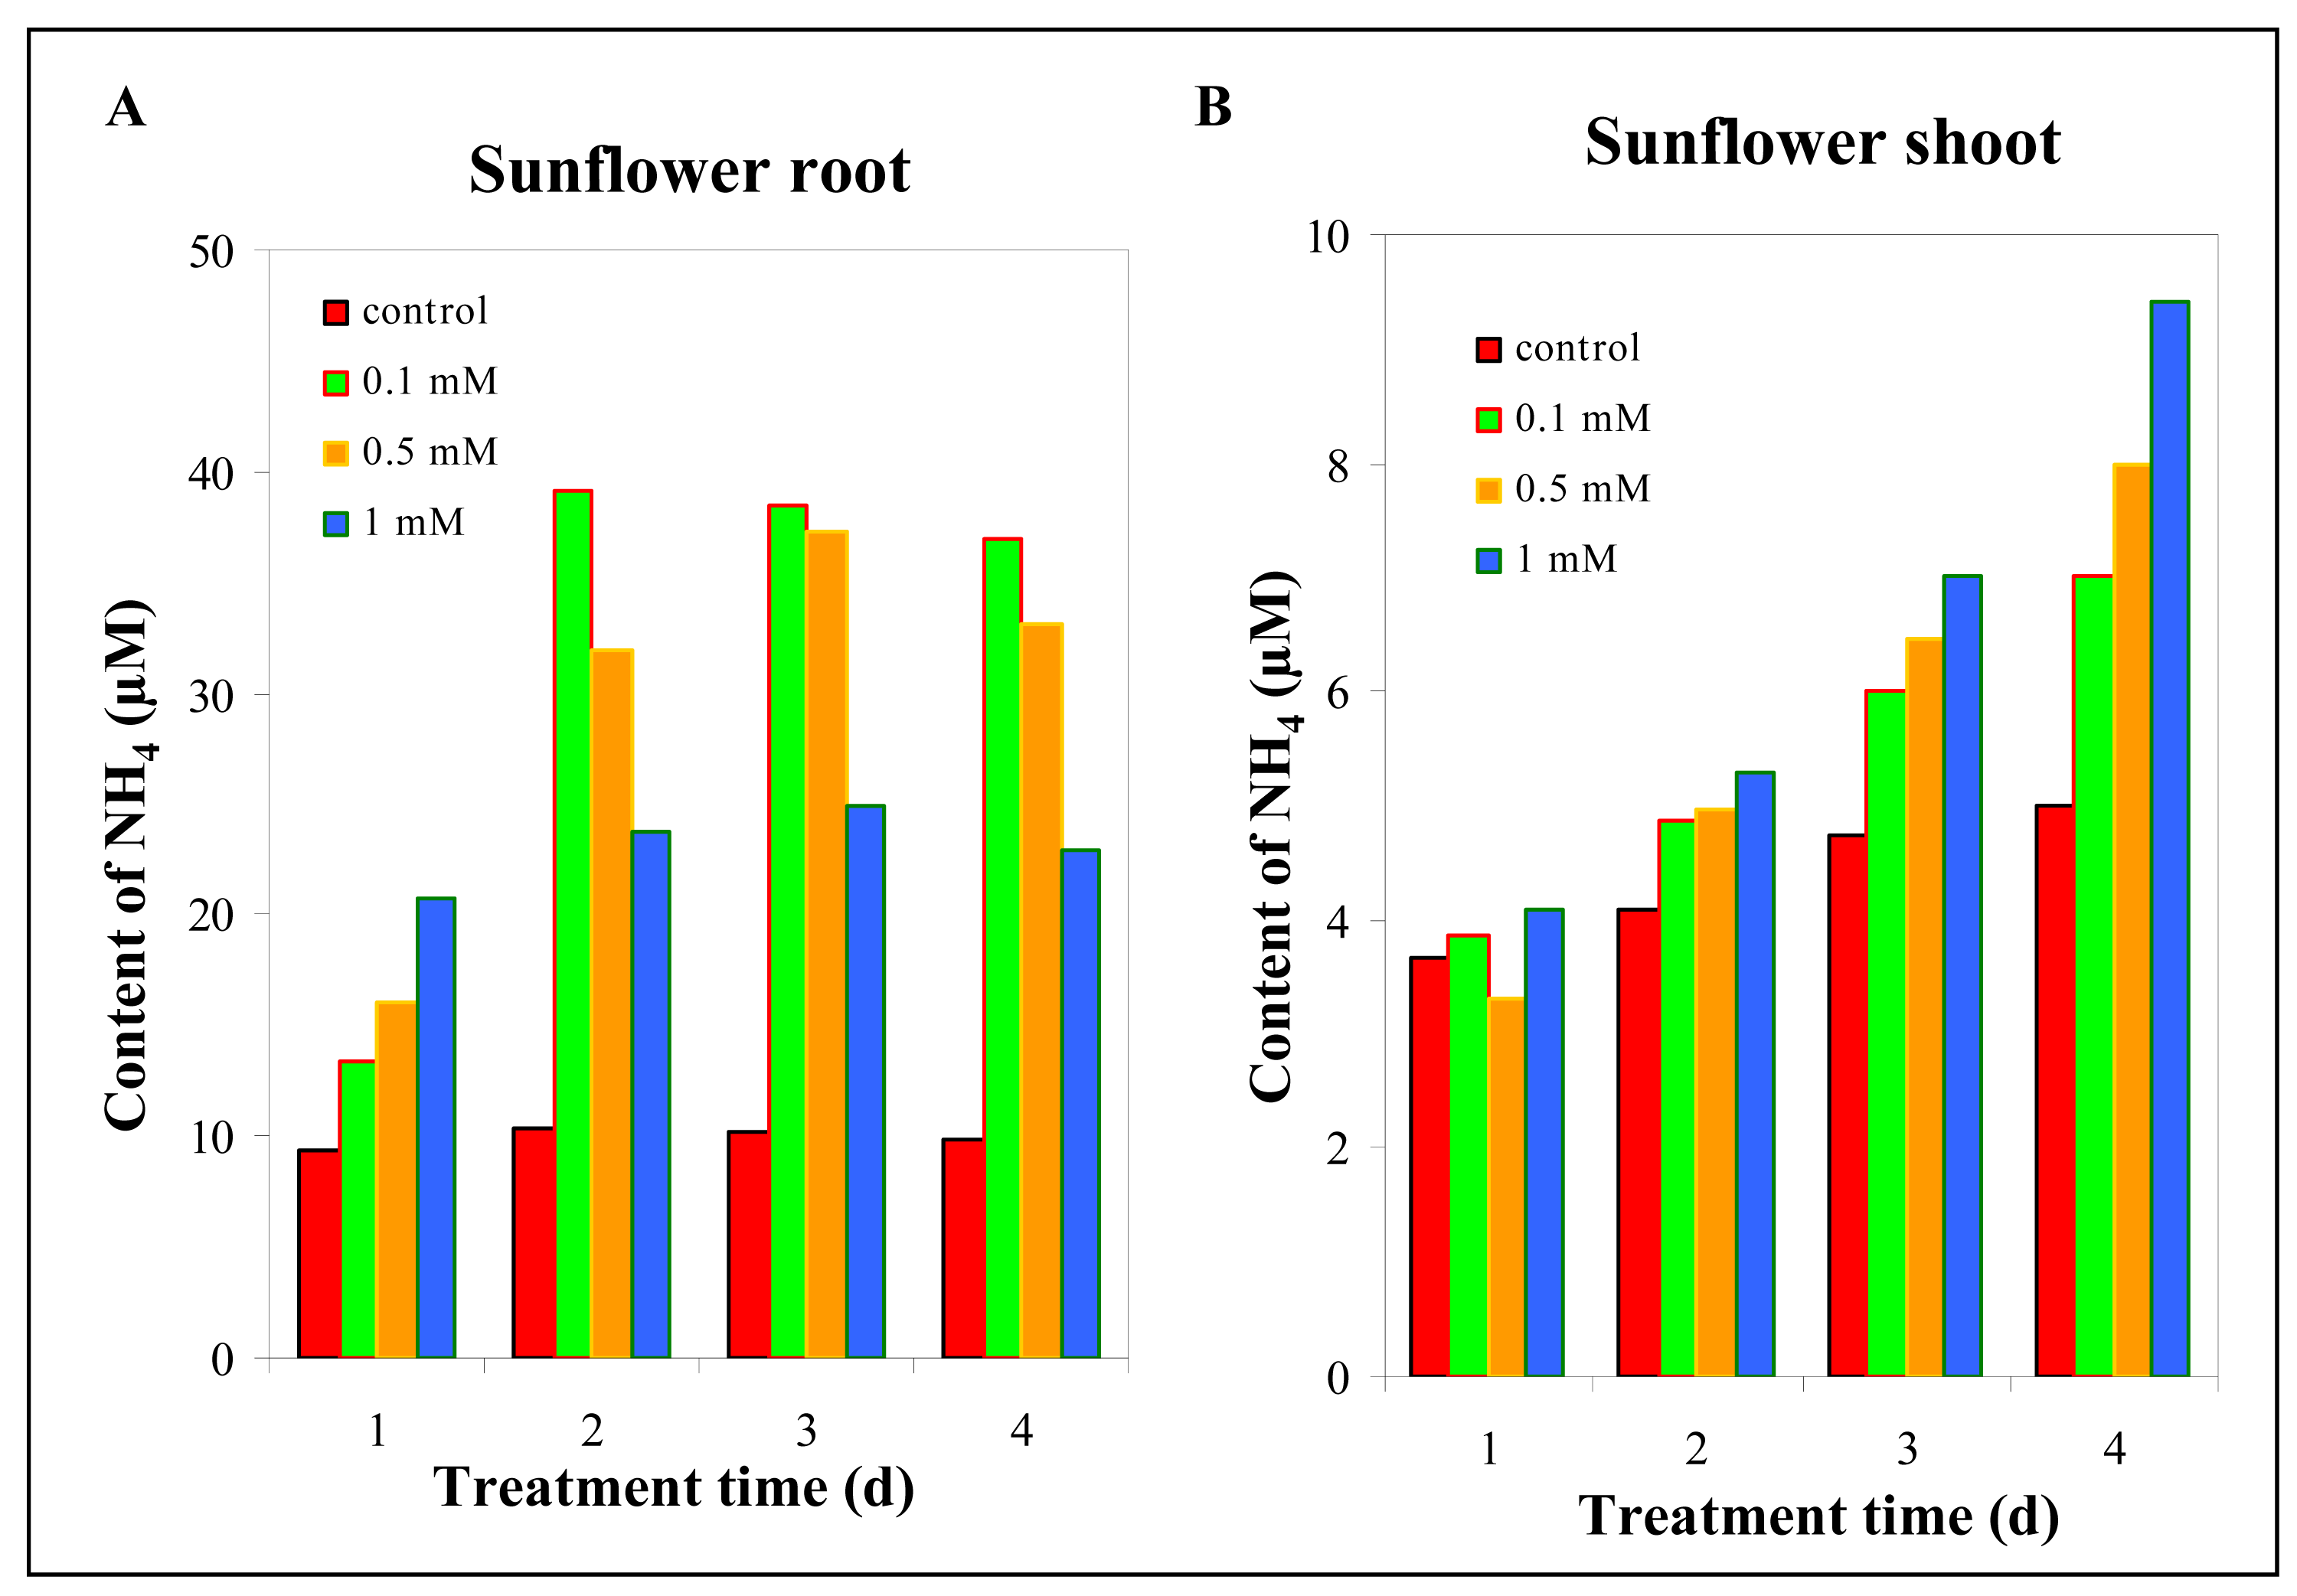
3.5.2 Urease activity

One of the crucial plant enzymes, which are extremely sensitive to presence of heavy metals ions, is urease. Due to this feature the number of different biosensors to detect heavy metals was proposed [65,66]. All experiments appear from enzymes that are very carefully purified. However investigation of enzyme activities for environment pollution assessment is also interesting. Sunflower plants demonstrate measurable level of urease activity. Because of this fact we aimed on the monitoring of urease activity. For our purposes the methodology enabling urease activity determination using automated detection was optimised. Automated spectrophotometric analysator BS-200 was used. The principle of this method is based on the fact that urease decomposes carbamide into ammonia that is subsequently detectable as coloured product [65,67]. The strictly linear calibration curve is shown in Fig. 10A. Relative standard deviation was about 1.5 % and the analysis of 40 samples was realized within 30 min. For the examination of the activity of enzyme urease under our experimental conditions enzyme kinetic was observed. The measurements resulted in Michaelis-Menten constant Km 3.8 μM (Fig. 10B).
Sunflower plants demonstrated higher urease activity in root system in comparison with shoots (Fig. 11A,B). The activity in roots was app. five times higher compared to shoots. If we compared the activity in treated plants with control, we found out that presence of silver(I) ions markedly enhanced the activity of urease at all applied doses of this toxic metal.

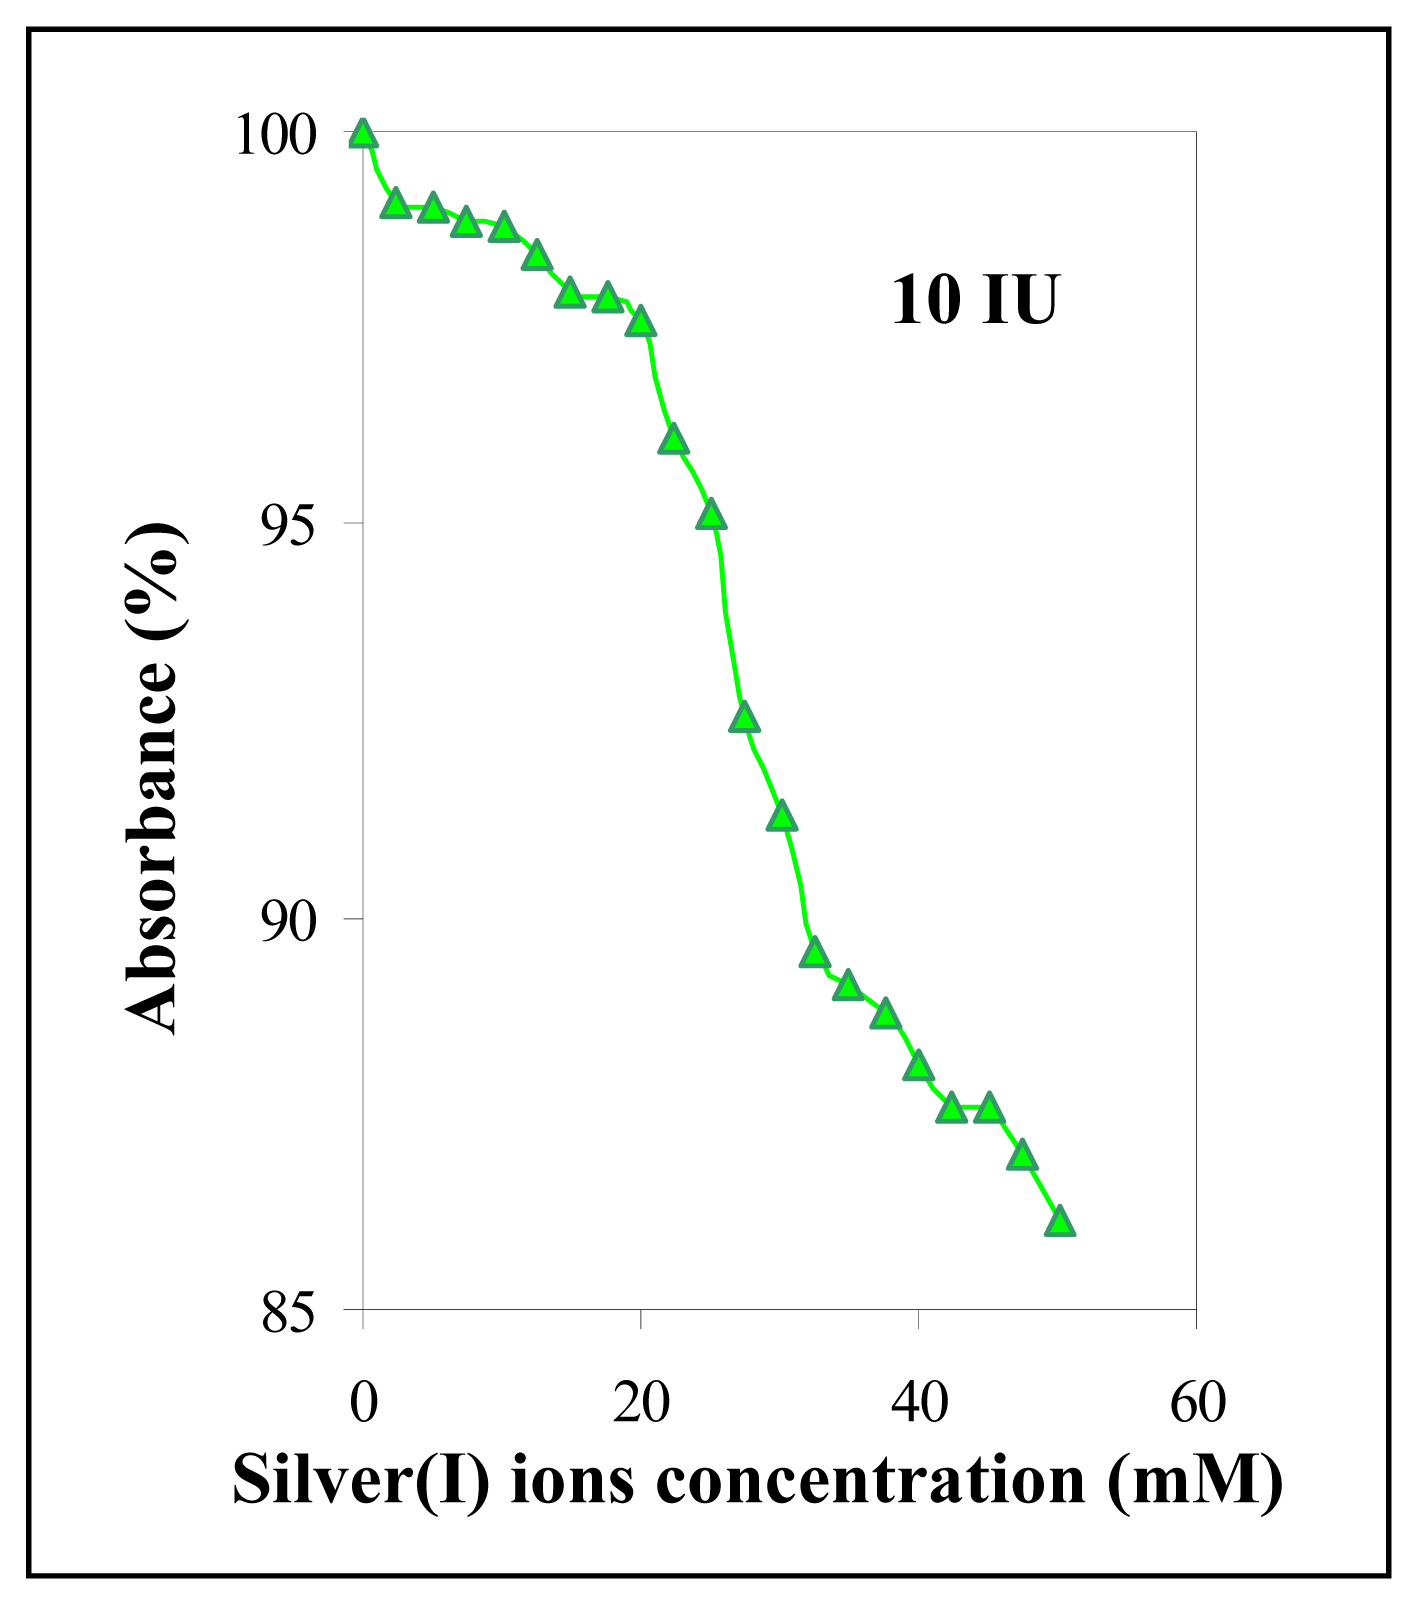
3.6 The changes of urease activity in the presence of silver(I) ions

In addition we were interested in the issue how can the presence of silver(I) ions influence the activity of purified urease. Into the solution of urea (1 mM) silver(I) ions at final concentrations 0; 5; 10; 15; 20; 25; 30; 35; 40; 60; 80 and/or 100 μM were added. To this solution urease (10 IU) was added and mixture was incubated for 60 s at 37 °C under shaking (300 rpm). The samples were analysed using procedure described above. Urease activity was inhibited by silver(I) ions; concentrations higher than 20 mM quickly led to reduction in urease activity (Fig. 12).

4. Conclusion

The plants would be used as simple bioindicators of the quality of environment [68-73]. However it is absolutely necessary to understand some physiological processes that are connected with the plant response on stress. The data obtained are, despite of this fact, very encouraging to perform deeper research in this area.

Acknowledgments

We gratefully acknowledge the Grant Agency of the Czech Republic (grant No. GA CR 526/07/0674) for financial support to this work.

References

  1. Galvez, F.; Hogstrand, C.; McGeer, J.C.; Wood, C.M. The physiological effects of a biologically incorporated silver diet on rainbow trout (Oncorhynchus mykiss). Aquat. Toxicol. 2001, 55, 95–112. [Google Scholar]
  2. Davis, A.; Drexler, J.W.; Ruby, M.V.; Nicholson, A. Micromineralogy of Mine Wastes in Relation to Lead Bioavailability, Butte, Montana. Environ. Sci. Technol. 1993, 27, 1415–1425. [Google Scholar]
  3. Hogstrand, C.; Wood, C.M. Toward a better understanding of the bioavailability, physiology and toxicity of silver in fish: Implications for water quality criteria. Environ. Toxicol. Chem. 1998, 17, 547–561. [Google Scholar]
  4. Mann, R.M.; Ernste, M.J.; Bell, R.A.; Kramer, J.R.; Wood, C.M. Evaluation of the protective effects of reactive sulfide on the acute toxicity of silver to rainbow trout (Oncorhynchus mykiss). Environ. Toxicol. Chem. 2004, 23, 1204–1210. [Google Scholar]
  5. Hogstrand, C.; Wood, C.M. Toward a better understanding of the bioavailability, physiology and toxicity of silver in fish: Implications for water quality criteria. Environ. Toxicol. Chem. 1998, 17, 547–561. [Google Scholar]
  6. Gorsuch, J.W.; Klaine, S.J. Toxicity and fate of silver in the environment. Environ. Toxicol. Chem. 1998, 17, 537–538. [Google Scholar]
  7. Song, Y.M.; Lu, X.L.; Yang, M.L.; Zheng, X.R. Study on the interaction of platinum(IV), gold(III) and silver(I) ions with DNA. Transit. Met. Chem. 2005, 30, 499–502. [Google Scholar]
  8. Hossain, Z.; Huq, F. Studies on the interaction between Ag+ and DNA. J. Inorg. Biochem. 2002, 91, 398–404. [Google Scholar]
  9. Clemens, S. Toxic metal accumulation, responses to exposure and mechanisms of tolerance in plants. Biochimie 2006, 88, 1707–1719. [Google Scholar]
  10. Zenk, M.H. Heavy metal detoxification in higher plants - A review. Gene 1996, 179, 21–30. [Google Scholar]
  11. Hamer, D.H. Metallothionein. Annu. Rev. Biochem. 1986, 55, 913–951. [Google Scholar]
  12. Giordani, T.; Natali, L.; Maserti, B.E.; Taddei, S.; Cavallini, A. Characterization and expression of DNA sequences encoding putative type-II metallothioneins in the seagrass Posidonia oceanica. Plant Physiol. 2000, 123, 1571–1581. [Google Scholar]
  13. Sochova, I.; Hofman, J.; Holoubek, I. Using nematodes in soil ecotoxicology. Environ. Int. 2006, 32, 374–383. [Google Scholar]
  14. Fichez, R.; Adjeroud, M.; Bozec, Y.M.; Breau, L.; Chancerelle, Y.; Chevillon, C.; Douillet, P.; Fernandez, J.M.; Frouin, P.; Kulbicki, M.; Moreton, B.; Ouillon, S.; Payri, C.; Perez, T.; Sasal, P.; Thebault, J. A review of selected indicators of particle, nutrient and metal inputs in coral reef lagoon systems. Aquat. Living Resour. 2005, 18, 125–147. [Google Scholar]
  15. Bebianno, M.J.; Geret, F.; Hoarau, P.; Serafim, M.A.; Coelho, M.R.; Gnassia-Barelli, M.; Romeo, M. Biomarkers in Ruditapes decussatus: a potential bioindicator species. Biomarkers 2004, 9, 305–330. [Google Scholar]
  16. Conti, M.E.; Cecchetti, G. Biological monitoring: lichens as bioindicators of air pollution assessment - a review. Environ. Pollut. 2001, 114, 471–492. [Google Scholar]
  17. McGeoch, M.A. The selection, testing and application of terrestrial insects as bioindicators. Biol. Rev. Cambridge Philosophic. Soc. 1998, 73, 181–201. [Google Scholar]
  18. Leyval, C.; Turnau, K.; Haselwandter, K. Effect of heavy metal pollution on mycorrhizal colonization and function: physiological, ecological and applied aspects. Mycorrhiza 1997, 7, 139–153. [Google Scholar]
  19. Petrlova, J.; Krizkova, S.; Zitka, O.; Hubalek, J.; Prusa, R.; Adam, V.; Wang, J.; Beklova, M.; Sures, B.; Kizek, R. Utilizing a chronopotentiometric sensor technique for metallothionein determination in fish tissues and their host parasites. Sens. Actuator B-Chem. 2007, 127, 112–119. [Google Scholar]
  20. Lessire, F.; Delaunois, A.; Gustin, P.; Ansay, M. Biomarkers and bioindicators in vertebrates: importance in evaluation of quality of an ecosystem. Ann. Med. Vet. 1997, 141, 281–290. [Google Scholar]
  21. Kafka, Z.; Puncocharova, J. Bioindicators in the environment monitoring. Chem. Listy 2000, 94, 909–912. [Google Scholar]
  22. Wyrobek, A.J.; Schmid, T.E.; Marchetti, F. Cross-species sperm-FISH assays for chemical testing and assessing paternal risk for chromosomally abnormal pregnancies. Environ. Mol. Mutagen. 2005, 45, 271–283. [Google Scholar]
  23. Sures, B. Environmental parasitology: relevancy of parasites in monitoring environmental pollution. Trends Parasitol. 2004, 20, 170–177. [Google Scholar]
  24. Purcell, T.W.; Peters, J.J. Sources of silver in the environment. Environ. Toxicol. Chem. 1998, 17, 539–546. [Google Scholar]
  25. Purcell, T.W.; Peters, J.J. Historical impacts of environmental regulation of silver. Environ. Toxicol. Chem. 1999, 18, 3–8. [Google Scholar]
  26. Saeki, S.; Kubota, M.; Asami, T. Determination of silver in plants by flame atomic absorption spectrometry. Int. J. Environ. Anal. Chem. 1996, 64, 179–183. [Google Scholar]
  27. Shamspur, T.; Mashhadizadeh, M.H.; Sheikhshoaie, I. Flame atomic absorption spectrometric determination of silver ion after preconcentration on octadecyl silica membrane disk modified with bis[5-((4-nitrophenyl)azosalicylaldehyde)] as a new Schiff base ligand. J. Anal. At. Spectrom. 2003, 18, 1407–1410. [Google Scholar]
  28. Raoof, J.B.; Ojani, R.; Kiani, A. Kinetic determination of silver ion by its perturbation on Belousov-Zhabotinskii oscillating chemical reaction using potentiometric method. Anal. Sci. 2004, 20, 883–886. [Google Scholar]
  29. Safavi, A.; Iranpoor, N.; Saghir, N. Directly silica bonded analytical reagents: synthesis of 2-mercaptobenzothiazole-silica gel and its application as a new sorbent for preconcentration and determination of silver ion using solid-phase extraction method. Sep. Purif. Technol. 2004, 40, 303–308. [Google Scholar]
  30. Schildkraut, D.E.; Dao, P.T.; Twist, J.P.; Davis, A.T.; Robillard, K.A. Determination of silver ions at sub microgram-per-liter levels using anodic square-wave stripping voltammetry. Environ. Toxicol. Chem. 1998, 17, 642–649. [Google Scholar]
  31. Zhang, S.B.; Zhang, X.J.; Lin, X.Q. An ethylenediaminetetraacetic acid modified carbon paste electrode for the determination of silver ion. Chin. J. Anal. Chem. 2002, 30, 745–747. [Google Scholar]
  32. Guo, S.X.; Khoo, S.B. Highly selective and sensitive determination of silver(I) at a poly(8-mercaptoquinoline) film modified glassy carbon electrode. Electroanalysis 1999, 11, 891–898. [Google Scholar]
  33. Ye, X.Z.; Yang, Q.H.; Wang, Y.; Li, N.Q. Electrochemical behaviour of gold, silver, platinum and palladium on the glassy carbon electrode modified by chitosan and its application. Talanta 1998, 47, 1099–1106. [Google Scholar]
  34. Wang, J.; Lu, J.M.; Farias, P.A.M. Remote electrochemical monitoring of trace silver. Anal. Chim. Acta 1996, 318, 151–157. [Google Scholar]
  35. Mikelova, R.; Baloun, J.; Petrlova, J.; Adam, V.; Havel, L.; Petrek, J.; Horna, A.; Kizek, R. Electrochemical determination of Ag-ions in environment waters and their action on plant embryos. Bioelectrochemistry 2007, 70, 508–518. [Google Scholar]
  36. Stejskal, K.; Krizkova, S.; Adam, V.; Sures, B.; Trnkova, L.; Zehnalek, J.; Hubalek, J.; Beklova, M.; Hanustiak, P.; Svobodova, Z.; Horna, A.; Kizek, R. Bio-assessing of environmental pollution via monitoring of metallothionein level using electrochemical detection. IEEE Sens. J. 2007, in press. [Google Scholar]
  37. Svancara, I.; Ogorevc, B.; Hocevar, S.B.; Vytras, K. Perspectives of carbon paste electrodes in stripping potentiometry. Anal. Sci. 2002, 18, 301–305. [Google Scholar]
  38. Svancara, I.; Ogorevc, B.; Novic, M.; Vytras, K. Simple and rapid determination of iodide in table salt by stripping potentiometry at a carbon-paste electrode. Anal. Bioanal. Chem. 2002, 372, 795–800. [Google Scholar]
  39. Barek, J.; Muck, A.; Wang, J.; Zima, J. Study of voltammetric determination of carcinogenic 1-nitropyrene and 1-aminopyrene using a glassy carbon paste electrode. Sensors 2004, 4, 47–57. [Google Scholar]
  40. Svancara, I.; Kalcher, K.; Diewald, W.; Vytras, K. Voltammetric determination of silver at ultratrace levels using a carbon paste electrode with improved surface characteristics. Electroanalysis 1996, 8, 336–342. [Google Scholar]
  41. Svancara, I.; Vytras, K.; Barek, J.; Zima, J. Carbon paste electrodes in modern electroanalysis. Crit. Rev. Anal. Chem. 2001, 31, 311–345. [Google Scholar]
  42. Lawrence, N.S.; Deo, R.P.; Wang, J. Biocatalytic carbon paste sensors based on a mediator pasting liquid. Anal. Chem. 2004, 76, 3735–3739. [Google Scholar]
  43. Blaedel, W.J.; Wang, J. Mixed Immobilized Enzyme-Porous Electrode Reactor. Anal. Chem. 1980, 52, 1426–1429. [Google Scholar]
  44. Kizek, R.; Vacek, J.; Trnkova, L.; Klejdus, B.; Kuban, V. Electrochemical biosensors in agricultural and environmental analysis. Chem. Listy 2003, 97, 1003–1006. [Google Scholar]
  45. Masarik, M.; Kizek, R.; Kramer, K.J.; Billova, S.; Brazdova, M.; Vacek, J.; Bailey, M.; Jelen, F.; Howard, J.A. Application of avidin-biotin technology and adsorptive transfer stripping square-wave voltammetry for detection of DNA hybridization and avidin in transgenic avidin maize. Anal. Chem. 2003, 75, 2663–2669. [Google Scholar]
  46. Petrlova, J.; Masarik, M.; Potesil, D.; Adam, V.; Trnkova, L.; Kizek, R. Zeptomole detection of streptavidin using carbon paste electrode and square wave voltammetry. Electroanalysis 2007, 19, 1177–1182. [Google Scholar]
  47. Berry, W.J.; Cantwell, M.G.; Edwards, P.A.; Serbst, J.R.; Hansen, D.J. Predicting toxicity of sediments spiked with silver. Environ. Toxicol. Chem. 1999, 18, 40–48. [Google Scholar]
  48. Bury, N.R.; McGeer, J.C.; Wood, C.M. Effects of altering freshwater chemistry on physiological responses of rainbow trout to silver exposure. Environ. Toxicol. Chem. 1999, 18, 49–55. [Google Scholar]
  49. Bury, N.R.; Galvez, F.; Wood, C.M. Effects of chloride, calcium, and dissolved organic carbon on silver toxicity: Comparison between rainbow trout and fathead minnows. Environ. Toxicol. Chem. 1999, 18, 56–62. [Google Scholar]
  50. Bianchini, A.; Wood, C.M. Mechanism of acute silver toxicity in Daphnia magna. Environ. Toxicol. Chem. 2003, 22, 1361–1367. [Google Scholar]
  51. Bianchini, A.; Bowles, K.C.; Brauner, C.J.; Gorsuch, J.W.; Kramer, J.R.; Wood, C.M. Evaluation of the effect of reactive sulfide on the acute toxicity of silver (I) to Daphnia magna. part 2: Toxicity results. Environ. Toxicol. Chem. 2002, 21, 1294–1300. [Google Scholar]
  52. Bianchini, A.; Grosell, M.; Gregory, S.M.; Wood, C.M. Acute silver toxicity in aquatic animals is a function of sodium uptake rate. Environ. Sci. Technol. 2002, 36, 1763–1766. [Google Scholar]
  53. Call, D.J.; Polkinghorne, C.N.; Markee, T.P.; Brooke, L.T.; Geiger, D.L.; Gorsuch, J.W.; Robillard, K.A. Silver toxicity to Chironomus tentans in two freshwater sediments. Environ. Toxicol. Chem. 1999, 18, 30–39. [Google Scholar]
  54. Karen, D.J.; Ownby, D.R.; Forsythe, B.L.; Bills, T.P.; La Point, T.W.; Cobb, G.B.; Klaine, S.J. Influence of water quality on silver toxicity to rainbow trout (Oncorhynchus mykiss), fathead minnows (Pimephales promelas), and water fleas (Daphnia magna). Environ. Toxicol. Chem. 1999, 18, 63–70. [Google Scholar]
  55. Morgan, T.P.; Wood, C.M. A relationship between gill silver accumulation and acute silver toxicity in the freshwater rainbow trout: Support for the acute silver biotic ligand model. Environ. Toxicol. Chem. 2004, 23, 1261–1267. [Google Scholar]
  56. Ratte, H.T. Bioaccumulation and toxicity of silver compounds: A review. Environ. Toxicol. Chem. 1999, 18, 89–108. [Google Scholar]
  57. Miziolek, A.W.; Palleschi, V.; Schecher, I. Laser-Induced Breakdown Spectroscopy (LIBS); Cambridge University Press, 2006. [Google Scholar]
  58. Buckley, S.G. LIBS comes on strong. Laser Focus World 2006, 42, 95–98. [Google Scholar]
  59. Radziemski, L.J.; Loree, T.R.; Cremers, D.A.; Hoffman, N.M. Time-Resolved Laser-Induced Breakdown Spectrometry of Aerosols. Anal. Chem. 1983, 55, 1246–1252. [Google Scholar]
  60. Cremers, D.A.; Radziemski, L.J. Detection of Chlorine and Fluorine in Air by Laser-Induced Breakdown Spectrometry. Anal. Chem. 1983, 55, 1252–1256. [Google Scholar]
  61. Martin, M.Z.; Wullschleger, S.D.; Garten, C.T.; Palumbo, A.V.; Smith, J.G. Elemental analysis of environmental and biological samples using laser-induced breakdown spectroscopy and pulsed Raman spectroscopy. J. Dispersion Sci. Technol. 2004, 25, 687–694. [Google Scholar]
  62. Samek, O.; Lambert, J.; Hergenroder, R.; Liska, M.; Kaiser, J.; Novotny, K.; Kukhlevsky, S. Femtosecond laser spectrochemical analysis of plant samples. Laser Phys. Lett. 2006, 3, 21–25. [Google Scholar]
  63. Kaiser, J.; Samek, O.; Reale, L.; Liska, M.; Malina, R.; Ritucci, A.; Poma, A.; Tucci, A.; Flora, F.; Lai, A.; Mancini, L.; Tromba, G.; Zanini, F.; Faenov, A.; Pikuz, T.; Cinque, G. Monitoring of the heavy-metal hyperaccumulation in vegetal tissues by X-ray radiography and by femto-second laser induced breakdown spectroscopy. Microsc. Res. Tech. 2007, 70, 147–153. [Google Scholar]
  64. Limpert, E.; Stahel, W.A.; Abbt, M. Log-normal distributions across the sciences: Keys and clues. Bioscience 2001, 51, 341–352. [Google Scholar]
  65. Hubalek, J.; Hradecky, J.; Adam, V.; Krystofova, O.; Huska, D.; Masarik, M.; Trnkova, L.; Horna, A.; Klosova, K.; Adamek, M.; Zehnalek, J.; Kizek, R. Spectrometric and voltammetric analysis of urease – Nickel nanoelectrode as an electrochemical sensor. Sensors 2007, 7, 1238–1255. [Google Scholar]
  66. Xu, Z.; Chen, X.; Qu, X.H.; Jia, J.B.; Dong, S.J. Single-wall carbon nanotube-based voltammetric sensor and biosensor. Biosens. Bioelectron. 2004, 20, 579–584. [Google Scholar]
  67. Witte, C.P.; Medina-Escobar, N. In-gel detection of urease with nitroblue tetrazolium and quantification of the enzyme from different crop plants using the indophenol reaction. Anal. Biochem. 2001, 290, 102–107. [Google Scholar]
  68. Petrek, J.; Vitecek, J.; Vlasinova, H.; Kizek, R.; Kramer, K.J.; Adam, V.; Klejdus, B.; Havel, L. Application of computer imaging, stripping voltammetry and mass spectrometry for study of the effect of lead (Pb-EDTA) on growth and viability of early somatic embryos of Norway spruce (Picea abies /L./ Karst.). Anal. Bioanal. Chem. 2005, 383, 576–586. [Google Scholar]
  69. Supalkova, V.; Beklova, M.; Baloun, J.; Singer, C.; Sures, B.; Adam, V.; Huska, D.; Pikula, J.; Rauscherova, L.; Havel, L.; Zehnalek, J.; Kizek, R. Affecting of aquatic vascular plant Lemna minor by cisplatin revealed by voltammetry. Bioelectrochemistry 2007, in press. [Google Scholar]
  70. Supalkova, V.; Huska, D.; Diopan, V.; Hanustiak, P.; Zitka, O.; Stejskal, K.; Baloun, J.; Pikula, J.; Havel, L.; Zehnalek, J.; Adam, V.; Trnkova, L.; Beklova, M.; Kizek, R. Electroanalysis of plant thiols. Sensors 2007, 7, 932–959. [Google Scholar]
  71. Supalkova, V.; Petrek, J.; Baloun, J.; Adam, V.; Bartusek, K.; Trnkova, L.; Beklova, M.; Diopan, V.; Havel, L.; Kizek, R. Multi-instrumental investigation of affecting of early somatic embryos of Spruce by cadmium(II) and lead(II) ions. Sensors 2007, 7, 743–759. [Google Scholar]
  72. Vitecek, J.; Adam, V.; Petrek, J.; Vacek, J.; Kizek, R.; Havel, L. Esterases as a marker for the growth of BY-2 tobacco cells and early somatic embryos of the norway spruce. Plant. Cell. Tiss. Org. 2004, 79, 195–201. [Google Scholar]
  73. Zitka, O.; Stejskal, K.; Kleckerova, A.; Adam, V.; Beklova, M.; Horna, A.; Havel, L.; Kizek, R. Utilizing of electrochemical techniques for detection of biological samples. Chem. Listy 2007, 101, 225–231. [Google Scholar]
Figure 1. The LIBS experimental setup. 1 – Nd:YAG ablation laser, 2 – focusing optics, 3 – the analyzed sample, 4 – collecting optics, 5 – optical fiber, 6 – monochromator, 7 – ICCD camera, 8 – personal computer.
Sensors 08 00445f1
Figure 2. The scheme of environment quality assessment based on determination of biochemical markers presented in plants.
Sensors 08 00445f2
Figure 3. Images of the sunflower plants during 96 h treatment with silver(I) ions.
Sensors 08 00445f3
Figure 4. Fresh weight changes (whole plant, shoot and root) of sunflower plants exposed to various doses of silver(I) ions for 96 h.
Sensors 08 00445f4
Figure 5. Sunflower shoot. Transverse stem section of sunflower cultivated without (A) and treated with silver(I) ions – 0.1 mM (B), 0.5 mM (C) and 1.0 mM (D) at fourth day of the treatment. Blue fluorescence – lignified cell walls. E – epidermis, C – cortex, P – phloem, X – xylem, Pi – pith. Sunflower root. Transverse root section of sunflower cultivated without (A) and treated with silver(I) ions – 0.1 mM (B), with detail (C) at fourth day of the treatment. Magnification × 100.
Sensors 08 00445f5
Figure 6. The typical LIBS spectrum with the 328.07 nm Ag(I) and 324.75 nm Cu(I) lines used in the analysis (A) together with the image of three ablation craters (B). The bar on B has a length of 500 μm.
Sensors 08 00445f6
Figure 7. The average intensities calculated from logarithm of intensity data obtained from LIBS analyses.
Sensors 08 00445f7
Figure 8. Accumulation of silver (A) and copper (B) along the investigated stem samples. Maps of the accumulated silver (C) and copper (D) measured by the LIBS technique for quasy 3D analyses of the stem sample of interest.
Sensors 08 00445f8
Figure 9. Total content of proteins soluble in water determined spectrometrically using biuret reaction. The dependence of signal height on albumin concentration (A). Total content of proteins in root (B) and shoots (C) of sunflower plants exposed to silver(I) ions.
Sensors 08 00445f9
Figure 10. Spectrometric automated analysis of urease activity. The dependence of total amount of released ammonia on height of the obtained signal (A). Enzyme kinetic of soybean urease (B).
Sensors 08 00445f10
Figure 11. The changes in urease activity in sunflower plants exposed to silver(I) ions, roots (A) and shoots (B).
Sensors 08 00445f11
Figure 12. The changes of activity of commercially available urease in the presence of silver(I) ions.
Sensors 08 00445f12

