Article

Lactoferrin Isolation Using Monolithic Column Coupled with Spectrometric or Micro-Amperometric Detector

by
Vojtech Adam
1,
Ondrej Zitka
1,
Petr Dolezal
2,
Ladislav Zeman
2,
Ales Horna
3,
Jaromir Hubalek
4,
Jan Sileny
4,
Sona Krizkova
1,
Libuse Trnkova
5 and
Rene Kizek
1,*
1
Department of Chemistry and Biochemistry, Mendel University of Agriculture and Forestry, Zemedelska 1, CZ-613 00 Brno, Czech Republic
2
Department of Animal Nutrition and Forage Production Faculty of Agronomy, Mendel University of Agriculture and Forestry, Zemedelska 1, CZ-613 00 Brno, Czech Republic
3
Department of Food Engineering, Faculty of Technology, Tomas Bata University, T.G. Masaryka 275, CZ-762 72 Zlin, Czech Republic
4
Department of Microelectronics, Faculty of Electrical Engineering and Communication, Brno University of Technology, Udolni 53, CZ-602 00 Brno, Czech Republic
5
Department Chemistry, Faculty of Science, Masaryk University, Kotlarska 2, CZ-611 37 Brno, Czech Republic
*
Author to whom correspondence should be addressed.
Sensors 2008, 8(1), 464-487; https://doi.org/10.3390/s8010464
Submission received: 27 December 2007 / Accepted: 15 January 2008 / Published: 24 January 2008

Abstract

:
Lactoferrin is a multifunctional protein with antimicrobial activity and others to health beneficial properties. The main aim of this work was to propose easy to use technique for lactoferrin isolation from cow colostrum samples. Primarily we utilized sodium dodecyl sulphate – polyacrylamide gel electrophoresis for isolation of lactoferrin from the real samples. Moreover we tested automated microfluidic Experion electrophoresis system to isolate lactoferrin from the collostrum sample. The well developed signal of lactoferrin was determined with detection limit (3 S/N) of 20 ng/ml. In spite of the fact that Experion is faster than SDS-PAGE both separation techniques cannot be used in routine analysis. Therefore we have tested third separation technique, ion exchange chromatography, using monolithic column coupled with UV-VIS detector (LC-UV-VIS). We optimized wave length (280 nm), ionic strength of the elution solution (1.5 M NaCl) and flow rate of the retention and elution solutions (0.25 ml/min and 0.75 ml/min. respectively). Under the optimal conditions the detection limit was estimated as 0.1 μg/ml of lactoferrin measured. Using LC-UV-VIS we determined that lactoferrin concentration varied from 0.5 g/l to 1.1 g/l in cow colostrums collected in the certain time interval up to 72 hours after birth. Further we focused on miniaturization of detection device. We tested amperometric detection at carbon electrode. The results encouraged us to attempt to miniaturise whole detection system and to test it on analysis of real samples of human faeces, because lactoferrin level in faeces is closely associated with the inflammations of intestine mucous membrane. For the purpose of miniaturization we employed the technology of printed electrodes. The detection limit of lactoferrin was estimated as 10 μg/ml measured by the screen-printed electrodes fabricated by us. The fabricated electrodes were compared with commercially available ones. It follows from the obtained results that the responses measured by commercial electrodes are app. ten times higher compared with those measured by the electrodes fabricated by us. This phenomenon relates with smaller working electrode surface area of the electrodes fabricated by us (about 50 %) compared to the commercial ones. The screen-printed electrodes fabricated by us were utilized for determination of lactoferrin faeces. Regarding to fact that sample of faeces was obtained from young and healthy man the amount of lactoferrin in sample was under the limit of detection of this method.

1. Introduction

Milk as a source of nutrients contains many biologically active and interesting compounds. In 1939 a protein called lactoferrin was discovered in cow milk. More than twenty years later this protein was firstly isolated from human breast milk [1]. Its name is derived from its former classification as the most important iron-binding protein in milk [2-5]. The molecular weight and structure of lactoferrin is similar to other iron-binding proteins, transferrins [6], therefore it is sometimes called lactotransferrin. Hololactoferrin is consisted from one linear polypeptide chain forming two spherical domains (C- and N-terminal), each domain contains one iron binding site. Lactoferrin is a glycoprotein consisted from less than seven hundred aminoacid residues e.g. 691 – human, 685 – pig. The primary structure of lactoferrin isolated from milks of various animal species is very similar. The highest contents among aminoacids residues have alanine (∼10 %), leucine (∼9 %) and glycine (∼7 %), the lowest tryptophan (∼1.5 %), histidine (∼1.3 %) and methionine (∼0.6 %). The comparison of aminoacid composition of lactoferrin isolated from eight mammalian species is shown in Fig. 1 [7].

1.1 Biological functions of lactoferrin

Lactoferrin is found in mucosal secretions and granules of neutrophils. Its highest level was observed in colostrum followed by milk, because during the lactation lactoferrin concentration decreases. Lactoferrin can be also found in exocrine secretions such as tears and nasal exudate, saliva, bronchial mucus, gastrointestinal fluids, cervicovaginal mucus and seminal fluid [8-11]. The biological importance of lactoferrin is still not fully clear [12-14]. Its antiflogistic, bacteriostatic and bactericidal effects are assumed [15]. Its secretion in mucosals (mucous membranes) can have certain effect in protective incidence of BCG vaccine against Mycobacterium tuberculosis [16,17]. In addition lactoferrin modulates immune system and intestinal epidermal cells by positive effect to growth of lacteous bacteria (bifidobacteria). Thanks to these facts lactoferrin has expressive antimicrobial effect [18-22]. From histoimmunological analyses of tissues of patients with acute cholera higher level of this protein was found in intestinal lamina propria [23]. Lactoferrin was also used in therapy of Helicobacter pylori infection and this therapy led to pathogen eradication [24,25]. Antiviral effect of lactoferrin was observed in the event of papilomaviruses that are causers of cervical cancer [26] and at herpes simplex virus 2 [27]. Lactoferrin was also used in therapy against hepatitis C, where the reduction of viral RNA titre was observed. Similarly the usage of camel milk (that is empirically used in traditional medicines) led to therapeutic effect to hepatitis C virus [28,29]. It is interesting that the lactoferrin level is strictly associated with the possibility of female HIV virus infection [30-32]. For curative purposes the most suitable and considerate drugs are searched. As it is shown the peptide as well as protein fragments can be very effective too. Experimentally the peptide fragments derived from lactoferrin molecule were used to suppression of infections caused by yeasts [33,34]. Moreover the influence of milk proteins on cancer is studied very intensively; it is possible to look forward to their effect to carcinogenesis processes. Based on the recently published data lactoferrin inhibits the tumours in small intestine and in other localizations. Lactoferrin starts the processes leading to apoptosis, inhibits angiogenesis and modulates enzyme reactions with carcinogens [35,36]. It was discovered that lactoferrin in the combination with polyphenols can embody antiproliferative effects. This fact was confirmed on cell culture of tongue squamous carcinoma (CAL-27). Combination of lactoferrin with the polyphenols led to enhancing of processes of programmed cell death of cancer cells [37].
In study in 55 farm-houses in Pensylvania (USA) it was found out that the average lactoferrin level in analysed colostrum was 0.8 mg/ml close to total protein amount 14.9 mg/ml. In addition other substances, such as vitamins, oils and minerals were observed. Obtained data could assist in searching for possibilities how to reduce mortality and morbidity of natal calves or how to monitor the milk quality [38,39]. In the case of lactoferin additions into pigs fodder the protective effect to their immunity was observed. The protective effect was demonstrated as higher increase of weight and lower incidence of illnesses [40,41]. In addition the total lactoferin level in camel milk determined by ion exchange chromatography was 2.3 g/l [42]. Further analysis of compounds in sheep and goat milk were published [43]. Because of the facts described hereinbefore accurate and precise isolation of lactoferrin from milk is needed. Own isolation requires permanent milk intake and its content very varies depending on many factors, most of all on health state of the animals. Because of this fact the techniques based on molecular biology enabling continual lactoferrin production by other organisms are very advantageous. Even recombinant human lactoferrin produced by goats with yield 2 g/l was prepared [44].

1.2 Lactoferrin and intestine inflammation

Endoscopy coupled with biopsy represents the standard of intestine inflammation detection. This technique is however very expensive and invasive. Because of these facts the new techniques and markers for intestine inflammation detection have been proposing. Their advantage bases in the facts that they enable us to predict relapse of the inflammation and to monitor effect of the treatment. Many of inflammatory mediators such as leucocytes, cytokines and proteins from neutrophil activation have been analysed in faeces. It was ascertained that lactoferrin level has diagnostic signification especially in the cases of inflammations at colon area (colitis). The lactoferrin level is significantly increased in the case of Crohn's disease and may be excellent indicator of inflammation at colon area determined from faecal samples [45-51]. In addition the increase in lactoferrin level was observed at more than half of patients with colorectal adenocarcinoma [49]. The enhanced lactoferrin level was determined immunohistochemically at patients with malignant tumours of kidneys compared with healthy tissues, where the level of this protein was under the detection limit of the diagnostic technique used [52]. The function of proteomic research is not only identification of particular proteins in the body of the organism but also determination of their functions that are very frequently connected with interactions as DNA/protein, protein/protein, protein/RNA. The papers reported on investigation of in vitro interaction between lactoferrin and coeruloplasmin were recently published [53,54].

1.3 Lactoferrin detection

Very recently Enzyme-Linked ImmunoSorbent Assay (ELISA) and mass spectrometry was used for analysis of lactoferrin [18]. However these very accurate techniques suffer mostly from high cost. Therefore the easy to use and low cost isolation and detection is searched. Lactoferrin was isolated by paramagnetic particles with polyglycidyl-methaclyate connected with heparine. These particles showed high yield with maximum binding capacity 164 mg of the target protein per gram of the particles [55]. Ultrafiltration belongs to commercially used technique for lactoferrin isolation. This process is double-stepped, in the first step the ultrafiltration is carried out and in second step fast ion exchange chromatography is employed. The purity of the lactoferrin is 94 % and recovery 82 % [56]. In general chromatographic techniques, most of all the ion exchange chromatography, represent a way how to separate lactoferrin rapidly at relatively low costs [57-61]. From the ion exchange materials lactoferrin can be isolated by using of cationic surfactant (cetyldimethylammonium bromide) [62]. However after isolation of lactoferrin sufficiently sensitive detection technique is needed. Electrochemical detection is an attractive alternative method for electroactive species detection, because of its inherent advantages of simplicity, ease of miniaturization, high sensitivity and relatively low cost [63-93].
The main aim of this work was to propose easy to use technique for lactoferrin isolation from cow colostrum samples. Further we focused on optimization of miniaturized amperometric device using screen-printed electrodes for determination of the isolated lactoferrin.

2. Experimental Section

2.1 Chemicals

Acetonitrile and methanol (HPLC-purity) were obtained from Merck (Darmstadt, Germany). The DMW lactoferrin standard was purchased from NUTRA ingrediens (Netherlands). All other chemicals used were from Sigma-Aldrich (USA) unless otherwise indicated. The standard stock solutions of lactoferrin (concentration of 1 mg.ml-1) were prepared in ACS water (Aldrich, USA) and stored in the dark at 4 °C. Working standard solutions were prepared daily by dilution of the stock solutions. The solutions used for isolation of lactoferrin were as follows: working phosphate buffer (5 mM) pH 7.25; elution solution as 1.5 M NaCl prepared in the presence of the working buffer; regenerative solution as 1 M NaOH.

2.2 Biological samples

2.2.1 Faeces

The sample of faeces was obtained from healthy laboratory stuff. Sample (0.2 mg) was shaken in 1 ml of 0.1 M acetate buffer, pH 5 (10 min, 300 rpm, Genius, USA) and subsequently centrifuged. The supernatant obtained was analysed.

2.2.2 Cow colostrums

The samples of cow colostrums were obtained from farm in Žabčice (Czech Republic). Colostrums were sampled at the certain time interval (1, 6, 12, 24, 36, 48, 60 and 72 h) after birth. The sample of colostrum (about 10 ml) was deep-frozen at −20°C prior to other processing. After refreezing and stirring 100 μl of high-viscose colostrums was pipetted to 900 μl of the working phosphate buffer. Further the sample was stirred for 30 s and centrifuged at 14 000 rpm (Hettich, Germany; for 20 minutes. The supernatant was filtered through 0.45 μm filter and ten times diluted by the working phosphate buffer. Then it was analyzed by liquid chromatography coupled with UV-VIS detector, chip capillary electrophoresis – Experion and sodium dodecyl sulphate – polyacrylamide gel electrophoresis.

2.3 Flow injection analysis with electrochemical detection

A flow injection analysis with electrochemical detection (FIA-ED) consisted of solvent delivery pump (Model 583 ESA Inc., Chelmsford, MA, USA), a guard cell (Model 5020 ESA, USA), a reaction coil (1 m) and an electrochemical detector. The electrochemical detector includes one low volume flow-through analytical cells (Model 5040, ESA, USA), which is consisted of glassy carbon working electrode, hydrogen-palladium electrode as reference electrode and auxiliary carbon electrode, and Coulochem III as a control module. The sample (5 μl) was injected manually. The obtained data were processed by CSW 32 software. The experiments were carried out at room temperature. Guard cell potential was 0 V. A glassy carbon electrode was polished mechanically by 0.1 μm of alumina (ESA Inc., USA) and sonicated at the room temperature for 5 min using a Sonorex Digital 10 P Sonicator (Bandelin, Berlin, Germany) at 40 W [90,94].

2.4 Linear sweep voltammetry at carbon paste electrodes

Electrochemical measurements were performed with an Autolab analyzer (EcoChemie, The Netherlands) in connection with a VA-Stand 663 (Metrohm, Switzerland) using a standard cell with three electrodes. The electrode system consisted of a carbon-paste working electrode, an Ag/AgCl/3 M KCl reference electrode and glassy carbon counter electrode. The carbon paste (about 0.5 g) was made of graphite powder (Aldrich) and mineral oil (Sigma; free of DNase, RNase, and protease). The ratio of the graphite powder and mineral oil was 70/30; w/w. This paste was housed in a Teflon body having a 2.5-mm-diameter disk surface. Prior to measurements, the electrode surface was renewed by polishing with a soft filter paper [66,70,95]. Acetate buffer (0.1 M CH3COOH + 0.1 M CH3COONa, pH 5.0) was used as the supporting electrolyte. The analyzed samples were deoxygenated with argon (99.999%) saturated with water for 120 s. All experiments were carried out at room temperature. The linear sweep voltammetric parameters were as follows: initial potential of 0 V, end potential 1.5 V, step potential 5 mV. Smoothing and baseline correction was employed by GPES 4.4 software supplied by EcoChemie.

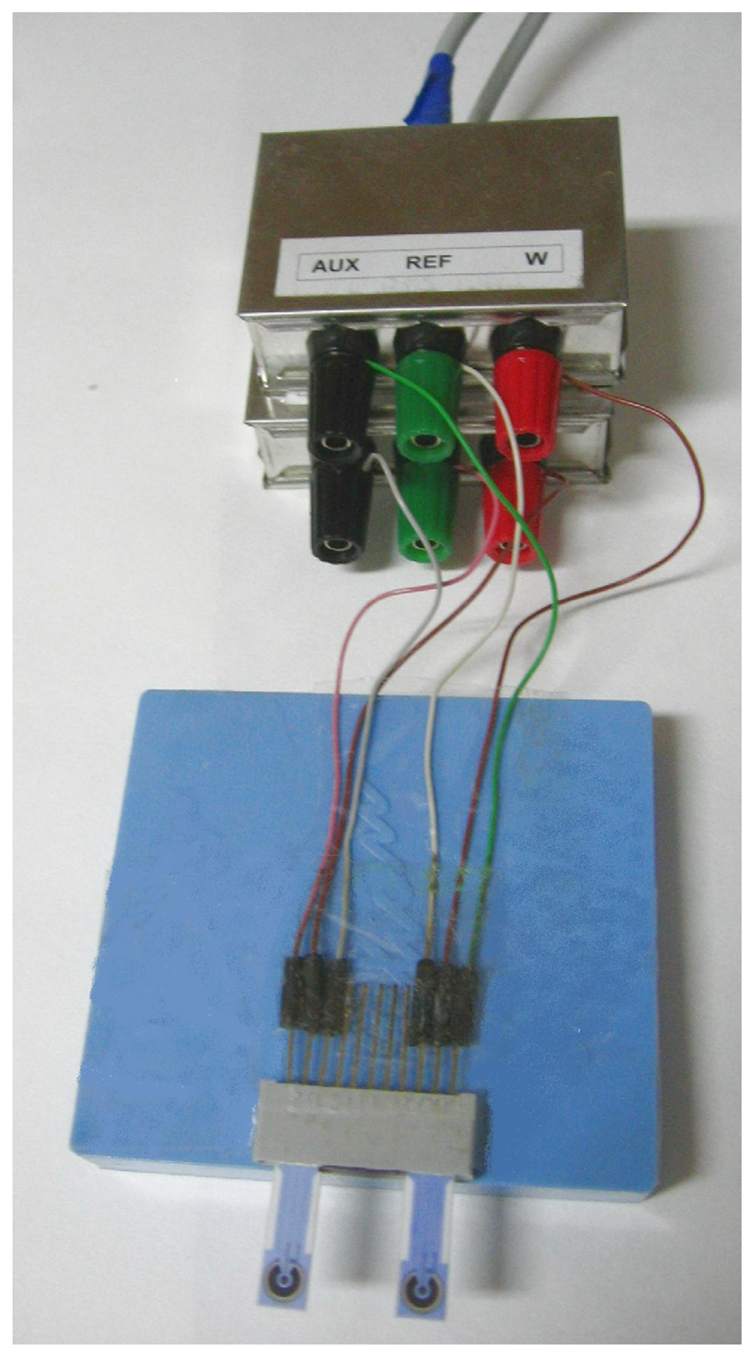
2.5 Miniaturized amperometric device using screen printed electrodes

The electrochemical measurement was carried out with multi-mode potentiostat BioStat (ESA, Inc. USA). It is four-channel system with three operating modes per channel (amps, volts, and temp). The system is connected through data bus USB to personal computer. To the first channel of the potentiostat the home made apparatus was connected. This apparatus consists of basic plate on which the connector TX721 1115 with pins spacing 2.54 and the connector 0039532035 from the manufacturer Molex with pins spacing 1.25 mm are placed. The connectors are designed for connection of two different screen-printed electrodes. Screen-printed electrodes AC1.W5.R2 (BVT Technologies, Czech Republic) were used. The screen-printed electrode includes working carbon electrode, silver referent electrode with the layer of AgCl and counter gold electrode. Contacts leading to the electrodes were made from silver, their spacing was 2.54 mm. Dimensions of the sensor were 25.4 × 7.26 mm. Moreover we employed screen-printed electrodes fabricated by us, for more details see in “Results and Discussion” section. All electrochemical measurements were carried out in Britton-Robinson buffer pH = 4.47 at room temperature. Amperometric measurement was carried out at potential 700 mV.

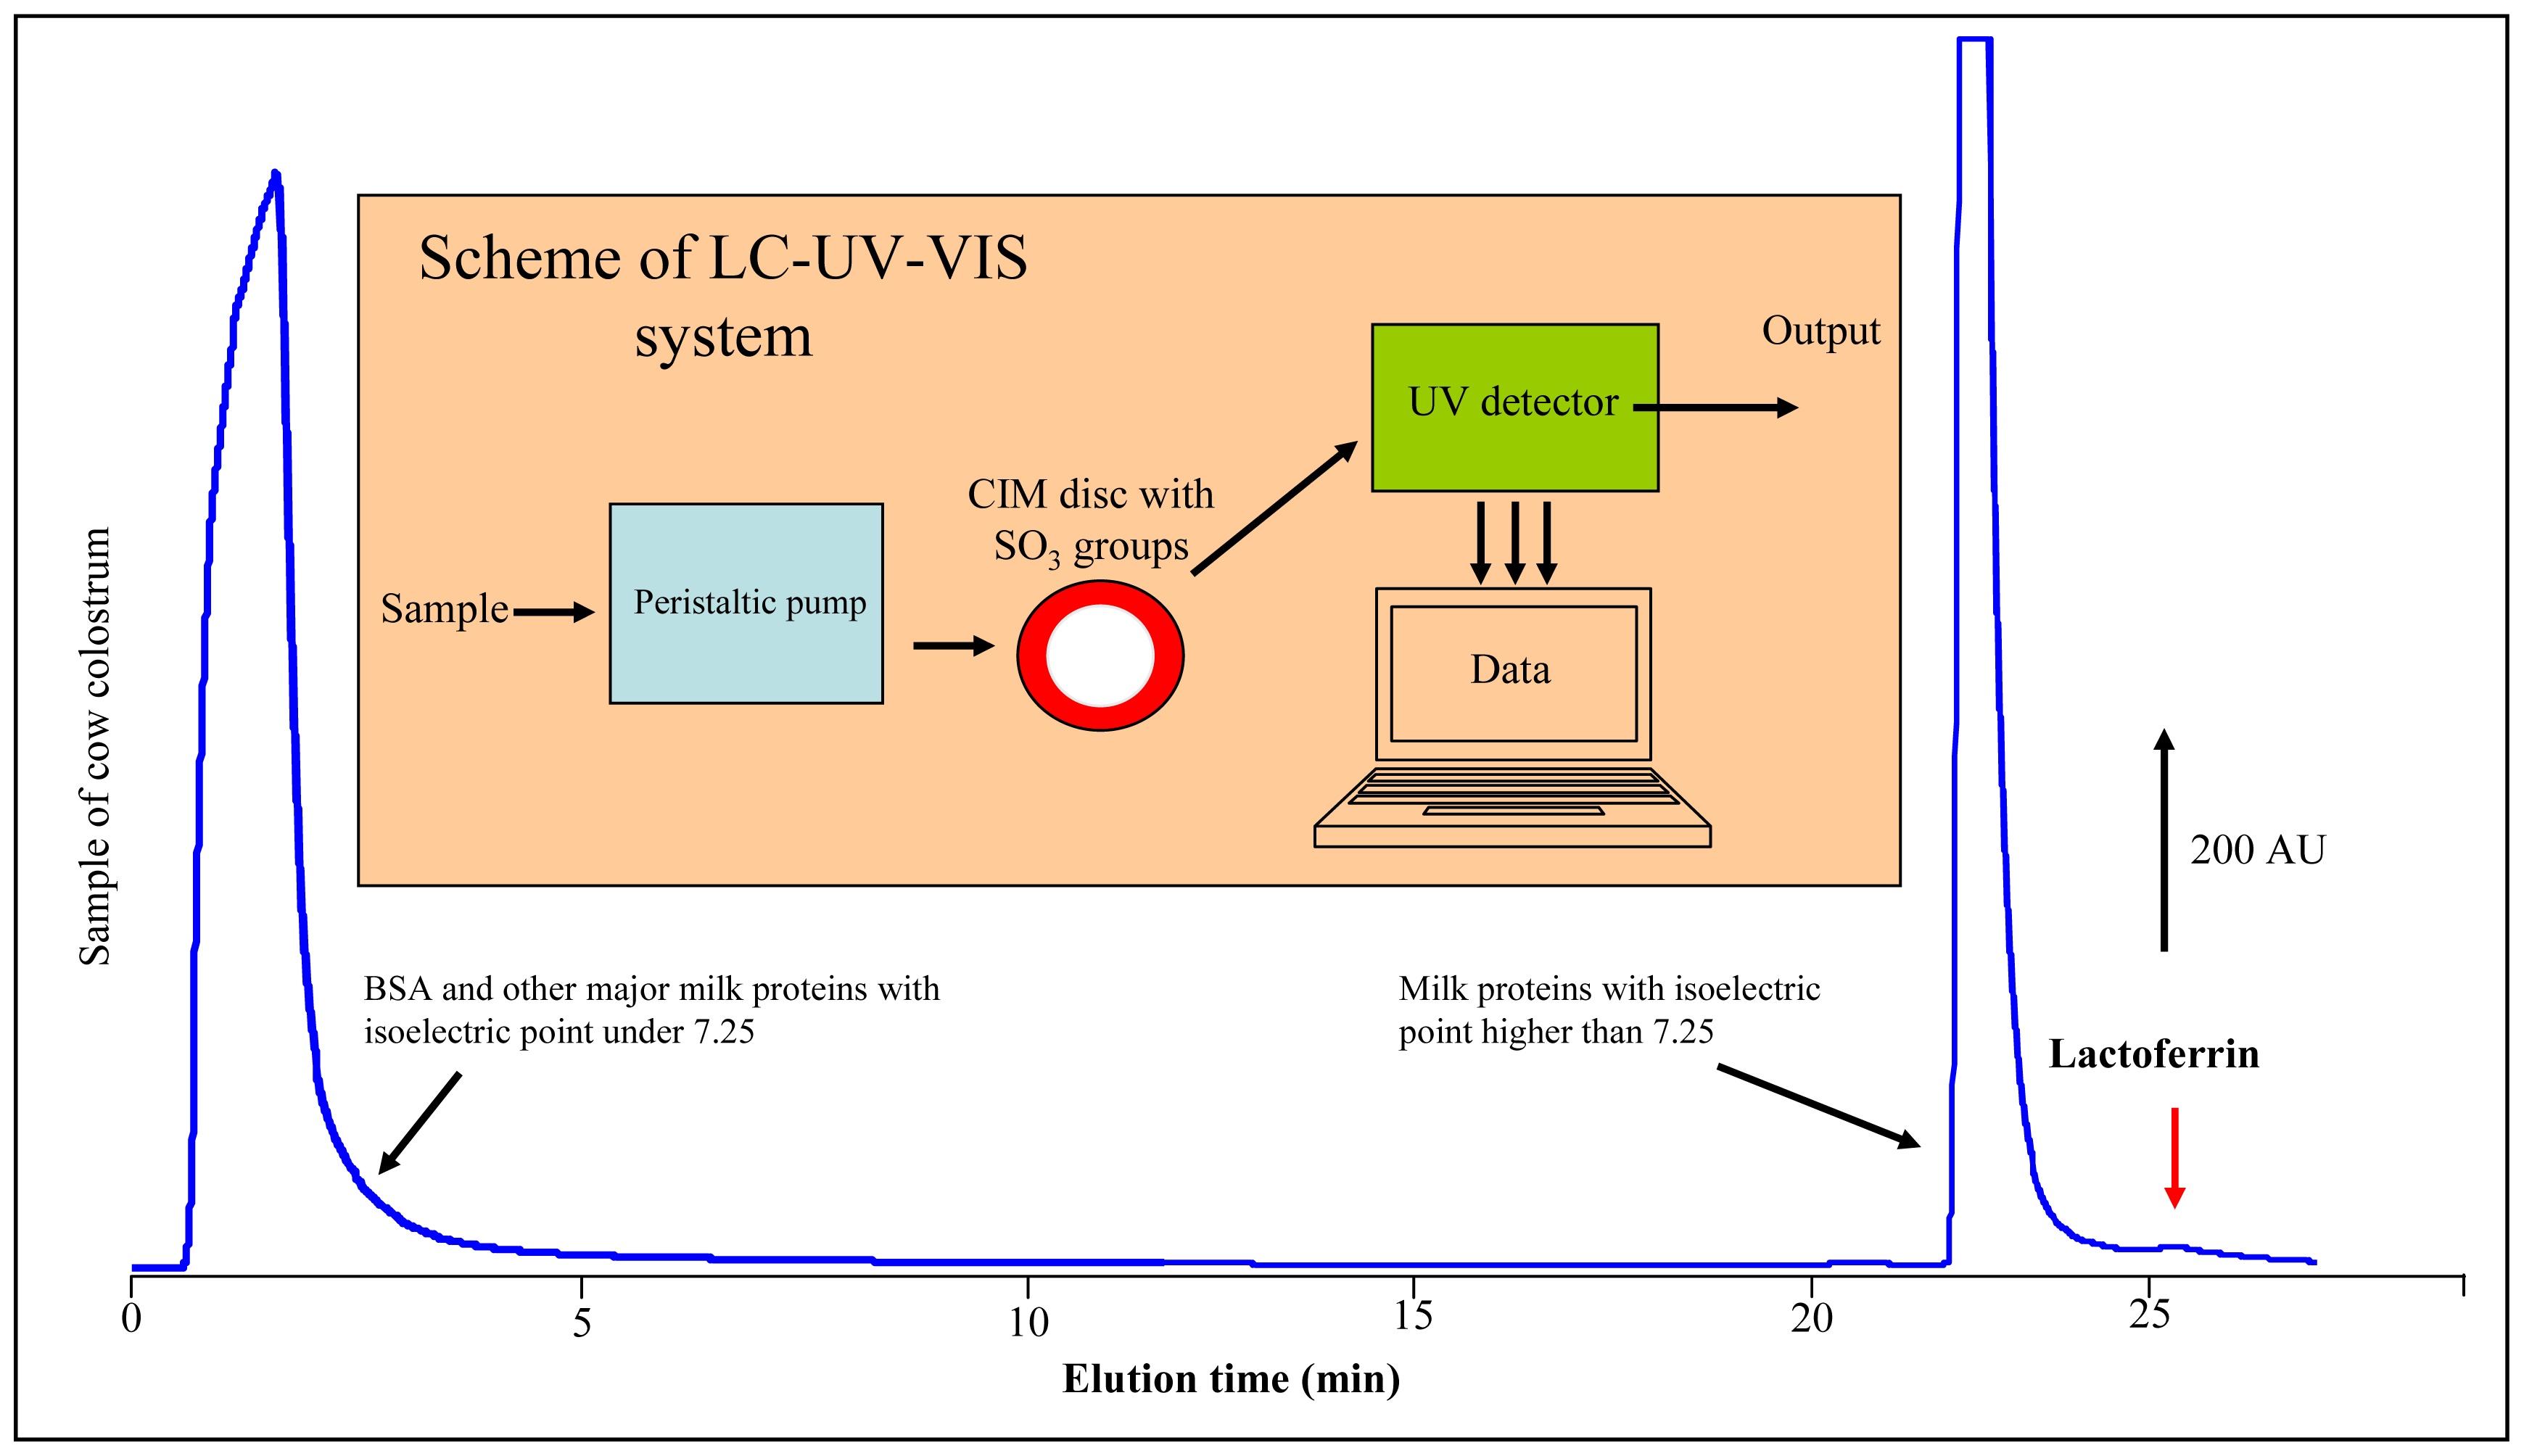
2.6 Liquid chromatography coupled with UV-VIS detector

Flow system consisted from peristaltic pump Minipuls 3 (Gilson, France), katex CIM disc (BIA separations, Slovenia), UV detector (ESA, USA). One millilitre of the biological sample (faeces or cow colostrum) was introduced discontinuously to the system for one minute using peristaltic pump. Absorbance was measured at 280 nm. For other experimental conditions see “Results and Discussion” section.

2.7 Chip capillary electrophoresis – Experion

Analyses on an automated microfluidic Experion electrophoresis system (Bio-Rad) were carried out according to the manufacturer's instructions with supplied chemicals (Experion Pro260 analysis kit, Bio-Rad). The system performs electrophoresis (capillary-based separation), staining, destaining, band detection (laser-induced fluorescence) and imaging. The samples were applied into the Experion Pro260 Chips. Experion Software was used for data processing. Each sample was diluted with water to the same protein concentration of 300 μg.mL-1, 4 μl aliquots were then mixed with 2 μl of reducing sample buffer, and after 4 min of boiling, 84 μl of water was added. After priming of the chip with gel and gel-staining solution in the diluted priming station sample, the mixture (6 μl) was loaded into sample wells. The Pro260 Ladder included in the kit was used as a standard.

2.8 Sodium dodecyl sulphate - polyacrylamide gel electrophoresis

Sodium dodecyl sulphate – polyacrylamide gel electrophoresis (SDS-PAGE) was performed according to Laemmli [96] using a Biometra maxigel apparatus (Biometra, Germany). First 10% (w/v) running, then 5% (w/v) stacking gel was poured, the gels were prepared from 30% (w/v) acrylamide stock solution with 1% (w/v) bisacrylamide concentration; the polymerization of the running gel was carried out at room temperature for 1 h and 30 min for the stacking gel. Prior to analysis the samples were mixed with sample buffer containing 5% (v/v) 2-mercaptoethanol in a 1:1 ratio. The samples were boiled for 2 min. and then loaded onto a gel in 20 μl aliquots. For determination of molecular weight, the protein ladder “Precision plus protein standards” from Biorad was used. The electrophoresis was run at 120V with cooling for 5 hours. Coomassie blue staining of the gels was performed according to Diezel et al. [97]. The gels were also stained by silver. After the staining, the gel was scanned and analyzed using Biolight software (Vilber-Lourmat, Germany).

2.9 Statistical analysis

MICROSOFT EXCEL® (USA) was used for statistical analyses. Results are expressed as mean ± S.D. unless noted otherwise. Differences with p < 0.05 were considered significant.
The detection limits (3 S/N) were calculated according to Long [98], whereas N was expressed as standard deviation of noise determined in the signal domain. The other approaches of for estimation of detection limits were reported by Lavagnini et al. [99].

3. Results and Discussion

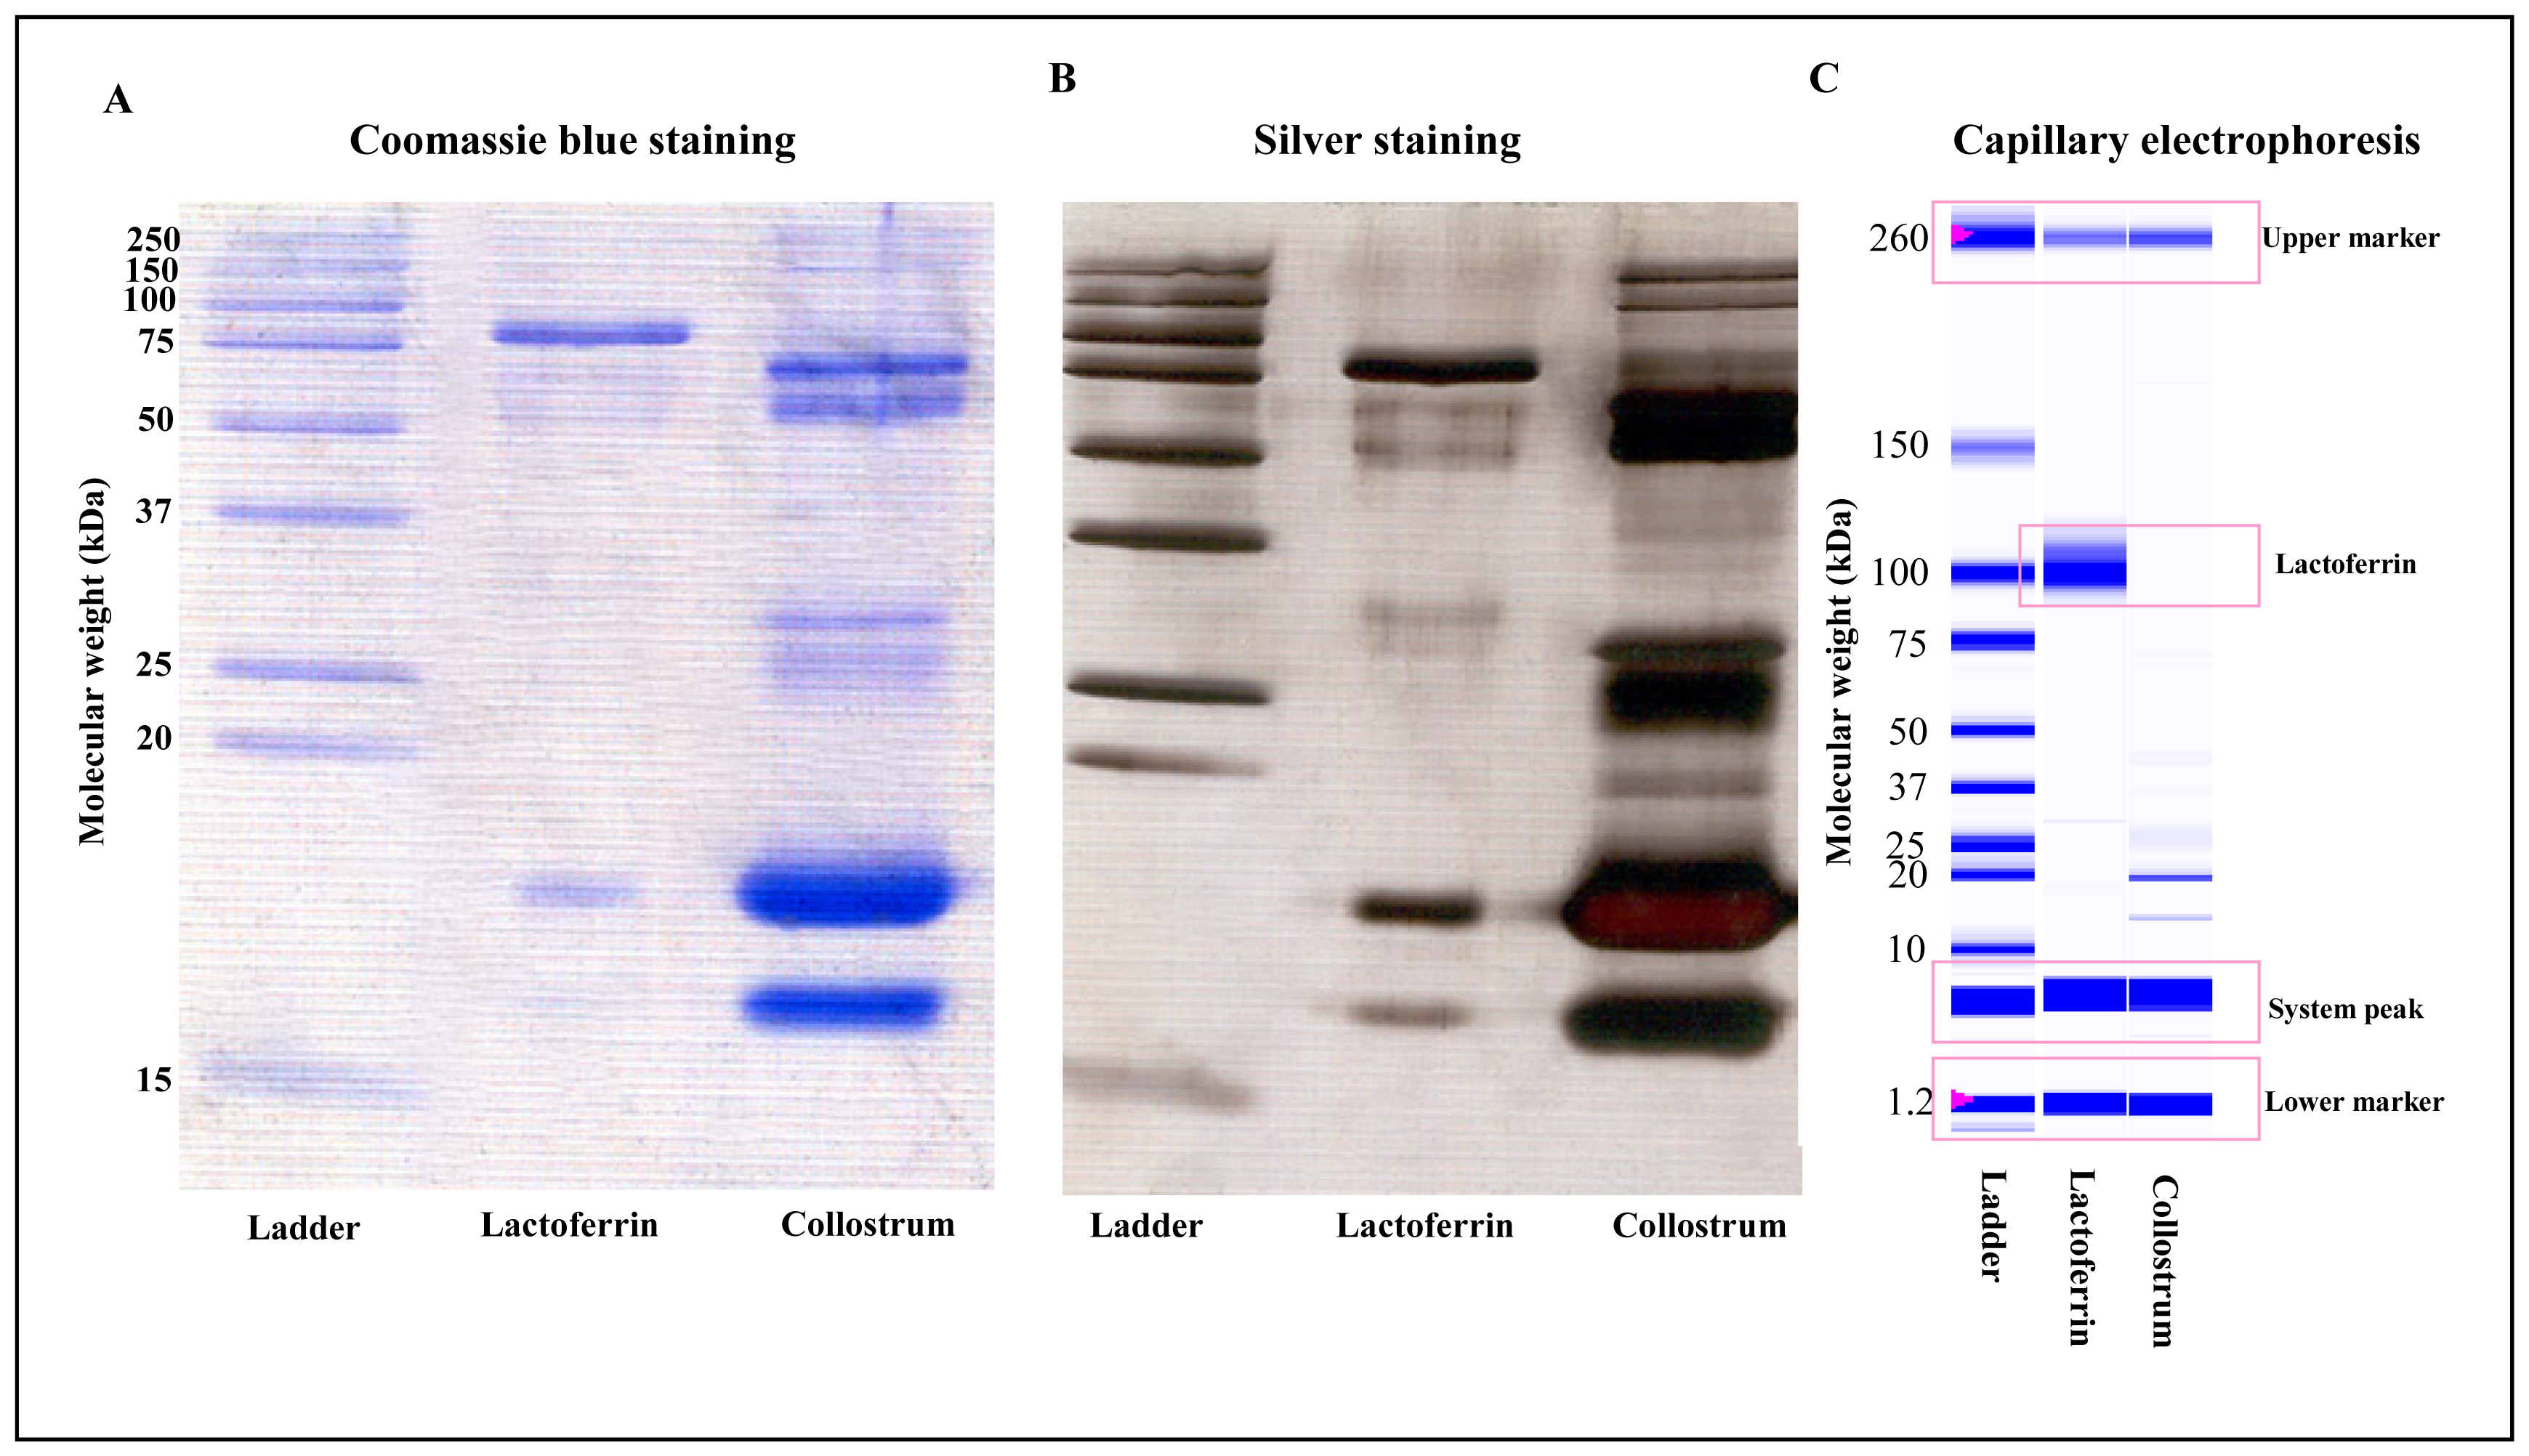
3.1 SDS-PAGE and Experion analysis of lactoferrin

Lactoferrin as protein with high molecular weight is minor constituent of real samples like cow milk. As it is mentioned in “Introduction” section, lactoferrin has many beneficial biological effects to men's and animal's health. To isolate the protein from a sample separation technique with maximum recovery and ability to pure the product is needed. Milk is the most important source of lactoferrin, but it contains considerable amounts of other proteins as it is shown in Fig. 2. Primarily we employed SDS-PAGE and Experion to isolate lactoferrin from the collostrum sample prepared as described in “Experimental section”. At the end of the separation Coomassie blue staining followed and the expressive band of lactoferrin at molecular weight 77 kDa was detectable (Fig. 2A line 2 and 3). Similarly to Coomassie blue staining if we stained by silver, the majority bands of lactoferrin were also visible (Fig. 2B). However SDS-PAGE cannot be utilized for routine analysis due to labouring and time consuming preparation of the gel, lower sensitivity and hard obtaining of the fraction with lactoferrin from the gel. Moreover we tested Experion to isolate lactoferrin from the collostrum sample. The result of the electrophoretic analysis is shown in Fig. 2C. The well developed signal of lactoferrin was determined. In spite of the fact that Experion is faster than SDS-PAGE the lack of using of Experion for routine analysis is low volume of a sample, therefore low amounts of isolated lacotoferrin we can get. Besides that both technique shown that many other proteins are presented in the collostrum samples (Fig. 2).

3.1 Lactoferrin separation using monolithic column

Due to routine application, we have tested third separation technique, ion exchange chromatography, using monolithic column. The samples of colostrums were prepared as described in “Experimental section” and analysed by using liquid chromatography coupled with UV-VIS detector (LC-UV-VIS). One millilitre of the cow colostrum was introduced discontinuously to the separation system consisting of peristaltic pump Minipuls 3 (Gilson, France), cation exchanger CIM disc in monolithic column (BIA separations, Slovenia) and UV/VIS detector (ESA, USA). The scheme of the instrument is shown in inset in Fig. 3. The prepared colostrum sample was separated using monolithic column. Proteins separation on CIM disc containing –SO3 groups is based on the change of the proteins charges at different pH and ionic strength. It is a common knowledge that isoelectric point (pI) is the pH, at which a particular molecule carries no net electrical charge. If the value of the pH is higher than pI of protein, this protein has general negative charge. This effect is used in cation exchange chromatography on monolithic column. Next advantage of the monolithic disc is its high porosity and consequently relatively low working pressure to which the column as well as compounds in the column are exposed.
For the isolation of lactoferrin the following process was used. After the introducing of the sample the inlet was reconnected from real sample to stock solution of the working phosphate buffer (retention solution) and the buffer was twenty minutes pumped through the system at flow rate of 0.75 ml/min to separated proteins with isoelectric point under 7.25 out of the ion exchange monolithic column. At 21st minute the inlet was immersed to the elution solution (1.5 M NaCl) with flow rate of 0.25 ml/min. At 35th minute the analysis was stopped and chromatogram was processed with CSW 32 software. The resulted chromatogram is shown in Fig. 3.

3.2 Optimization of lactoferrin isolation at monolithic column

When we found that we were able to analyse colostrum using LC-UV-VIS system, we attempted to optimize experimental conditions such wave length, concentration of NaCl in the elution buffer and flow rate. Lactoferrin (100 μg/ml) was introduced onto monolithic column in the presence of the working phosphate buffer. The first experimental condition, which was optimized, was the wave length. We found that the most suitable wave length is 280 nm, which is commonly used for determination of mostly of proteins (Fig. 4A). Further we aimed our attention on effect of the ionic strength of the elution solution on height of the lactoferrin signal. Low ionic strength and physico-chemical properties of lactoferrin led to its higher retention on monolithic column and to lower response. Higher ionic strength resulted in enhancing of the signal. The highest signal was determined at 1.5 M NaCl (Fig. 4B).
The last optimized experimental parameter was flow rate of the retention and elution solutions. The most suitable flow rates for the retention solution was 0.25 ml/min and for the elution solution 0.75 ml/min. The lower flow rate of the retention solution probably related with better retardation of lactoferrin at the column (Fig. 4C). The separation of lactoferrin is structurally very regardful, which means that under low pressure the structure of lactoferrin is almost unchanged. This fact was confirmed by analysis of the fraction using SDS-PAGE (not shown).

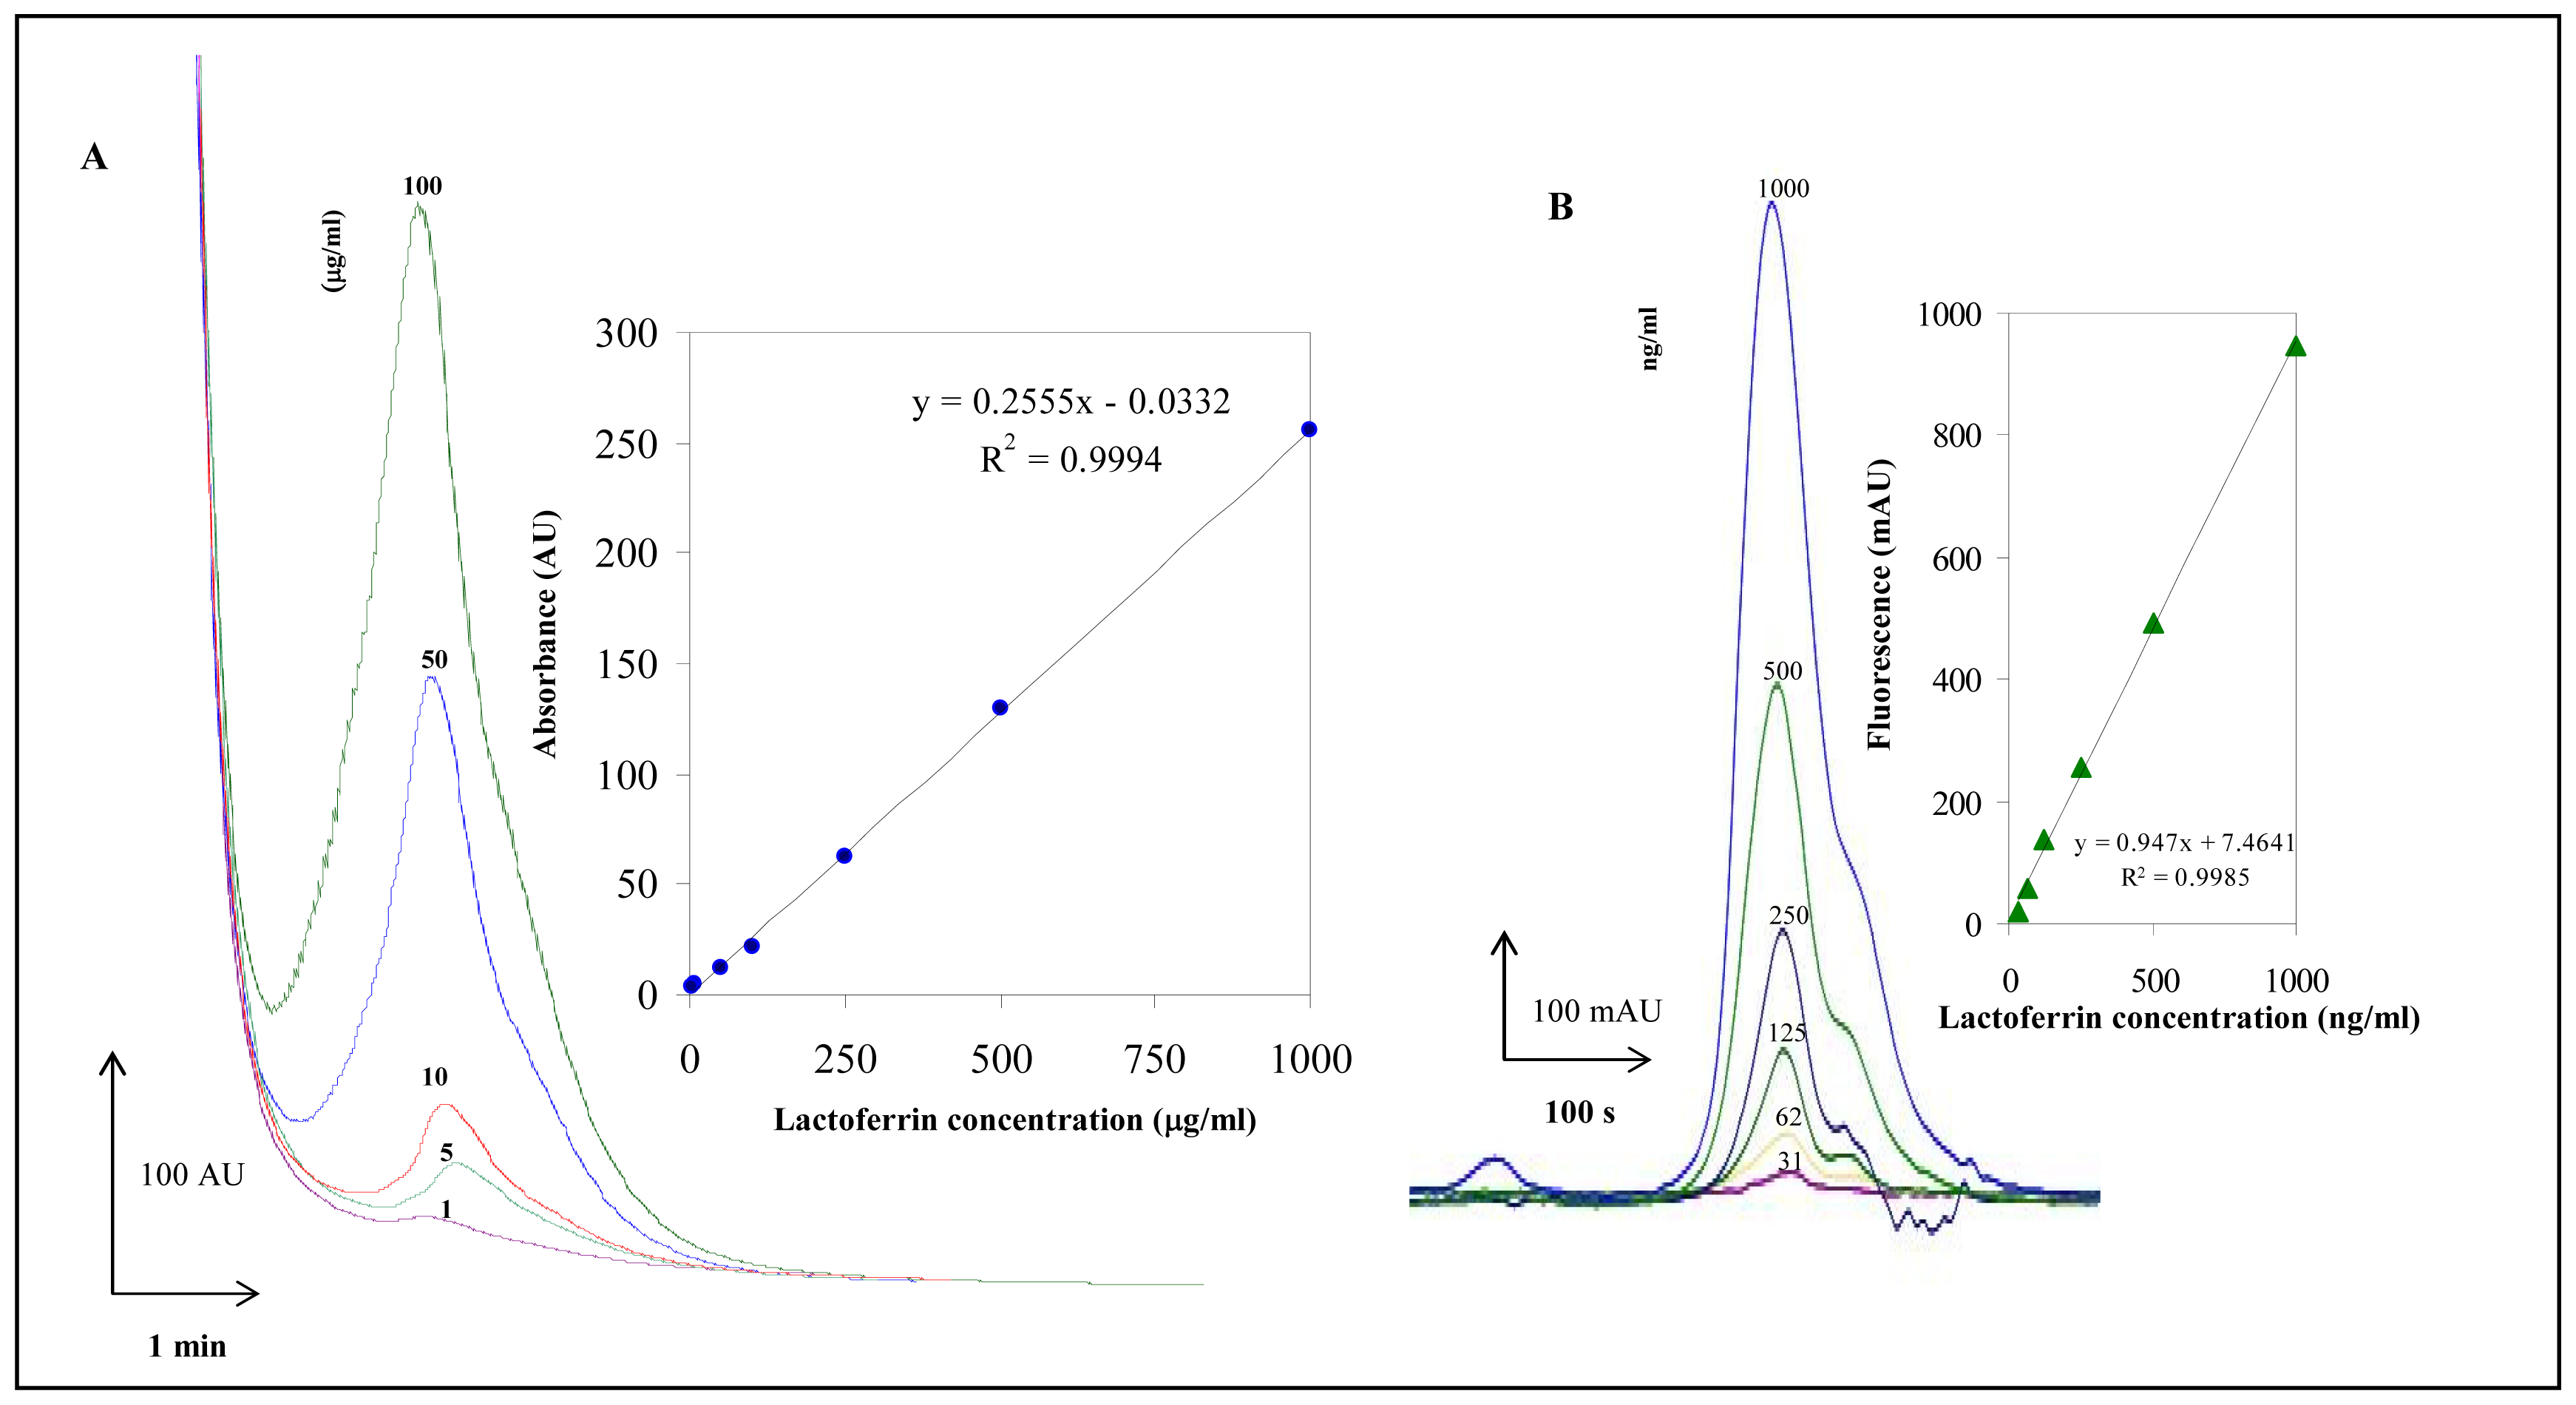
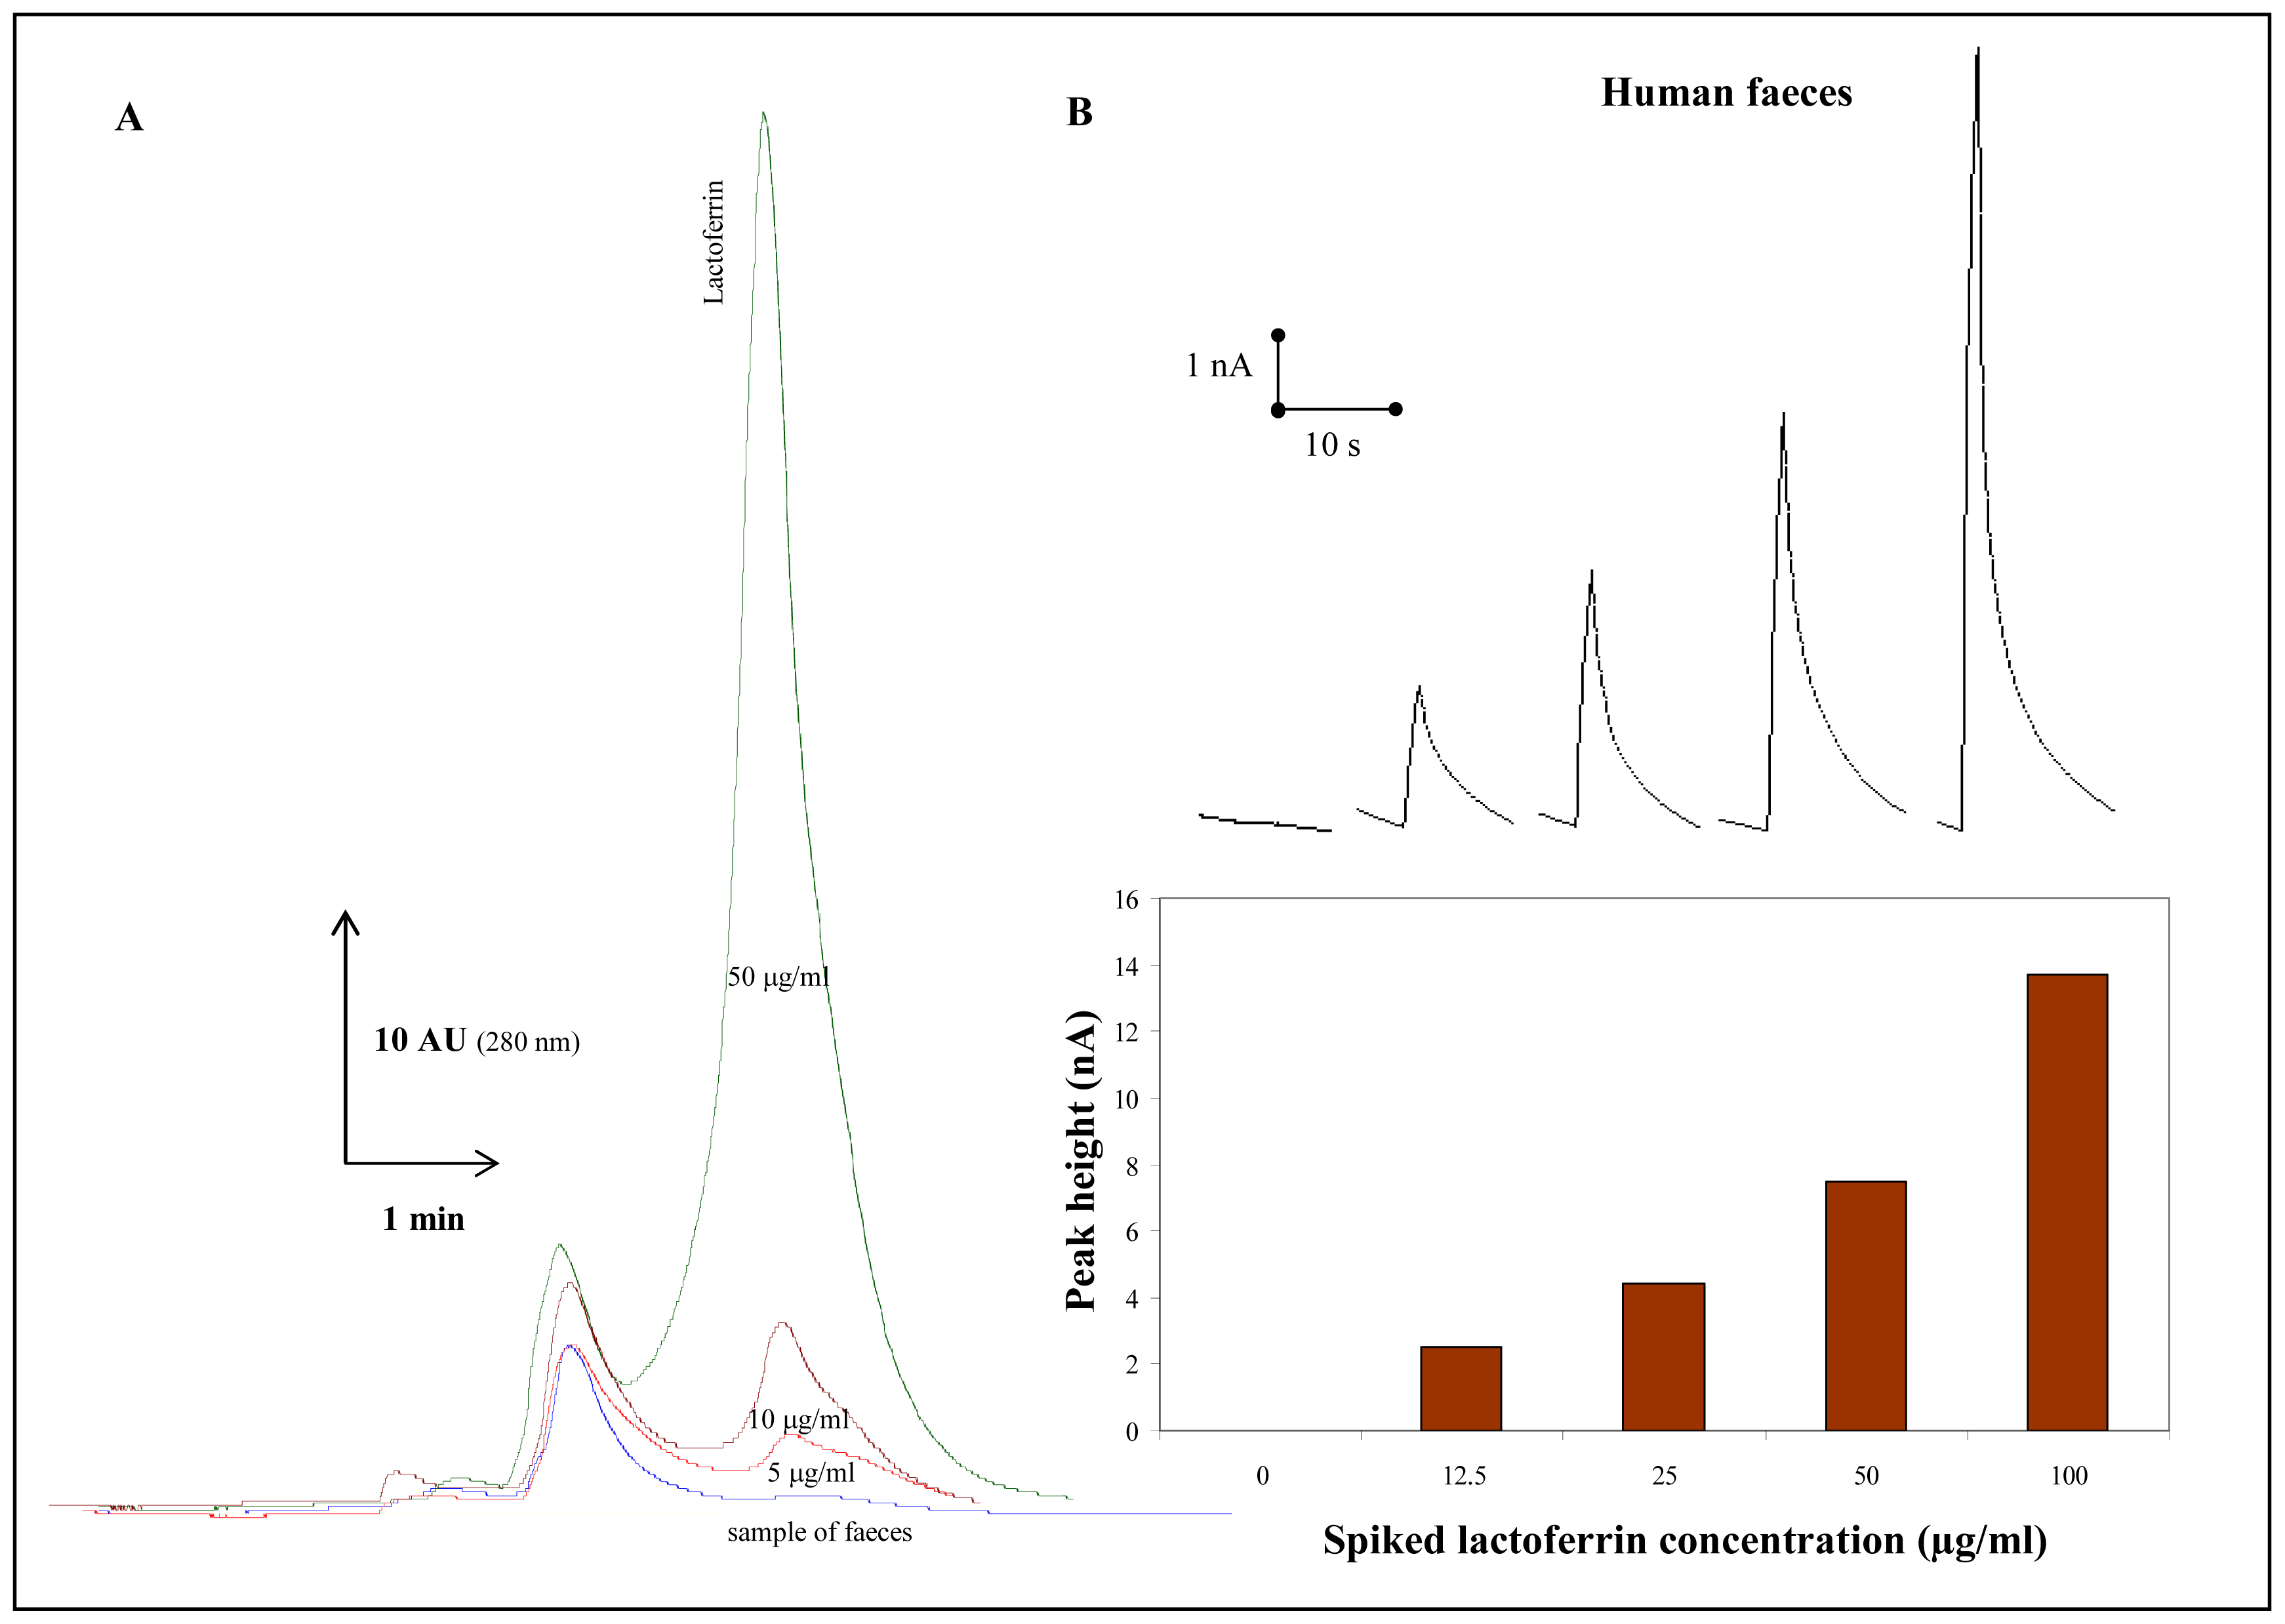
3.3 Detection limits

Under the optimized experimental conditions (wave length 280 nm, ionic strength of the elution solution 1.5 M NaCl, and flow rate of the retention 0.25 ml/min and elution 0.75 ml/min solutions) we measured the dependence of lactoferrin signal on its concentration. The chromatograms obtained are shown in Fig. 5A. The calibration dependence was strictly linear with regression equation y = 0.2555x – 0.0332; R2 = 0.9994. The detection limit (3 S/N) was estimated as 0.1 μg/ml of lactoferrin. Due to poor quantification of lactoferrin using SDS-PAGE we did not estimate detection limit. In spite of the fact that Experion is not suitable for routine analysis, we measured the dependence of the fluorescence on concentration of lactoferrin. The electrophoretic records of 31, 62, 125, 250, 500 and 1 000 ng/ml of lactoferrin are shown in Fig. 5B. The signal height was proportional to concentration of the target molecule with the equation y = 0.947x + 7.461; R2 = 0.9985. The limit of detection (3 S/N) for lactoferrin estimated by chip electrophoresis was 20 ng/ml. It clearly follows that the Experion system has the lower detection limit compared to LC-UV-VIS instrument. Nevertheless we employed LC-UV-VIS in the following experiments due ability of the instrument to be used in routine analysis.

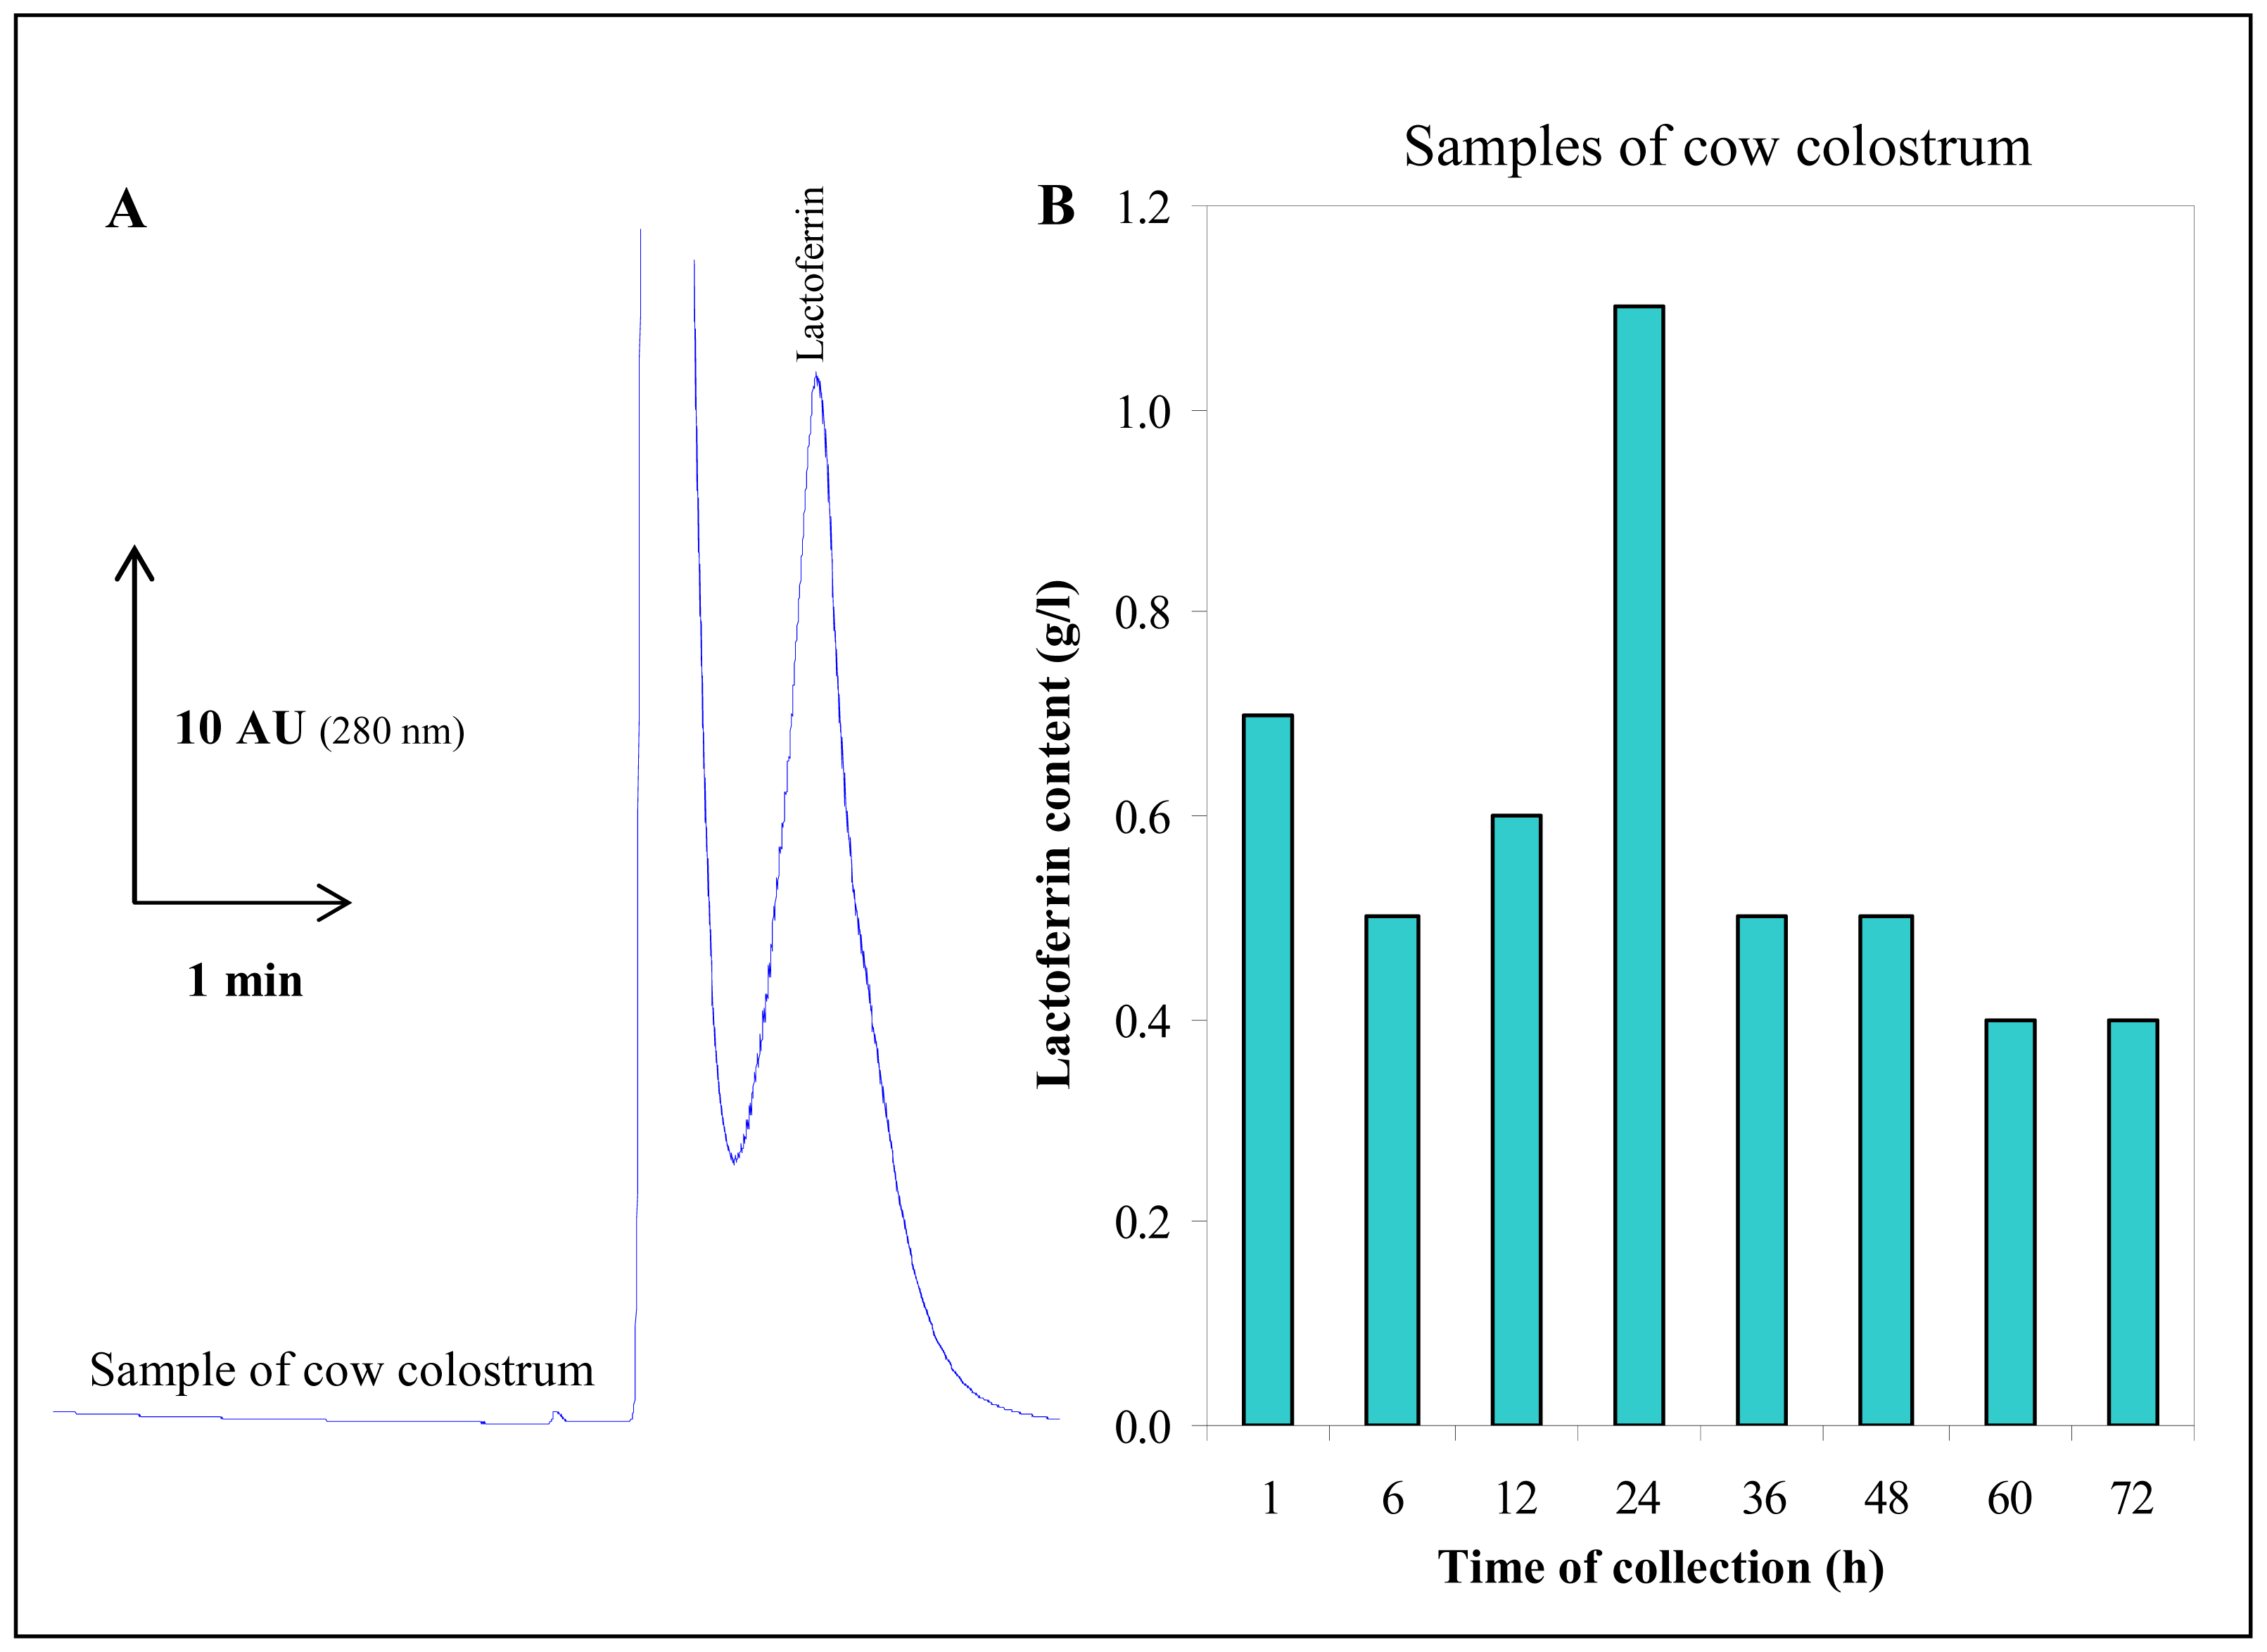
3.4 Lactoferrin isolation from cow colostrum

Lactoferrin was isolated from cow colostrums by LC-UV-VIS instrument under the optimized conditions. The colostrums were sampled up to 72 h after birth. The collected samples were deep-frozen prior to analysis. The samples were prepared according to procedure mentioned in “Experimental section” and analysed at monolithic column. The typical chromatogram of isolated lactoferrin is shown in Fig. 6A. The signal of lactoferrin is well developed. We determined that lactoferrin concentration varied from 0.5 g/l to 1.1 g/l in colostrums (Fig. 6B). The average concentration was estimated as 0.6 g/l. The highest lactoferrin concentration was determined in sample collected 24 h after the birth.

3.5 Electrochemical detection of lactoferrin

Recently we published the paper reported on detection of lactoferrin by flow injection analysis coupled with electrochemical detection (FIA-ED) [63]. We showed that FIA-ED can be used for determination of structural changes of the target protein. In the present paper we were interested in the issue whether we can employ stationery electrochemical instrument Autolab for the same purposes. We used a standard cell with three electrodes. The electrode system consisted of a carbon-paste working electrode (CPE), an Ag/AgCl/3 M KCl reference electrode, and glassy carbon counter electrode. The electrochemical behaviour of lactoferrin (1 μg/ml) at CPE in the presence of acetate buffer (pH 5.0) was measured by linear sweep voltammetry. In electrochemical scans the oxidative signal of lactoferrin was observed at potential ∼ 0.8 V (Fig. 7). Obtained lactoferrin signals were well developed and detectable. The detection limit was estimated as submicrograms of lactoferrin per millilitre. The fact encouraged us to attempt to miniaturize whole detection system and to test it on analysis of real samples of human faeces, because lactoferrin level in faeces is closely associated with the inflammations of intestine mucous membrane. For the purpose of miniaturization we employed the technology of printed electrodes.

3.6 Fabrication of miniaturised screen-printed electrodes

Miniaturised screen-printed electrodes were fabricated according to following procedure by screening on corundum plate. The motives of particular layers (screens) were suggested according to engaged presumptions and standards that are: width 5 mm, ratio of working and referent electrode areas 1/20, minimal distance of particular screens 0.2 mm, thickness of incoming conductors 0.5 mm and minimal overlap of conductive connections between individual layers 0.2 mm. Dimensions of the electrode system are: semi-diameter of working electrode W is 0.4 mm, for referent electrode the semi-diameters were 0.6 mm (inner) and 1.88 mm (outer). Working electrode in inner circle has 2.08 mm in semi-diameter. The shape and layers orientation are shown in Fig. 8. Screens for every layer were manufactured by company Guliwer Lanskroun (Czech Republic). For the realization the semiautomatic screening apparatus was utilized. A working electrode was made from carbon conductive composition paste DuPont 7105. The fabrication of the working electrode system was carried out with oven at 130°C for 5 min. A referent electrode consisted of the layer of Ag/AgCl imprinted on silver layer. This silver layer was made from DuPont paste dried for 15 min. in the oven at 120°C and subsequently burned out in the oven. A counter electrode was made from platinum paste, which was dried at 120°C for 15 min. in the oven and subsequently burned out in the oven. An isolation layer was printed in two layers. The dimensions of the electrode printed on corundum plate were 25.4 × 5. The fabricated screen-printed electrode was connected to BioStat via connector (Fig. 9). A measurement was performed as follows: i) the supporting electrolyte (10 μl of 0.1 M acetate buffer pH 5.0) was introduced onto the electrode, ii) the baseline was established and iii) the sample was introduced. At the end of a measurement the electrode was mechanically polished by cotton ball and water. The relative standard deviation of a measurement was 5 % (n = 10, lactoferrin 1 μg/ml). In addition the stability of the screen-printed electrode used was tested. We determined that a screen-printed electrode can be used for more than 50 measurements with relative standard deviation below 10 %.

3.7 A detection of lactoferrin using screen-printed electrodes

For sensitive amperometric lactoferrin detection the dependence of signal height on working electrode potential (hydrodynamic voltammogram) was determined. The potentials (from 350 to 1.000 mV) were applied on working electrode and the response was determined. The height of lactoferrin signals enhanced with increasing applied potentials gradually up to 750 mV a then deceased (Fig. 10A). The highest change in the signal height was observed between 650 and 750 mV. Maximal current response of lactoferrin was measured at 750 mV (Fig. 10A). This potential was used in the following experiments, in which we attempted to compare the fabricated screen-printed electrodes with commercially ones supplied by BVT Technologies. Using both types of the electrodes we measured calibration curve (Figs. 10B,C). It clearly follows from the results obtained that lactoferrin can be analysed using both electrodes. The dependence of signal height on lactoferrin concentration (calibration curve) measured by the commercial electrodes is shown in Fig. 10B. The plotted equation was y = 0.0871x + 0.6658; R2 = 0.9787 with relative standard deviation 6 %. The detection limit (3 S/N) of lactoferrin was estimated as 1 μg/ml. In the case of usage of the screen-printed electrodes fabricated by us the calibration curve had the equation y = 0.01x + 0.0778; R2 = 0.9730. The detection limit (3 S/N) of lactoferrin was estimated as 10 μg/ml (Fig. 10B). It follows from the results obtained that the responses measured by commercial electrodes are app. ten times higher compared with those measured by the electrodes fabricated by us. This phenomenon relates with smaller working electrode surface area of the electrodes fabricated by us (about 50 %) compared to the commercial ones.

3.8 Lactoferrin detection in faeces samples

The screen-printed electrodes fabricated by us were utilized for determination of lactoferrin faeces. Sample (0.2 mg) was shaken in 1 ml of 0.1 M acetate buffer, pH 5 and subsequently centrifuged. The lactoferrin in the supernatant obtained was isolated using monolithic column. The isolated lactoferrin was measured using the screen-printed electrodes. Regarding to fact that sample of faeces was obtained from young and healthy man the amount of lactoferrin in sample was under the limit of detection of this method. Due to this fact the sample was spiked by the different quantities of lactoferrin. Primarily we utilized LC-UV-VIS instrument to detect the spiked lactoferrin (Fig. 11A). As it is shown in Fig. 11B, lactoferrin was detectable in the sample of the lactoferrin spiked faeces also by the screen-printed electrodes. The obtained amperometric responses were well developed and detectable (Fig. 11B).

4. Conclusion

Research and development in this of proposing new sensors and biosensors is wide and multidisciplinary, spanning biochemistry, bioreactor science, physical chemistry, electrochemistry, electronics and software engineering. Most of this current endeavour concerns potentiometric and amperometric biosensors and colorimetric paper enzyme strips [77,82-85,88]. Here we report on coupling of monolithic column separation and electrochemical detection at the screen-printed electrodes as a tool for determination of lactoferrin.

Acknowledgments

We gratefully acknowledge the Grant Agency of the Czech Republic (grant No. GACR 102/08/1546) for the financial support to this work.

References

  1. Bezkorovainy, A. Human milk and colostrum proteins - review. J. Dairy Sci 1977, 60, 1023–1037. [Google Scholar]
  2. Sanchez, L.; Aranda, P.; Perez, M.D.; Calvo, M. Concentration of Lactoferrin and Transferrin Throughout Lactation in Cows Colostrum and Milk. Biol. Chem. Hoppe-Seyler 1988, 369, 1005–1008. [Google Scholar]
  3. Sanchez, L.; Calvo, M.; Brock, J.H. Biological Role of Lactoferrin. Arch. Dis. Child 1992, 67, 657–661. [Google Scholar]
  4. Sanchez, L.; Peiro, J.M.; Castillo, H.; Perez, M.D.; Ena, J.M.; Calvo, M. Kinetic-Parameters for Denaturation of Bovine-Milk Lactoferrin. J. Food Sci 1992, 57, 873–879. [Google Scholar]
  5. Sharp, P.; Srai, S.K. Molecular mechanisms involved in intestinal iron absorption. World J. Gastroenterol 2007, 13, 4716–4724. [Google Scholar]
  6. Levay, P.F.; Viljoen, M. Lactoferrin - a General-Review. Haematologica 1995, 80, 252–267. [Google Scholar]
  7. Brisson, G.; Britten, M.; Pouliot, Y. Heat-induced aggregation of bovine lactoferrin at neutral pH: Effect of iron saturation. Int. Dairy J 2007, 17, 617–624. [Google Scholar]
  8. Bernal, V.; Jelen, P. Thermal-Stability of Whey Proteins - a Calorimetric Study. J. Dairy Sci 1985, 68, 2847–2852. [Google Scholar]
  9. Baker, E.N.; Baker, H.M. Molecular structure, binding properties and dynamics of lactoferrin. Cell. Mol. Life Sci 2005, 62, 2531–2539. [Google Scholar]
  10. Baker, H.M.; Baker, E.N. Lactoferrin and iron: structural and dynamic aspects of binding and release. Biometals 2004, 17, 209–216. [Google Scholar]
  11. Weinberg, E.D. Antibiotic properties and applications of lactoferrin. Curr. Pharm. Design 2007, 13, 801–811. [Google Scholar]
  12. Struff, W.G.; Sprotte, G. Bovine colostrum as a biologic in clinical medicine: a review - Part I: Biotechnological standards, pharmacodynamic and pharmacolkinetic characteristics and principles of treatment. Int. J. Clin. Pharmacol. Ther 2007, 45, 193–202. [Google Scholar]
  13. Pan, Y.; Rowney, M.; Guo, P.; Hobman, P. Biological properties of lactoferrin: an overview. Aust. J. Dairy Technol 2007, 62, 31–42. [Google Scholar]
  14. Berlov, M.N.; Korableva, E.S.; Andreeva, Y.V.; Ovchinnikova, T.V.; Kokryakov, V.N. Lactoferrin from canine neutrophils: Isolation and physicochemical and antimicrobial properties. Biochem. -Moscow 2007, 72, 445–451. [Google Scholar]
  15. Piccinini, R.; Gabai, G.; Bailoni, L.; Simonetto, A.; Dapra, V.; Zecconi, A. Influence of the suppression of dry period on several blood and milk markers in dairy cows. Milchwiss.-Milk Sci. Int 2007, 62, 367–370. [Google Scholar]
  16. Hwang, S.A.; Wilk, K.M.; Budnicka, M.; Olsen, M.; Bangale, Y.A.; Hunter, R.L.; Kruzel, M.L.; Actor, J.K. Lactoferrin enhanced efficacy of the BCG vaccine to generate host protective responses against challenge with virulent Mycobacterium tuberculosis. Vaccine 2007, 25, 6730–6743. [Google Scholar]
  17. Hwang, S.A.; Wilk, K.M.; Bangale, Y.A.; Kruzel, M.L.; Actor, J.K. Lactoferrin modulation of IL-12 and IL-10 response from activated murine leukocytes. Med. Microbiol. Immunol 2007, 196, 171–180. [Google Scholar]
  18. Yoshise, R.E.; Matsumoto, M.; Chiji, H.; Kuwata, H.; Shin, K.; Yamauchi, K.; Tamura, Y.; Tanaka, T.; Kumura, H.; Shimazaki, K. Profiles of bovine lactoferrin in the gastrointestinal tracts of rats as observed by ELISA, Western blotting and SELDI-affinity MS. Milchwiss.-Milk Sci. Int 2007, 62, 446–450. [Google Scholar]
  19. Caraher, E.M.; Gumulapurapu, K.; Taggart, C.C.; Murphy, P.; McClean, S.; Callaghan, M. The effect of recombinant human lactoferrin on growth and the antibiotic susceptibility of the cystic fibrosis pathogen Burkholderia cepacia complex when cultured planktonically or as biofilms. J. Antimicrob. Chemother 2007, 60, 546–554. [Google Scholar]
  20. Beeckman, D.S.A.; Van Droogenbroeck, C.; De Cock, B.J.A.; Van Oostveltdt, P.; Vanrompay, D.C.G. Effect of ovotransferrin and lactoferrins on Chlamydophila psittaci adhesion and invasion in HD11 chicken macrophages. Vet. Res 2007, 38, 729–739. [Google Scholar]
  21. Hanson, L.A. Breast-feeding and immune function. Proc. Nutr. Soc 2007, 66, 384–396. [Google Scholar]
  22. Senkovich, O.; Cook, W.J.; Mirza, S.; Hollingshead, S.K.; Protasevich, II; Briles, D.E.; Chattopadhyay, D. Structure of a complex of human lactoferrin N-lobe with pneumococcal surface protein A provides insight into microbial defense mechanism. J. Mol. Biol 2007, 370, 701–713. [Google Scholar]
  23. Flach, C.F.; Qadri, F.; Bhuiyan, T.R.; Alam, N.H.; Jennische, E.; Lonnroth, I.; Holmgren, J. Broad up-regulation of innate defense factors during acute cholera. Infect. Immun 2007, 75, 2343–2350. [Google Scholar]
  24. Zullo, A.; De Francesco, V.; Scaccianoce, G.; Manes, G.; Efrati, C.; Hassan, C.; Maconi, G.; Pighonica, D.; Cannaviello, C.; Panella, C.; Morini, S.; Lerardi, E. Helicobacter pylori eradication with either quadruple regimen with lactoferrin or levofloxacin-based triple therapy: A multicentre study. Dig. Liver Dis 2007, 39, 806–810. [Google Scholar]
  25. Tursi, A.; Elisei, W.; Brandimarte, G.; Giorgetti, G.M.; Modeo, M.E.; Aiello, F. Effect of lactoferrin supplementation on the effectiveness and tolerability of a 7-day quadruple therapy after failure of a first attempt to cure Helicobacter pylori infection. Med. Sci. Monitor 2007, 13, CR187–CR190. [Google Scholar]
  26. Mistry, N.; Drobni, P.; Nasland, J.; Sunkari, V.G.; Jenssen, H.; Evander, M. The anti-papillomavirus activity of human and bovine lactoferricin. Antiviral Res 2007, 75, 258–265. [Google Scholar]
  27. Patel, S.; Hazrati, E.; Cheshenko, N.; Galen, B.; Yang, H.Y.; Guzman, E.; Wang, R.; Herold, B.C.; Keller, M.J. Seminal plasma reduces the effectiveness of topical polyanionic microbicides. J. Infect. Dis 2007, 196, 1394–1402. [Google Scholar]
  28. Kaito, M.; Iwasa, M.; Fujita, N.; Kobayashi, Y.; Kojima, Y.; Ikoma, J.; Imoto, I.; Adachi, Y.; Hamano, H.; Yamauchi, K. Effect of lactoferrin in patients with chronic hepatitis C: Combination therapy with interferon and ribavirin. J. Gastroenterol. Hepatol 2007, 22, 1894–1897. [Google Scholar]
  29. Redwan, E.M.; Tabll, A. Camel lactoferrin markedly inhibits hepatitis C virus genotype 4 infection of human peripheral blood leukocytes. J. Immunoass. Immunoch 2007, 28, 267–277. [Google Scholar]
  30. Novak, R.M.; Donoval, B.A.; Graham, P.J.; Boksa, L.A.; Spear, G.; Hershow, R.C.; Chen, H.Y.; Landay, A. Cervicovaginal levels of lactoferrin, secretory leukocyte protease inhibitor, and RANTES and the effects of coexisting vaginoses in human immunodeficiency virus (HIV)-seronegative women with a high risk of heterosexual acquisition of HIV infection. Clin. Vaccine Immunol 2007, 14, 1102–1107. [Google Scholar]
  31. Shaw, J.L.V.; Smith, C.R.; Diamandis, E.P. Proteomic analysis of human cervico-vaginal fluid. J. Proteome Res 2007, 6, 2859–2865. [Google Scholar]
  32. Tang, L.J.; De Seta, F.; Odreman, F.; Venge, P.; Piva, C.; Guaschino, S.; Garcia, R.C. Proteomic analysis of human cervical-vaginal fluids. J. Proteome Res 2007, 6, 2874–2883. [Google Scholar]
  33. Lupetti, A.; Brouwer, C.; Bogaards, S.J.P.; Welling, M.M.; de Heer, E.; Campa, M.; van Dissel, J.T.; Friesen, R.H.E.; Nibbering, P.H. Human lactoferrin-derived peptide's antifungal activities against disseminated Candida albicans infection. J. Infect. Dis 2007, 196, 1416–1424. [Google Scholar]
  34. Enrique, M.; Marcos, J.F.; Yuste, M.; Martinez, M.; Valles, S.; Manzanares, P. Antimicrobial action of synthetic peptides towards wine spoilage yeasts. Int. J. Food Microbiol 2007, 118, 318–325. [Google Scholar]
  35. Parodi, P.W. A role for milk proteins and their peptides in cancer prevention. Curr. Pharm. Design 2007, 13, 813–828. [Google Scholar]
  36. Buccigrossi, V.; De Marco, G.; Bruzzese, E.; Ombrato, L.; Bracale, I.; Polito, G.; Guarino, A. Lactoferrin induces concentration-dependent functional modulation of intestinal proliferation and differentiation. Pediatr. Res 2007, 61, 410–414. [Google Scholar]
  37. Mohan, K.; Gunasekaran, P.; Varalakshmi, E.; Hara, Y.; Nagini, S. In vitro evaluation of the anticancer effect of lactoferrin and tea polyphenol combination on oral carcinoma cells. Cell Biol. Int 2007, 31, 599–608. [Google Scholar]
  38. Kehoe, S.I.; Jayarao, B.M.; Heinrichs, A.J. A survey of bovine colostrum composition and colostrum management practices on Pennsylvania dairy farms. J. Dairy Sci 2007, 90, 4108–4116. [Google Scholar]
  39. Piccinini, R.; Binda, E.; Belotti, M.; Dapra, V.; Zecconi, A. Evaluation of milk components during whole lactation in healthy quarters. J. Dairy Res 2007, 74, 226–232. [Google Scholar]
  40. Shan, T.; Wang, Y.; Wang, Y.; Liu, J.; Xu, Z. Effect of dietary lactoferrin on the immune functions and serum iron level of weanling piglets. J. Anim. Sci 2007, 85, 2140–2146. [Google Scholar]
  41. Wang, Y.Z.; Shan, T.Z.; Xu, Z.R.; Feng, J.; Wang, Z.Q. Effects of the lactoferrin (LF) on the growth performance, intestinal microflora and morphology of weanling pigs. Anim. Feed Sci. Technol 2007, 135, 263–272. [Google Scholar]
  42. El-Hatmi, H.; Girardet, J.M.; Gaillard, J.L.; Yahyaoui, M.H.; Attia, H. Characterisation of whey proteins of camel (Camelus dromedarius) milk and colostrum. Small Ruminant Res 2007, 70, 267–271. [Google Scholar]
  43. Park, Y.W.; Juarez, M.; Ramos, M.; Haenlein, G.F.W. Physico-chemical characteristics of goat and sheep milk. Small Ruminant Res 2007, 68, 88–113. [Google Scholar]
  44. Han, Z.S.; Li, Q.W.; Zhang, Z.Y.; Xiao, B.; Gao, D.W.; Wu, S.Y.; Li, J.; Zhao, H.W.; Jiang, Z.L.; Hu, J.H. High-level expression of human lactoferrin in the milk of goats by using replication-defective adenoviral vectors. Protein Expr. Purif 2007, 53, 225–231. [Google Scholar]
  45. Schoepfer, A.M.; Trummler, M.; Seeholzer, P.; Criblez, D.H.; Seibold, F. Accuracy of four fecal assays in the diagnosis of colitis. Dis. Colon Rectum 2007, 50, 1697–1706. [Google Scholar]
  46. Angriman, I.; Scarpa, M.; D'Inca, R.; Basso, D.; Ruffolo, C.; Polese, L.; Sturniolo, G.C.; D'Amico, D.F.; Plebani, M. Enzymes in feces: Useful markers of chronic inflammatory bowel disease. Clin. Chim. Acta 2007, 381, 63–68. [Google Scholar]
  47. Zou, H.; Harrington, J.J.; Sugumar, A.; Klatt, K.K.; Smyrk, T.C.; Ahlquist, D.A. Detection of colorectal disease by stool defensin assay: An exploratory study. Clin. Gastroenterol. Hepatol 2007, 5, 865–868. [Google Scholar]
  48. Scarpa, M.; D'Inca, R.; Basso, D.; Ruffolo, C.; Polese, L.; Bertin, E.; Luise, A.; Frego, M.; Plebani, M.; Sturniolo, G.C.; D'Amico, D.F.; Angriman, I. Fecal lactoferrin and calprotectin after ileocolonic resection for Crohn's disease. Dis. Colon Rectum 2007, 50, 861–869. [Google Scholar]
  49. Hirata, I.; Hoshimoto, M.; Saito, O.; Kayazawa, M.; Nishikawa, T.; Murano, M.; Toshina, K.; Wang, F.Y.; Matsuse, R. Usefulness of fecal lactoferrin and hemoglobin in diagnosis of colorectal diseases. World J. Gastroenterol 2007, 13, 1569–1574. [Google Scholar]
  50. Walker, T.R.; Land, M.L.; Kartashov, A.; Saslowsky, T.M.; Lyerly, D.M.; Boone, J.H.; Rufo, P.A. Fecal lactoferrin is a sensitive and specific marker of disease activity in children and young adults with inflammatory bowel disease. J. Pediatr. Gastroenterol. Nutr 2007, 44, 414–422. [Google Scholar]
  51. D'Inca, R.; Dal Pont, E.; Di Leo, V.; Ferronato, A.; Fries, W.; Vettorato, M.G.; Martines, D.; Sturniolo, G.C. Calprotectin and lactoferrin in the assessment of intestinal inflammation and organic disease. Int. J. Colorectal Dis 2007, 22, 429–437. [Google Scholar]
  52. Giuffre, G.; Barresi, V.; Skliros, C.; Barresi, G.; Tuccari, G. Immunoexpression of lactoferrin in human sporadic renal cell carcinomas. Oncol. Rep 2007, 17, 1021–1026. [Google Scholar]
  53. Sabatucci, A.; Vachette, P.; Vasilyev, V.B.; Beltramini, M.; Sokolov, A.; Pulina, M.; Salvato, B.; Angelucci, C.B.; Maccarronel, M.; Cozzani, I.; Dainese, E. Structural characterization of the ceruloplasmin: Lactoferrin complex in solution. J. Mol. Biol 2007, 371, 1038–1046. [Google Scholar]
  54. Sokolov, A.V.; Pulina, M.O.; Ageeva, K.V.; Ayrapetov, M.I.; Berlov, M.N.; Volgin, G.N.; Markov, A.G.; Yablonsky, P.K.; Kolodkin, N.I.; Zakharova, E.T.; Vasilyev, V.B. Interaction of ceruloplasmin, lactoferrin, and myeloperoxidase. Biochem. -Moscow 2007, 72, 409–415. [Google Scholar]
  55. Chen, L.; Guo, C.; Guan, Y.P.; Liu, H.Z. Isolation of lactoferrin from acid whey by magnetic affinity separation. Sep. Purif. Technol 2007, 56, 168–174. [Google Scholar]
  56. Lu, R.R.; Xu, S.Y.; Wang, Z.; Yang, R.J. Isolation of lactoferrin from bovine colostrum by ultrafiltration coupled with strong cation exchange chromatography on a production scale. J. Membr. Sci 2007, 297, 152–161. [Google Scholar]
  57. Andersson, J.; Mattiasson, B. Simulated moving bed technology with a simplified approach for protein purification - Separation of lactoperoxidase and lactoferrin from whey protein concentrate. J. Chromatogr. A 2006, 1107, 88–95. [Google Scholar]
  58. Uchida, T.; Dosako, S.; Sato, K.; Kawakami, H. Sequential separation of lactoferrin, lactoperoxidase, and secretory component by sulfate-linked ion-exchange chromatography. Milchwiss.-Milk Sci. Int 2003, 58, 482–486. [Google Scholar]
  59. Yoshida, A.; Wei, Z.; Shinmura, Y.; Fukunaga, N. Separation of lactoferrin-a and -b from bovine colostrum. J. Dairy Sci 2000, 83, 2211–2215. [Google Scholar]
  60. Grasselli, M.; Cascone, O. Separation of lactoferrin from bovine whey by dye affinity chromatography. Neth. Milk Dairy J 1996, 50, 551–561. [Google Scholar]
  61. Almashikhi, S.A.; Lichan, E.; Nakai, S. Separation of Immunoglobulins and Lactoferrin from Cheese Whey by Chelating Chromatography. J. Dairy Sci 1988, 71, 1747–1755. [Google Scholar]
  62. Noh, K.H.; Rhee, M.S.; Imm, J.Y. Separation of lactoferrin from model whey protein mixture by reverse micelles formed by cationic surfactant. Food Sci. Biotechnol 2005, 14, 131–136. [Google Scholar]
  63. Zitka, O.; Horna, A.; Stejskal, K.; Zehnalek, J.; Adam, V.; Havel, L.; Zeman, L.; Kizek, R. Study of structural changes of lactoferrin using flow injection analysis with electrochemical detection on glassy carbon electrode. Acta Chim. Slov 2007, 54, 68–73. [Google Scholar]
  64. Billova, S.; Kizek, R.; Jelen, F.; Novotna, P. Square-wave voltammetric determination of cefoperazone in a bacterial culture, pharmaceutical drug, milk, and urine. Anal. Bioanal. Chem 2003, 377, 362–369. [Google Scholar]
  65. Billova, S.; Kizek, R.; Palecek, E. Differential pulse adsorptive stripping voltammetry of osmium-modified peptides. Bioelectrochemistry 2002, 56, 63–66. [Google Scholar]
  66. Kizek, R.; Masarik, M.; Kramer, K.J.; Potesil, D.; Bailey, M.; Howard, J.A.; Klejdus, B.; Mikelova, R.; Adam, V.; Trnkova, L.; Jelen, F. An analysis of avidin, biotin and their interaction at attomole levels by voltammetric and chromatographic techniques. Anal. Bioanal. Chem 2005, 381, 1167–1178. [Google Scholar]
  67. Kizek, R.; Trnkova, L.; Palecek, E. Determination of metallothionein at the femtomole level by constant current stripping chronopotentiometry. Anal. Chem 2001, 73, 4801–4807. [Google Scholar]
  68. Kizek, R.; Trnkova, L.; Sevcikova, S.; Smarda, J.; Jelen, F. Silver electrode as a sensor for determination of zinc in cell cultivation medium. Anal. Biochem 2002, 301, 8–13. [Google Scholar]
  69. Palecek, E.; Masarik, M.; Kizek, R.; Kuhlmeier, D.; Hassmann, J.; Schulein, J. Sensitive electrochemical determination of unlabeled MutS protein and detection of point mutations in DNA. Anal. Chem 2004, 76, 5930–5936. [Google Scholar]
  70. Potesil, D.; Mikelova, R.; Adam, V.; Kizek, R.; Prusa, R. Change of the protein p53 electrochemical signal according to its structural form - Quick and sensitive distinguishing of native, denatured, and aggregated form of the “guardian of the genome”. Protein J 2006, 25, 23–32. [Google Scholar]
  71. Adam, V.; Beklova, M.; Pikula, J.; Hubalek, J.; Trnkova, L.; Kizek, R. Shapes of differential pulse voltammograms and level of metallothionein at different animal species. Sensors 2007, 7, 2419–2429. [Google Scholar]
  72. Adam, V.; Mikelova, R.; Hubalek, J.; Hanustiak, P.; Beklova, M.; Hodek, P.; Horna, A.; Trnkova, L.; Stiborova, M.; Zeman, L.; Kizek, R. Utilizing of square wave voltammetry to detect flavonoids in the presence of human urine. Sensors 2007, 7, 2402–2418. [Google Scholar]
  73. Adam, V.; Zehnalek, J.; Petrlova, J.; Potesil, D.; Sures, B.; Trnkova, L.; Jelen, F.; Vitecek, J.; Kizek, R. Phytochelatin modified electrode surface as a sensitive heavy metal ions biosensor. Sensors 2005, 5, 70–84. [Google Scholar]
  74. Babula, P.; Huska, D.; Hanustiak, P.; Baloun, J.; Krizkova, S.; Adam, V.; Hubalek, J.; Havel, L.; Zemlicka, M.; Horna, A.; Beklova, M.; Kizek, R. Flow injection analysis coupled with carbon electrodes as the tool for analysis of naphthoquinones with respect to their content and functions in biological samples. Sensors 2006, 11, 1466–1482. [Google Scholar]
  75. Hubalek, J.; Hradecky, J.; Adam, V.; Krystofova, O.; Huska, D.; Masarik, M.; Trnkova, L.; Horna, A.; Klosova, K.; Adamek, M.; Zehnalek, J.; Kizek, R. Spectrometric and voltammetric analysis of urease – Nickel nanoelectrode as an electrochemical sensor. Sensors 2007, 7, 1238–1255. [Google Scholar]
  76. Krizkova, S.; Beklova, M.; Pikula, J.; Adam, V.; Horna, A.; Kizek, R. Hazards of secondary bromadiolone intoxications evaluated using high-performance liquid chromatography with electrochemical detection. Sensors 2007, 7, 1271–1286. [Google Scholar]
  77. Prasek, J.; Adamek, M.; Hubalek, J.; Adam, V.; Trnkova, L.; Kizek, R. New hydrodynamic electrochemical arrangement for cadmium ions detection using thick-film chemical sensor electrodes. Sensors 2006, 11, 1498–1512. [Google Scholar]
  78. Supalkova, V.; Huska, D.; Diopan, V.; Hanustiak, P.; Zitka, O.; Stejskal, K.; Baloun, J.; Pikula, J.; Havel, L.; Zehnalek, J.; Adam, V.; Trnkova, L.; Beklova, M.; Kizek, R. Electroanalysis of plant thiols. Sensors 2007, 7, 932–959. [Google Scholar]
  79. Supalkova, V.; Petrek, J.; Baloun, J.; Adam, V.; Bartusek, K.; Trnkova, L.; Beklova, M.; Diopan, V.; Havel, L.; Kizek, R. Multi-instrumental investigation of affecting of early somatic embryos of Spruce by cadmium(II) and lead(II) ions. Sensors 2007, 7, 743–759. [Google Scholar]
  80. Supalkova, V.; Petrek, J.; Havel, L.; Krizkova, S.; Petrlova, J.; Adam, V.; Potesil, D.; Babula, P.; Beklova, M.; Horna, A.; Kizek, R. Electrochemical sensors for detection of acetylsalicylic acid. Sensors 2006, 11, 1483–1497. [Google Scholar]
  81. Zitka, O.; Huska, D.; Krizkova, S.; Adam, V.; Chavis, G.J.; Trnkova, L.; Horna, A.; Hubalek, J.; Kizek, R. An investigation of glutathione-platinum(II) interactions by means of the flow injection analysis using glassy carbon electrode. Sensors 2007, 7, 1256–1270. [Google Scholar]
  82. Adam, V.; Hanustiak, P.; Krizkova, S.; Beklova, M.; Zehnalek, J.; Trnkova, L.; Horna, A.; Sures, B.; Kizek, R. Palladium biosensor. Electroanalysis 2007, 19, 1909–1914. [Google Scholar]
  83. Adam, V.; Krizkova, S.; Zitka, O.; Trnkova, L.; Petrlova, J.; Beklova, M.; Kizek, R. A determination of apo-metallothionein using adsorptive transfer stripping technique in connection with differential pulse voltammetry. Electroanalysis 2007, 19, 339–347. [Google Scholar]
  84. Adam, V.; Petrlova, J.; Potesil, D.; Zehnalek, J.; Sures, B.; Trnkova, L.; Jelen, F.; Kizek, R. Study of metallothionein modified electrode surface behaviour in the presence of heavy metal ions -biosensor. Electroanalysis 2005, 17, 1649–1657. [Google Scholar]
  85. Petrlova, J.; Krizkova, S.; Zitka, O.; Hubalek, J.; Prusa, R.; Adam, V.; Wang, J.; Beklova, M.; Sures, B.; Kizek, R. Utilizing a chronopotentiometric sensor technique for metallothionein determination in fish tissues and their host parasites. Sens. Actuator B-Chem 2007, 127, 112–119. [Google Scholar]
  86. Petrlova, J.; Masarik, M.; Potesil, D.; Adam, V.; Trnkova, L.; Kizek, R. Zeptomole detection of streptavidin using carbon paste electrode and square wave voltammetry. Electroanalysis 2007, 19, 1177–1182. [Google Scholar]
  87. Petrlova, J.; Potesil, D.; Mikelova, R.; Blastik, O.; Adam, V.; Trnkova, L.; Jelen, F.; Prusa, R.; Kukacka, J.; Kizek, R. Attomole voltammetric determination of metallothionein. Electrochim. Acta 2006, 51, 5112–5119. [Google Scholar]
  88. Petrlova, J.; Potesil, D.; Zehnalek, J.; Sures, B.; Adam, V.; Trnkova, L.; Kizek, R. Cisplatin electrochemical biosensor. Electrochim. Acta 2006, 51, 5169–5173. [Google Scholar]
  89. Potesil, D.; Petrlova, J.; Adam, V.; Vacek, J.; Klejdus, B.; Zehnalek, J.; Trnkova, L.; Havel, L.; Kizek, R. Simultaneous femtomole determination of cysteine, reduced and oxidized glutathione, and phytochelatin in maize (Zea mays L.) kernels using high-performance liquid chromatography with electrochemical detection. J. Chromatogr. A 2005, 1084, 134–144. [Google Scholar]
  90. Stejskal, K.; Krizkova, S.; Adam, V.; Sures, B.; Trnkova, L.; Zehnalek, J.; Hubalek, J.; Beklova, M.; Hanustiak, P.; Svobodova, Z.; Horna, A.; Kizek, R. Bio-assessing of environmental pollution via monitoring of metallothionein level using electrochemical detection. IEEE Sens. J. 2008, in press. [Google Scholar]
  91. Supalkova, V.; Beklova, M.; Baloun, J.; Singer, C.; Sures, B.; Adam, V.; Huska, D.; Pikula, J.; Rauscherova, L.; Havel, L.; Zehnalek, J.; Kizek, R. Affecting of aquatic vascular plant Lemna minor by cisplatin revealed by voltammetry. Bioelectrochemistry 2008. [Google Scholar] [CrossRef]
  92. Zitka, O.; Stejskal, K.; Kleckerova, A.; Adam, V.; Beklova, M.; Horna, A.; Havel, L.; Kizek, R. Utilizing of electrochemical techniques for detection of biological samples. Chem. Listy 2007, 101, 225–231. [Google Scholar]
  93. Kizek, R.; Vacek, J.; Trnkova, L.; Klejdus, B.; Havel, L. Application of catalytic reactions on a mercury electrode for electrochemical detection of metallothioneins. Chem. Listy 2004, 98, 166–173. [Google Scholar]
  94. Mikelova, R.; Baloun, J.; Petrlova, J.; Adam, V.; Havel, L.; Petrek, J.; Horna, A.; Kizek, R. Electrochemical determination of Ag-ions in environment waters and their action on plant embryos. Bioelectrochemistry 2007, 70, 508–518. [Google Scholar]
  95. Prusa, R.; Potesil, D.; Masarik, M.; Adam, V.; Kizek, R.; Jelen, F. Fast and sensitive electrochemical detection of native, denatured, and aggregated forms of tumor suppressor protein p53. Mol. Biol. Cell 2004, 15, 249A–249A. [Google Scholar]
  96. Laemmli, U.K. Cleavage of Structural Proteins During Assembly of Head of Bacteriophage-T4. Nature 1970, 227, 680–685. [Google Scholar]
  97. Diezel, W.; Hofmann, E.; Kopperschlager, G. Improved Procedure for Protein Staining in Polyacrylamide Gels with a New Type of Coomassie Brilliant Blue. Anal. Biochem 1972, 48, 617–620. [Google Scholar]
  98. Long, G.L.; Winefordner, J.D. Limit of Detection. Anal. Chem 1983, 55, A712–A724. [Google Scholar]
  99. Lavagnini, I.; Antiochia, R.; Magno, F. A calibration-base method for the evaluation of the detection limit of an electrochemical biosensor. Electroanalysis 2007, 19, 1227–1230. [Google Scholar]
Figure 1. The comparison of aminoacid composition of lactofferine isolated from human, bovine, water buffalo, camel, goat, horse, mouse and pig. The data were obtained in database www.expasy.ch.
Sensors 08 00464f1
Figure 2. SDS-PAGE with (A) Coomassie blue staining or (B) Silver staining and (C) Experion capillary electrophoresis of ladder, lactoferrin standard (100 μg/ml) and milk sample
Sensors 08 00464f2
Figure 3. LC-UV-VIS chromatogram of analysis of cow colostrum at monolithic column. Absorbance was measured at 280 nm. In inset: the scheme of LC-UV-VIS system.
Sensors 08 00464f3
Figure 4. The influence of (A) wave length, (B) ionic strength of the elution solution (NaCl) and (C) flow of the elution solution on height of the lactoferrin signal.
Sensors 08 00464f4
Figure 5. The dependence of signal height on lactoferrin concentration measured by (A) LC-UV-VIS instrument and (B) Experion system.
Sensors 08 00464f5
Figure 6. (A) The typical chromatogram of colostrum sampled 12 h after birth. (B) Lactoferrin level in cow colostrums according time of their sampling.
Sensors 08 00464f6
Figure 7. The typical linear sweep voltammogram of lactoferrin measured at carbon paste electrode. Lactoferrin concentration was 1 μg/ml, Acetate buffer (0.1 M CH3COOH + 0.1 M CH3COONa, pH 5.0) was used as the supporting electrolyte. The linear sweep voltammetric parameters were as follows: initial potential of 0 V, end potential 1.5 V, step potential 5 mV, scan rate 50 mV/s. Experimental data were processed using smoothing and baseline correction.
Sensors 08 00464f7
Figure 8. Individual in colour distinguished layers of the screen-printed electrode. Purple – referent electrode, light blue – counter electrode, yellow – working electrode, blue – inputs and green - insulation. Size: sensor length – 25 mm, sensor width – 5 mm and thickness – 0.65 mm.
Sensors 08 00464f8
Figure 9. Photography of the connection and arrangement of the screen-printed electrodes.
Sensors 08 00464f9
Figure 10. Amperometric lactoferrin detection at screen-printed carbon electrodes. (A) Hydrodynamic voltammogram of lactoferrin (100 μg/ml) measured using the screen-printed electrodes fabricated by us. Dependence of lactoferrin signal height on its concentration measured (B) by the commercial electrodes BVT and/or (C) by electrodes fabricated by us. In insets to B and C: real lactoferrin signals measured by the electrodes. Working potential 750 mV (B,C), volume of the supporting electrolyte (0.1 M acetate buffer, pH 5.0) 10 μl, sample volume 5 μl.
Sensors 08 00464f10
Figure 11. Isolation of lactoferrin using monolithic column in sample of faeces spiked by 0, 12.5, 25, 50 and 100 μg/ml of the target protein. (A) Typical chromatograms of spiked lactoferrin to faces sample measured at 280 nm by LC-UV-VIS. (B) Amperometric lactoferrin detection at the screen-printed electrodes fabricated by us.
Sensors 08 00464f11

