Article

Cytotoxicity Investigation on Cultured Human Blood Cells Treated with Single-Wall Carbon Nanotubes

by
Olga Zeni
1,*,
Rosanna Palumbo
2,
Romeo Bernini
1,
Luigi Zeni
3,
Maurizio Sarti
1 and
Maria Rosaria Scarfì
1
1
Istituto per il Rilevamento Elettromagnetico dell’Ambiente (IREA) - CNR, Via Diocleziano, 328, 80124 Napoli, Italy
2
Istituto di Biostrutture e Bioimmagini (IBB) – CNR, Via Mezzocannone, 16, 80137 Napoli, Italy
3
Seconda Università degli Studi di Napoli, Dipartimento di Ingegneria dell' Informazione (DII), Aversa, Italy
*
Author to whom correspondence should be addressed.
Sensors 2008, 8(1), 488-499; https://doi.org/10.3390/s8010488
Submission received: 29 October 2007 / Accepted: 16 January 2008 / Published: 24 January 2008
(This article belongs to the Special Issue Optical Biosensors)

Abstract

:
The single-wall carbon nanotubes (SWCNTs) are one of the new materials of emerging technologies. They are becoming increasingly studied for the possible applications in electronics, optics and biology. In particular, very promising fields of application are the development of optical biosensors and the intracellular drug delivery. Nevertheless, there is a paucity of information on their toxicological properties and on potential human health risk. In the present study the SWCNTs were investigated for the possible induction of toxicity in human blood cells. Cell growth, viability, apoptosis and metabolic activity were evaluated in proliferating human peripheral blood lymphocytes. In un-stimulated human leukocytes primary DNA damage was also evaluated. SWCNTs concentrations ranging from 1 to 50 μg/ml were tested, and treatment duration varied from 6 to 72 h, in accordance with the biological target investigated. A statistically significant decrease in cell growth was found in cells treated with the highest concentrations (25 and 50 μg/ml). Such decrease was not associated to cell death or apoptosis, but it was demonstrated to be related to a decrease in metabolic activity, as assessed by resazurin assay. Moreover, treatments of 6 h with SWCNTs concentrations of 1, 5 and 10 μg/ml failed to induce primary DNA damage on the entire human leukocytes population.

1. Introduction

Nanotechnology has emerged at the forefront of science research and technology development. Carbon nanotubes (CNTs) are major building blocks of this new technology. Because of their excellent physical properties (high tensile strengths, ultra-light weight, thermal and chemical stability, metallic and semi-conductive electronic properties), CNTs have sparked a great research interest and are being developed for multiple commercial applications including biosensors, molecular transporters for drug delivery and novel biomaterials [1]. As widely recognized, risk is an important issue to consider in the early stage of any new technology but, to date, few information is available on how nanosized materials behave in the environment and in the human body. Because of their small size and high surface area, CNTs may produce greater chemical reactivity and induce permeability or conductivity changes in biological membranes [2].
Cytotoxicity is an important factor in understanding the mechanisms of action of such materials, moreover it is thought to play an important role in a number of pathological processes, including carcinogenesis and inflammation.
At the moment, studies on cytotoxicity of CNTs are scanty and report conflicting results mainly due to the different dispersion methods of CNTs employed [3]. In most studies skin and lung cells have been selected to evaluate cytotoxicity since entry through the skin or respiratory tract is the most likely route of exposure to such materials. Single (SWCNTs) and multi-wall carbon nanotubes (MWCNTs) have been demonstrated to affect several cell functions, even if in the literature no agreement exists on which of them is more toxic. Both SWCNTs and MWCNTs have been reported to induce oxidative stress, release of pro-inflammatory cytokines, decrease in cell viability in time and dose dependent manner in human keratinocyte cells [4-6] and impair phagocitic function in alveolar macrophages [7]. Moreover, MWCNTs induced apoptosis and necrosis in skin fibroblasts [8] and cytotoxicity and upregulation of TNF-α in rat peritoneal macrophages [9]. In the toxicity evaluation of CNTs with respect to human health, the response of human blood cells to CNTs is essential if they are to be used for biosensors, drug delivery or bio-imaging in health and disease. In fact, they would be among the first exposed cell types upon intravenous administration and, to our knowledge, just an experimental work on human blood cells has been reported by Bottini and co-workers. They examined the toxicity of pristine and oxidized MWCNTs on human T cells and Jurkat T leukaemia cells. They found that the oxidized MWCNTs were more toxic than the pristine ones, inducing loss of cell viability at doses of 400 μg/ml [10].
In this study, the ability of SWCNTs to induce cytotoxicity in human peripheral blood lymphocytes (HPBL) was assessed. Cell growth, viability, metabolic activity and apoptosis were monitored in proliferating HPBL treated with increasing doses of SWCNTs (5 to 50 μg/ml) for variable times on the basis of biological target investigated. Primary DNA damage was evaluated as marker of cytotoxicity and genotoxicity in un-stimulated HPBL treated for 6 h with 1, 5 and 10 μg/ml SWCNTs final concentrations.

2. Material and Methods

2.1 Reagents

RPMI-1640 medium and Foetal Bovine Serum (FBS) were from Biowhittaker (Verviers, Belgium); L-glutamine and phytohemagglutinin (PHA) were from Gibco (Milan, Italy); trypan blue and Tris were from BDH (Poole, England); resazurin, resorufin, triton X-100, p-iodonitrotetrazolium violet, L-lactic acid, phenazine methosulphate, NAD, dithiothreitol (DTT), HEPES, CHAPS and Methyl Methanesulfonate (MMS) were from SIGMA (St. Louis, MO, USA); Lymphoprep™ was from Axis-Shield (Oslo, Norway); dimethyl sulphoxide (DMSO), NaOH, EDTA and Na2EDTA were from Baker (Deventer, the Netherlands); NaCl, sodium acetate and ethanol were from Carlo Erba (Italy); normal-melting point agarose, low-melting point agarose, ethidium bromide, protein assay kit were from BIORAD laboratories (GmbH, Munich, Germany); carbobenzoxy-Asp-Glu-Val-Asp-7-amino-4-trifluoromethyl coumarin (Ac- DEVD-AFC) was from Alexis biochemicals (San Diego, CA).

2.2 Nanotubes characteristics and preparation

SWCNTs were obtained in highly purified form (>90%) from HeJi, Inc. (Hong Kong, China). According to the certificate of analysis reported by the manufacturer, they have an average outside diameter of 1.1 nm, an average length of 50 μm and the following components content in percentage: C 96.30; Al 0.08; Cl 0.41; Co 2.91; S 0.29. They are water insoluble and were suspended at a concentration of 0.5 mg/ml in RPMI medium, sterilized by autoclavation and dispersed by 3 h treatment in an ultrasound bath prior to being administered to the cells.

2.3 Lymphocytes isolation and culturing

The experiments were approved by the Ethical Committee of ASL Na 1. HPBLs were obtained with informed consent from anonymized buffy coats of healthy donors, provided by the “San Paolo” Hospital (Naples, Italy). They were isolated through lymphoprep density gradient centrifugation, in accordance with the manufacturer's instructions. Mononuclear cells were washed twice with phosphate-buffered saline (PBS) were seeded in RPMI 1640 medium supplemented with 15% heat-inactivated foetal bovine serum and 1% L-glutamine. PHA (1%) was added as mitogen to stimulate T-lymphocytes to enter the cell cycle [11].
HPBLs from at least 3 healthy donors were employed for each of the biological targets examined.

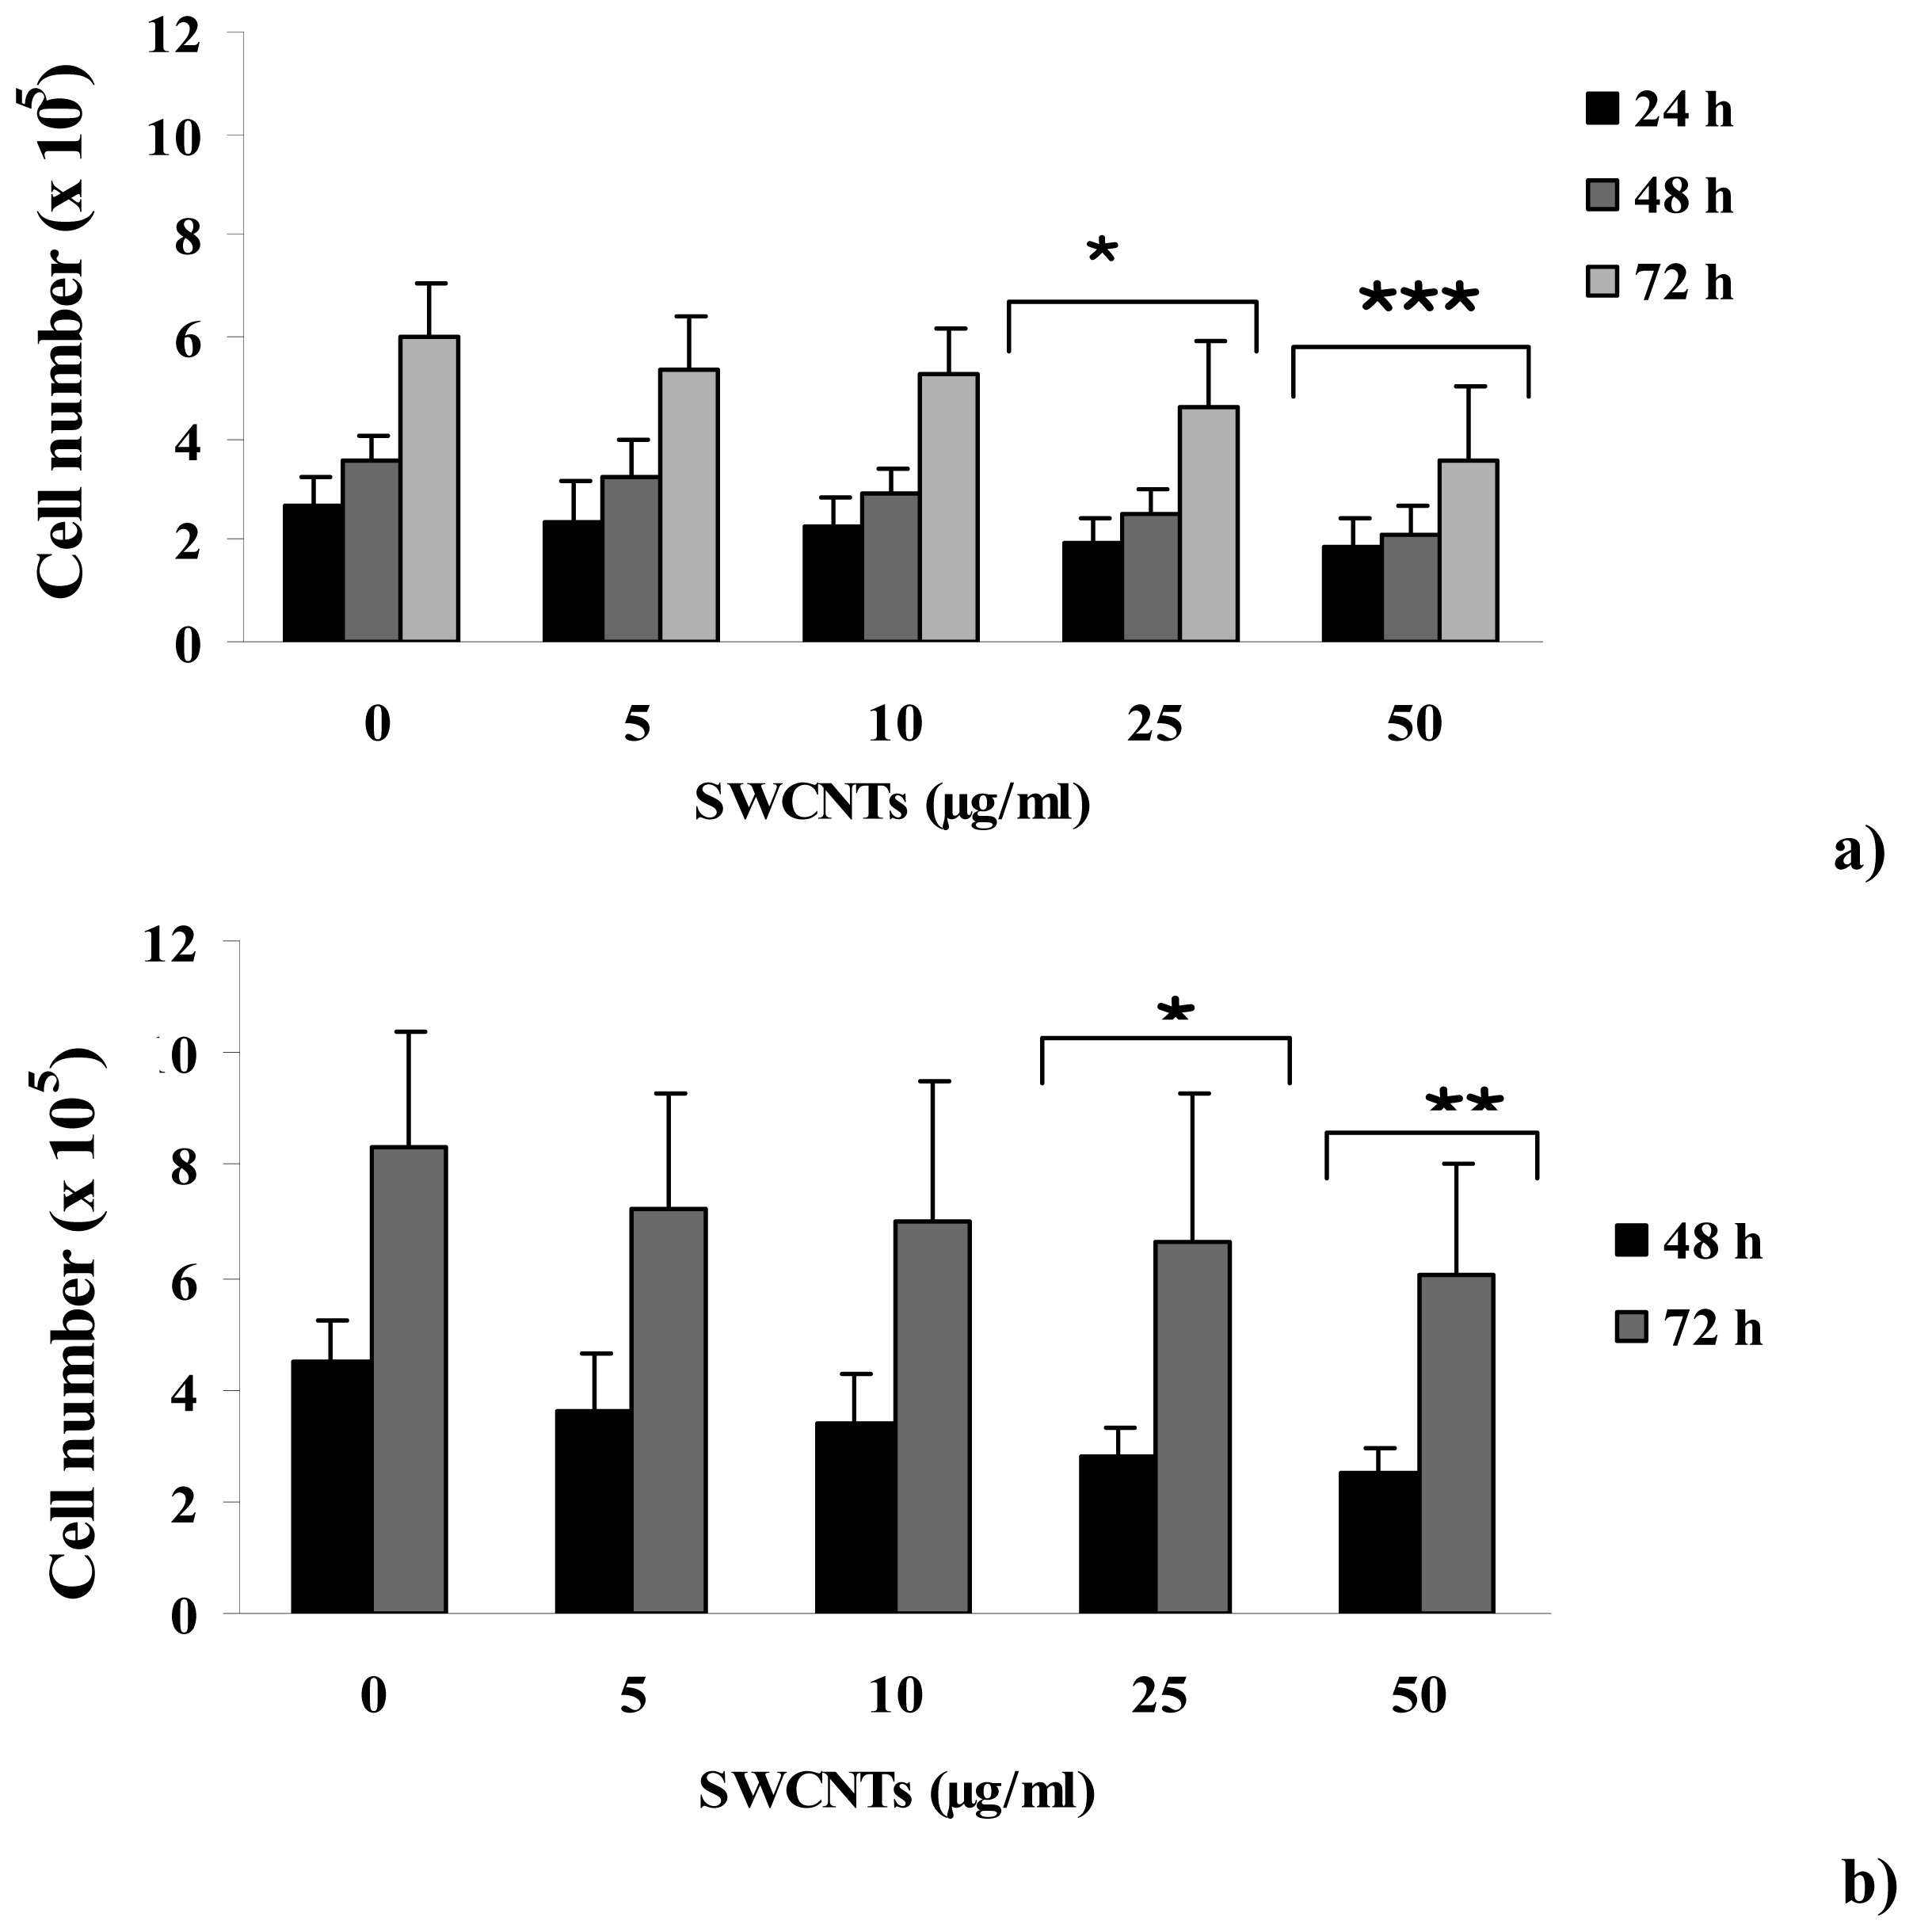
2.4 Trypan-blue exclusion method

For determining the effect of particles on cell viability and cell number the trypan-blue exclusion method was used, in both un-stimulated and PHA stimulated cultures. Cells were seeded at a density of 5x10⁵ cells/ml and treated with CNTs. SWCNTs concentrations of 0, 5, 10, 25 and 50 μg/ml were tested in duplicate by collecting cell aliquots after 24, 48 and 72 h from seeding. Moreover, in proliferating lymphocytes SWCNTs were also added 24 h after PHA stimulation. Cells were counted in a Burker haemocytometer by using a microscope (Leica, Germany). Cell viability was calculated as the ratio of live to dead cells, expressed as percentage.

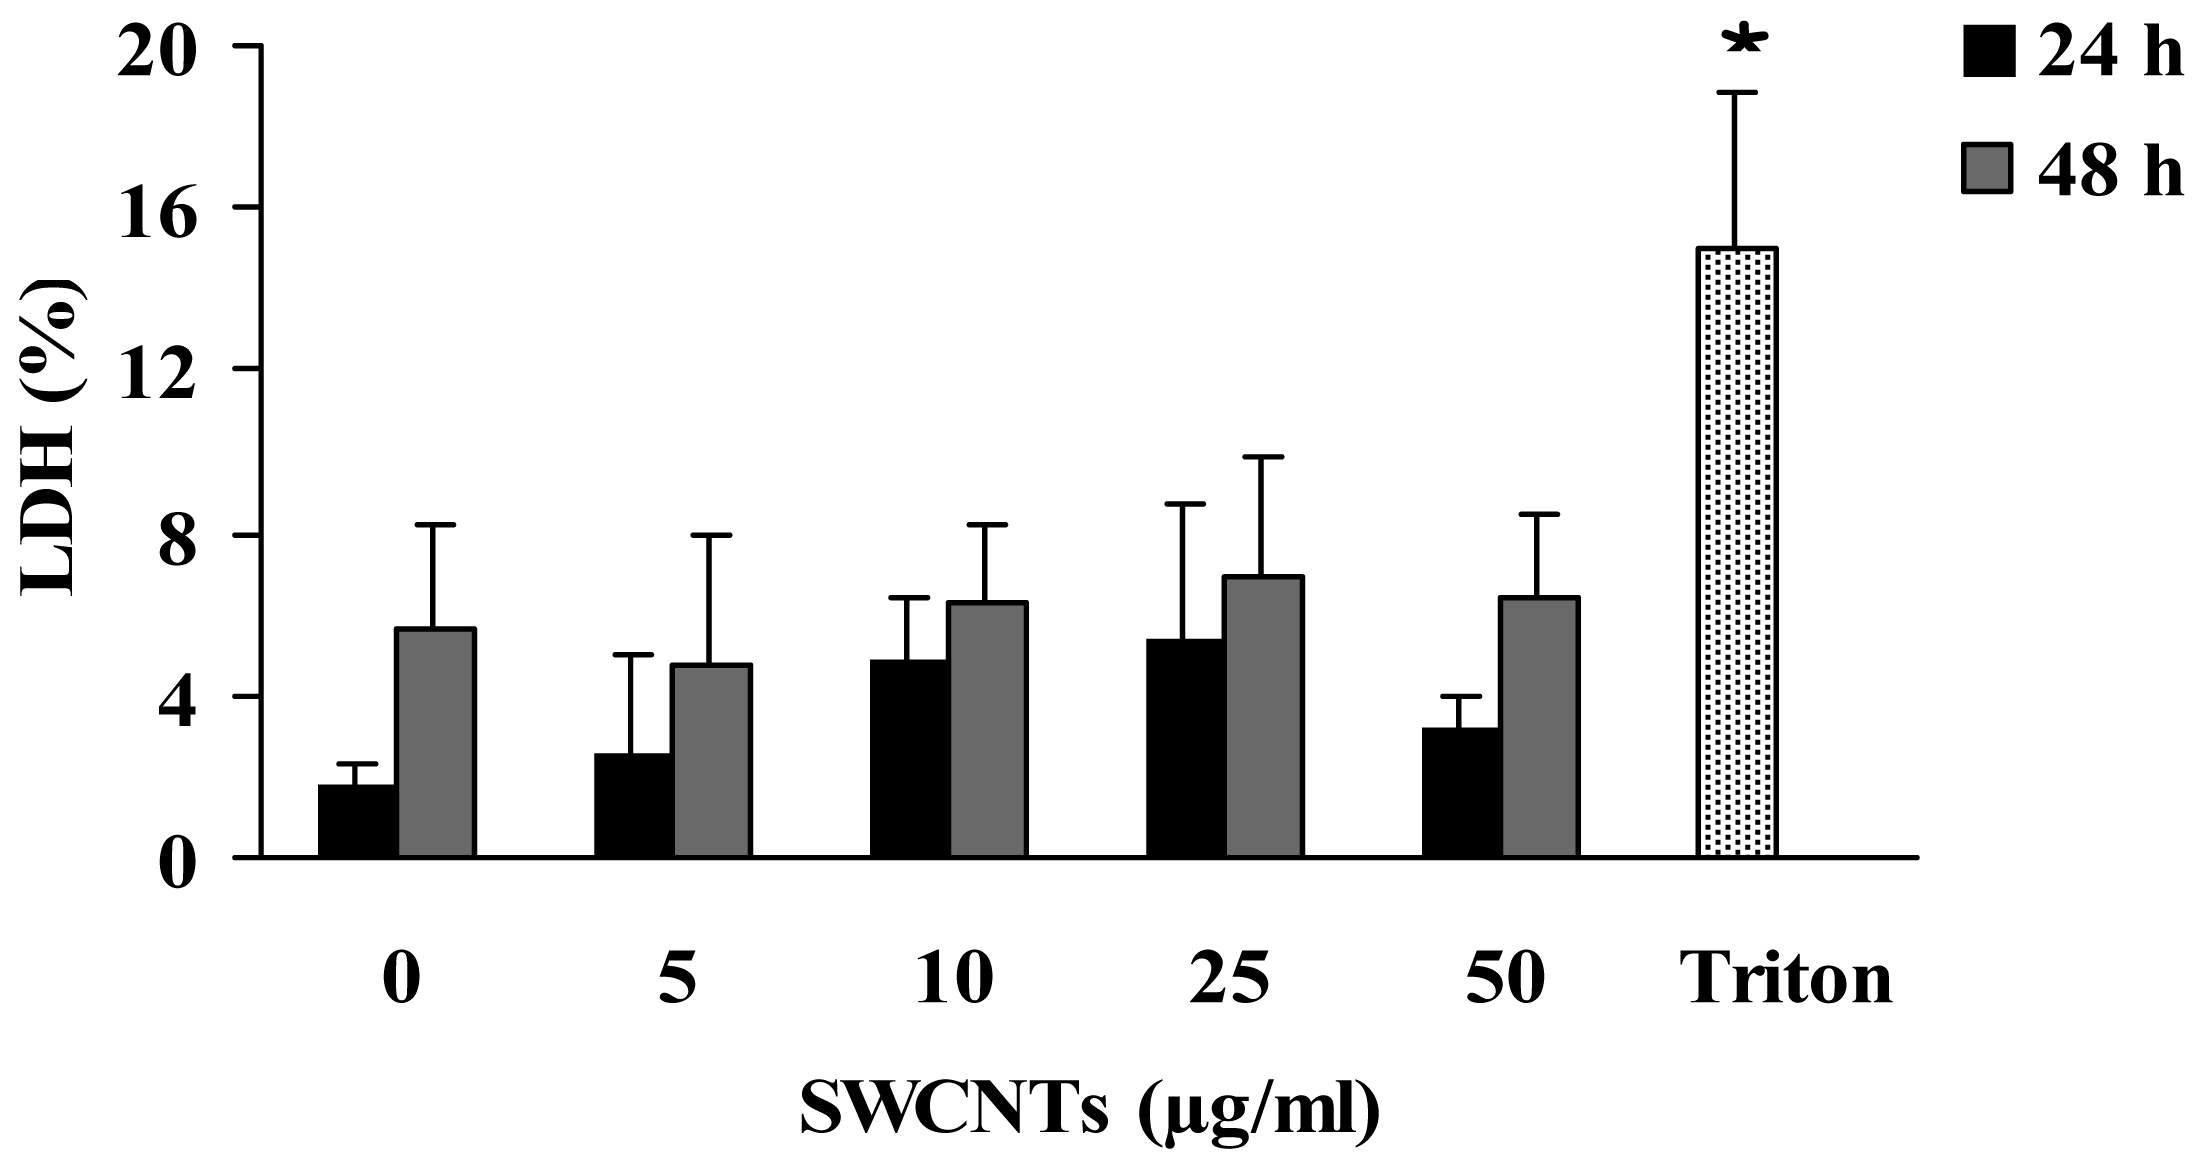
2.5 Lactate dehydrogenase

Lactate dehydrogenase (LDH) release was monitored as a marker for membrane integrity to study cell viability [12]. Cells (1x10⁶/ml) were seeded in complete medium in presence of 1% PHA and treated with SWCNTs concentrations of 0, 5, 10, 25 and 50 μg/ml for 24 and 48 h. Positive control was also included by treating cells with 0.01% triton for 30 min. After treatment the cell suspensions were centrifuged (3000 g, 5 min., 4°C) and supernatants were recovered, whereas the cell pellets were lysed in 0.2 M Tris/HCl pH 8.0, 1% Triton X 100. Lysates and supernatant aliquots were then incubated with reaction buffer (0.7 mM p-iodonitrotetrazolium violet, 50 mM L-lactic acid, 0.3 mM phenazine methosulphate, 0.4 mM NAD, 0.2 M Tris/HCl pH 8.0) for 30 min at 37°C. Changes in absorbance at 490 nm were evaluated by means of a plate reader (Biorad Model 680). The percent of LDH released was calculated as absorbance in the medium of treated cells divided by absorbance in the medium of treated cells plus absorbance in the total pellet of treated cells.

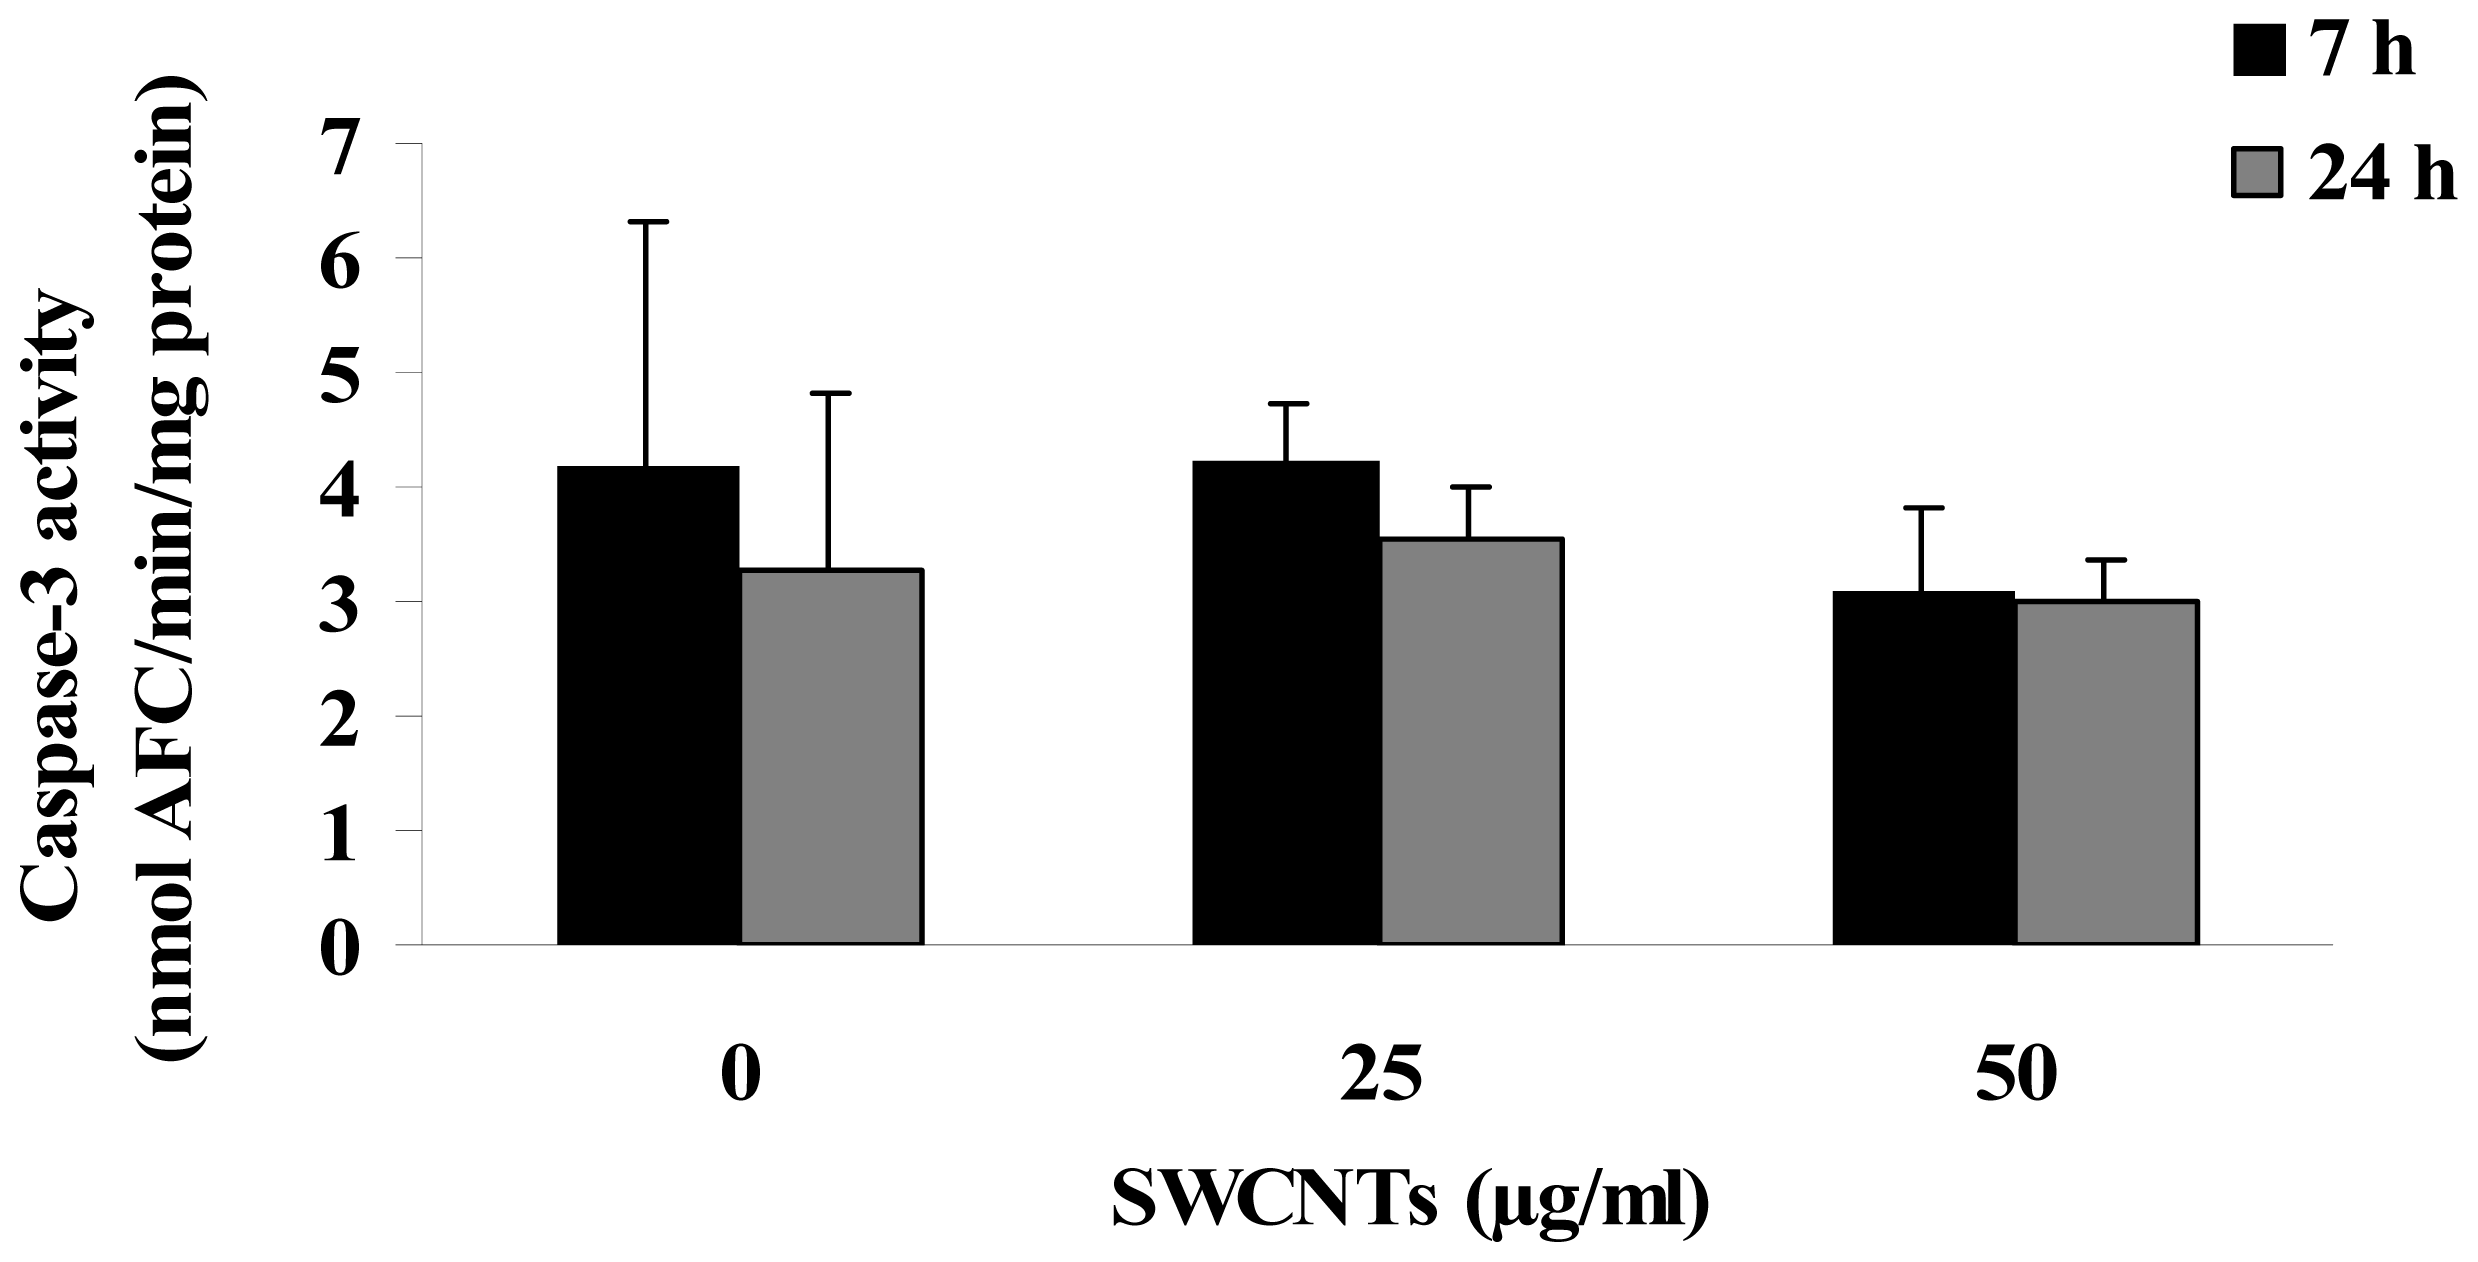
2.6 Caspase-3 activity assay
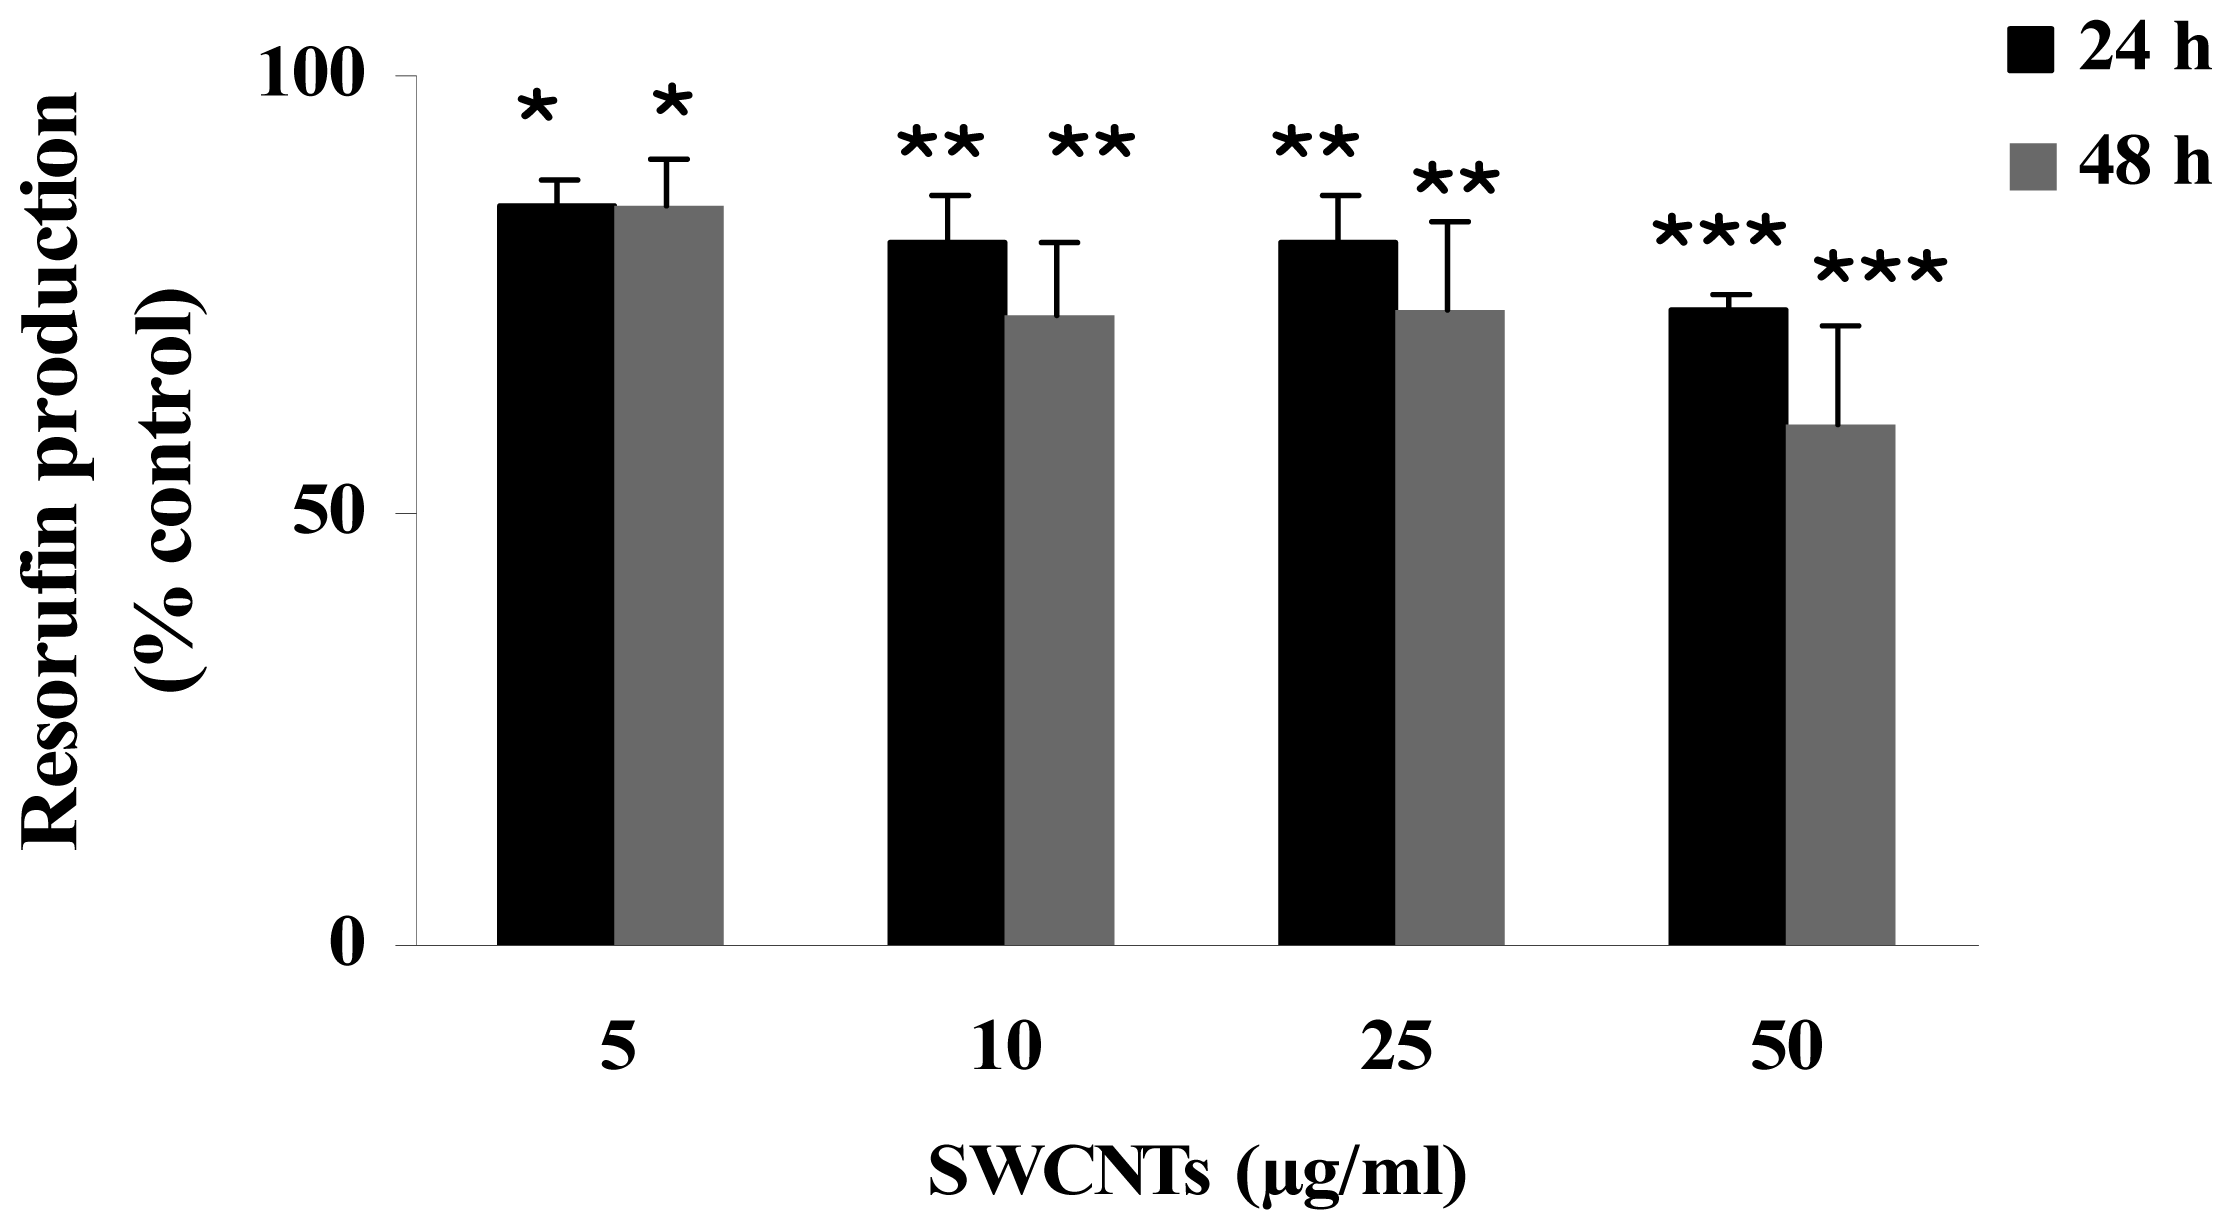
The evaluation of caspase 3 activity was used as a marker of apoptosis. Cells were seeded at a density of 1x10⁶ cells/ml and, after 48 h PHA stimulation, they were treated in duplicate with SWCNTs at final concentrations of 0, 25 and 50 μg/ml. After 7 and 24 h treatments, cells were washed in PBS, and caspase-3 activity was evaluated according to the method reported in [13]. Briefly, cells were resuspended in lysis buffer (10 mM HEPES, pH 7.4, 2 mM EDTA, 0.1% CHAPS, 5 mM dithiotreitol) and, following measurement of protein concentration, cell extracts were added with reaction buffer and conjugated AFC substrate Ac-DEVD-AFC before incubation at 37°C for 30 min. Upon proteolytic cleavage of the substrate by caspase-3, the free fluorochrome AFC was detected by a fluorometer (Perkin-Elmer, LS50B; Perkin-Elmer Instruments, Norwalk, USA ) with excitation and emission setting of 395 and 530 nm, respectively. To quantify enzymatic activities, an AFC standard curve was determined. Caspase-3 specific activity was calculated as nanomoles of AFC produced/min/mg proteins at 37°C at saturating substrate concentrations (50 μM).

2.7 Resazurin assay

The resazurin system measures the metabolic activity of living cells [14]. Resazurin (non fluorescent) is reduced to resorufin (highly fluorescent) in the medium by cell activity, and a direct correlation exists between the reduction of resazurin in the growth medium and the metabolic activity of living cells. Cells were seeded in 3 ml culture medium at a density of 1x10⁶ cells/ml in presence of 1% PHA and treated with SWCNTs concentrations of 0 (control), 5, 10, 25 and 50 μg/ml. Following 24 and 48 h, 1.5x10⁶ cells were collected and tested with resazurin 10 μg/ml. The production of resorufin was analysed with a fluorometer at an excitation wavelength of 530 nm and an emission wavelength of 590 nm. To quantify resorufin production, a standard curve of fluorescent product was assessed. The results were expressed as μg of resorufin produced/ml/min.

2.8 Alkaline comet assay

For the evaluation of primary DNA damage, the alkaline comet assay was applied. Un-stimulated leukocytes were seeded at a density of 5x10⁵ cells/ml, and treated for 6 h with SWCNTs at final concentrations of 0 (control), 1, 5 and 10 μg/ml. Positive controls were also included by treating cells with MMS for 2 h at final concentration of 150 μM. For each donor/treatment, cultures were set up in duplicate. The alkaline Comet assay was performed according to the method developed by Singh and co-workers [15] with minor modifications, and for each sample two replicate slides were set up. The method has been described in details in a previous paper [16]. Briefly, cells were resuspended in low melting point agarose (LMA; 0.7% w/v; 37°C) and sandwiched between a lower layer of 1% normal melting agarose (NMA; 1% w/v) and an upper layer of LMA (0.7% w/v) on microscope slides. Following an overnight immersion in cold lysing solution (2.5 M NaCl, 100 mM Na2EDTA, 10 mM Tris, pH 10) with 1% Triton X-100 and 10% DMSO, DNA was unwound for 25 min at 4°C in alkaline electrophoresis buffer (300 mM NaOH, 1 mM Na2EDTA, pH >13) and electroforesed at 4°C for 25 min at 30 V and 300 mA. Then slides were rinsed with sodium acetate (300 mM)-ethanol absolute solution for 30 min, dehydrated (absolute ethanol for 2 h) and re-hydrated (70% ethanol for 5 min), and were stained, just before analysis, with ethidium bromide (12 μg/ml). Images of 300 randomly selected cells (150 from each of two replicate slides) were analysed by a computerized Image Analysis System (Delta Sistemi, Rome, Italy) fitted with a Leica DM BL fluorescence microscope at 250 X magnification. DNA damage was evaluated by calculating the tail length (in μm from the estimated leading edge of the head region to leading edge of the tail), the percentage of migrated DNA (calculated as the integrated intensity of DNA in the tail divided by the integrated intensity of DNA for the total image and multiplied by 100) and the tail moment (the fraction of DNA in the tail multiplied by tail length).

2.9 Data analysis

Cell growth data were analyzed by applying the two-way ANOVA for repeated measures followed by a post hoc Tukey test to consider the interaction of treatment and time. Data concerning LDH release, caspases-3 activity, resorufin production and primary DNA damage were analyzed with one-way ANOVA for repeated measures followed by a post hoc Tukey test. Two tailed paired Student's t test was applied to compare negative and positive controls, when present. In all cases, P values lower than 0.05 were considered as statistically significant. The statistical tests were performed by MATLAB software.

3. Results and Discussion

Growth of human peripheral blood lymphocytes was evaluated by counting cells at 24, 48 and 72 h after PHA stimulation and a decrease in cell number in all the SWCNTs treated groups with respect to control group was detected, as assessed with the Trypan Blue exclusion method. The decrease detected in cell number resulted dose-dependent and became statistically significant when treatments of 25 (P<0.05) and 50 (P<0.001) μg/ml were considered, as reported in Figure 1a. In particular, a decrease of 29, 31 and 23 % was detected at 25 μg/ml and of 32, 42 and 43 % at 50 μg/ml, at 24, 48 and 72 h after PHA stimulation. This behavior was also detected when SWCNTs treatments were performed after 24 h from PHA stimulation (Figure 1b), with a decrease of 38 and 22 % at 25 μg/ml and of 45 and 28 % at 50 μg/ml, at 48 and 72 h after PHA stimulation. The latter result excludes that the observed effect could derive from an interference of CNTs with PHA stimulation.
These findings were not associated to a cytotoxic event, as assessed by trypan-blue exclusion and LDH release, two methods assessing the permeability of cell membrane. In fact, cell viability never decreased below 90% at any SWCNTs dose tested, in both unstimulated and PHA-stimulated lymphocytes (data not shown). In addition, LDH release also resulted unaffected in PHA-stimulated cells following 24 and 48 h treatments for all the concentrations tested (P>0.05), even if at 24 h treatment a slight increase respect to controls was recorded (figure 2).
The observed reduction in cell number can not be ascribed to an apoptotic event, as assessed by measuring caspase-3 activity, a biochemical hallmark of apoptosis that mediates the cleavage of cellular death substrates [17]. As reported in figure 3, treatments of 7 and 24 h with SWCNTs at concentrations of 25 and 50 μg/ml did not increase enzyme activity in proliferating lymphocytes.
Interestingly, when metabolic activity was investigated, 24 and 48 h treatments resulted in a decrease of resorufin production for all the concentrations tested. In particular, the average decreases ranged from 15 to 27% and from 15 to 40% for 24 and 48 h treatments respectively, resulting statistically significant in all cases. Data are presented in figure 4, where the amount of resorufin produced is reported as control percentage. The method employed is based on the reduction of resazurin (or alamar blue) to resorufin by oxidoreductases in mitochondria. Thus, measurement of resorufin fluorescence is an indicator of mitochondrial function [18].
This assay has been reported to be very sensitive and reproducible and is currently applied to evaluate cell viability in a fixed volume of cell culture following several treatments, including CNTs [19], while in this study the resazurin assay was applied to evaluate metabolic activity on a fixed number of viable cells. Since in the literature interferences and disturbances of the nanomaterials with viability assays have been described [20-22], preliminary experiments were carried out in our laboratory to avoid this inconvenience.
No differences were detected when fluorometric measurements of the spontaneous production of resorufin were carried out in absence and in presence of the maximum concentration of CNTs, suggesting that interferences can be reasonably excluded (data not shown).
Absence of cytotoxicity was also confirmed when primary DNA damage was evaluated on the entire population of human leukocytes by means of the alkaline comet assay. It is well known that increased DNA migration, as a function of DNA fragmentation, can origin by dead/dying cells or by single and double-stranded breaks, incomplete repair sites and alkali labile sites that are potentially able to induce chromosomal damage [23]. No increase in DNA migration, evaluated in terms of migrated DNA percentage, tail length and tail moment, was found in human leukocytes following 6 h treatment with SWCNT concentrations of 0.5, 1, 5 and 10 μg/ml. On the contrary, a statistically significant increase in all the parameters investigated was found when MMS treated samples were compared to control ones (P<0.0001). Moreover, for all the comet parameters investigated, an inter-individual variability was observed which is largely documented and can be ascribed to donor's age, physical activity, and to the heterogeneous mixture of examined cells [24-25]. The results are presented in Table 1 as mean ±SD of 1200 nuclei examined (300 nuclei for each of the four donors investigated).
Several authors investigated the effect of CNTs treatments on cell proliferation by testing concentrations similar to those employed in this study on different cell types. Most of them found a decrease associated with cell death [26-27], apoptosis [28] or reactive oxygen species generation [6]. On this respect our findings are not in agreement with the majority of the published results. This discrepancy could be ascribed to the different cell type investigated and to the different nanotubes tested; in addition, it should be stressed that methods employed to disperse nanotubes can contribute as well [3].
Nevertheless, our findings are consistent with other published results. Absence of acute toxicity was detected in different cell types after SWCNTs treatments at concentrations comparable to those adopted in the present study, by applying multiple viability assays [19, 20, 29, 30]. Only higher concentrations of both SWCNTs and MWCNTs (from 200 to 800 μg/ml) have been reported to affect cell viability [19, 10], but the authors suggest that the strong tendency of CNTs to aggregate can be responsible for the observed effects.

4. Conclusions

Our experiments demonstrate that SWCNTs lead to growth inhibition in PHA stimulated human lymphocytes from healthy donors, in absence of cytotoxicity. It is well known that metal residues derived from the production of nanomaterial vary in terms of amount, form and encapsulation state [2], and have been demonstrated to be responsible for the biological effect observed [29]. Thus, an accurate characterization of the commercial SWCNTs employed in this study could be helpful in the interpretation of the observed effect.

Acknowledgments

The authors wish to thank the Transfusion Unit of “San Paolo” Hospital (ASL NA-1, Naples, Italy) for providing buffy coats from healthy donors. We are grateful to Dr. MC Rasulo for her assistance in editing the manuscript. This work was supported by CNR, ICT Department.

References and Notes

  1. Lin, Y.; Taylor, S.; Li, H.; Fernando, S.K.A.; Qu, L.; Wang, W.; Gu, L.; Zhou, B.; Sun, YP. Advances towards bioapplications of carbon nanotubes. J. Mater. Chem. 2004, 14, 527–541. [Google Scholar]
  2. Hurt, R.H.; Monthioux, M.; Kane, A. Toxicology of carbon nanomaterials: status, trends, and perspectives on the special issue. Carbon 2006, 44, 1028–1033. [Google Scholar]
  3. Smart, S.K.; Cassady, A.I.; Lu, G.Q.; Martin, D.J. The biocompatibility of carbon nanotubes. Carbon 2006, 44, 1034–1047. [Google Scholar]
  4. Shvedova, A.; Castranova, V.; Kisin, E.; Schwegler-Berry, D.; Murray, A.; Gandelsman, V.; Maynard, A.; Baron, P. Exposure to nanotube material: assessment of nanotube cytotoxicity using human keratinocyte cells. J. Toxicol. Environ. Health. 2003, 66, 1901–1918. [Google Scholar]
  5. Monteiro-Riviere, N.A.; Nemanich, R.J.; Inman, A.O.; Wang, Y.Y.; Riviere, J.E. Multi-walled carbon nanotube interactions with human epidermal keratinocytes. Toxicol. Lett. 2005, 155, 377–384. [Google Scholar]
  6. Manna, S.K.; Sarkar, S.; Barr, J.; Wisw, K.; Barrera, E.V.; Jejelowo, O.; Rice-Ficht, A.C.; Ramesh, J.T. Single-walled carbon nanotubes induces oxidative stress and activates nuclear transcription factor-kB in human keratinocytes. Nano Lett. 2005, 5, 1676–1684. [Google Scholar]
  7. Jia, G.; Wang, H.; Yan, L.; Wang, X.; Pei, R.; Yan, T.; Zhao, Y.; Guo, X. Cytotoxicity of carbon nanomaterials: single-wall nanotubes, multiwall nanotube, and fullerene. Environ. Sci. Technol. 2005, 39, 1378–1383. [Google Scholar]
  8. Ding, L.; Stilwell, J.; Zhang, T.; Elboudwarej, O.; Jang, H.; Selegue, J.P.; Cooke, P.A.; Gray, J.W.; Chen, F.F. Molecular characterization of the cytotoxic mechanism of multiwall carbon nanotubes and nano-onions on human skin fibroblast. Nano Lett. 2005, 5, 2448–2464. [Google Scholar]
  9. Muller, J.; Huaux, F.; Moreau, N.; Misson, P.; Heilier, J.F.; Delos, M.; Arras, M.; Fonseca, A.; Nagy, J.B.; Lison, D. Respiratory toxicity of multi-wall carbon nanotubes. Toxicol. Appl. Pharmacol. 2005, 207, 221–231. [Google Scholar]
  10. Bottini, M.; Bruckner, S.; Nika, K.; Bottini, N.; Bellocci, S.; Magrini, A.; Bergamaschi, A.; Mustelin, T. Multi-walled carbon nanotubes induce T lymphocyte apoptosis. Toxicol. Lett. 2006, 160, 121–126. [Google Scholar]
  11. Boyum, A. Isolation of leukocytes from human blood. Further observations. Methylcellulose, dextran and ficoll as erythrocyte aggregation agents. Scand. J. Clin. Lab. Invest. 1968, 97, 31–50. [Google Scholar]
  12. Decker, T.; Lohmann-Matthes, M.L. A quick and simple method for the quantitation of lactate dehydrogenase release in measurements of cellular cytotoxicity and tumour necrosis factor (TNF) activity. J. Immunol. Methods 1988, 115, 61–69. [Google Scholar]
  13. Russo, M.; Palumbo, R.; Mupo, A.; Tosto, M.; Iacomino, G.; Scognamiglio, A.; Tedesco, I.; Galano, G.; Russo, G.L. Flavonoid quercetin sensitizes a CD95 resistant cell line to apoptosis by activating protein kinase Cα. Oncogene 2003, 22, 3330–3342. [Google Scholar]
  14. O'Brien, J.; Wilson, I.; Orton, T.; Pognan, F. Investigation of the Alamar blue (resazurin) fluorescent dye for the assessment of mammalian cell cytotoxicity. Eur. J. Biochem. 2000, 267, 5421–5426. [Google Scholar]
  15. Singh, N.P.; McCoy, M.T.; Tice, R.; Schneider, E.L. A simple technique for quantitation of low level of DNA damage in individual cells. Exp. Cell. Res. 1988, 175, 184–187. [Google Scholar]
  16. Zeni, O.; Gallerano, G.P.; Perrotta, A.; Romanò, M.; Sannino, A.; Sarti, M.; D'Arienzo, M.; Doria, A.; Giovenale, E.; Lai, A.; Messina, G.; Scarfì, M.R. Cytogenetic observations in human peripheral blood leukocytes following in vitro exposure to THz radiation: a pilot study. Health Phys. 2007, 92, 349–357. [Google Scholar]
  17. Riedl, S.J; Shi, Y. Molecular mechanisms of caspase regulation during apoptosis. Nat. Rev. Mol. Cell Biol. 2004, 5, 897–907. [Google Scholar]
  18. Zhang, H.X.; Du, G.H.; Zhang, J.T. Assay of mitochondrial functions by resazurin in vitro. Acta Pharmacol. Sin. 2004, 25, 385–389. [Google Scholar]
  19. Davoren, M.; Herzog, E.; Casey, A.; Cottineau, B.; Chambers, G.; Byrne, H.J.; Lyng, F.M. In vitro toxicity evaluation of single walled carbon nanotubes on human A549 lung cells. Toxicol In Vitro 2007, 21, 438–448. [Google Scholar]
  20. Worle-Knirsch, J.M.; Pulskamp, K.; Krug, H.F. Oops they did it again! Carbon nanotubes hoax scientists in viability assays. Nano Lett. 2006, 6, 1261–1268. [Google Scholar]
  21. Monteiro-Riviere, N.A.; Inman, A.O. Challenger for assessing carbon nanomaterial toxicity to the skin. Carbon 2006, 44, 1070–1078. [Google Scholar]
  22. Casey, A.; Herzog, E.; Davoren, M.; Lyng, F.M.; Byrne, H.J.; Chambers, G. Spectroscopic analysis confirms the interactions between single walled carbon nanotubes and various dye commonly used to assess cytotoxicity. Carbon 2007, 45, 1425–1432. [Google Scholar]
  23. Burlinson, B.; Tice, R.R.; Speit, G.; Agurell, E.; Brendler, S.Y.; Collins, A.R.; Escobar, P.; Honma, M.; Kumaravel, T.S.; Nakajima, M.; Sasaki, Y.F.; Thybaud, V.; Uno, Y.; Vasquez, M.; Hartmann, A. Fourth international workgroup on genotoxicity testing: results of the in vivo comet assay workshop. Mutat. Res. 2007, 627, 31–35. [Google Scholar]
  24. Fairbairn, D.W.; Olive, P.L.; O'Neill, K.L. The comet assay: a comprehensive review. Mutat. Res. 1995, 339, 37–59. [Google Scholar]
  25. Rojas, E.; Lopez, M.C.; Malverde, M. Single cell gel electrophoresis assay: methodology and applications. J. Chromatogr. 1999, 722, 225–254. [Google Scholar]
  26. Wick, P.; Manser, P.; Limbach, L.K.; Dettlaff-Weglikowska, U.; Krumeich, F.; Roth, S.; Stark, W.J.; Bruinink, A. The degree and kind of agglomeration affect carbon nanotube cytotoxicity. Toxicol. Lett. 2007, 168, 121–131. [Google Scholar]
  27. Magrez, A.; Kasa, S.; Salicio, V.; Pasquier, N.; Seo, J.W.; Celio, M.; Catsicas, S.; Schwallrer, B.; Forro, L. Cellular toxicity of carbon-based nanomaterilas. Nano Lett. 2006, 6, 1121–1125. [Google Scholar]
  28. Cui, D.; Tian, F.; Ozkan, C.S.; Wang, M.; Gao, H. Effect of single wall carbon nanotubes on human HEK293 cells. Toxicol. Lett. 2005, 155, 73–85. [Google Scholar]
  29. Pulskamp, K.; Diabate, S.; Krug, H.F. Carbon nanotubes show no sign of acute toxicity but induce intracellular reactive oxygen species in dependence on contaminants. Toxico. Lett. 2007, 168, 58–74. [Google Scholar]
  30. Garibaldi, S.; Brunelli, C.; Bavastrello, V.; Ghigliotti, G.; Nicolini, C. Carbon nanotube biocompatibility with cardiac muscle cells. Nanotechnology 2006, 17, 391–397. [Google Scholar]
Figure 1. Cell growth data for PHA stimulated lymphocytes treated with increasing doses of SWCNTs. Panel a) SWCNTs added at the seeding time and cell number recorded after 24, 48 and 72h from PHA stimulation. Panel b) SWCNTs added after 24h from PHA stimulation and cell number recorded after 48 and 72h from PHA stimulation. Data are presented as mean ± SD obtained from 3 healthy donors. Significant difference for treated groups vs control group; *P<0.05; **P<0.01; ***P<0.001; two way ANOVA for repeated measures.
Sensors 08 00488f1
Figure 2. LDH release in PHA stimulated lymphocytes treated with SWCNTs for 24 and 48 h. Treatment with 0.01 % triton for 30 min is included as positive control. Each data point represents the mean ± SD obtained from 3 healthy donors. * Significant (P<0.05) difference from the negative control (0); two tailed paired Student's t test.
Sensors 08 00488f2
Figure 3. Caspase-3 activity in 48 h PHA stimulated lymphocytes treated with SWCNTs for 7 and 24 h. Each data point represents the mean ± SD obtained from 3 healthy donors.
Sensors 08 00488f3
Figure 4. Concentration-response curve for metabolic activity of HPBL measured after 24 and 48 h SWCNTs treatments. Data are presented as control percentage of resorufin production. Each data point represents the mean ± SD obtained from 3 healthy donors. * P<0.05; ** P<0.01; *** P<0.001; one way ANOVA for repeated measures.
Sensors 08 00488f4
Table 1. Migrated DNA, tail length and tail moment in human leukocytes treated for 6 h with SWCNTs. Data related to positive control (MMS, 150 μM for 2 h) are also reported. Each data point represents the mean ± SD of 1200 nuclei scored (300 from each of the 4 donors tested).
TreatmentMigrated DNA
(%)
Tail length
(microns)
Tail moment
(arbitrary units)
Control1.62±0.763.49±1.720.45±0.30
CNTs- 1 μg/ml1.52±1.203.20±1.600.46±0.44
CNTs- 5 μg/ml1.94±1.073.69±1.630.67±0.41
CNTs - 10 μg/ml1.60±0.683.34±1.140.45±0.23
MMS - 150 μM14.92±1.16*19.28±1.61*5.44±0.61*
*significant (P<0.0001) difference from the control: two tailed paired Student's t test.

