Article

Changes in Spectral Properties, Chlorophyll Content and Internal Mesophyll Structure of Senescing Populus balsamifera and Populus tremuloides Leaves

by
Karen L. Castro
and
G. Arturo Sanchez-Azofeifa
*
Center for Earth Observation Sciences (CEOS) & Department of Earth and Atmospheric Sciences, University of Alberta, Edmonton, Alberta, Canada
*
Author to whom correspondence should be addressed.
Sensors 2008, 8(1), 51-69; https://doi.org/10.3390/s8010051
Submission received: 19 November 2007 / Accepted: 19 December 2007 / Published: 9 January 2008
(This article belongs to the Special Issue Remote Sensing of Natural Resources and the Environment)

Abstract

:
In this paper we compare leaf traits and spectral reflectance for sunlit and shafded leaves of Populus tremuloides and Populus balsamifera during autumn senescence using information derived from an Analytical Spectral Devise (ASD) Full Range spectrometer. The modified simple ratio (mSR705) and modified normalized difference index (mND705) were effective in describing changes in chlorophyll content over this period. Highly significant (P<0.01) correlation coefficients were found between the chlorophyll indices (mSR705, mND705)) and chlorophyll a, b, total chlorophyll and chlorophyll a/b. Changes in mesophyll structure were better described by the plant senescence reflectance index (PSRI) than by near-infrared wavebands. Overall, P. balsamifera exhibited lower total chlorophyll and earlier senescence than P. tremuloides. Leaves of P. balsamifera were also thicker, had a higher proportion of intercellular space in the spongy mesophyll, and higher reflectance at 800 nm. Further research, using larger sample sizes over a broader range of sites will extend our understanding of the spectral and temporal dynamics of senescence in P. tremuloides and P. balsamifera and will be particularly useful if species differences are detectable at the crown level using remotely sensed imagery.

1. Introduction

Autumn foliar senescence in deciduous temperate tree species is typically induced by shortening of the photoperiod [1]. Within a leaf, a sequence of programmed changes take place during senescence, among them chlorophyll loss [2-5], decreased chlorophyll a/b ratio [6-8], declining photosynthetic ability [9-11], transition from nutrient assimilation to nutrient remobilization [11,12], collapse of cell walls [13] and changes on plant hormone balance (polyamines and ethylene) [45]. Some of these changes may be tracked with concomitant alterations in leaf optical properties. In general, visible reflectance (400-700 nm) increases in response to chlorophyll degradation [14,15]. Near-infrared reflectance (700-1300 nm) initially rises as the number of scattering interfaces increases as cells split and cell contents shrink away from cell walls, and eventually decreases in accordance with further mesophyll breakdown [16]. More specifically, wavelengths near 550 nm and 700 nm have been shown to be particularly sensitive to changes in chlorophyll content during leaf senescence [17], while correlations of specific wavebands with the demise of mesophyll structure during senescence have not been explored. The plant senescing reflectance index (PSRI=(R678-R500)/R750)) was developed by [18] for the sole purpose of describing the dynamics of senescence processes in leaves and fruits, and is sensitive to the carotenoid/chlorophyll ratio.
While the series of physiological and, to a lesser extent, anatomical events leading to leaf death have been described for numerous plant species, it remains unknown if they are equivalent for both sun and shade-acclimated leaves of the same plant. Sun-exposed and shaded leaves have been shown to exhibit considerable physiological and morphological differences. Although the degree of within-tree plasticity of leaf morphology and physiology varies among species, related to light tolerance and successional status [19-21], it is apparent that some species are capable of acclimating their foliage to the light environment [19-and 22]. Within a single crown, changes in leaf anatomy tend to reflect changes in light availability during development [23]. In comparison with shade-acclimated leaves, sun-acclimated leaves may exhibit some or all of the following features: smaller leaf surface area [24,22], greater leaf width [24,25,22], lower chlorophyll concentration (on a per mass basis) [25], higher amounts of the photoprotective xanthophyll pigment [26], thicker and/or multi-layered palisade mesophyll [24,22], denser mesophyll structure [26], and higher light-saturated photosynethic rates (Gamage et al. 2003). Chlorophyll a/b ratio, besides decreasing during senescence, also tends to decrease with decreasing light availability [27-29]. The influence of these differences (due to light acclimation) on leaf optical properties is not well defined to date. Among species of sun and shade-adapted rainforest plants, similar optical properties were found in the visible region (400-700 nm) despite differing anatomical features and photosynthetic efficiencies [30]. The same conclusion was drawn for 26 temperate species from understory, intermediate, and open light environments [31].
Within a single species, however, [25] observed greater reflectance of orange (Citrus sinensis (L.) Osbeck) sun leaves than shade leaves in the visible region of the electromagnetic spectrum, which was consistent with a lower chlorophyll concentration (on a per mass basis). [32] confirmed this for the case of three tree species (oak (Quercus spp.), beech (Fagus sylvatica L.), hornbeam (Carpinus betulus L.)), although his results were not significant. However, both visible and near-infrared transmittance of sun leaves were significantly less (p=0.05) than that of shade leaves. In the NIR (700-1300 nm), lower transmittance of sun leaves was attributed to their high quantity of intercepting leaf tissues, including cellular constituents and intercellular spaces. Similarly, increased NIR reflectance and decreased transmittance correlate with increases in leaf thickness [31], a trend that should hold for sun versus shade leaves since sun leaves are the thicker of the two.
In the present study, the two species of interest are common to our location in central Alberta, Canada. Aspen (Populus tremuloides Michx.), first of all, is considered the most widely distributed tree species in North America [33,34], while balsam poplar (Populus balsamifera L.), secondly, prefers riparian sites [35,36]. The congeneric species are shade-intolerant pioneers, often among the first recolonizers of open areas following disturbance [35]. Both have the capacity to reproduce vegetatively. Aspens may become extensively clonal [37] and balsam poplars sprout from roots and stumps [35]. The clones may differ in morphological characteristics as well as in timing of leaf flush, flowering and leaf fall, which can lead to differences in autumn leaf colours in adjacent clones [38]. While a few studies have focused on autumn foliar senescence of trembling aspen (Dean et al. 1993, [4] (also note that [8] addressed senescence of P. sargentii, and [38.1] did the same for European aspen, P. tremula L.), equivalent studies on balsam poplar are nonexistent. [7] and [33] noted contrasting trends in chlorophyll a/b ratio during senescence of aspen leaves. Whereas [7] observed fairly uniform chlorophyll a/b during the summer, and a drop during senescence, [33] observed striking increases in chlorophyll a/b for five progressive stages of senescence of aspen leaves, a phenomenon not previously recorded among deciduous tree species, and possibly linked to earlier structural loss of grana lamellae compared to stroma lamellae. The reasons behind the incongruent results remain without clarification to date.
Our research aims to expand current knowledge of the dynamics of fall senescence of P. tremuloides and P. balsamifera in our region as well as potential differences in these dynamics for sun and shade leaves of each species. We do this by exploring what we term the ‘spectro-temporal’ changes (changes in spectral characteristics over time) in leaf optical properties, chlorophyll content (total chlorophyll, chlorophyll a and b) and internal anatomical features (palisade and spongy mesophyll thickness, total leaf thickness, percentage intercellular space within the spongy mesophyll). The specific objectives are three-fold: 1) To compare the two species, both which play important ecological roles in the boreal forest of Canada, 2) To compare sun and shade leaves, since light acclimation can lead to important differences in the morphology and physiology of leaves, and 3) To explore differences in mature and senescing leaves with respect to chlorophyll content and internal anatomy. We also consider our results in light of future remote sensing applications.

2. Methods

2.1 Leaf spectral reflectance and chlorophyll content

Leaf samples of P. tremuloides (aspen) and P. balsamifera (balsam poplar) were collected over 16 sampling dates (every week) during August to October 2002, the period of autumn senescence. Leaf spectral measurements and chlorophyll analysis were performed on the 2002 samples. In 2003, additional samples were collected over seven dates during the same time period. The primary purpose of the 2003 samples was leaf thin section analysis in support of the 2002 data. Leaf spectral reflectance and SPAD readings (chlorophyll content) also accompany the 2003 samples. The trees were situated near the top of a ravine bordering the North Saskatchewan River in south central Edmonton, Alberta, Canada. At each collection, three leaves each were harvested from the sunlit and shaded portions of the trees. Hereafter, the following acronyms will be used to refer to leaf samples: aspen sun (ASU), aspen shade (ASH), poplar sun (PSU) and poplar shade (PSH). After labelling, the petioles of the leaves were wrapped in a moist paper towel. Leaves were then packed into a black plastic bag inside a cooler containing ice and taken for analysis.

2.2 Instruments used in this study

Two spectrometers were used over the course of the study for spectral reflectance measurements. The FieldSpec Pro FR spectroradiometer (Analytical Spectral Devices, Boulder, CO, USA) (model FSP350-2500P), first of all, has three photodiode arrays and measures a spectrum from 350-2500 nm. The spectral resolution is 3 nm wide in the VNIR and 10 nm in the SWIR. The sampling interval of 1.4 nm in the visible and near-infrared (VNIR) and 2 nm in the short wave infrared (SWIR) is interpolated to a finer sampling interval of 1 nm for a total of 2151 contiguous channels. The bare fibre-optic has a FOV of 25 degrees. The FiedSpec Pro FR was used for all samples collected in 2002.
The UniSpec Spectral Analysis System VIS/NIR (PP Systems, Amesbury, MA, USA), secondly, has a 256-element photodiode array and a spectral range of 350-1100 nm. Spectral resolution is <10 nm and sampling interval is 3.3 nm. The UniSpec has a bifurcated fibre-optic: one branch delivers light from an internal 7.0 W halogen lamp while the other returns the reflected light to the detector. For measurements, a leaf clip was attached to the fore-optic, which limits the FOV to a constant 2.3 mm and prevents ambient light entry. The UniSpec was used only for samples obtained in 2003 for leaf thin section analysis (section 2.2).
Lastly, the SPAD 502 (Minolta Camera Co., Osaka, Japan) is a hand-held chlorophyll absorbance meter. When the meter is clamped over leafy tissue, an indexed chlorophyll content (0-99.9) reading is given, based on absorbance at 650 and 940 nm.

2.3 SPAD measurements and chlorophyll content analysis (samples collected during 2002)

Six SPAD measurements were recorded per leaf, three per each side of the leaf blade, avoiding the main vein. A 16 mm-diameter sample was cored from each leaf, from which an additional SPAD measurement was taken. The cored samples were placed in small plastic vials, wrapped in tinfoil and frozen.
Of the over 250 leaf cores accumulated over the 16 sampling dates, 100 were selected for chlorophyll analysis. The chosen samples provided adequate representation of the four leaf types (sun and shade leaves of the two species) over a wide range of SPAD values. Total chlorophyll, chlorophyll a, and chlorophyll b content were determined using the dimethyl sulphoxide (DMSO) extraction method described by [44]. For each species and illumination category (sun or shade), second-degree polynomial SPAD calibration curves were developed for the estimation of chlorophyll a, chlorophyll b and total chlorophyll (0.79≤r2≤0.98) and used to estimate chlorophyll content for the remainder of the leaf cores.

2.4 Leaf spectral reflectance measurements (samples collected during 2002)

The FieldSpec Pro FR bare fibre-optic was fit through a mounting gun attached to a tripod, and adjusted to a nadir viewing position above a black, non-reflecting (<2%) surface on which each leaf was placed. Distance between the fibre-optic and the sample was 23 mm, which resulted in a field of view of approximately 10 mm in diameter. Illumination was provided using an external 50 W halogen, at an angle of 45 degrees. FieldSpec Pro FR optimization was performed at the same time as each white reference (initially and after groups of 9 measurements). Instrument configuration was adjusted to average 20 scans per white reference and 25 per dark current reading. Twenty scans were averaged per recorded leaf spectrum. Reflectance spectra were recorded as the ratio of sample data to white reference (99% reflectance Spectralon panel) data under the same illumination and viewing conditions. Three spectral measurements, from the side of the leaf opposite where the core was extracted, were recorded per leaf, and later averaged.

2.5 Histology (samples collected during 2003)

2.5.1 Sample collection

The following autumn (August-October 2003), sun and shade leaves from the same trees were sampled for histological analysis. For each sample, three SPAD values were recorded from one side of the leaf blade. Similarly, three UniSpec leaf spectral measurements were recorded from within the same area. For UniSpec measurements, a dark current reading and white reference (using barium sulfate), both averages of 10 scans, were performed after every other leaf. Sample reflectance was obtained by comparing leaf reflectance (also an average of 10 scans) to reflectance of the barium sulfate standard.

2.5.2 Leaf fixation and thin section analysis

Thin sections were made for study of changes in internal mesophyll structure over the period of fall senescence. Initially, small pieces were cut from the leaf blade (approximately 10 mm long and 2-3 mm wide, from the same side as the SPAD and reflectance measurements), avoiding the midrib. Fixation followed, in which the leaf pieces were subject to vacuum for two weeks in a formalin aceto-alcohol (FAA) solution. After fixation, samples were run through an ethanol processing centre (Fisher Histomatic 166) and embedded in paraffin molds. Using a microtome, thin sections (5 μm) were then cut from the embedded samples. Slides were mounted and stained (using two stains: Harris' haematoxylin stain and Safranin O and fast green, for comparison), and viewed and photographed under a Leica DM RXM light microscope at 20X magnification.

2.6 Data analysis

2.6.1 Indices

Three spectral vegetation indices were computed over the time course of senescence, 1.) the modified simple ratio, mSR705[42], 2.) the modified normalized difference index, mND705[42], and 3.) the plant senescence reflectance index, PSRI [18]:
m S R 705 = ( R 750 R 445 ) ( R 705 R 445 )
m N D 705 = ( R 750 R 705 ) ( R 750 + R 705 2 R 445 )
PSRI = ( R 678 R 500 ) R 750
Indices were plotted over both time and total chlorophyll content.

2.6.2 Histological analysis

Total width and palisade and spongy mesophyll width were determined using the 100 μm scale provided in each photo, from which a new ruler was constructed with 10 μm increments. To determine the proportion of airspace versus cells in the spongy mesophyll, we determined the percentage of pixels in an area of interest within the range of colour that typified air space using the Matlab Image Processing Toolbox. One to three areas of interest were delineated per image, to encompass as much of the spongy mesophyll as possible while avoiding veins. There were 114 images in total for the various species/light regime combinations (ASU, 34, ASH, 23, PSU, 26, PSH, 31) covering the seven sampling dates in 2003. Per sampling date, there were 2-5 images per species/light regime combination.

2.6.3 Correlation analysis

Correlation analysis was performed to determine the strength of relationships between chlorophyll content (total chlorophyll, chlorophyll a and b) and spectral indices (mSR705, mND705, PSRI) as well as anatomical features (total, palisade mesophyll and spongy mespohyll width, percent intercellular space) and spectral wavebands (445.9, 499, 548.5, 676.7, 706.2, 748.6, 800.7, 849.4, 901.2, and 949.6 nm) or indices. The wavebands listed provide a representation throughout the visible and near-infrared regions and several are also used in computation of indices (Eq. 1-3). Correlation analyses involving chlorophyll content were performed using 2002 data, for which we had a greater number of sampling dates; those involving histological features were restricted to the 2003 dataset. All samples were tested for normality before the t-tests and we consider an equal variance between sample groups.

3. Results

3.1 Results

In autumn 2002, for neighbouring P. tremuloides and P. balsamifera trees along the south side of the North Saskatchewan River, visible differences in the timing of senescence events were apparent between species. P. balsamifera was the first show signs of leaf yellowing and the first to undergo total leaf drop. By October 15 (day 288), 99% of P. balsamifera leaves had fallen. For P. tremuloides, all leaves had abscised by October 26 (day 299).

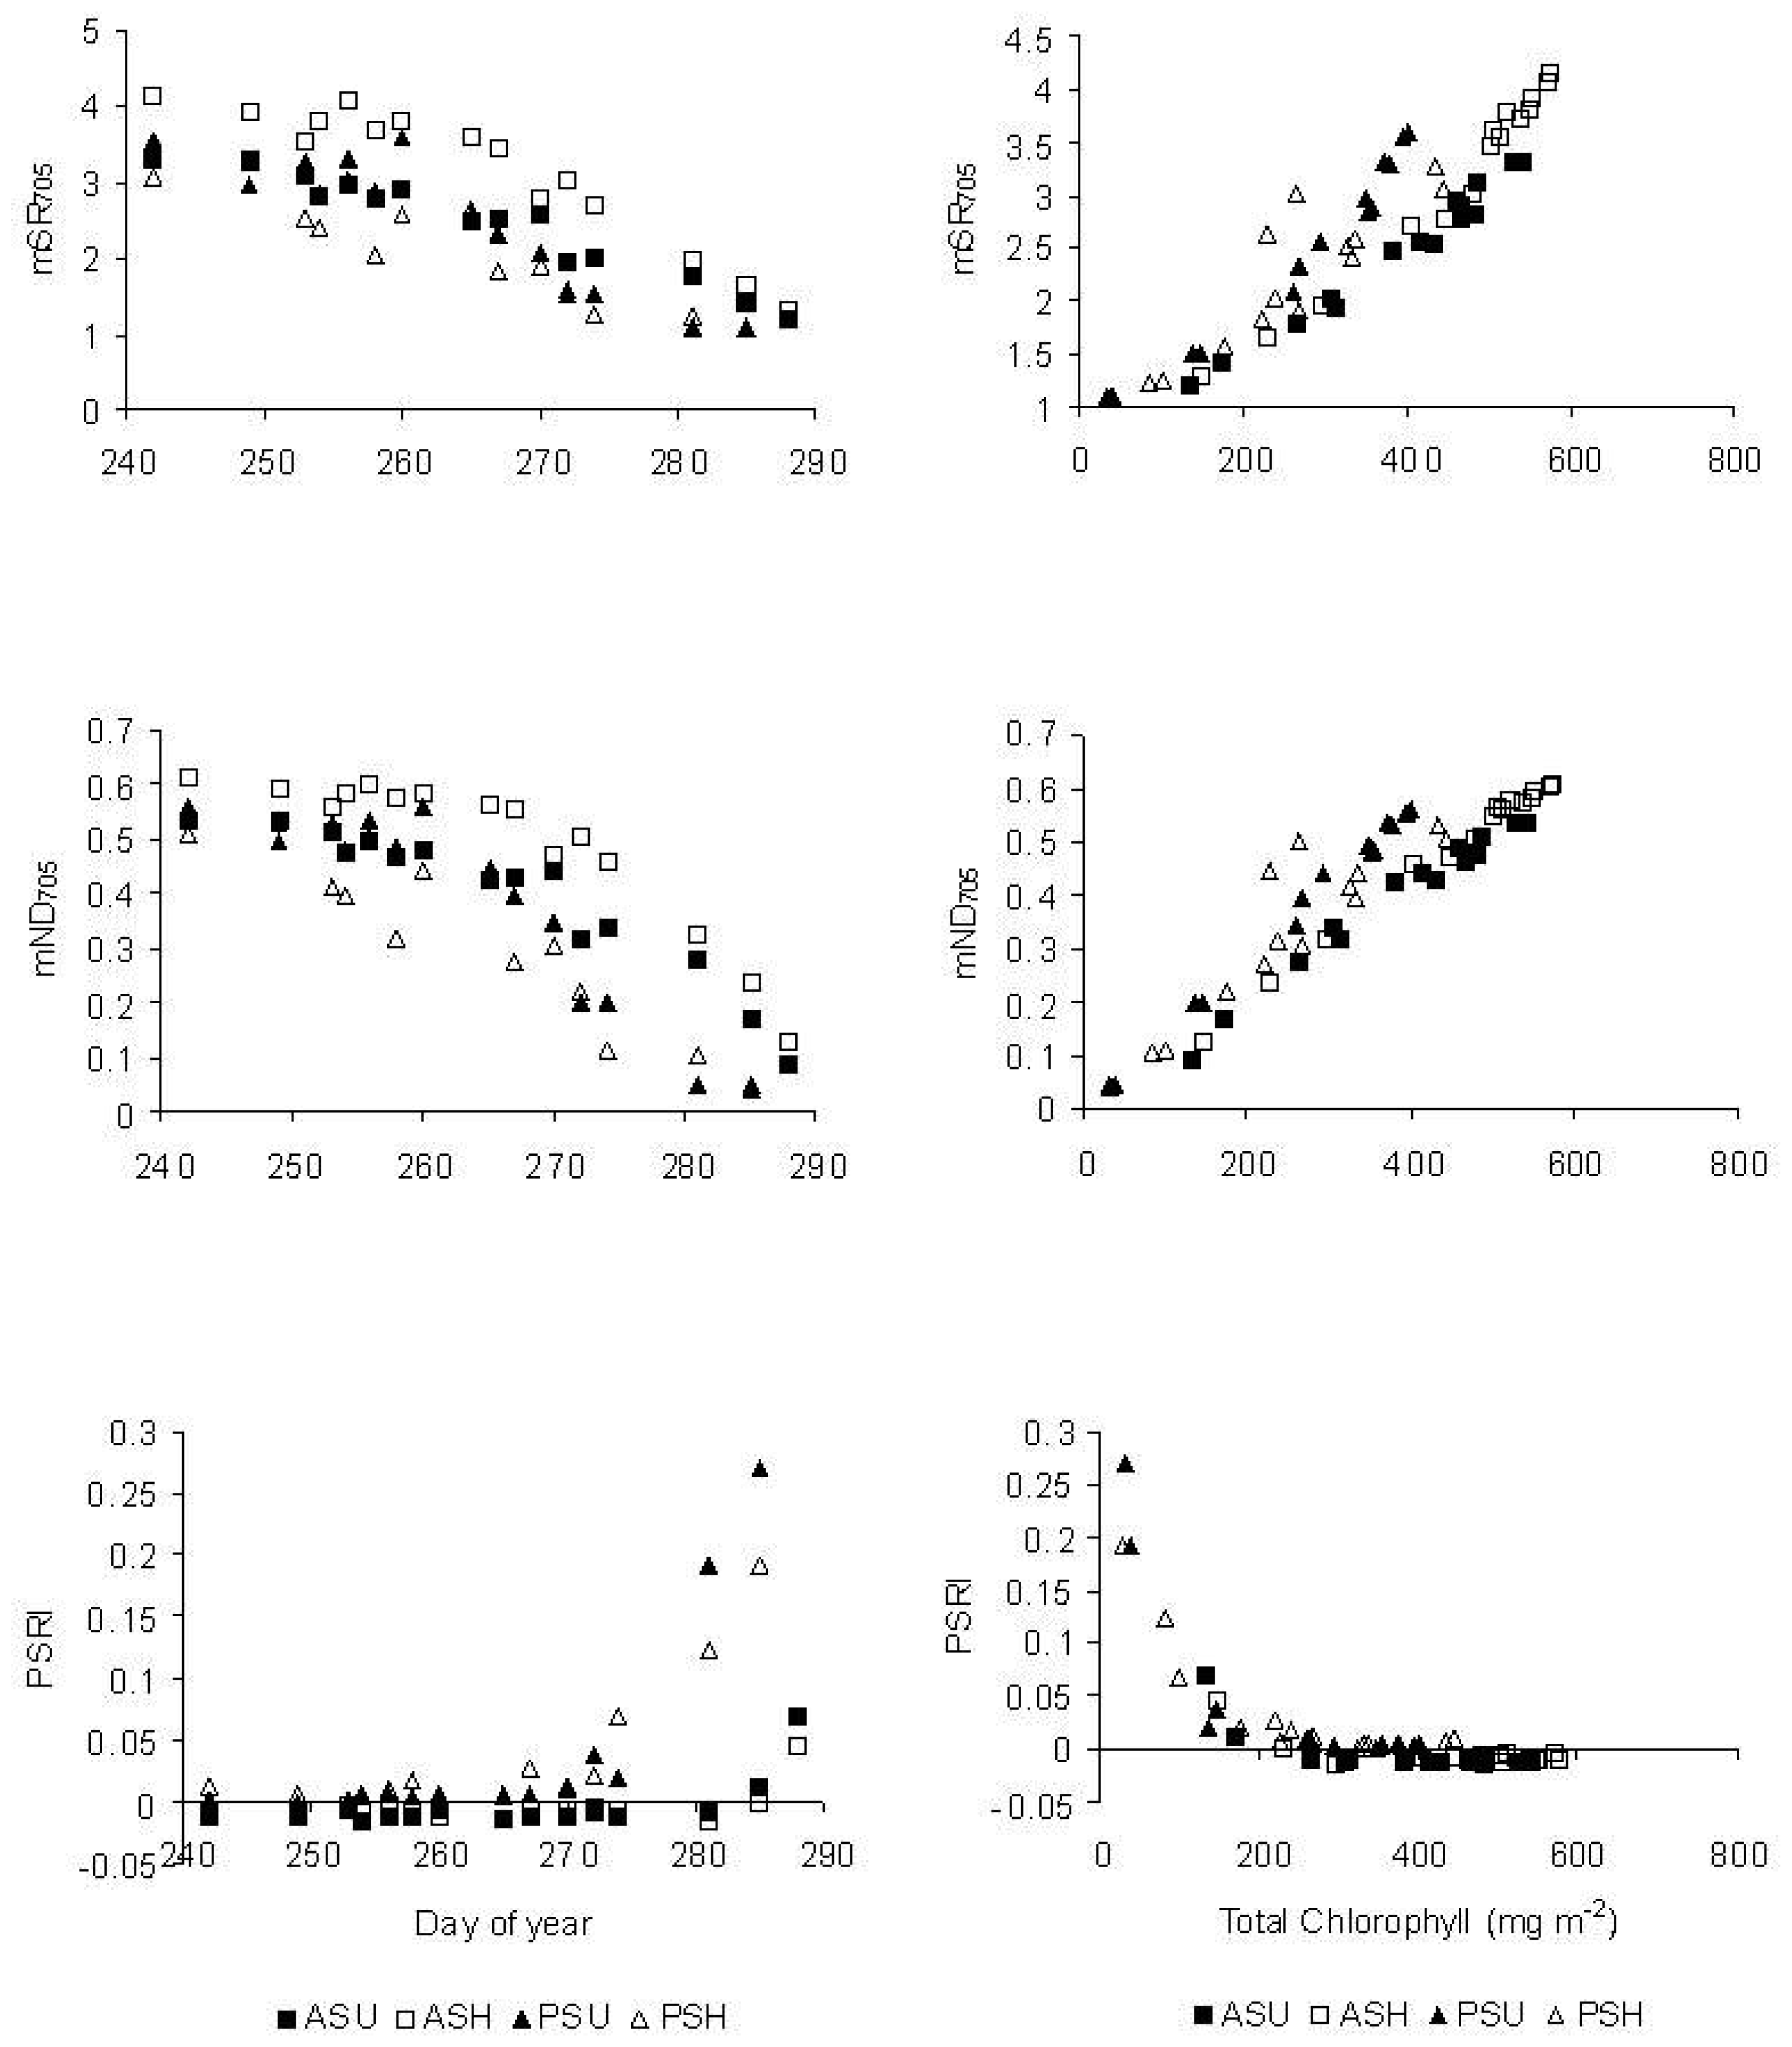
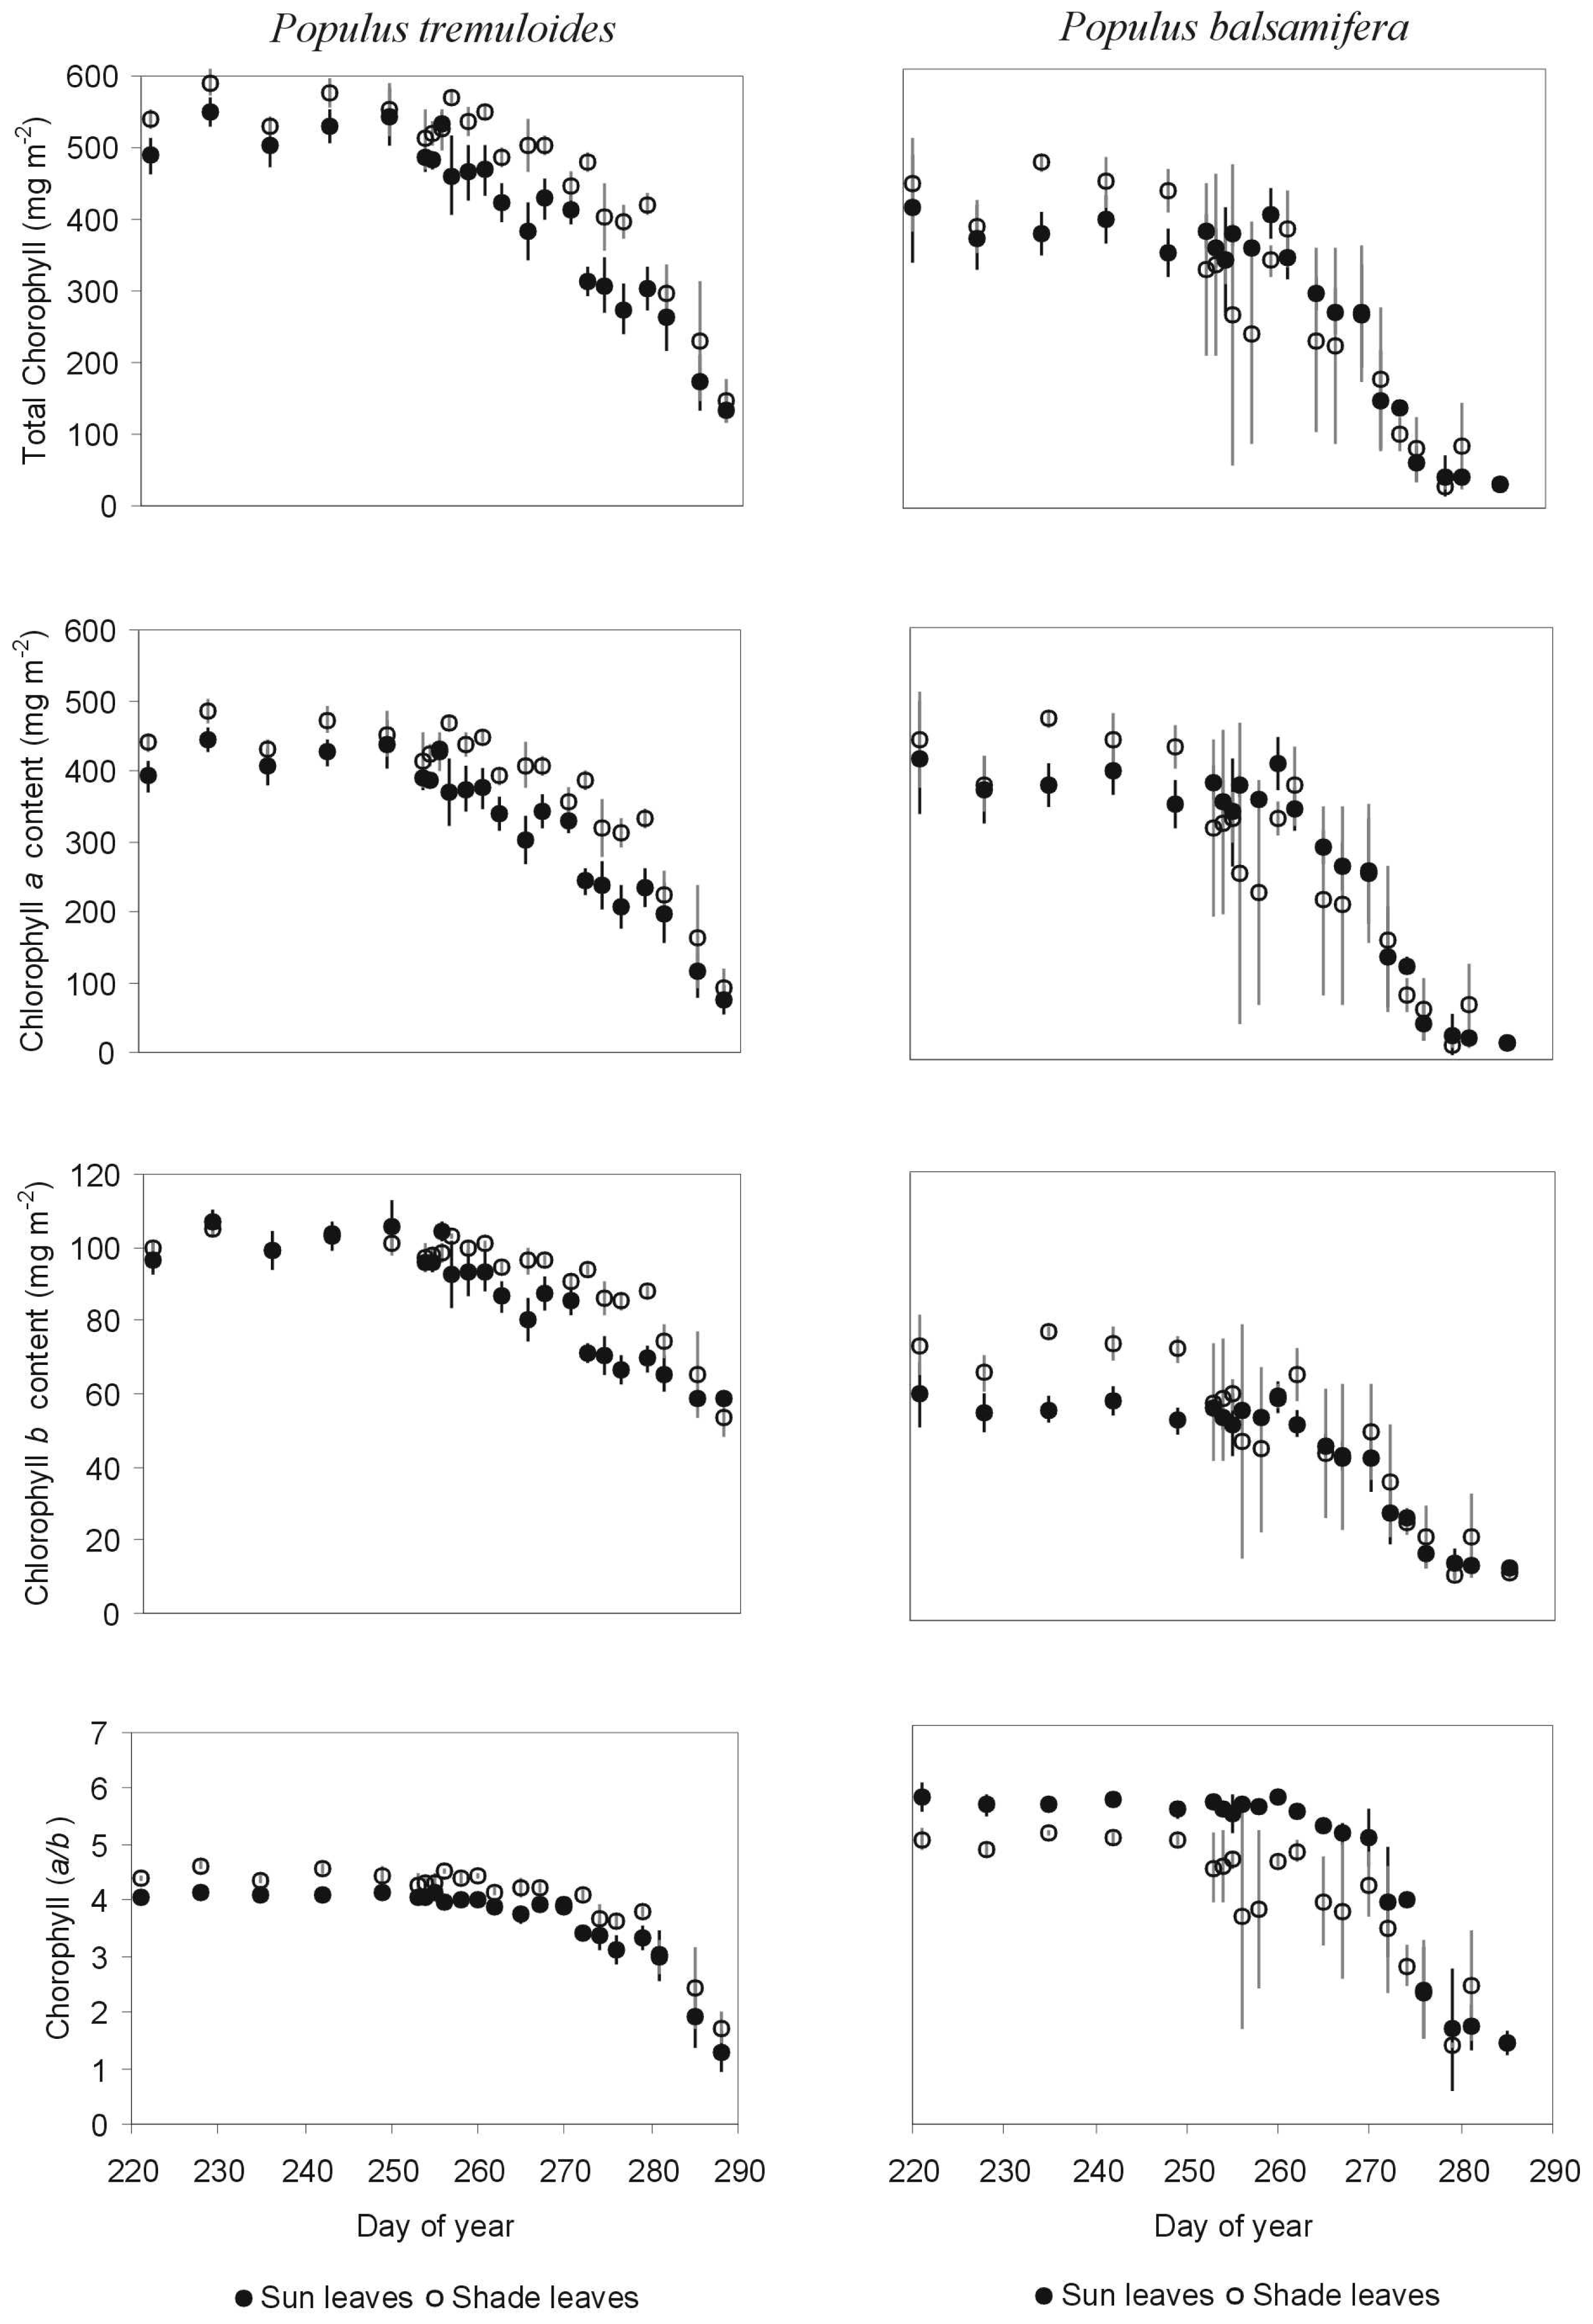
3.1.1 Indices and chlorophyll content

Over the time course of autumn senescence, several key differences may be observed between species and/or illumination category (Figure 1). When plotted according to date, mSR705 and mND705 for ASH leaves are consistently higher than for ASU leaves. For P. balsamifera, sun leaves generally exhibit higher values of both indices until near the end of the study period. At day 281, this phenomenon is reversed, and at day 285, values are near equal for PSU and PSH leaves. Over both species and illumination categories, ASU leaves exhibit the highest mSR705 and mND705 values; PSH leaves generally (with exceptions) show the least. When plotted against chlorophyll content, P. balsamifera leaves tend to have slightly higher mSR705 and mND705 values than P. tremuloides, but little distinction may be made between sun and shade leaves.
For mature leaves to early senescent leaves, PSRI for P. balsamifera leaves are slightly positive whereas for P. tremuloides leaves are slightly negative. The slightly positive PSRI values for mature P. balsamifera leaves are of note, as other documented species with dark-green plant tissues and high chlorophyll content have all exhibited slightly negative PSRI values (Merzlyak et al. 1999). Within P. tremuloides, ASH PSRI values are higher than for ASU until after day 274. Thus, in later stages of senescence, higher PSRI is observed for ASU leaves. PSU and PSH PSRI values are similar in mature to early senescing leaves, but in late senescence (days 281 and 285), PSRI is higher for PSU leaves. When comparing the two species, PSRI increases sooner for P. balsamifera (∼day 272; than for P. tremuloides (day 285). When plotted against chlorophyll content, PSRI curves are similar for both species and illumination category, although there are no PSRI values for P. tremuloides above 0.07.
Prior to chlorophyll breakdown, shade leaves of both P. balsamifera and P. tremuloides have higher total chlorophyll and chlorophyll a contents (Figure 2). Similarly, P. balsamifera shade leaves have higher chlorophyll b contents. Chlorophyll b for P. tremuloides leaves, prior to chlorophyll breakdown, is similar for sun and shade leaves, but higher in shade leaves once chlorophyll content declines. Comparing the two species, P. tremuloides had higher initial total chlorophyll and chlorophyll b contents than P. balsamifera. For both trees, declines in chlorophyll content in 2002 began approximately day 255 (Sept 12). For P. tremuloides, the decline was faster for sun leaves than for shade leaves. P. balsamifera leaves reversed this role in that total chlorophyll and chlorophyll a contents decreased sharply for shade leaves during mid-senescence (from approximately day 255 to day 270). Overall, declines in chlorophyll a, b and total chlorophyll were sharper and more variable for P. balsamifera than for P. tremuloides.
P. balsamifera and P. tremuloides differ markedly in the behaviour of the chlorophyll a/b prior to and during senescence. P. tremuloides has lower initial chlorophyll a/b but its decline started later than in P. balsamifera (approximately day 262 for P. tremuloides versus day 254 for P. balsamifera). Throughout the entire period, chlorophyll a/b for P. tremuloides shade leaves is greater than for sun leaves whereas the reverse is observed in P. balsamifera (also observed for the 2003 dataset with the exception of two dates (day 268, Sept 25 and day 274, Oct 1) for P. balsamifera, data not shown).
In the near-infrared, reflectance at 800 nm was significantly higher for P. balsamifera (mean ±1 SD = 51.68 ± 5.25%) than for P. tremuloides (mean ± 1SD = 47.50 ± 2.86%) (based on a two-tailed t-test, P<0.001). Significant differences were not observed between sun and shade leaves for either species, however (P>0.05). Over time, reflectance at 800 nm for both species remained nearly constant (data not shown).

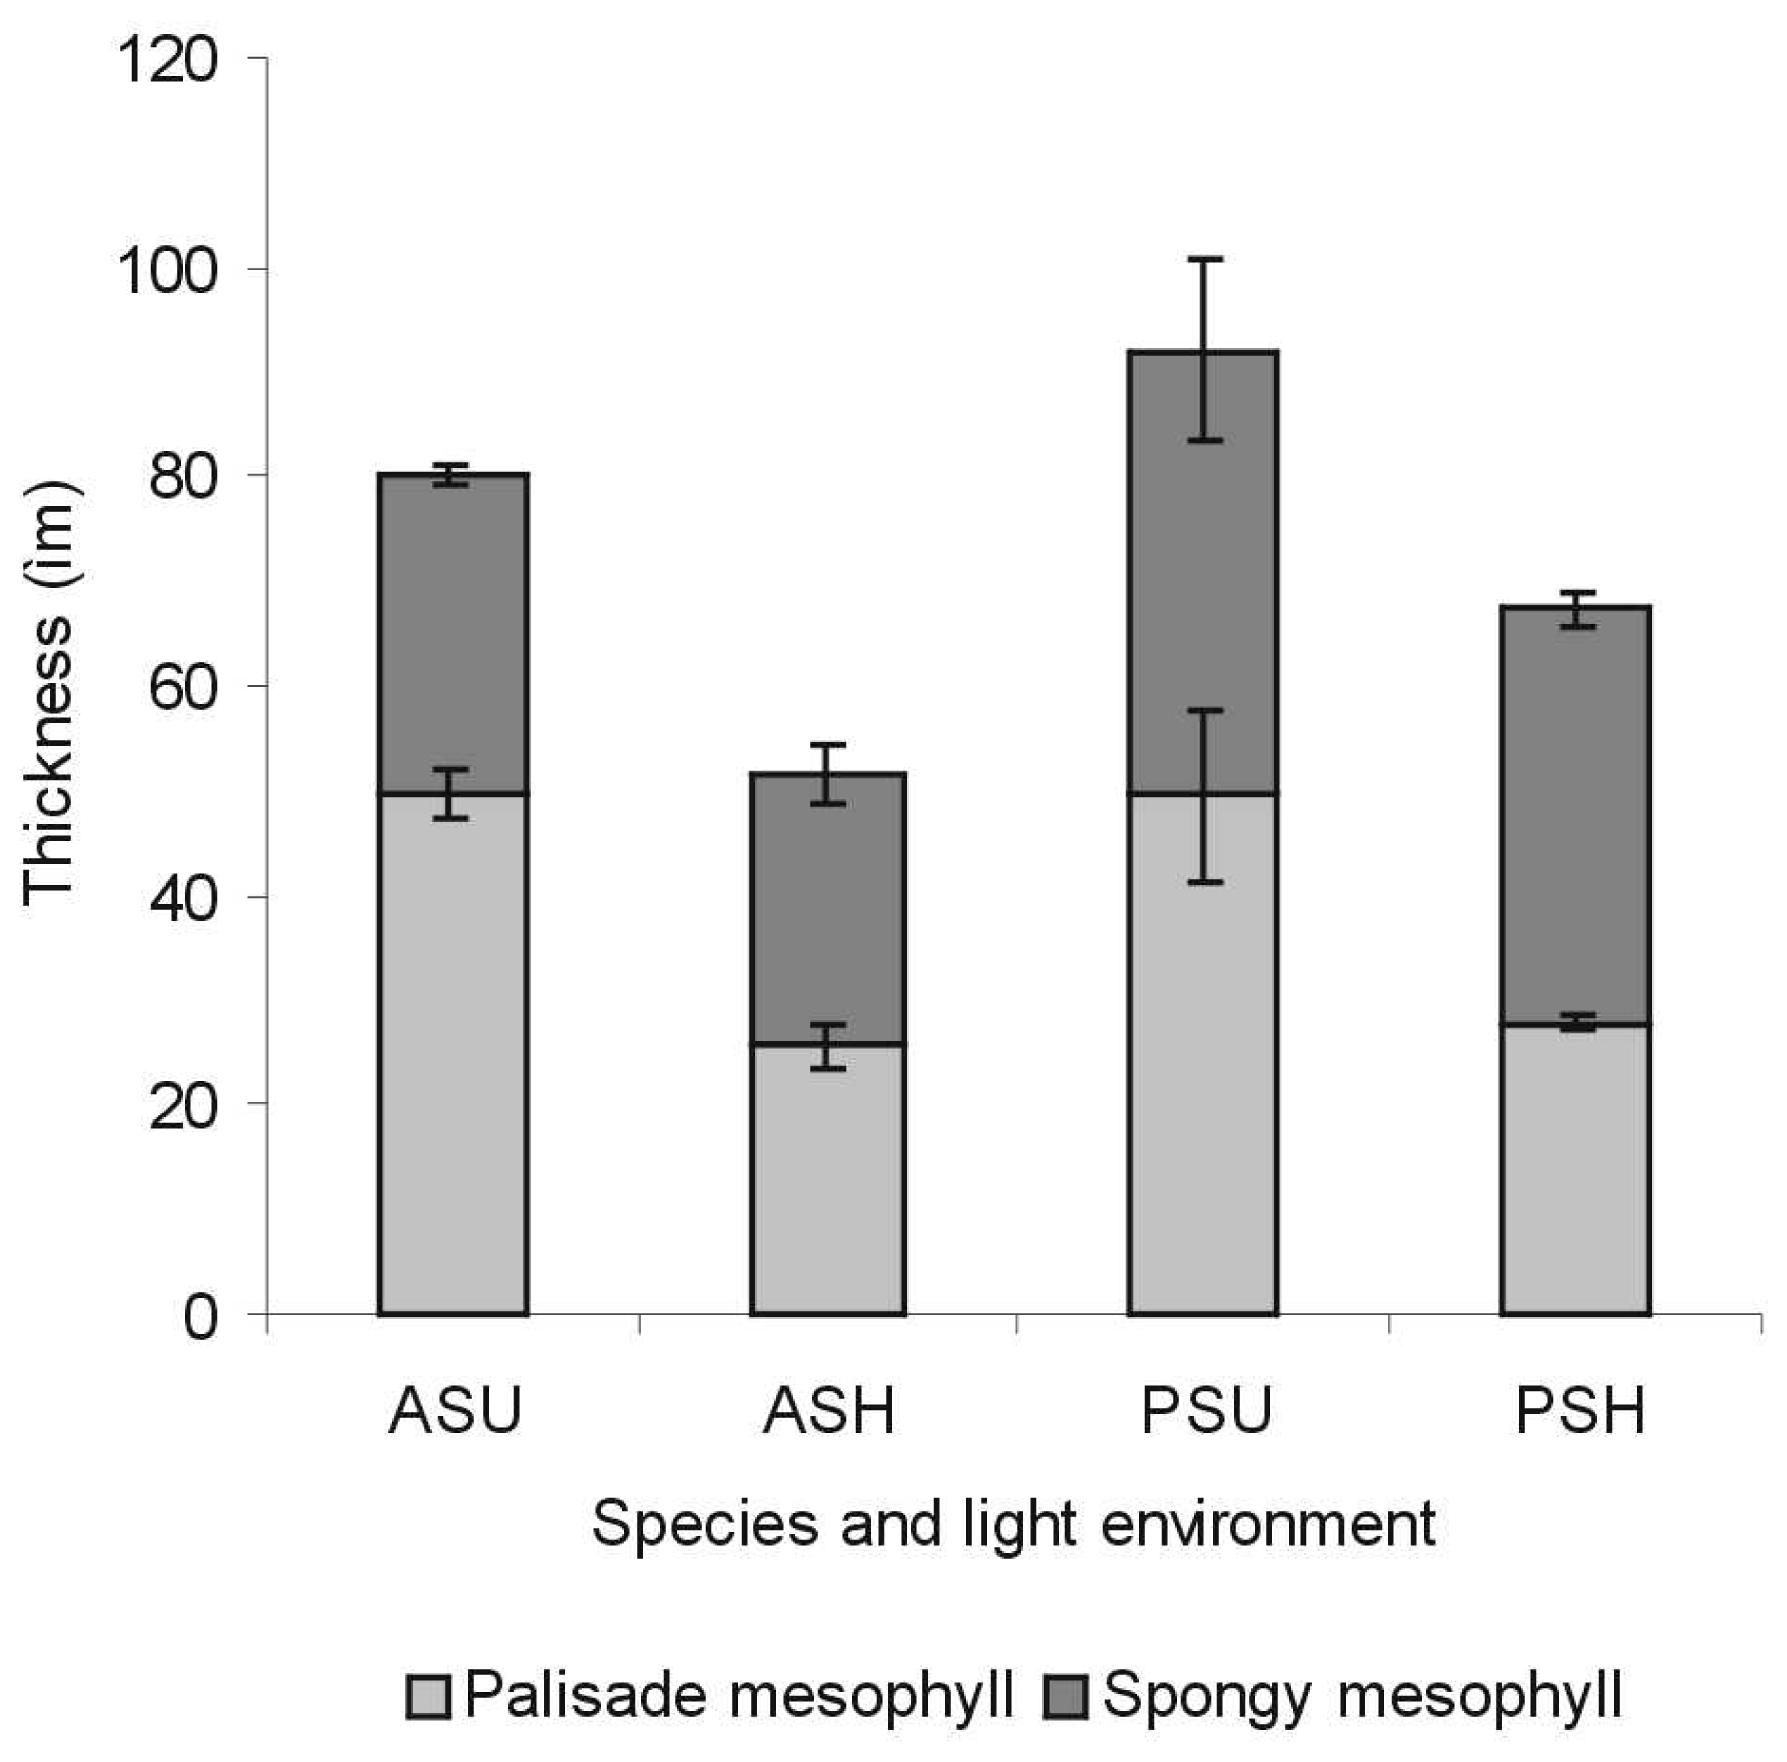
3.1.2 Histological analysis

Analysis of leaf thin sections also revealed a number of important differences between P. tremuloides and P. balsamifera and their sun-lit and shaded leaves during senescence. Statistical tests were not performed due to the limited number of samples in some categories, and one of the limitations of the histological analysis is a lack of P. tremuloides shade leaves at low chlorophyll contents (<250 mg m-2) (Table 1). Key findings from Table 1 and visual observations include the following:
Comparisons between P. tremuloides and P. balsamifera
  • P. tremuloides leaves are thinner than P. balsamifera leaves
  • P. tremuloides leaves have lower percent intercellular space in the spongy mesophyll than P. balsamifera leaves
Comparisons between sun and shade leaves
  • Sun leaves are thicker than shade leaves (Figure 3)
  • For sun leaves, the palisade mesophyll is thicker than the spongy mesophyll (Figure 3)
  • For P. tremuloides shade leaves, the palisade mesophyll is thicker than the spongy mesophyll but for P. balsamifera shade leaves, the spongy mesophyll is thicker than the palisade mesophyll (Figure 3)
  • Both sun and shade leaves of P. tremuloides and P. balsamifera had two palisade cell layers
  • For mature leaves, percent intercellular space was greater in shade leaves than for sun leaves, notably for P. tremuloides
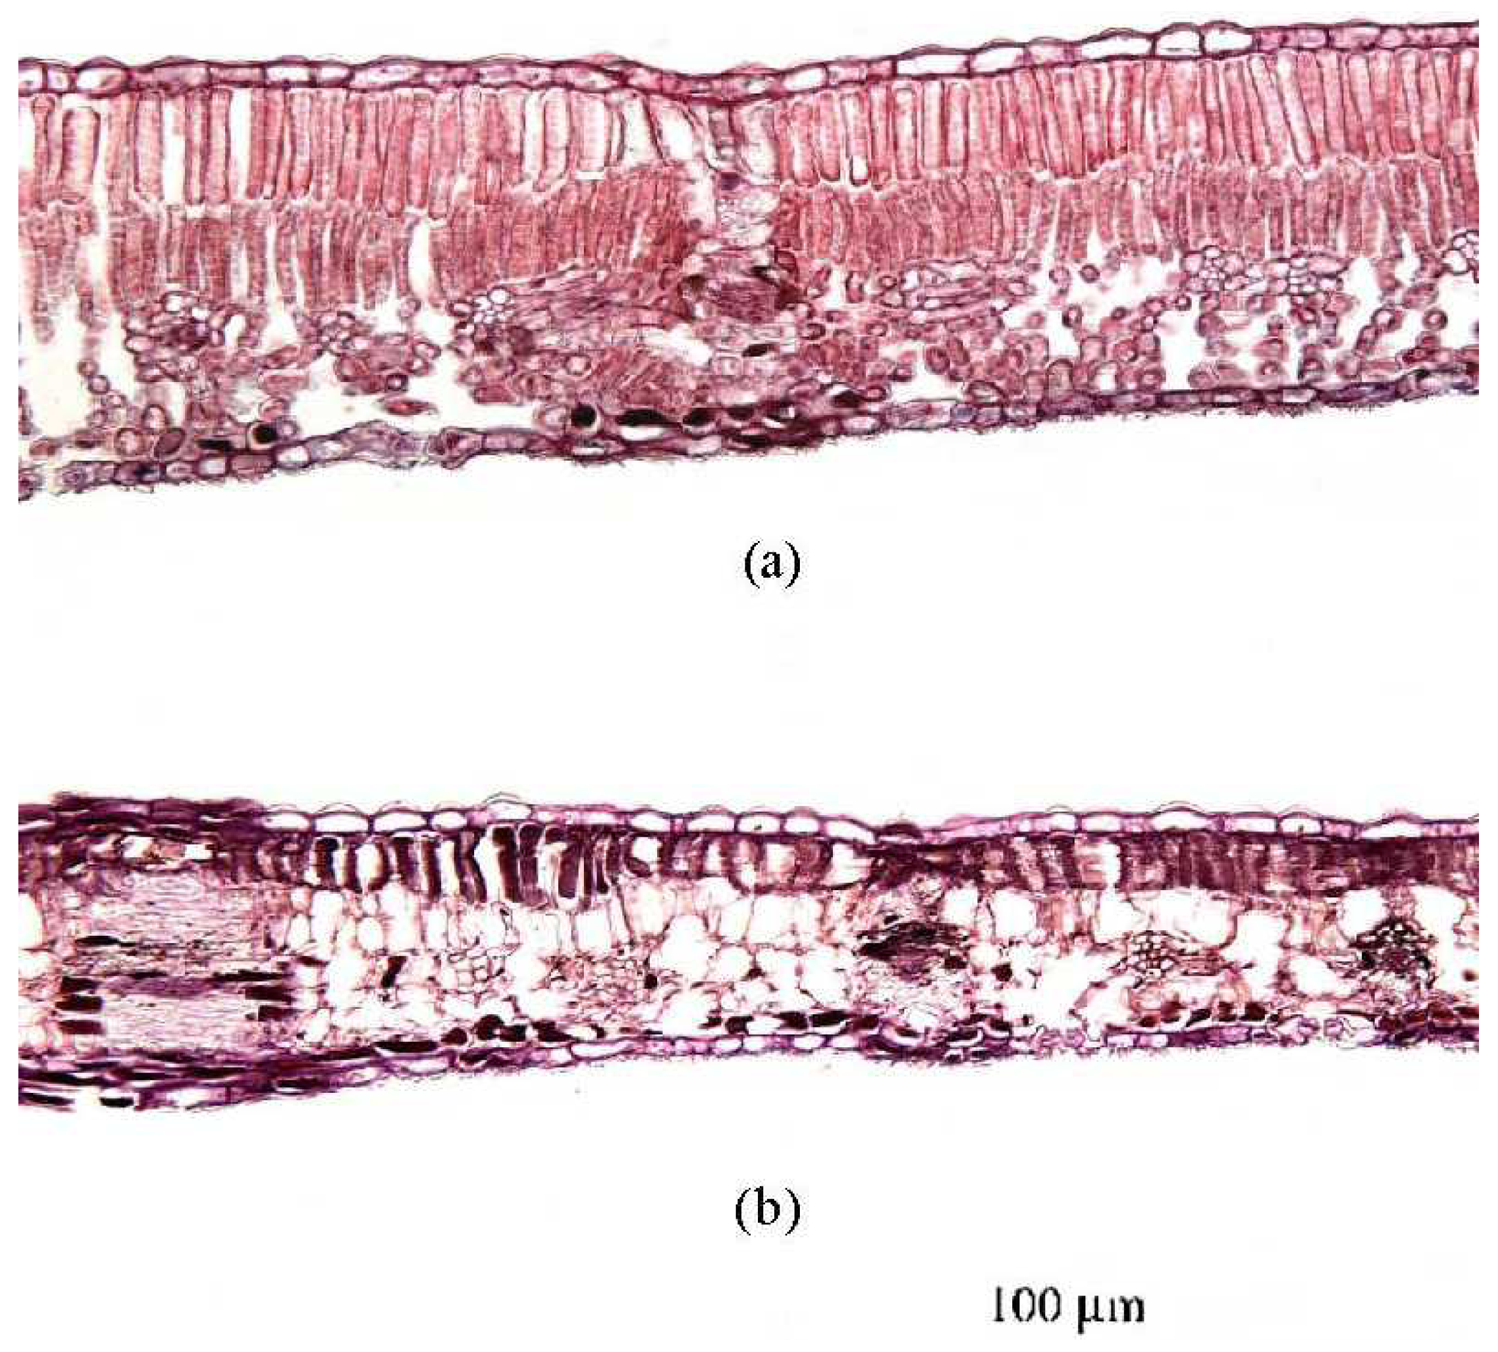
  • Comparisons between mature and senescing leaves
  • For sun leaves, percent intercellular space is higher in senescing leaves
  • Cell disintegration in the spongy mesophyll was evident in late stages of senescence (Figure 4).

3.1.3 Correlation analyses

Highly significant (P<0.01) correlation coefficients were found between the chlorophyll indices (mSR705, mND705)) and chlorophyll a, b, total chlorophyll and chlorophyll a/b (exception: ASU mSR705 with chlorophyll a/b, significant at P<0.05) (Table 2). PSRI was not included in the correlation analysis with chlorophyll because the relationship was non-linear (Figure 1).
There were fewer significant relationships between spectral bands and leaf anatomical features (total thickness, palisade mesophyll thickness, spongy mesophyll thickness, percent intercellular space). Of particular interest, no significant correlations were found between any of these leaf traits and wavebands in the near-infrared. This is consistent with our finding that reflectance at 800.7 nm was fairly stable over a large range of chlorophyll contents within each species. However, a number of significant relationships were detected between leaf traits and wavebands in the chlorophyll absorption wells (445.9 nm, 676.7 nm) as well as with PSRI. This was the case for ASU leaves, in which all leaf traits (total thickness, palisade mesophyll thickness, spongy mesophyll thickness, percent intercellular space) were significantly (P<0.05) correlated with reflectance at 445.9 nm, 676.7 nm, as well as with PSRI. For P. tremuloides shade leaves, the only significant correlations found were between palisade mesophyll thickness and PSRI and between percent intercellular space and PSRI. For P. balsamifera sun leaves, palisade mesophyll thickness was correlated (P<0.05) with R445.9, R676.7 and PSRI. No significant relationships existed between P. balsamifera shade leaves and any of the leaf anatomical traits.

4. Discussion

4.1 Comparison of species

Several key differences in leaf spectral reflectance and leaf traits between P. tremuloides and P. balsamifera have been identified in this study. Overall, the earlier onset of senescence in P. balsamifera as compared to P. tremuloides was reflected in an earlier rise in PSRI, an index designed for this purpose (Figure 1). Two additional indices, mSR705 and mND705, which tightly correlate with chlorophyll content, were useful in monitoring trends in chlorophyll content over the progress of senescence (Table 2). Values of these indices were generally higher for P. tremuloides, with the higher total chlorophyll content. P. balsamifera, on the other hand, exhibited higher chlorophyll a/b. Leaf thickness and percentage intercellular space were also greater in P. balsamifera (Table 1), which corresponds well with its significantly higher mean reflectance at 800.7 nm (P<0.001).
Differences in reflectance indices between species at key times of the year may have important implications for detecting species from a remote sensing perspective. This will be the case only if these differences are consistent between species and are transferred to the canopy level. Further study using hyperspectral airborne or space-borne imagery would be necessary to answer these types of questions. A significant complicating factor will be non-synchronous timing of leaf colour changes and leaf fall between clones, which has been known to occur within the same stand [38].

4.2 Comparison of sun and shade leaves

For both species, many of the expected differences between their sunlit and shaded leaves were observed, including greater total thickness and, in particular, greater palisade mesophyll thickness in sunlit leaves (Table 1). That mature shade leaves had greater percent intercellular space than mature sun leaves is consistent with [25,26]. Higher proportion of spongy mesophyll in shade leaves may serve to increase internal light scattering and absorptance under low light levels [39]. The two species, both shade-intolerant, therefore appear capable of some degree of morphological plasticity due to light environment, based on their variability in leaf histological features [20,23]. However, these differences did not result in significant differences (α =0.05) in reflectance at 800.7 nm between sun and shade leaves for either species. An earlier study by [31] concluded similarly, for which sun-adapted plants had similar optical properties in the near-infrared to shade-adapted plants.
Although total chlorophyll was initially higher for shade leaves for both P. tremuloides and P. balsamifera, this trend continued for P. tremuloides but destabilized in P. balsamifera with the onset of senescence (Figure 2). The most striking difference between sun and shade leaves of the two species was observed for chlorophyll a/b. For P. tremuloides, shade leaves consistently had higher chlorophyll a/b whereas for P. balsamifera, sun leaves almost always had the higher chlorophyll a/b. Since previous studies have shown a tendency for chlorophyll a/b to decrease with decreasing light availability [27,28,29], our results for P. tremuloides are contrary to the norm.

4.3 Comparison of mature and senescing leaves

Higher percent intercellular space for senescing ASU and PSU than for mature ASU and PSU (Table 1) are an indication of changes in the mesophyll such as cell wall breakdown, also evident in thin section photographs (Figure 4) (PSH leaves did not show this trend, however). Unfortunately, based on our data, it does not appear possible to track these types of changes, determined from simple leaf thin sections, using wavebands in the NIR. It is important to note here, however, that while large sample sizes were attained of reflectance spectra and for chlorophyll analyses, sample sizes for the histological analysis were limited due to the greater amount of time and detail required (see Methods). Larger sample sizes could have strengthened our conclusions based on Table 1.
Overall, correlations between internal anatomical features and wavebands in the NIR were poor (P>0.05). Likewise, correlations between NIR and % intercellular space were weak in a study by [40], who used more labour-intensive oblique-paradermal sections to determine leaf section parameters. In their case, parameters highly correlated with NIR included the ratio of mesophyll cell surface area exposed to intercellular space per unit leaf area, leaf bicoloration, and the prescence of a thick leaf cuticle. Their finding agrees with [15], who indicated that the number or total area of the air-cell wall interfaces may be a more important parameter for determining reflectance than the volume of air space. He also suggested that, with regard to internal light-scattering mechanisms, the palisade mesophyll may be just as important as the spongy mesophyll. On the other hand, we found significant correlation (P<0.05) between transmittance at 800.7 nm and both percent intercellular space and spongy mesophyll width for nine tropical species with a much greater range for these three variables [41]. It appears that percent intercellular space and spongy mesophyll width may be more useful for prediction in the near-infrared in multiple species with dissimilar internal morphologies than for same-species samples covering the progress of senescence.
Chlorophyll a/b declined with time for P. tremuloides and P. balsamifera during autumn senescence (Figure 2). This decline is consistent with work by Sanger (1971), who also observed a decline in chlorophyll a/b in senescing P. tremuloides leaves. It does not correspond with findings by Dean et al. (1993), however, who observed an increase in chlorophyll a/b for this same species during senescence.

5. Conclusions

Throughout this study, we aimed to improve our understanding of the spectro-temporal dynamics of P. tremuloides and P. balsamifera leaves by characterizing changes in leaf traits in autumn and determining their correspondence with changes in leaf spectral characteristics. Since our results cover limited sample sizes over two autumn periods (2002 and 2003), we cannot make generalizations about their senescence behaviour over time nor space. Changes in chlorophyll content during this period, however, were well correlated with two indices, mSR705 and mND705[42]. Deterioration of the mesophyll, however, while evident in thin section photographs, was not evident in a NIR response. This result was unexpected. In fact, [14] stated ‘collapse of the mesophyll’ as a common predictor for decreases of NIR. This predictor was not effective in explaining NIR levels in our data, and may not be useful over all species or leaf types. Transmittance in the NIR was not found to change with leaf senescence either in a study by [43] on beans (Phaseolus vulgaris L.). On the contrary, several mesophyll features (palisade and spongy mesophyll thickness and percent intercellular space) were significantly correlated with PSRI, which incorporates wavebands from both the visible and NIR regions. This index should be explored to a greater extent for the purpose of tracking mesophyll breakdown in senescing leaves.
Sampling over multiple years, over a greater number of trees representing clones and over a broader range of sites would further extend our knowledge of the ecology of these species, particularly if coupled with study of satellite-borne hyperspectral imagery. Research of this type could indicate the potential for species discrimination and potentially clone discrimination from remotely sensed data, especially at critical times of the year such as autumn senescence. Extending the present study to cover the period of spring flush could expose additional key differences between these major hardwood components of the forest resource in western Canada.

Acknowledgments

We would like to acknowledge the financial support of the National Science and Engineering Research Council of Canada under their Discovery Grant Programme. As well, we thank Dr. Benoit Rivard for his input on the experimental design, and Dr. Ron Hall for helpful comments on an early version of this manuscript. We acknowledge the comments and suggestions of two anonymous reviewers.

References

  1. Anderson, A.; Keskutalo, J.; Sjodin, A.; Bhalerao, R.; Sterkym, F.; Wissel, K.; Tandre, K.; Aspeborg, H.; Moyle, R.; Ohmiya, Y.; Brunner, A.; Gustafsson, P.; Karlsson, J.; Lundeberg, J.; Nilsson, O.; Sandberg, G.; Strauss, S.; Sundberg, B.; Uhlen, M.; Jansson, D.; Nilsson, P. A transcriptional timetable of autumn senescence. Genome Biol. 2005, 5(R24), 1–13. [Google Scholar]
  2. Matile, P.; Duggelin, T.; Rentsch, M.; Bortlik, K.; Peiker, C.; Thomas, H. How and why is chlorophyll broken down in senescent leaves. Plant Physiol. Biochem. 1989, 27, 595–604. [Google Scholar]
  3. Masoni, A.; Ercoli, L.; Mariotti, M.; Barberi, P. Changes in spectral properties of aging and senescing maize and sunflower leaves. Physiol. Planta. 1994, 91, 334–338. [Google Scholar]
  4. Collier, D. E.; Thibodeau, B. A. Changes in respiration and chemical content during autumnal senescence of Populus tremuloides and Quercus rubra leaves. Tree Physiol. 1995, 15, 759–764. [Google Scholar]
  5. Merzlyak, M. N.; Gitelson, A. Why and what for the leaves are yellow in autumn? On the interpretation of optical spectra of senescing leaves (Acer platanoides L.). J. Plant Physiol. 1995, 145, 315–320. [Google Scholar]
  6. Wolf, F. T. Changes in chlorophyll-a and chlorophyll-b in autumn leaves. American Journal of Botany 1956, 43, 714–718. [Google Scholar]
  7. Sanger, J. E. Quantitative investigations of leaf pigments from their inception in buds through autumn coloration to decomposition in falling leaves. Ecology 1971, 52, 1075–1089. [Google Scholar]
  8. Watts, D. F.; Eeley, J. H. Changes in the chlorophyll a-b ratio during autumn coloration of Populus sargentii. Bull. Torrey Botan. Club 1981, 108, 379–382. [Google Scholar]
  9. Peterson, E. B.; Peterson, N. M. Ecology, management, and use of aspen and balsam poplar in the prairie provinces. Special Report 1; Forestry Canada Northwest Region Northern Forestry Centre: Edmonton, AB, Canada, 1992. [Google Scholar]
  10. Okada, K.; Inoue, Y.; Satoh, K.; Katoh, S. Effects of light on degradation of chlorophyll and proteins during senescence of detached rice leaves. Plant Cell Physiol. 1992, 33, 1183–1191. [Google Scholar]
  11. Masclaux, C.; Valadier, M. H.; Brugiere, N.; Morot-Gaudry, J. F.; Hirel, B. Characterization of the sink/source transition in tobacco (Nicotiana tabacum L.) shoots in relation to nitrogen management and leaf senescence. Planta 2000, 211, 510–518. [Google Scholar]
  12. Hortensteiner, S.; Feller, U. Nitrogen metabolism and remobilization during senescence. J. Exp. Bot. 2002, 53, 927–937. [Google Scholar]
  13. Boyer, M.; Miller, J.; Belanger, M.; Hare, E.; Wu, J. Y. Senescence and spectral reflectance in leaves of Northern Pin Oak (Quercus palustris Muenchh). Remote Sens. Environ. 1998, 25, 71–87. [Google Scholar]
  14. Knipling, E. B. Physical and physiological basis for the reflectance of visible and near-infrared radiation from vegetation. Remote Sens. Environ. 1970, 1, 155–159. [Google Scholar]
  15. Kmipling, E. B. Physical and physiological basis for differences in reflectance of healthy and diseased plants. In Proc. Workshop on Infrared Color Photography and diseased plants; Florida Dept. of Agriculture: Winter Haven, Florida, 1967. [Google Scholar]
  16. Gausman, H. W. Plant leaf optical properties in visible and near-infrared light; Graduate Studies No. 29; Texas Tech Press: Lubbock, Texas, 1985. [Google Scholar]
  17. Gitelson, A.; Merzlyak, M. N. Spectral reflectance changes associated with autumn senescence of Aesculus hippocastanum L and Acer platanoides L leaves - spectral features and relation to chlorophyll estimation. J. Plant Physiol. 1994, 143, 286–292. [Google Scholar]
  18. Merzlyak, M. N.; Gitelson, A. A.; Chivkunova, O. B.; Rakitin, V. Y. Non-destructive optical detection of pigment changes during leaf senescence and fruit ripening. Physiol. Planta. 1999, 106, 135–141. [Google Scholar]
  19. StJacques, C.; Labrecque, M.; Bellefleur, P. Plasticity of leaf absorbency in some broadleaf tree seedlings. Bot. Gaz. 1991, 152, 195–202. [Google Scholar]
  20. Ashton, P.M. S.; Berlyn, G. P. Leaf adaptations of some Shorea species to sun and shade. New Phytol. 1992, 121, 587–596. [Google Scholar]
  21. Feng, Y. L.; Cao, K. F.; Zhang, J. L. Photosynthetic characteristics, dark respiration, and leaf mass per unit area in seedlings of four tropical tree species grown under three irradiances. Photosynthetica 2004, 42, 431–437. [Google Scholar]
  22. Gamage, H. K.; Ashton, M. S.; Singhakumara, B. M. R. Leaf structure of Syzygium spp. (Myrtaceae) in relation to site affinity within a tropical rain forest. Bot. J. Linn. Soc. 2003, 141, 365–377. [Google Scholar]
  23. Ashton, P. M. S.; Olander, L. P.; Berlyn, G. P.; Thadani, R.; Cameron, I. R. Changes in leaf structure in relation to crown position and tree size of Betula papyrifera within fire-origin stands of interior cedar-hemlock. Can. J. Bot.-Rev. Can. Bot. 1998, 76, 1180–1187. [Google Scholar]
  24. Roth, I. Stratification of tropical forests as seen in leaf structure; Dr. W. Junk Publishers: The Hague, 1984. [Google Scholar]
  25. Gausman, H. W. Evaluation of factors causing reflectance differences between sun and shade leaves. Remote Sens. Environ. 1984, 15, 177–181. [Google Scholar]
  26. Gamon, J. A; Surfus, J. S. Assessing leaf pigments content and activity with a reflectometer. New Phytol. 1999, 143, 105–117. [Google Scholar]
  27. Oberbauer, S. F; Strain, B. R. Effects of canopy position and irradiance on the leaf physiology and morphology of Pentaclethra macroloba (Mimosaceae). Am. J. Bot. 1986, 73, 409–416. [Google Scholar]
  28. Givnish, T. J. Adapatations to sun and shade: A whole-plant perspective. In Ecology of Photosynthesis in Sun and Shade; Evans, J. R., vonCaemmerer, S., Adams, W. W., III, Eds.; CSIRO: Australia, 1988; pp. 63–92. [Google Scholar]
  29. Lei, T. T.; Tabuchi, R.; Kitao, M.; Koike, T. Functional relationship between chlorophyll content and leaf reflectance, and light-capturing efficiency of Japanese forest species. Physiol. Planta. 1996, 96, 411–418. [Google Scholar]
  30. Lee, D. W.; Graham, R. Leaf optical-properties of rain-forest sun and extreme shade plants. Am. J. Bot. 1986, 73, 1100–1108. [Google Scholar]
  31. Knapp, A. K.; Carter, G. A. Variability in leaf optical properties among 26 species from a broad range of habitats. Am. J. Bot. 1998, 85, 940–946. [Google Scholar]
  32. Demarez, V.; Gastellu-Etchegorry, J. P.; Mougin, E.; Marty, G.; Proisy, C.; Dufrene, E.; Le Dantec, V. Seasonal variation of leaf chlorophyll content of a temperate forest. Inversion of the PROSPECT model. Int. J. Remote Sens. 1999, 20, 879–894. [Google Scholar]
  33. Dean, M. A.; Letner, C. A.; Eley, J. H. Effect of autumn foliar senescence on chlorophyll a-b ratio and respiratory enzymes of Populus tremuloides. Bull. Torrey Bot. Club 1993, 120, 269–274. [Google Scholar]
  34. Rauscher, H. M.; Perala, D. A.; Worth, C. V. The ecology and management of aspen. AI Appl. 1995, 9, 59–59. [Google Scholar]
  35. Farrar, J. L. Trees in Canada; Fitzhenry & Whiteside Ltd. and the Canadian Forest Service Natural Resources Canada: Ottawa, Canada, 1995. [Google Scholar]
  36. Amlin, N. M.; Rod, S. B. Drought stress and recovery of riparian cottonwoods due to water table alteration along Willow Creek, Alberta. Trees-Struct. Funct. 2003, 17, 351–358. [Google Scholar]
  37. Mitton, J. B.; Grant, M. C. Observations on the ecology and evolution of quaking aspen, Populus tremuloides, in the Colorado Front Range. Am. J. Bot. 1980, 67, 202–209. [Google Scholar]
  38. Peterson, E. B.; Peterson, N. M. Ecology, management, and use of aspen and balsam poplar in the prairie provinces. Special Report 1. Forestry Canada Northwest Region Northern Forestry Centre 1992, 252. [Google Scholar]
  39. Garcia-Plazaola, J. I.; Hernandez, A.; Becerril, J. M. Antioxidant and pigment composition during autumnal leaf senescence in woody deciduous species differing in their ecological traits. Plant Biol. 2003, 5, 557–566. [Google Scholar]
  40. Slaton, M. R.; Hunt, E. R.; Smith, W. K. Estimating near-infrared leaf reflectance from leaf structural characteristics. Am. J. Bot. 2001, 88, 278–284. [Google Scholar]
  41. Castro-Esau, K. L.; Sanchez-Azofeifa, G. A.; Rivard, B.; Wright, S. J.; Quesada, M. Variability in leaf optical properties of Mesoamerican trees and the potential for species classification. Am. J. Bot. 2006, 93, 517–530. [Google Scholar]
  42. Sims, D. A.; Gamon, J. A. Relationships between leaf pigment content and spectral reflectance across a wide range of species, leaf structures and developmental stages. Remote Sens. Environ. 2002, 81, 337–354. [Google Scholar]
  43. Madeira, A. C.; Mendonca, A.; Ferreira, M. E.; Torborda, M. D. Relationship between spectroradiometric and chlorophyll measurements in green beans. Commun. Soil Sci. Plant Anal. 2000, 31, 631–643. [Google Scholar]
  44. Hiscox, J. D.; Israelstam, G. F. Method for the extraction of chlorophyll from leaf tissue without maceration. Can. J. Bot.-Rev. Can. Bot. 1979, 57, 1332–1334. [Google Scholar]
  45. Pandey, S.; Ranade, S. A.; Nagar, P. K.; Kumar, N. Role of polynamines and ethylene as modulators of plant senescene. J. Biosci. 2000, 25, 291–299. [Google Scholar]
Figure 1. Spectral indices (modified simple ratio, mSR705; modified normalized difference index, mND705; plant senescence reflectance index, PSRI) plotted according to time (left) and total chlorophyll content (right) for P. tremuloides sun (ASU) and shade (ASH) leaves and P. balsamifera sun (PSU) and shade (PSH) leaves. Each symbol represents an average from three leaves.
Sensors 08 00051f1
Figure 2. Changes in total chlorophyll, chlorophyll a and b and chlorophyll a/b during senescence of P. tremuloides and P. balsamifera sun and shade leaves. Each symbol represents the mean ± 1 SD from three leaves, where chlorophyll content is based on regressions based on SPAD curves. Leaf drop occurred by day 288 for P. balsamifera and day 299 for P. tremuloides.
Sensors 08 00051f2
Figure 3. Mean palisade and spongy mesophyll thickness (± 1 SD) for mature P. tremuloides sun (ASU) and shade (ASH) leaves and P. balsamifera sun (PSU) and shade (PSH) leaves, based on measurements from August 8, 2003 thin sections (n=2-5).
Sensors 08 00051f3
Figure 4. Thin sections of mature (a) and senescing (b) P. tremuloides sun leaves.
Sensors 08 00051f4
Table 1. Comparison of anatomical features and near-infrared reflectance at 800.7 nm for mature and senescing P. tremuloides and P. balsamifera leaves.
VariableMature
(Total Chl>400mgm-2)
Senescing
(Total Chl<250mgm-2)
ASU (n=4)ASH (n=8)ASU (n=3)ASH
Total thickness (μm)88.43(1.42)68.09(7.09)84.73(16.52)NA
Thickness palisade (μm)49.35(2.61)31.02(4.76)48.13(12.24)NA
Thickness spongy (μm)29.90(0.58)27.19(3.47)26.88(4.88)NA
Intercellular space (%)28.35(4.00)37.06(5.94)41.28(10.97)NA
R800.756.07(6.87)54.46(4.06)52.63(3.27)NA
PSU (n=2)PSH (n=4)PSU (n=5)PSH (n=3)
Total thickness (μm)100.70(21.07)80.24(8.05)109.24(18.62)77.83(13.61)
Thickness palisade (μm)49.50(9.90)28.47(0.66)44.12(8.59)35.27(13.74)
Thickness spongy (μm)42.60(10.39)42.25(7.89)55.12(10.43)39.50(11.36)
Intercellular space (%)46.62(6.55)50.66(5.46)51.08(9.85)48.22(12.78)
R800.758.71(0.10)55.59(3.65)56.41(2.43)55.03(1.55)
Note: NA=not available. No ASH samples with total chlorophyll< 250 mg m-2 from the 2003 dataset were gathered. Rsubscript is reflectance at the indicated waveband. Sample sizes indicate number of thin sections used to compute means. For thickness, five measurements were made and averaged per thin section. P. tremuloides sun (ASU) and shade (ASH), P. balsamifera sun (PSU) and shade (PSH).
Table 2. Correlation coefficients (r) for relationships between spectral vegetation indices and leaf chlorophyll content (2003 data)
Leaf typeIndexChl aChl bChl a/bTotal Chl
ASUmSR7050.919**0.961**0.711*0.930**
mND7050.925**0.910**0.790**0.929**
ASHmSR7050.985**0.982**0.971**0.985**
mND7050.980**0.981**0.981**0.980**
PSUmSR7050.992**0.990**0.911**0.992**
mND7050.982**0.985**0.962**0.982**
PSHmSR7050.974**0.960**0.859**0.972**
mND7050.982**0.977**0.908**0.982**
Note.
*P≤0.05;
**P≤0.01.
P. tremuloides sun (ASU) and shade (ASH), P. balsamifera sun (PSU) and shade (PSH).

