Selectivity Enhancement in Multisensor Systems Using Flow Modulation Techniques


 , ,
, ,
Abstract
:1. Introduction
2. Experimental
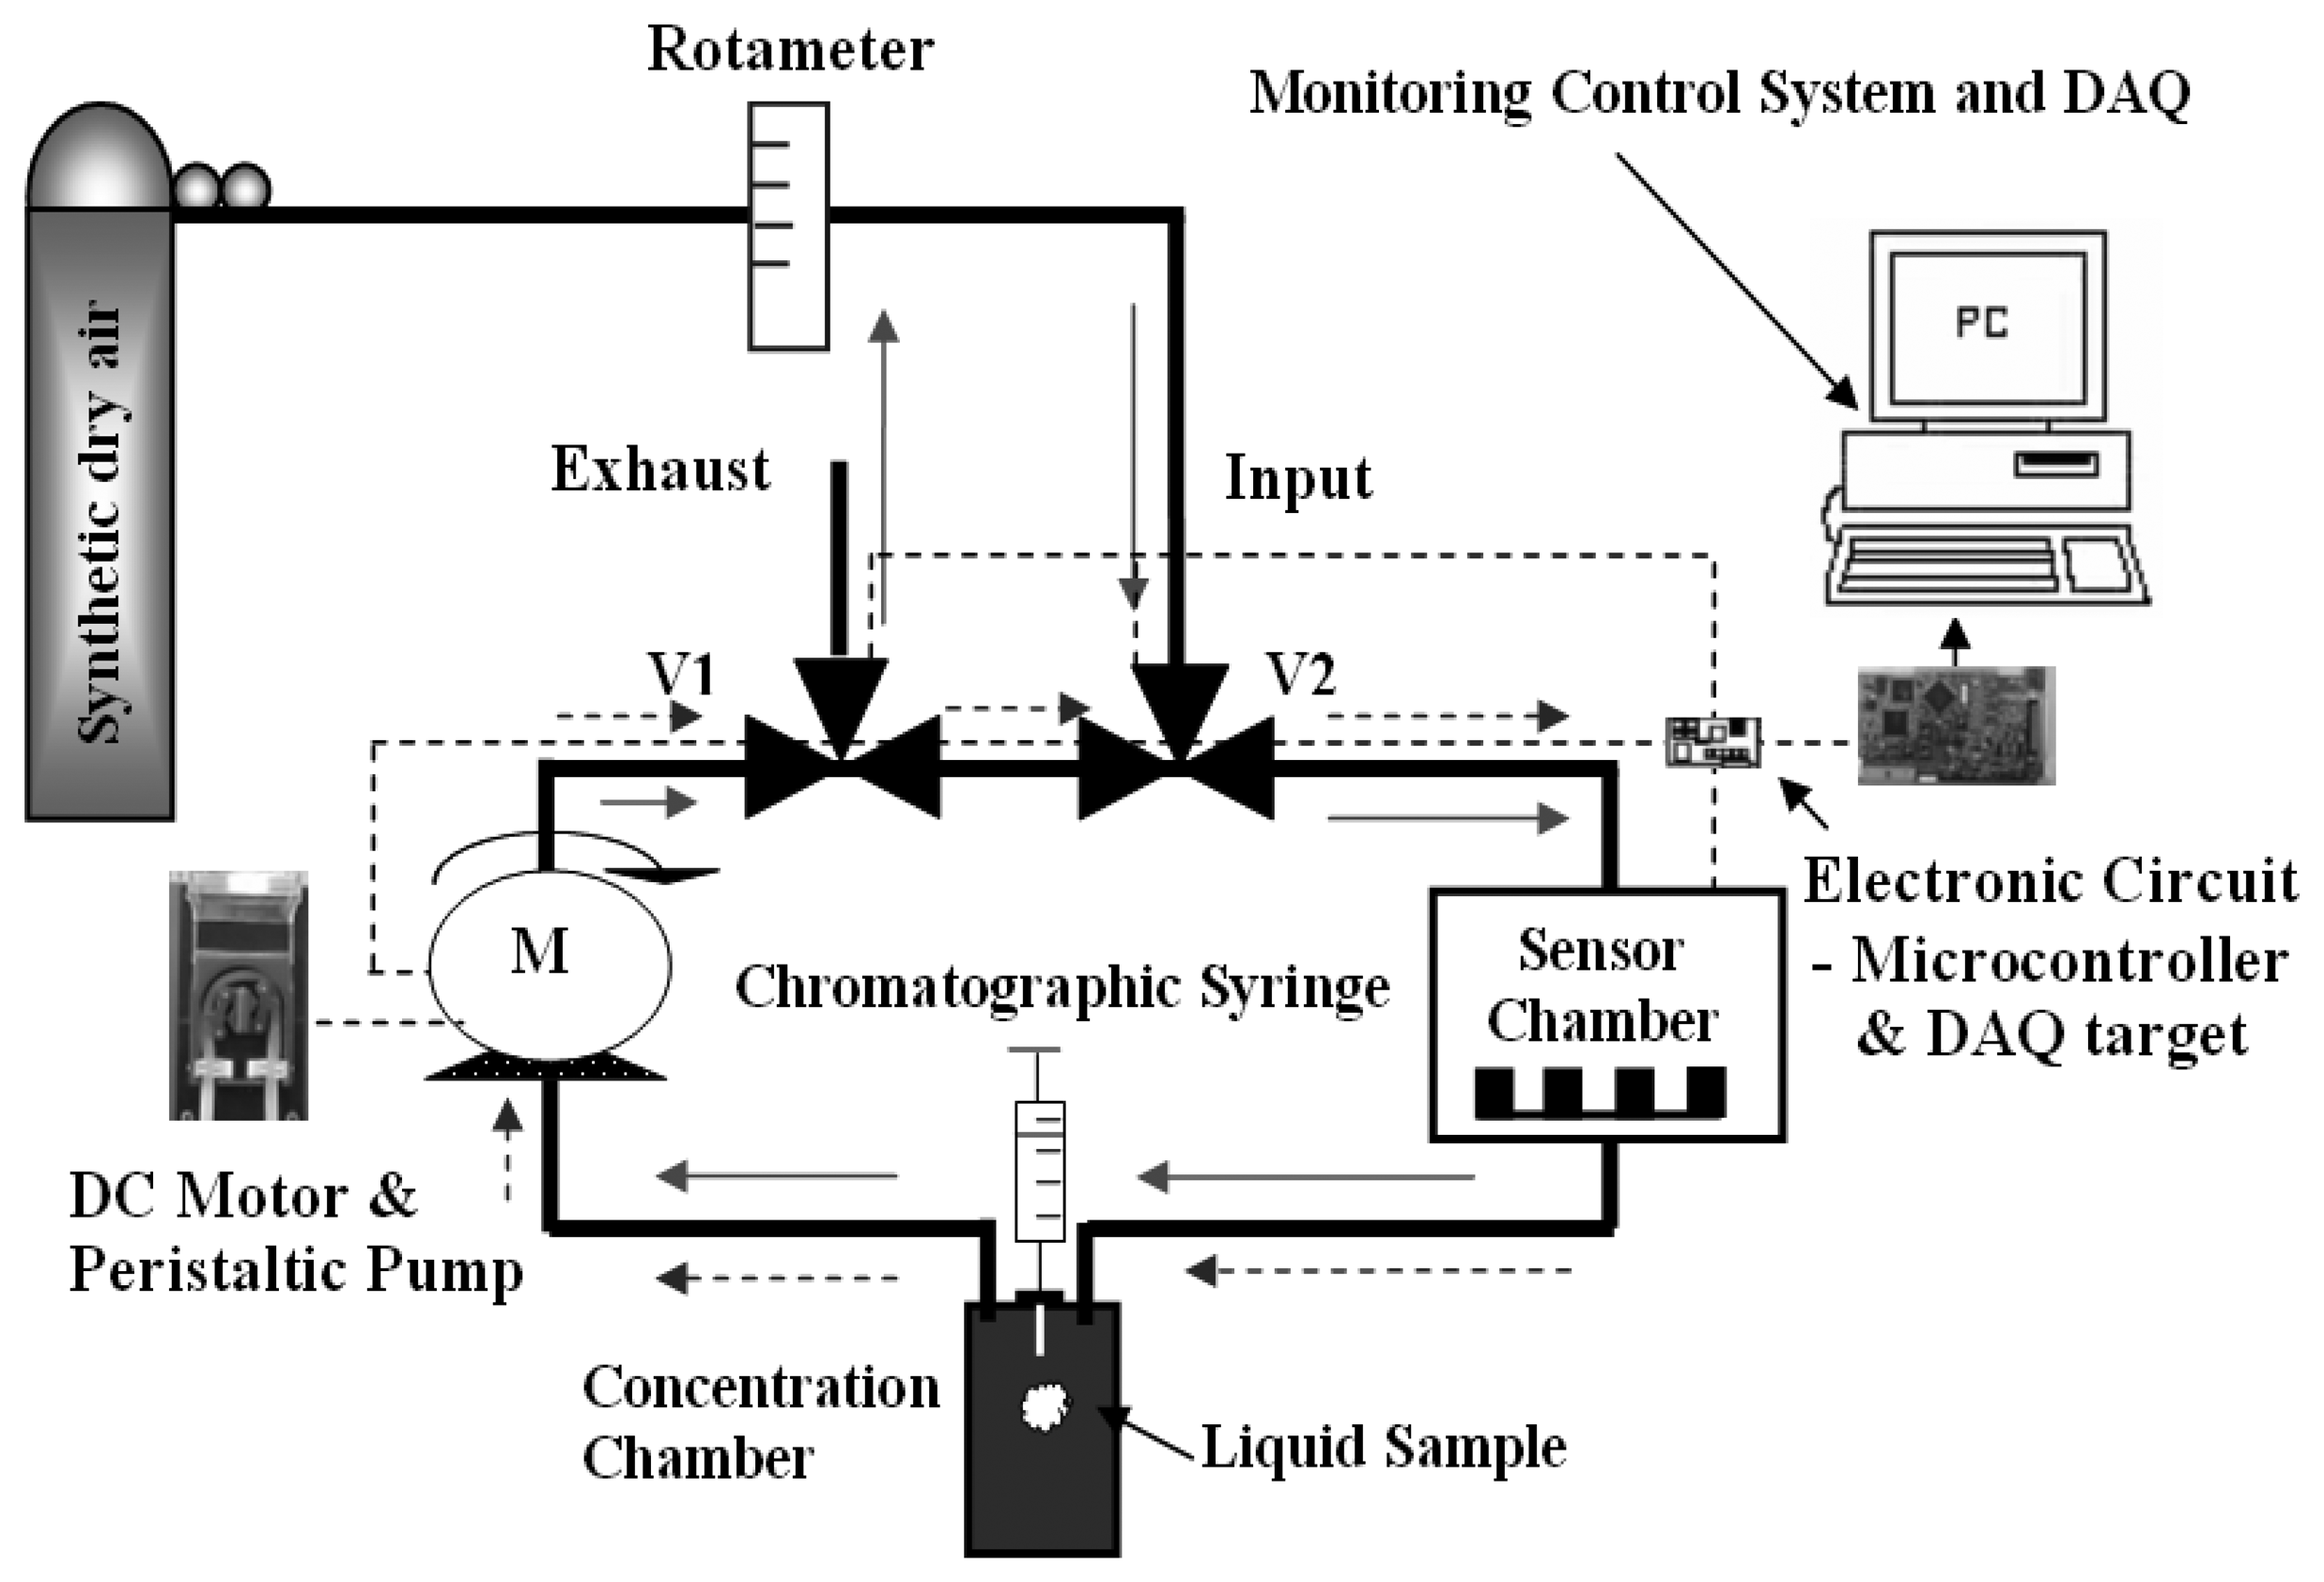
2.1 Set-up
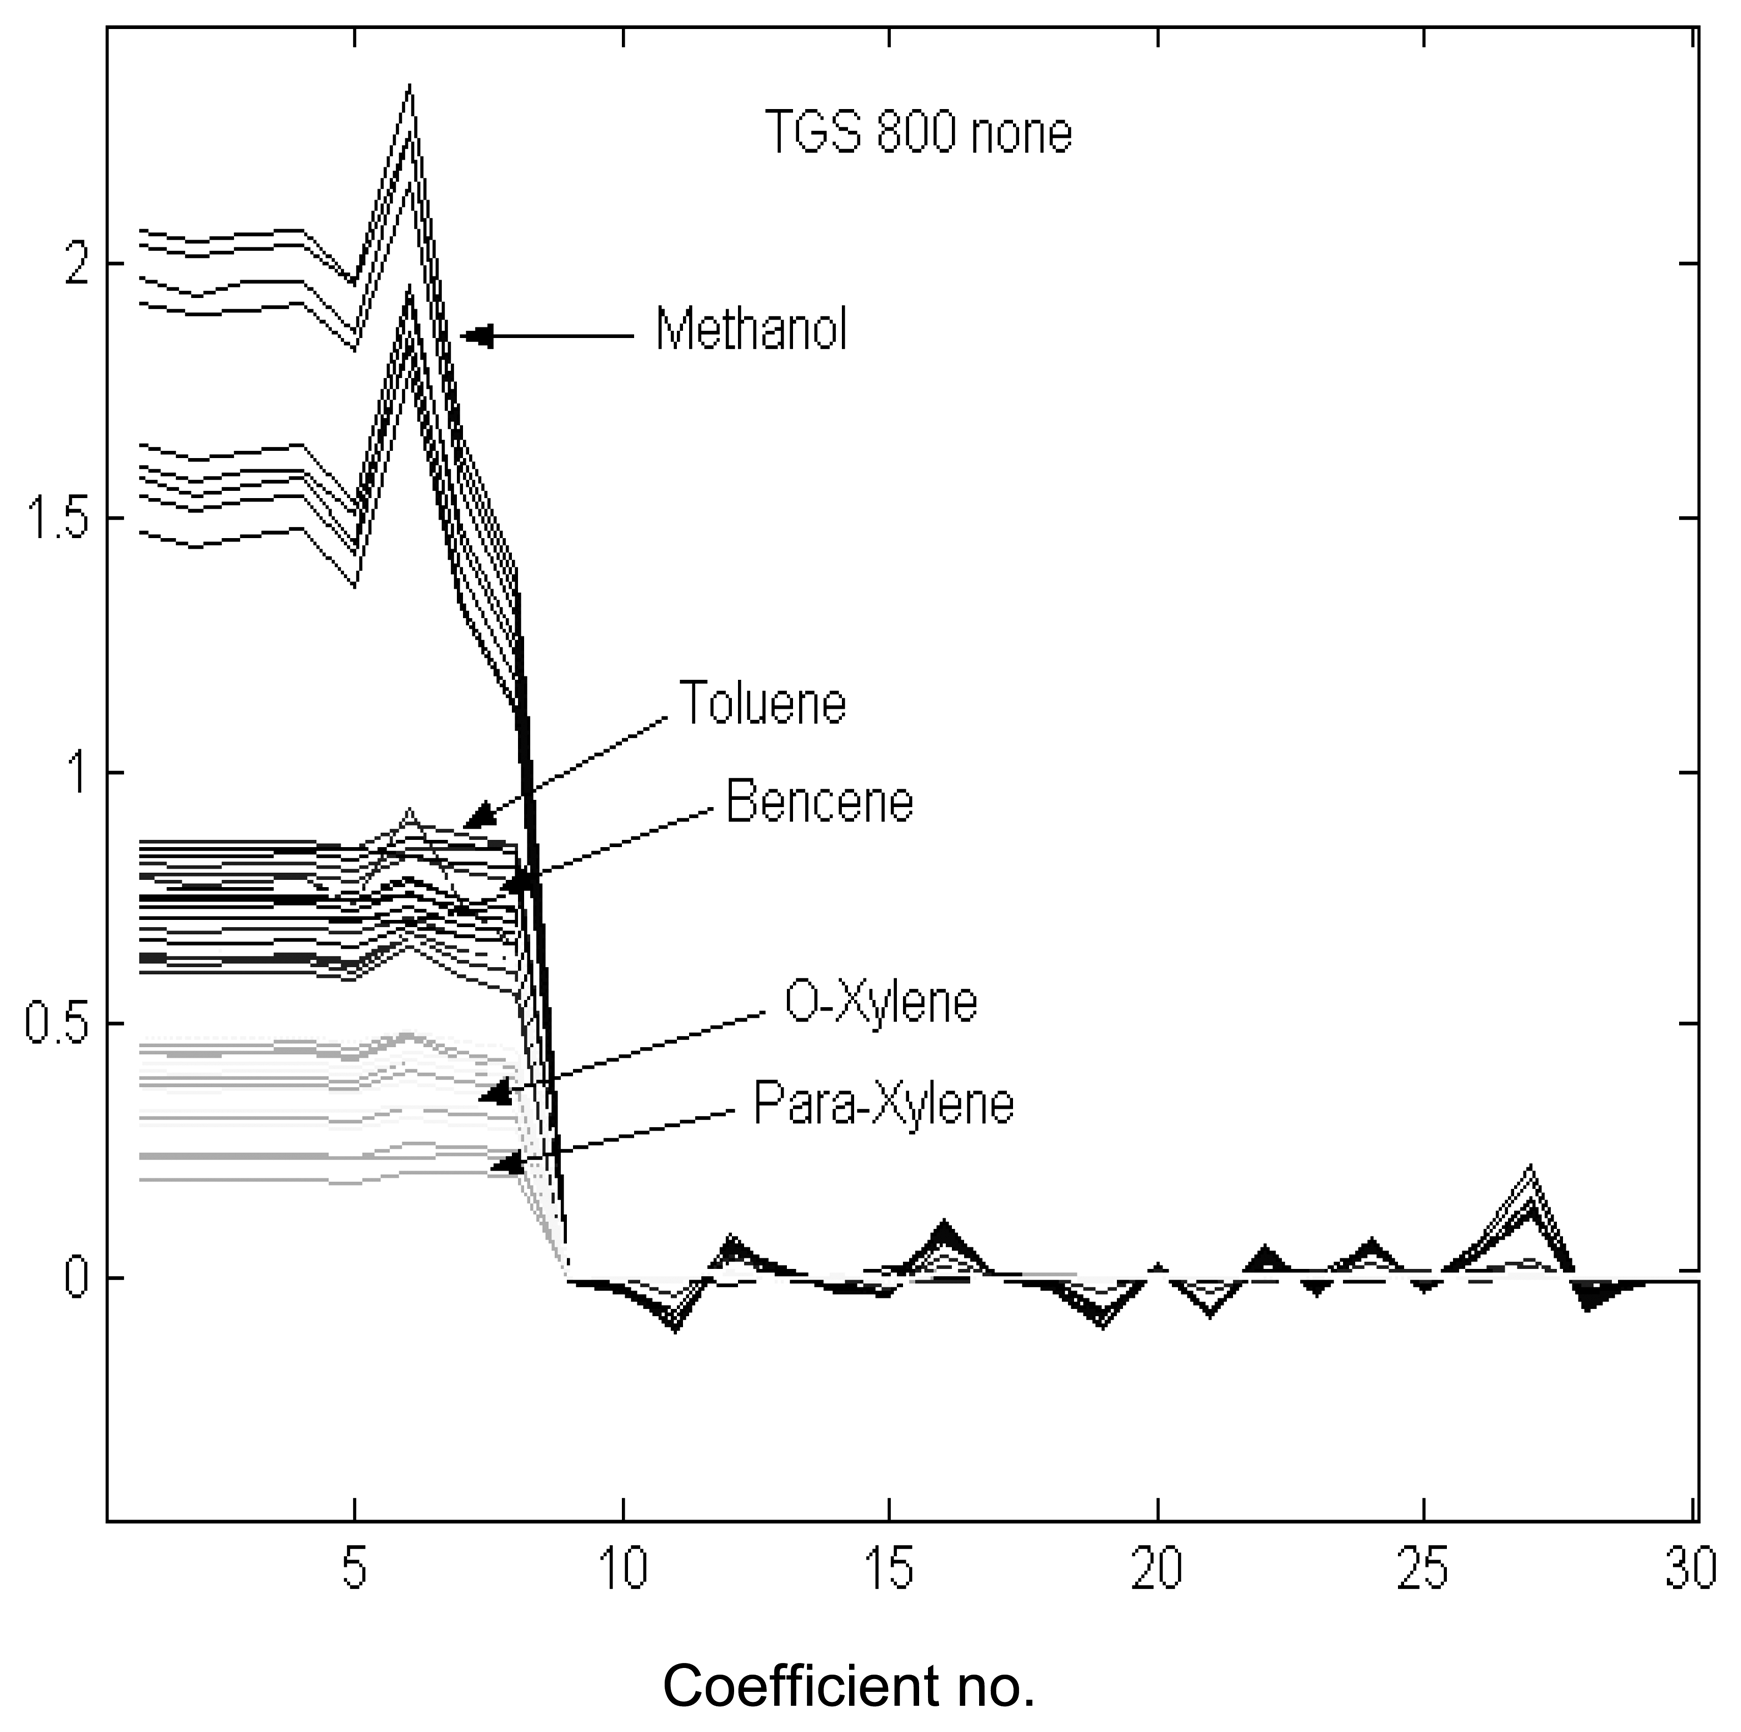
2.2 Databases, Feature Extraction and Processing
3. Results and Discussion
3.1 Volatile Identification and Quantification Using the Steady-state Sensor Response
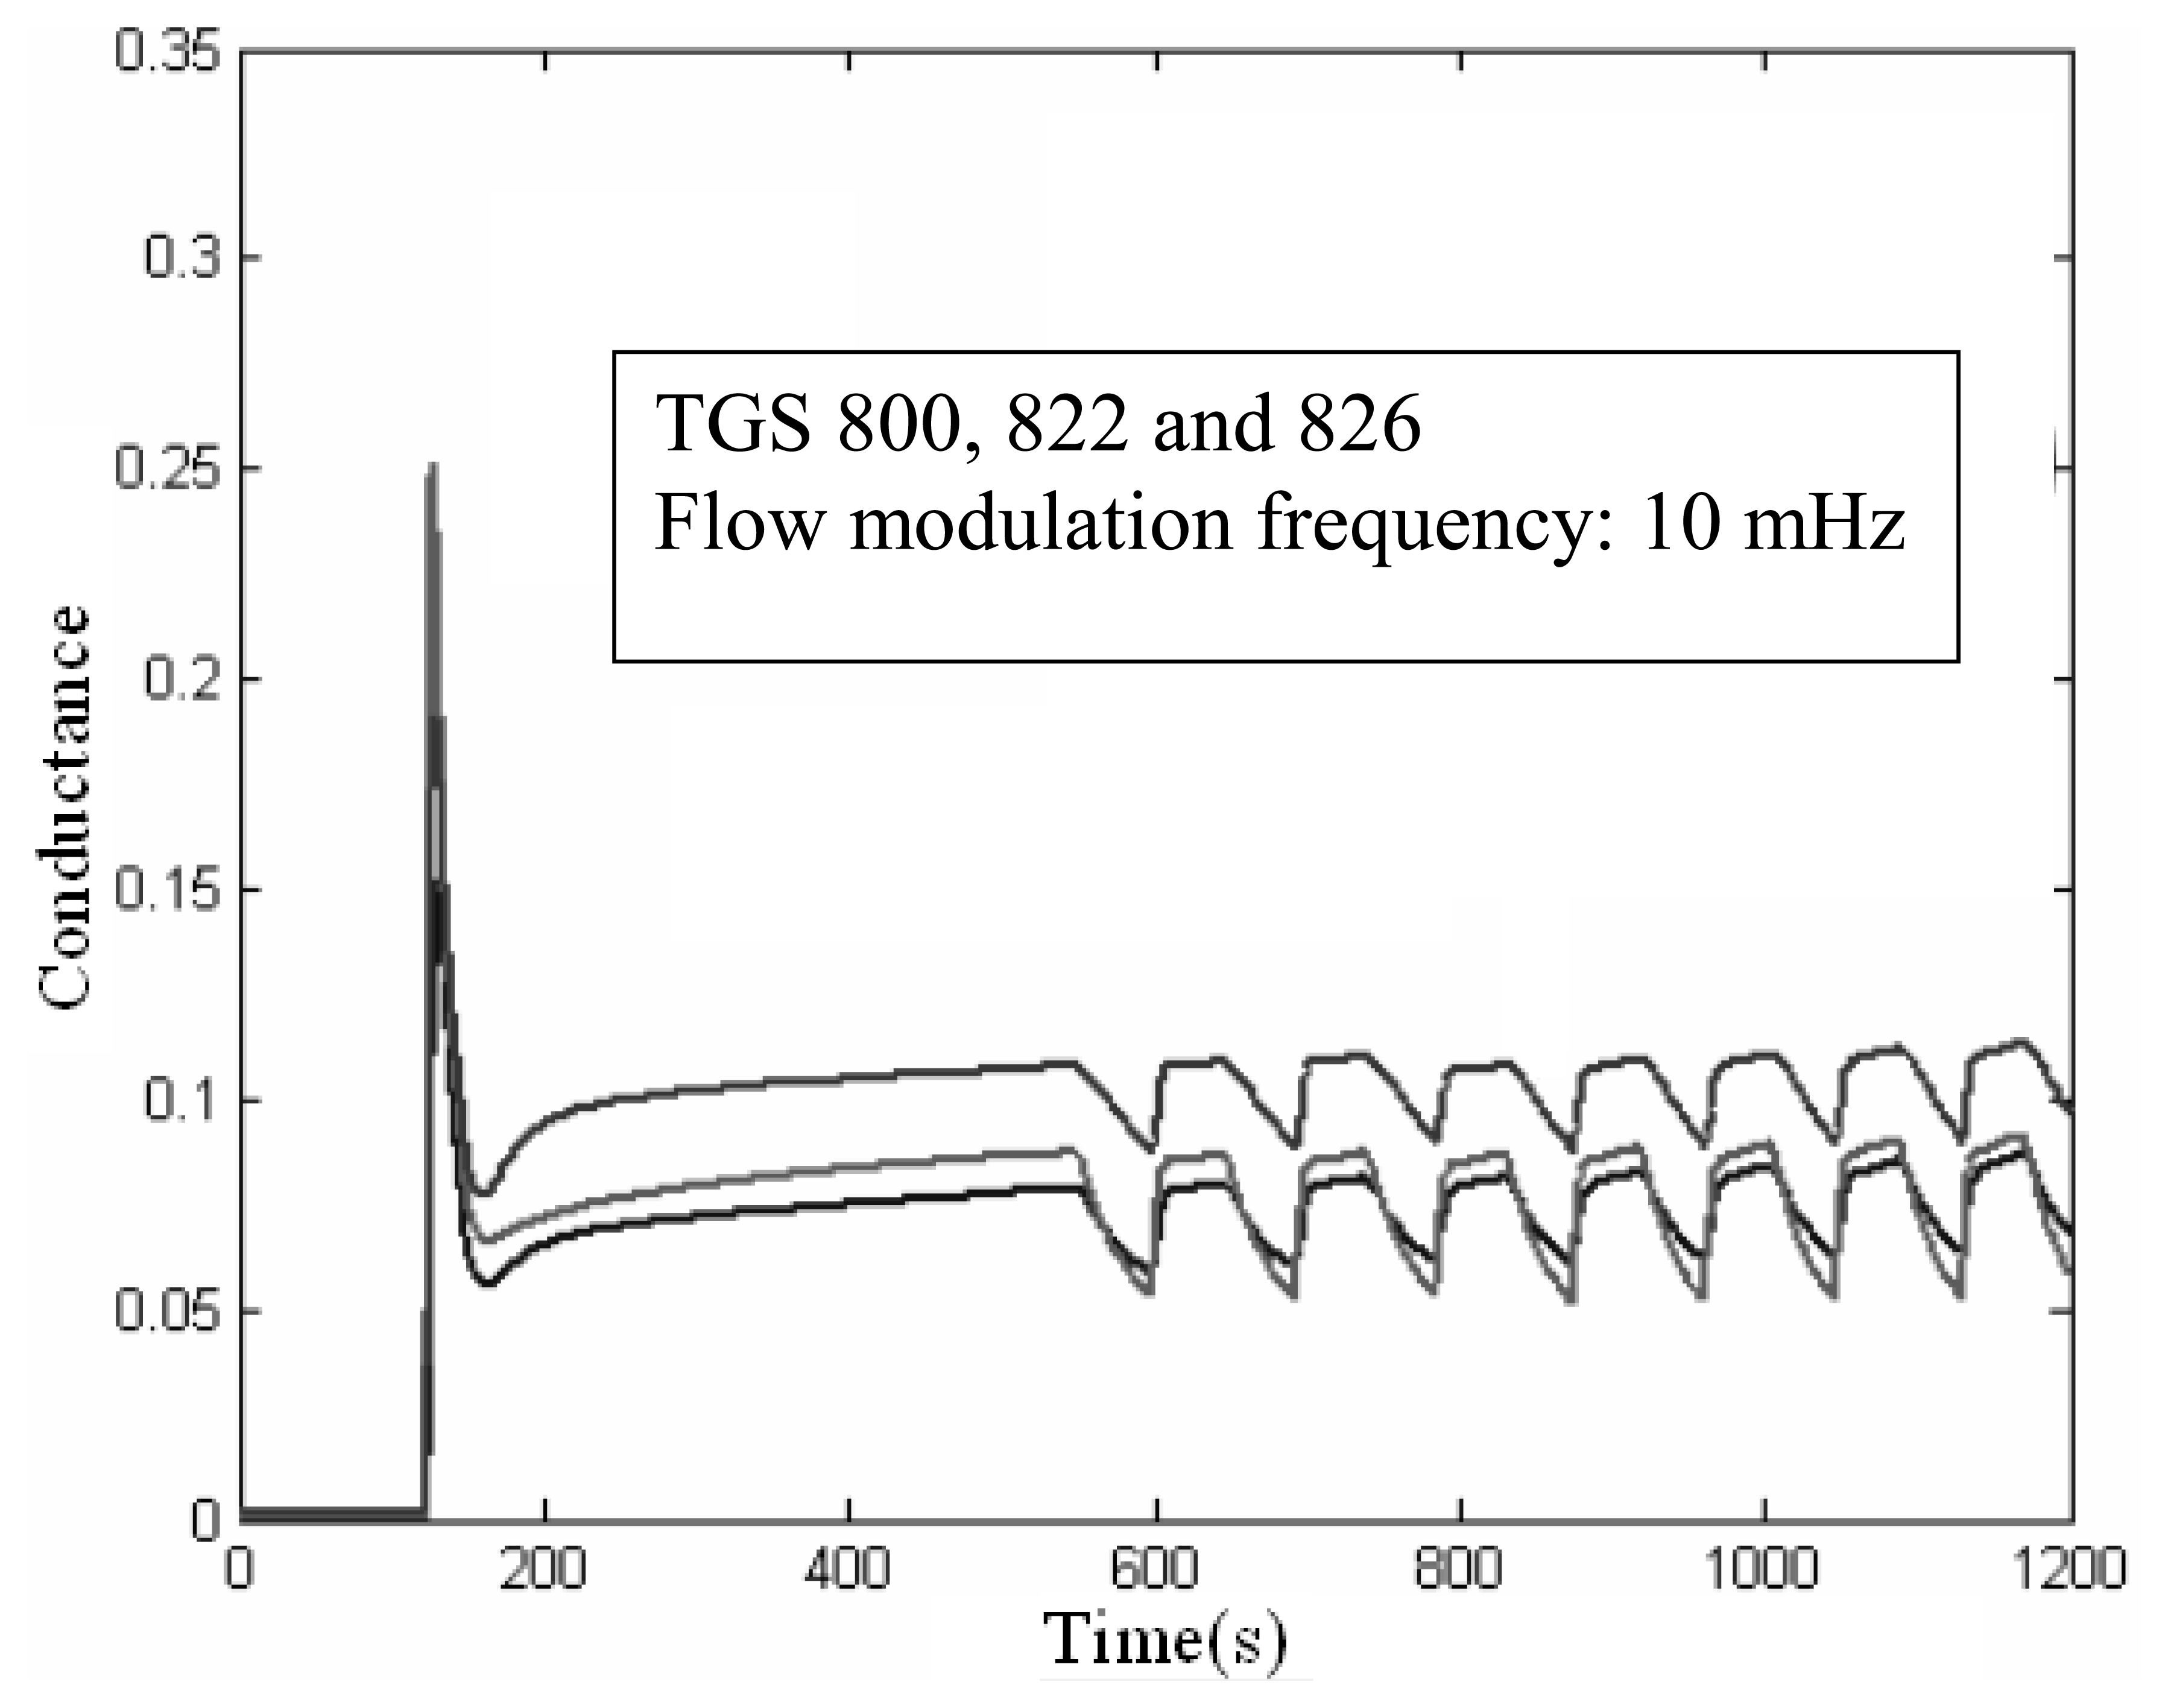
3.2 Volatile Identification and Quantification Using Flow Modulation
4. Conclusions
Acknowledgments
References
- Sears, W.M.; Colbow, K.; Consadori, F. General characteristics of thermally cycled tin oxide gas sensors. Semicond. Sci. Technol. 1989, 4, 351–359. [Google Scholar]
- Sears, W.M.; Colbow, K.; Consadori, F. Algorithms to improve the selectivity of thermally cycled tin oxide gas sensors. Sens. Actuat. 1989, 19, 333–349. [Google Scholar]
- Nakata, S.; Kaneda, Y.; Nakamura, H.; Yoshikawa, K. Detection and quantification of CO gas based on the dynamic response of a ceramic sensor. Chem. Lett. 1991, 20, 1505–1508. [Google Scholar]
- Nakata, S.; Nakamura, H.; Yoshikawa, K. New strategy for the development of a gas sensor based on the dynamic characteristics: principle and preliminary experiment. Sens. Actuat. 1992, 8, 187–189. [Google Scholar]
- Nakata, S.; Akakabe, S.; Nakasuji, M.; Yoshikawa, K. Gas sensing based on a nonlinear response: discrimination between hydrocarbons and quantification of individual components in a gas mixture. Anal. Chem. 1996, 68, 2067–2072. [Google Scholar]
- Cavicchi, R.E.; Suehle, J.S.; Kreider, K.G.; Gaitan, M.; Chaparala, P. Fast temperature programmed sensing for micro-hotplate gas sensors. Elect. Dev. Lett. 1995, 16, 286–288. [Google Scholar]
- Llobet, E.; Ionescu, R.; Al-Khalifa, S.; Brezmes, J.; Vilanova, X.; Correig, X.; Bârsan, N.; Gardner, J.W. Multicomponent gas mixture analysis using a single tin oxide sensor and dynamic pattern recognition. IEEE Sens. J. 2001, 1, 207–213. [Google Scholar]
- Llobet, E.; Brezmes, J.; Ionescu, R.; Vilanova, X.; Al-Khalifa, S.; Gardner, J.W.; Bârsan, N.; Correig, X. Wavelet transform fuzzy ARTMAP based pattern recognition for fast gas identification using a micro-hotplate gas sensor. Sensor. Actuat. 2002, 83, 238–244. [Google Scholar]
- Auerbach, F. Pattern Recognition Using Gasmodulation. Techn. Dig. Transduc. 1995, 1, 791–794. [Google Scholar]
- Llobet, E.; Vilanova, X.; Brezmes, J.; Sueiras, J.E.; Correig, X. Transient response of thick-film tin oxide gas sensors to multicomponent gas mixtures. Sensor. Actuat. 1998, 47, 104–112. [Google Scholar]
- Llobet, E.; Vilanova, X.; Brezmes, J.; Alcubilla, R.; Calderer, J.; Sueiras, J.E.; Correig, X. Conductance-transient analysis of thick-film tin oxide gas sensors under successive gas-injection steps. Meas. Sci. Technol. 1997, 8, 1133–1138. [Google Scholar]
- Llobet, E.; Ionescu, R. Wavelet Transform based fast feature extraction from temperature modulated semiconductor gas sensors. Sens. Actuat. 2002, 81, 289–295. [Google Scholar]
- Al-Khalifa, S.; Maldonado-Bascón, S.; Gardner, J.W. Identification of CO and NO2 using a thermally resistive microsensor and support vector machine. IEEE Proc. Sci. Meas. Technol. 2003, 150, 11–14. [Google Scholar]
- Distante, C.; Ancona, N.; Siciliano, P. Support vector machines for olfactory signals recognition. Sens. Actuat. 2003, 88, 30–39. [Google Scholar]
- Pardo, M.; Sberveglieri, G. Classification of electronic nose data with support vector machines. Sens. Actuat. 2005, 107, 730–737. [Google Scholar]
- Gualdrón, O.; Brezmes, J.; Llobet, E.; Amari, A.; Vilanova, X.; Bouchikhi, B.; Correig, X. Variable selection for support vector machine based multisensor systems. Sens. Actuat. 2007, 122, 259–268. [Google Scholar]
- Hsu, C.W.; Lin, C.J. A comparison of methods for multiclass support vector machines. IEEE Trans. Neural Network. 2002, 13, 415–425. [Google Scholar]


| Pre-processing | TGS 800 | TGS 822 | TGS 826 | All sensors |
|---|---|---|---|---|
| None | 54.2 C = 10 | 57.7 C = 102 | 30.8 C = 10 | 82.3 C = 10 |
| Mean-centring | 49.9 C = 102 | 57.7 C = 102 | 29.2 C = 10 | 87.1 C = 103 |
| Auto scaling | 53.3 C = 103 | 57.7 C = 103 | 23.1 C = 102 | 84.4 C = 103 |
| Pre-processing | TGS 800 | TGS 822 | TGS 826 | All sensors |
|---|---|---|---|---|
| None | 2.2 C = 10 | 8.6 C = 10 | 10.9 C = 103 | 37.7 C = 10 |
| Mean-centring | 13.3 C = 103 | 24.0 C = 103 | 11.3 C = 103 | 53.8 C = 10 |
| Auto scaling | 13.4 C = 103 | 19.1 C = 103 | 11.1 C = 104 | 42.6 C = 10 |
| Frequency | Pre-processing | TGS 800 | TGS 822 | TGS 826 | All sensors |
|---|---|---|---|---|---|
| 10 mHz | None | 86.7 C = 10 | 95.1 C = 10 | 97.7 C = 10 | 84.4 C = 10 |
| Mean-centring | 79.2 C = 102 | 88.3 C = 10 | 84.4 C = 103 | 82.2 C = 10 | |
| Auto scaling | 82.2 C = 10 | 90.6 C = 10 | 90.6 C = 103 | 88.9 C = 10 | |
| 20 mHz | None | 92.9 C = 10 | 97.0 C = 10 | 97.5 C = 10 | 99.7 C = 10 |
| Mean-centring | 93.3 C = 102 | 91.1 C = 10 | 97.8 C = 102 | 100 C = 10 | |
| Auto scaling | 88.3 C = 104 | 97.0 C = 102 | 100 C = 102 | 100 C = 10 | |
| 30 mHz | None | 91.1 C = 10 | 95.6 C = 102 | 95.6 C = 10 | 97.8 C = 10 |
| Mean-centring | 97.4 C = 10 | 95.9 C = 102 | 99.7 C = 102 | 100 C = 102 | |
| Auto scaling | 95.6 C = 102 | 88.6 C = 102 | 95.4 C = 102 | 97.8 C = 102 | |
| 40 mHz | None | 90.6 C = 10 | 88.3 C = 10 | 79.2 C = 10 | 93.3 C = 10 |
| Mean-centring | 74.7 C = 10 | 83.7 C = 10 | 83.1 C = 104 | 95.6 C = 10 | |
| Auto scaling | 83.7 C = 104 | 86.5 C = 104 | 75.2 C = 102 | 93.3 C = 10 | |
| 60 mHz | None | 83.1 C = 10 | 87.6 C = 10 | 92.8 C = 10 | 88.9 C = 10 |
| Mean-centring | 78.3 C = 102 | 73.8 C = 104 | 85.3 C = 102 | 84.4 C = 102 | |
| Auto scaling | 72.4 C = 105 | 76.8 C = 105 | 79.2 C = 105 | 84.4 C = 102 | |
| 80 mHz | None | 70.2 C = 10 | 91.1 C = 10 | 83.7 C = 102 | 97.7 C = 10 |
| Mean-centring | 70.5 C = 102 | 80.0 C = 10 | 84.4 C = 102 | 95.5 C = 10 | |
| Auto scaling | 53.3 C = 10 | 88.9 C = 102 | 78.1 C = 103 | 97.7 C = 10 | |
| Frequency | Pre-processing | TGS 800 | TGS 822 | TGS 826 | All sensors |
|---|---|---|---|---|---|
| 10 mHz | None | 64.5 C = 10 | 42.6 C = 10 | 61.8 C = 10 | 56.2 C = 10 |
| Mean-centring | 60.9 C = 10 | 58.6 C = 10 | 60.0 C = 10 | 70.5 C = 10 | |
| Auto scaling | 68.9 C = 102 | 62.2 C = 102 | 51.4 C = 102 | 59.8 C = 10 | |
| 20 mHz | None | 48.4 C = 10 | 55.0 C = 10 | 67.8 C = 10 | 45.2 C = 10 |
| Mean-centring | 60.9 C = 102 | 49.0 C = 102 | 72.4 C = 102 | 64.4 C = 102 | |
| Auto scaling | 54.1 C = 102 | 57.5 C = 102 | 86.1 C = 102 | 78.4 C = 10 | |
| 30 mHz | None | 72.4 C = 10 | 69.2 C = 10 | 81.6 C = 10 | 70.0 C = 10 |
| Mean-centring | 73.8 C = 10 | 57.3 C = 10 | 72.4 C = 102 | 77.8 C = 10 | |
| Auto scaling | 72.4 C = 102 | 66.5 C = 102 | 60.9 C = 102 | 88.9 C =10 | |
| 40 mHz | None | 45.9 C = 10 | 66.8 C = 10 | 57.5 C = 10 | 50.5 C = 10 |
| Mean-centring | 46.7 C = 102 | 44.2 C = 102 | 65.7 C = 102 | 62.1 C = 102 | |
| Auto scaling | 52.8 C = 102 | 50.9 C = 102 | 55.2 C = 102 | 65.7 C = 102 | |
| 60 mHz | None | 53.8 C = 10 | 65.7 C = 10 | 67.0 C = 10 | 56.5 C = 10 |
| Mean-centring | 67.0 C = 102 | 40.6 C = 102 | 65.6 C = 10 | 65.6 C = 102 | |
| Auto scaling | 44.2 C = 102 | 44.2 C = 102 | 59.8 C = 106 | 72.4 C = 10 | |
| 80 mHz | None | 49.0 C = 10 | 67.8 C = 10 | 57.5 C = 10 | 70.1 C = 10 |
| Mean-centring | 59.7 C = 102 | 68.9 C = 102 | 62.2 C = 102 | 75.5 C = 10 | |
| Auto scaling | 44.3 C = 10 | 57.1 C = 102 | 52.8 C = 102 | 82.2 C = 10 | |
© 2008 by the authors; licensee Molecular Diversity Preservation International, Basel, Switzerland. This article is an open-access article distributed under the terms and conditions of the Creative Commons Attribution license (http://creativecommons.org/licenses/by/3.0/).
Share and Cite
El Barbri, N.; Duran, C.; Brezmes, J.; Cañellas, N.; Ramírez, J.L.; Bouchikhi, B.; Llobet, E. Selectivity Enhancement in Multisensor Systems Using Flow Modulation Techniques. Sensors 2008, 8, 7369-7379. https://doi.org/10.3390/s8117369
El Barbri N, Duran C, Brezmes J, Cañellas N, Ramírez JL, Bouchikhi B, Llobet E. Selectivity Enhancement in Multisensor Systems Using Flow Modulation Techniques. Sensors. 2008; 8(11):7369-7379. https://doi.org/10.3390/s8117369
Chicago/Turabian StyleEl Barbri, Noureddine, Cristhian Duran, Jesús Brezmes, Nicolau Cañellas, José Luis Ramírez, Benachir Bouchikhi, and Eduard Llobet. 2008. "Selectivity Enhancement in Multisensor Systems Using Flow Modulation Techniques" Sensors 8, no. 11: 7369-7379. https://doi.org/10.3390/s8117369