Fine Resolution Air Quality Monitoring from a Small Satellite: CHRIS/PROBA

Abstract
:1. Introduction
2. Images
3. Methodology
3.1. Image pre-processing
3.2. Estimation of Surface Reflectance (Lsurf)
- where TOA490 =reflectance at TOA
- ρ490 =reflectance by Aerosol scattering
- T0 · TS =downward and upward transmittance
- Lsurf490 =surface reflectance
- S = hemispheric albedo
3.3. Validation
- (i)
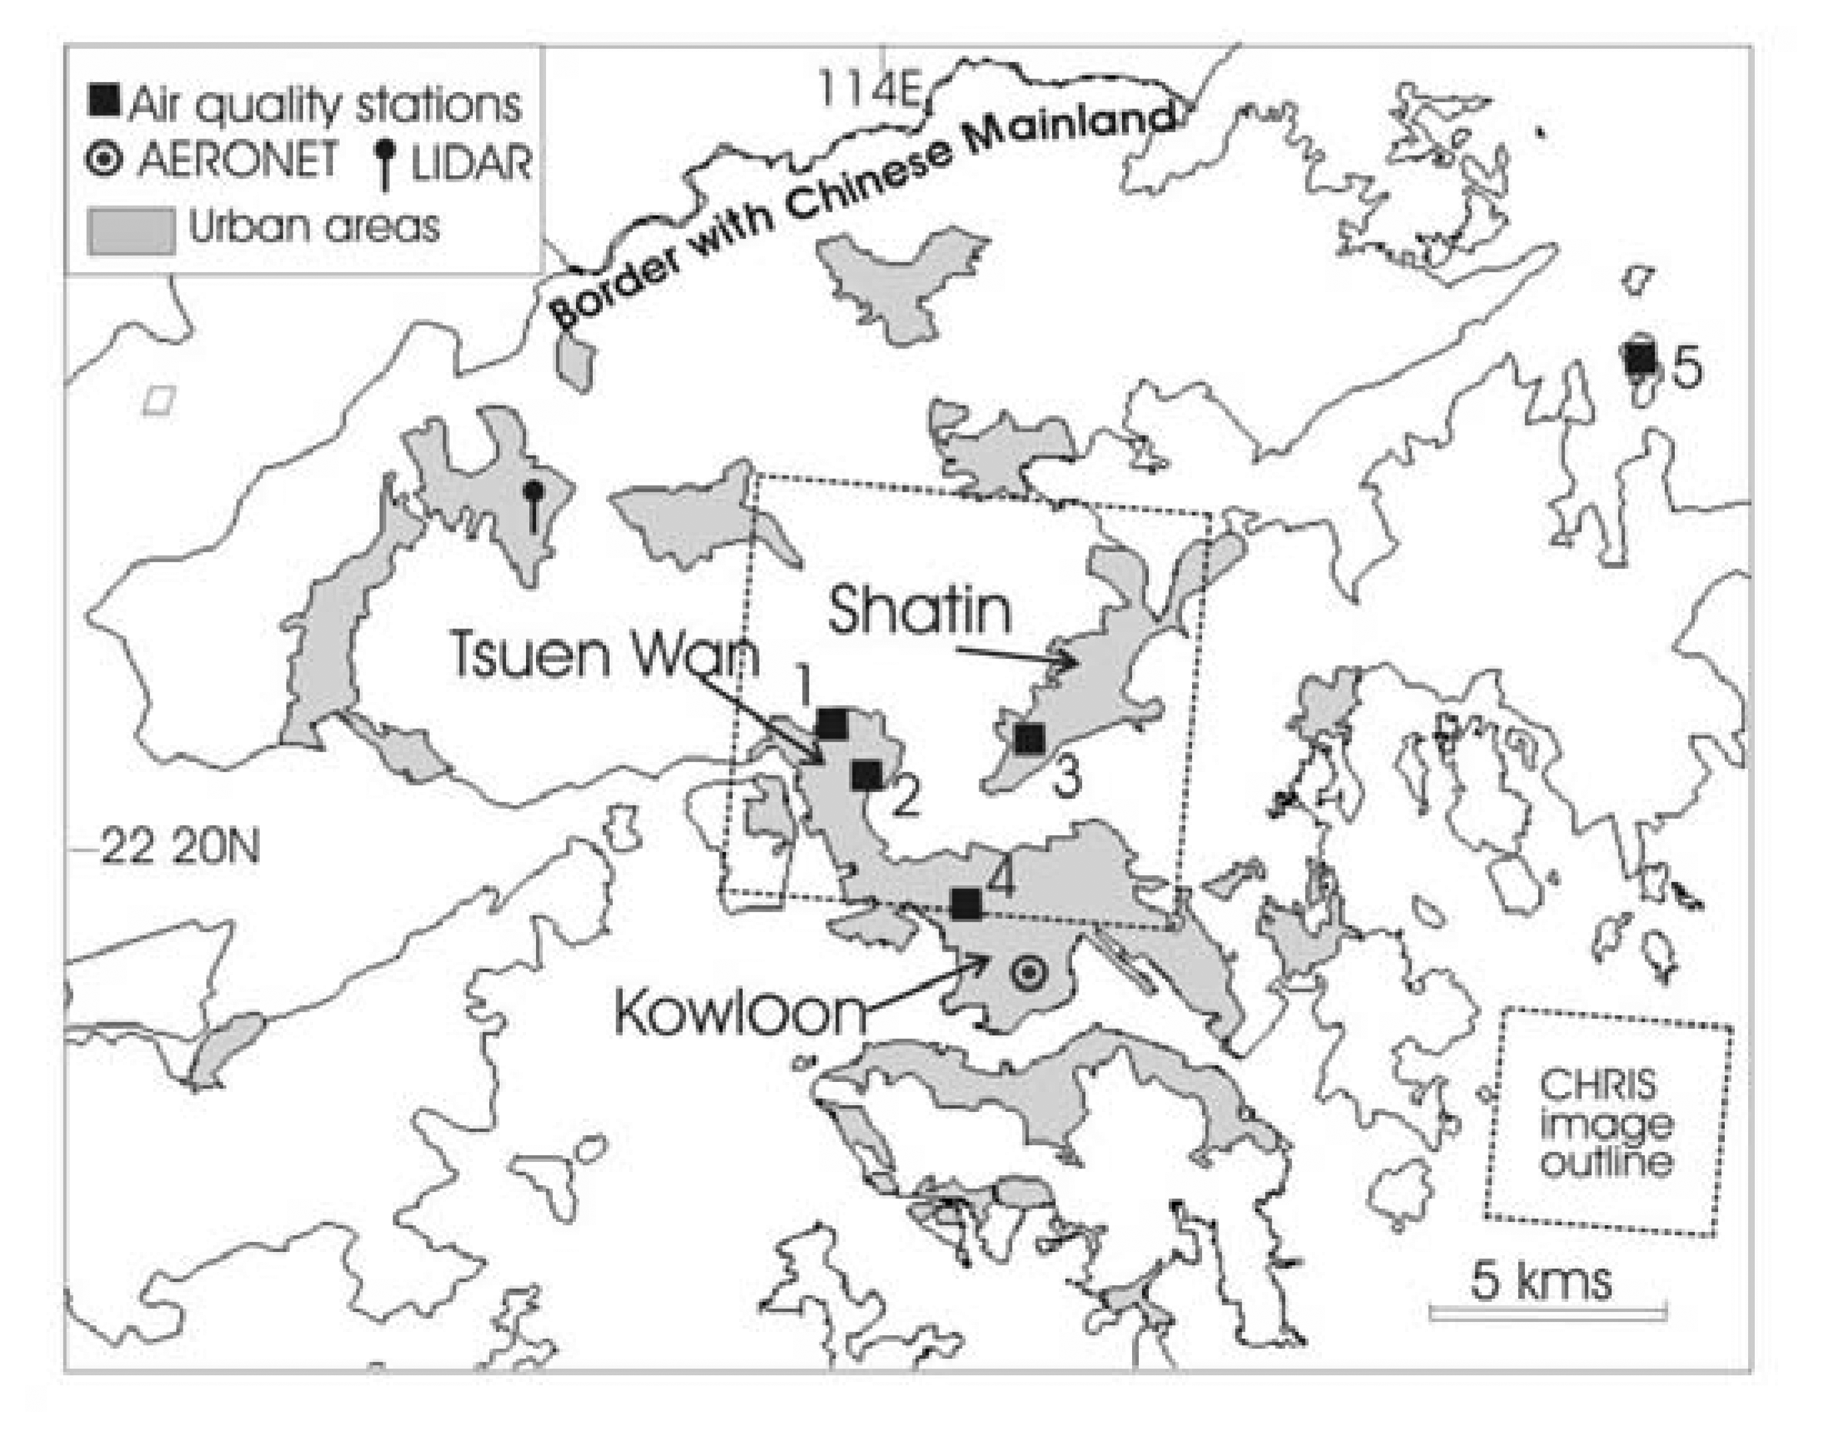
- comparison of AOT values with sunphotometer data from the AERONET station and two handheld Microtops II sunphotometers [23] deployed in rural forest and an urban forest island at the image time. (The rural forest training areas were located in lowland areas and at least 100 m from the urban edge to avoid the adjacency effect from bright urban surfaces). Since the objective of the study is to detect detailed spatial variation, and with the AERONET site located 1.5 km beyond the image area, the AERONET values are only used as an approximate reference. AERONET values were interpolated to correspond with the CHRIS bands
- (ii)
- comparison with four air quality stations within the image area, and
- (iii)
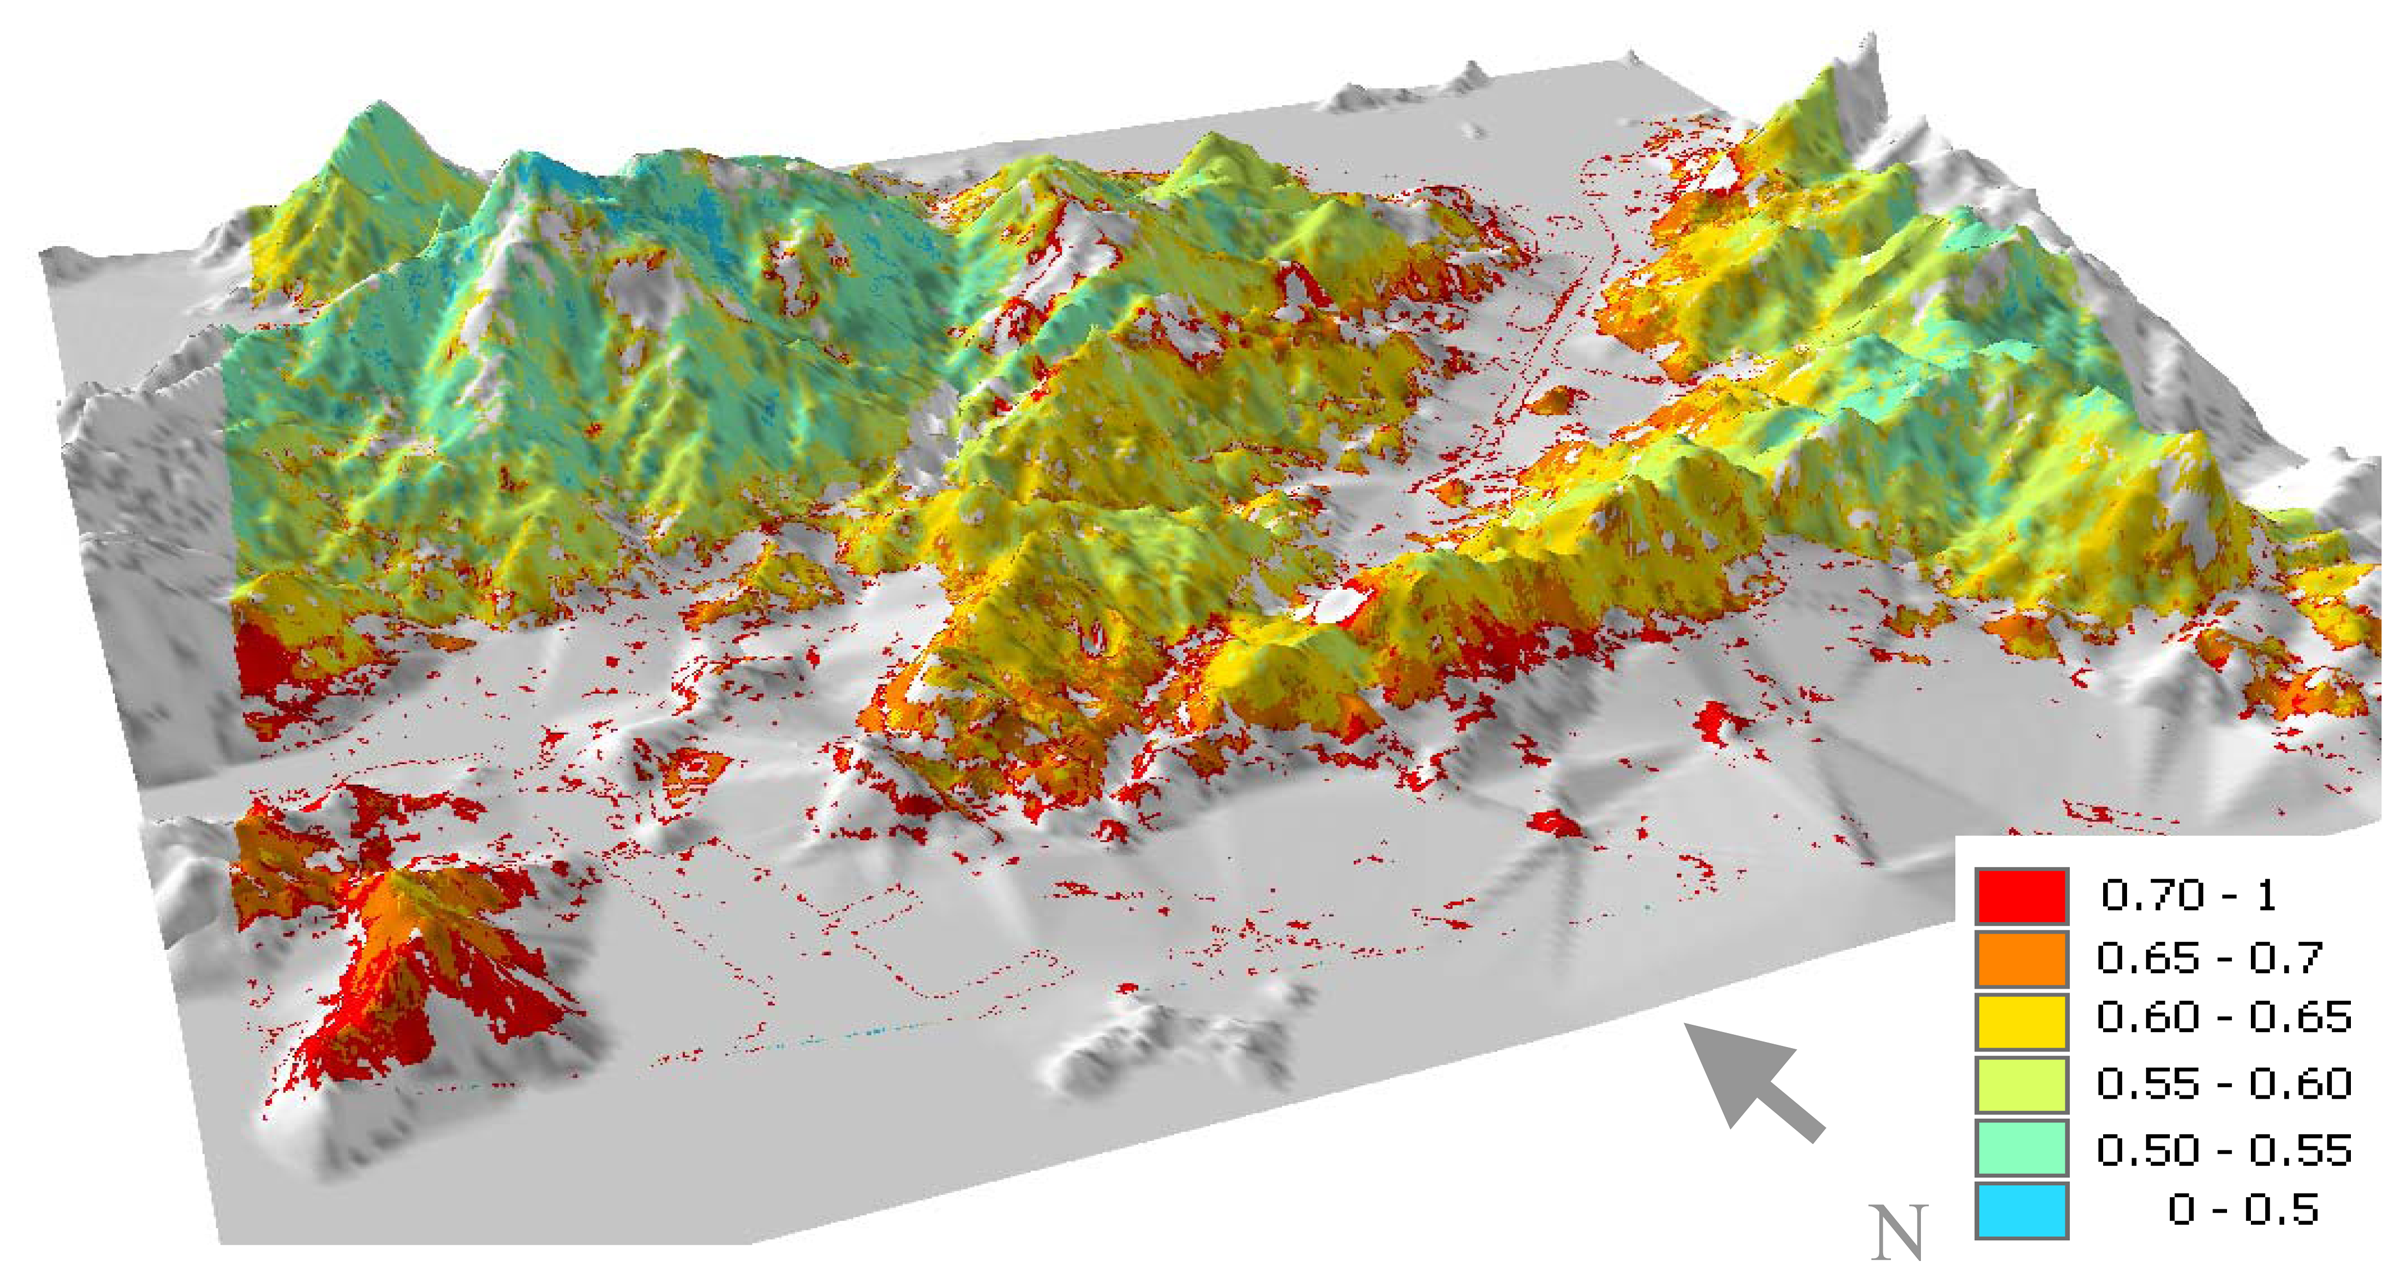
- visual interpretation using a Digital Elevation Model (DEM).
4. Results
4.1. Comparison with ground sunphotometers
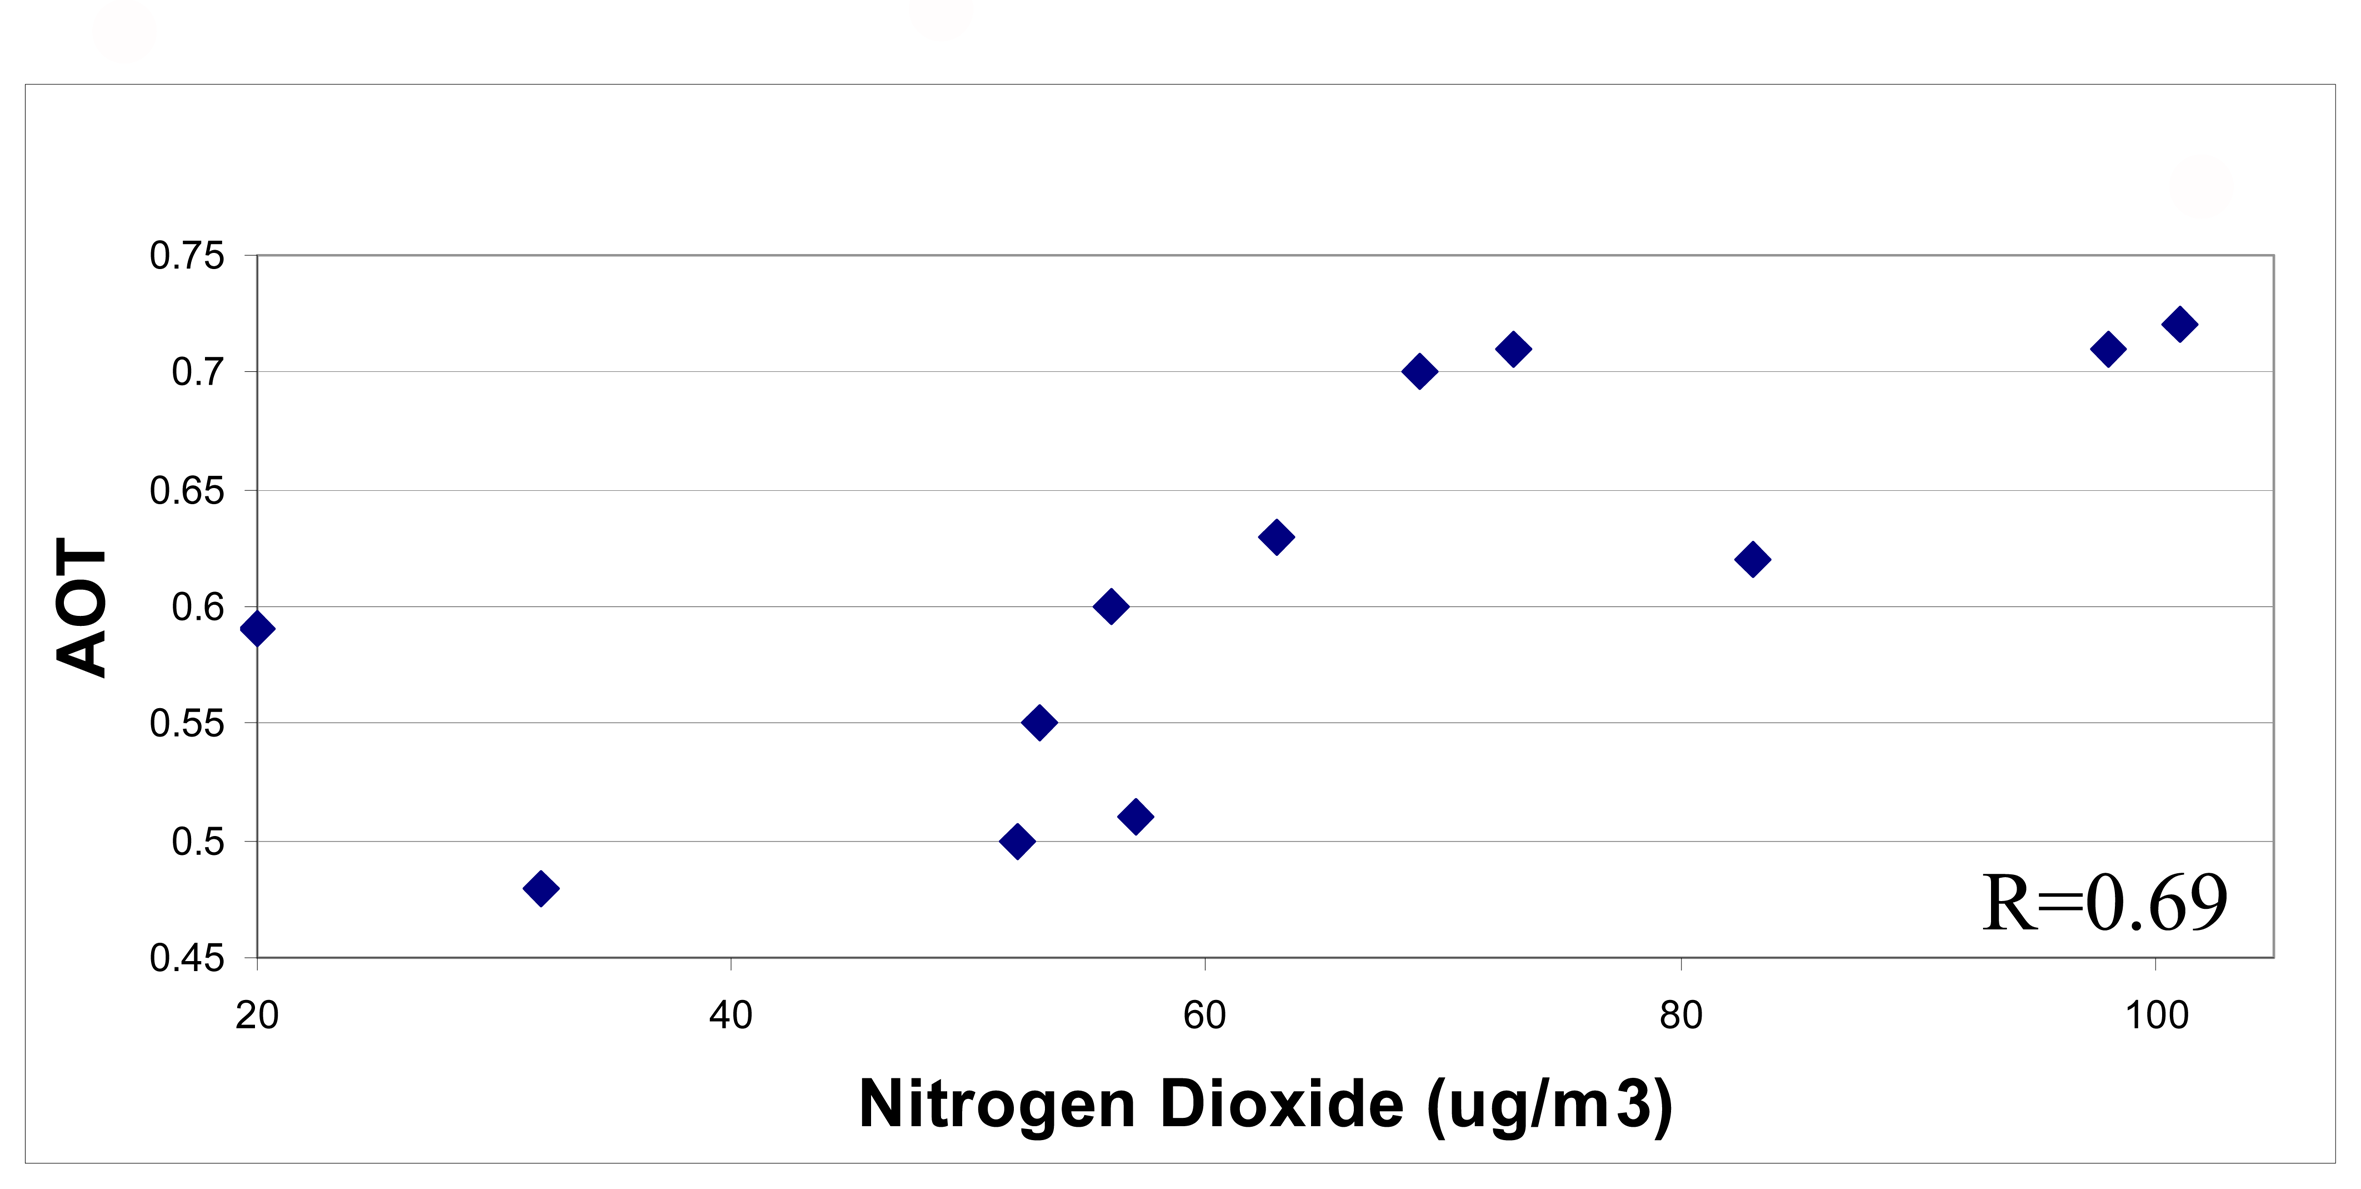
4.2. Comparison with ground air pollution data
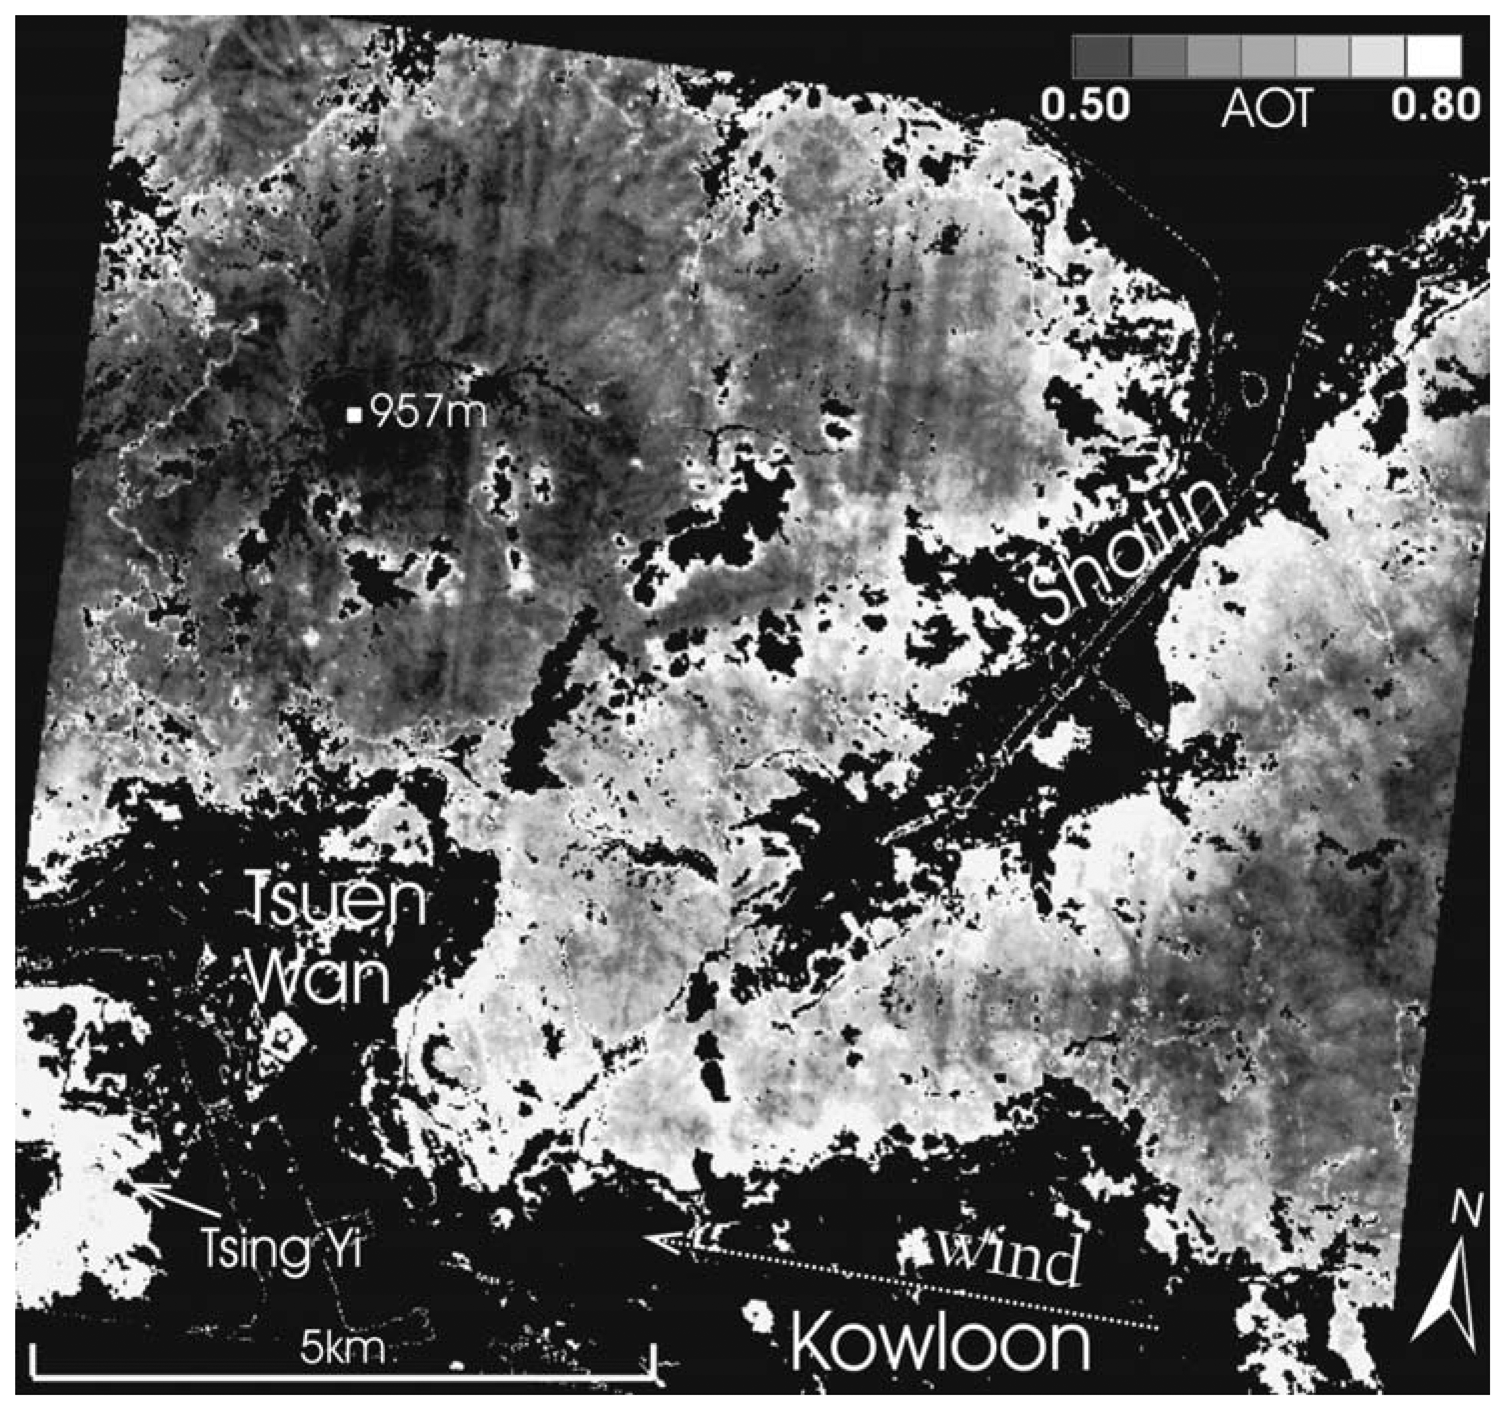
4.3. Visual interpretations
5. Discussion
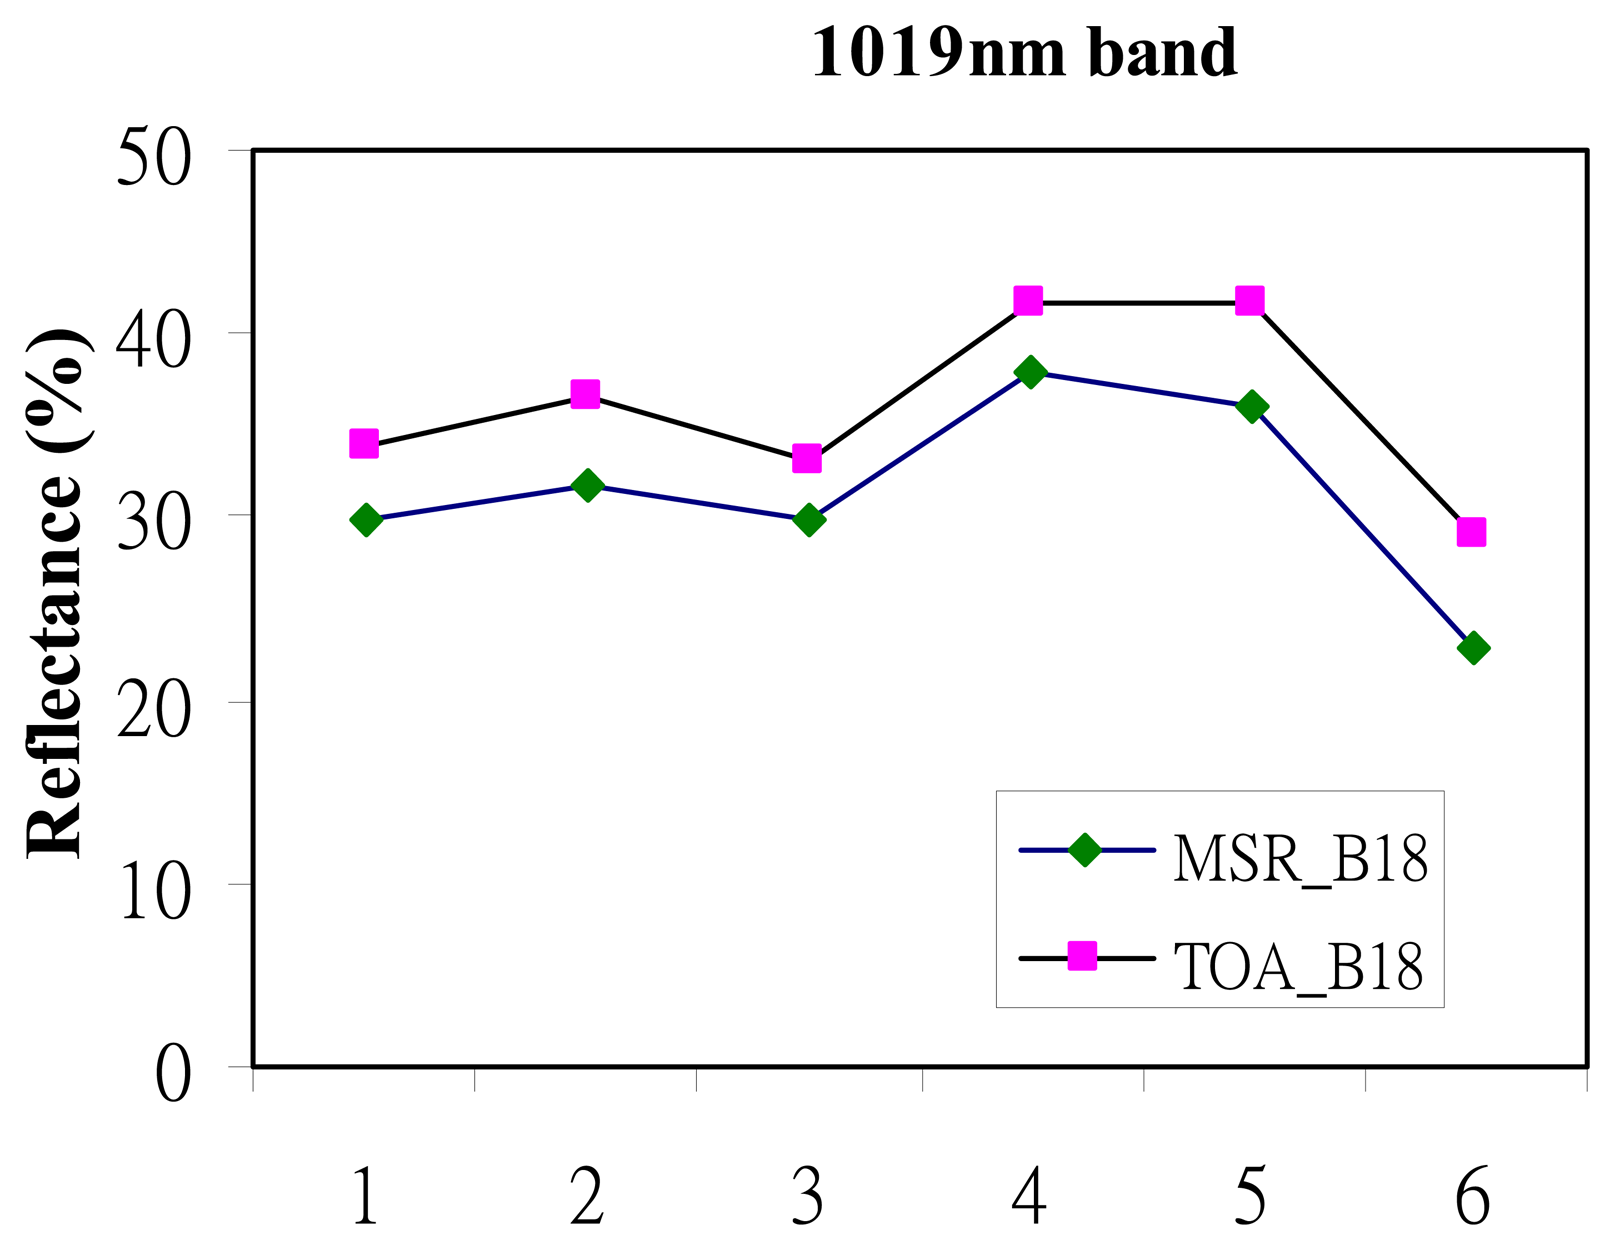
- (i)
- the assumption of linearity when converting TOA1019 to Lsurf1019 by deduction of the difference between them as observed by field radiometer (Figure 2). The deduction of approximately 10% of TOA1019 ie. 3.3% to reduce TOA1019 to Lsurf1019 appears effective since it is likely that the 10% relationship is linear for the larger particle sizes to which the 10% difference applies. An estimate of the error can be given, thus an error in Lsurf1019 of 1 s.d. ie. 1.46% converted to AOT would produce an error in Lsurf490 of 0.06% and in Lsurf661 of 0.16%, thus an AOT error of 0.06 in blue, and 0.04 in red. This is comparable with MODIS AOT retrievals where the error in Lsurf due to the assumption of surface reflectance for the SWIR 2,100 nm band is given by Kaufman et al. [26] as +/-0.6% for blue and red bands, translating to an error in AOT of +/-0.06. Thus the error in the derivation of Lsurf in this project is reasonable
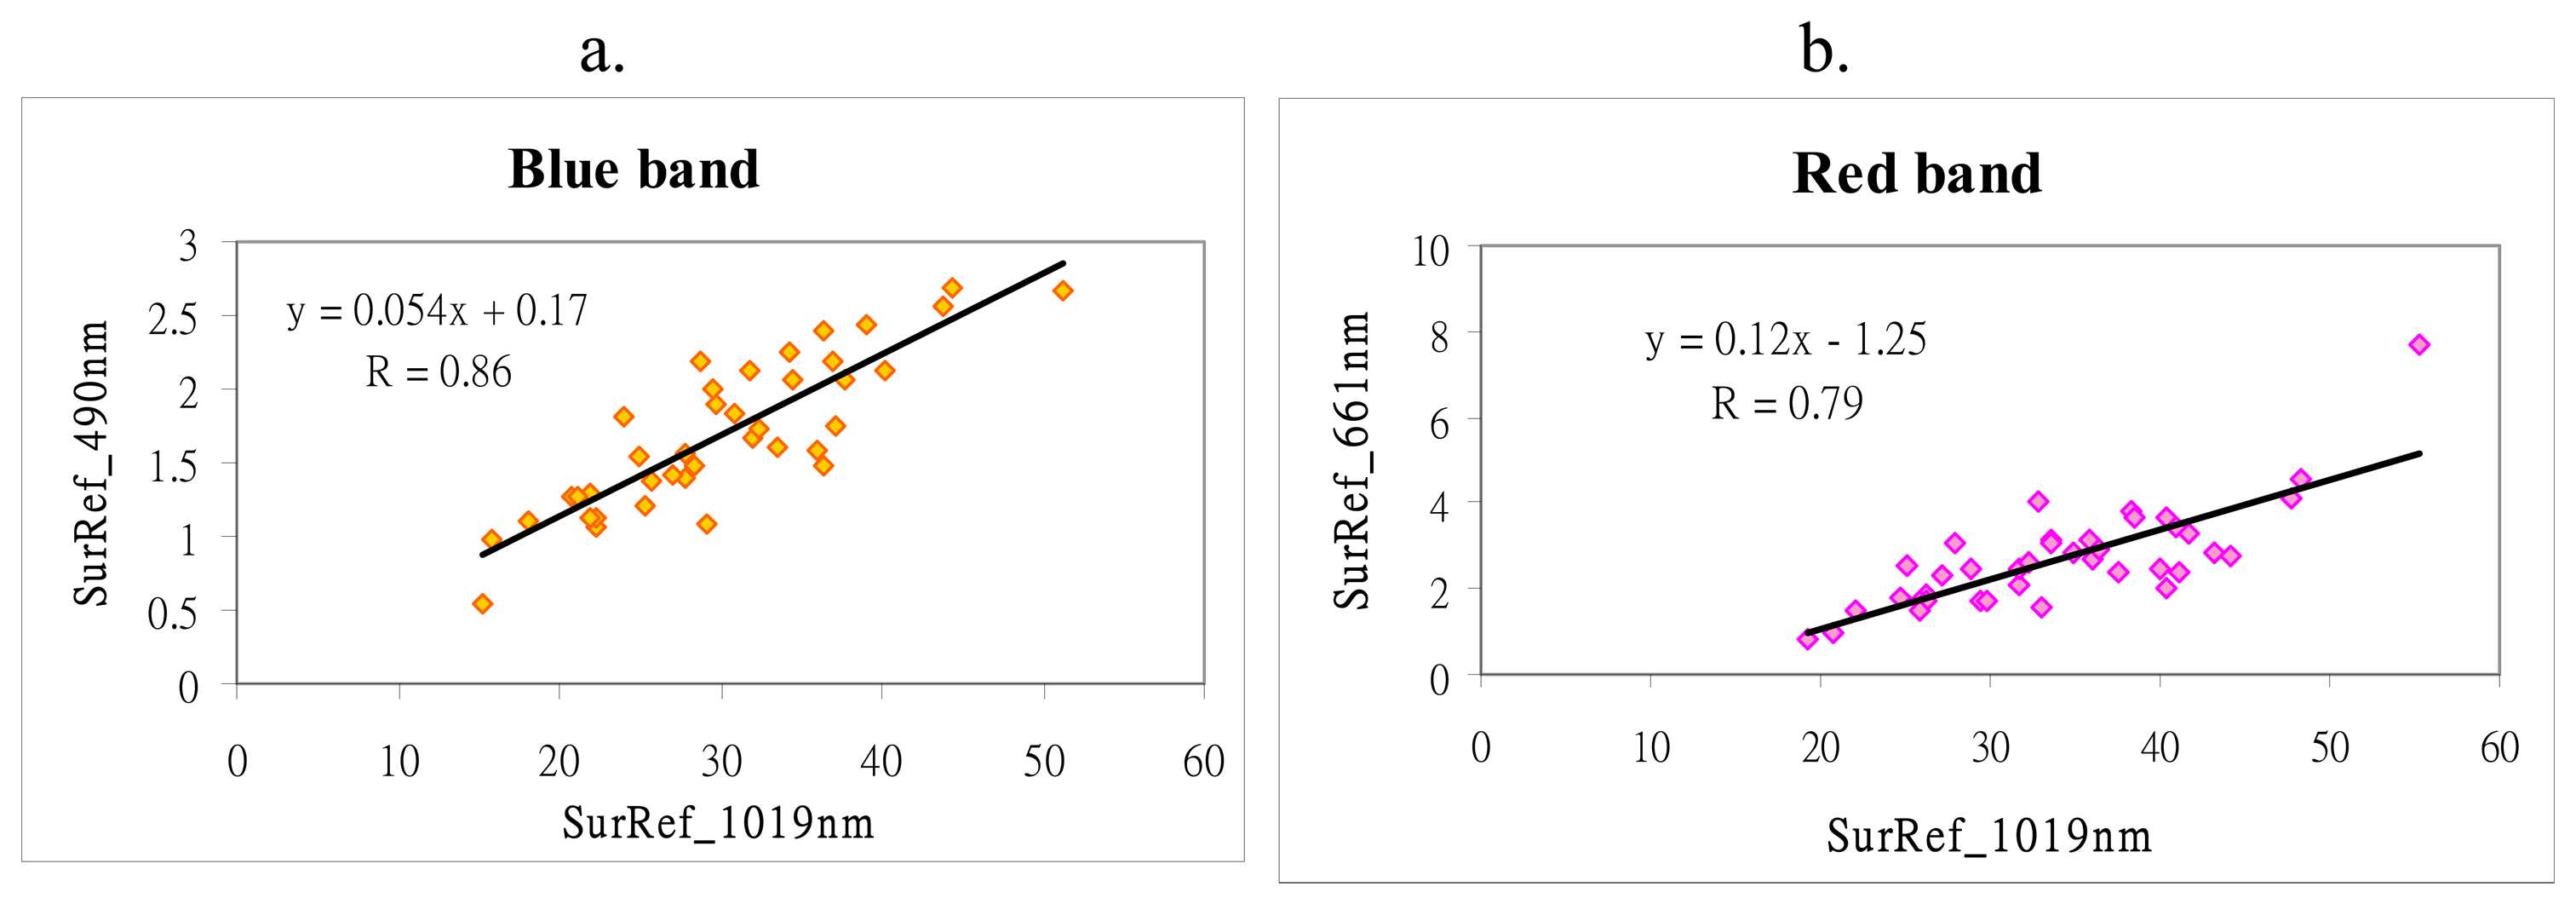
- (ii)
- variability in the relationship between CHRIS Lsurf1019 and Lsurf for blue and red bands, with correlation coefficients of 0.86 and 0.79 respectively. However these compare reasonably with the 0.75 and 0.93, observed for MODIS 2,100 nm band correlated with the blue and red bands [15]
- (iii)
- assumptions in the aerosol model used which Chu et al. [27] suggested can range from 0-20%, but since an aerosol model devised for Hong Kong was used, this error is likely to be considerably reduced
- (iv)
- interpolation between AERONET and CHRIS bands which may account for 0-10% depending on the aerosol type [21].
6. Conclusions
Acknowledgments
References
- Tanré, D.; Deschamps, P.Y.; Devaux, C.; Herman, M. Estimation of Saharan aerosol optical thickness from blurring effects in Thematic Mapper data. J. Geophys. Res. 1988, 93, 15955–15964. [Google Scholar]
- Sifakis, N.I.; Soulakellis, N.A.; Paronis, D.K. Quantitative mapping of air pollution density using earth observations: a new processing method and application to an urban area. IEEE Trans. Geosci. Remote Sens. 1998, 19, 3289–3300. [Google Scholar]
- Kaufman, Y.; Tanré, D. Algorithm for remote sensing of tropospheric aerosol from MODIS.; NASA MOD04 Product Report; 1998. [Google Scholar]
- Hsu, N.C.; Tsay, S.C.; King, M.D.; Herman, J.R. Aerosol Properties Over Bright Reflecting Source Regions. IEEE Trans. Geosci. Remote Sens. 2004, 42, 557–569. [Google Scholar]
- Li, Z.Q.; Niu, F.; Lee, K.H.; Xin, J.Y.; Hao, W.M.; Nordgren, B.; Wang, Y.S.; Wang, P.C. Validation and understanding of Moderate Resolution Imaging Spectroradiometer aerosol products (C5) using ground-based measurements from the handheld Sun photometer network in China. J. Geophys. Res. 2007, 112, D22S07. [Google Scholar] [CrossRef]
- Sifakis, N.I.; Deschamps, P.-Y. Mapping of air pollution using satellite data. Photo. Engin. Remote Sens. 1992, 58, 1433–1437. [Google Scholar]
- Retalis, A.; Cartalis, C.; Athanassiou, E. Assesment of the distribution of aerosols in the area of Athens with the use of Landsat Thematic Mapper data. Int. J. Remote Sens. 1999, 20(5), 939–945. [Google Scholar]
- EPD, Past API Record; Environmental Protection Department: Hong Kong, 2008. Available online: http://www.epd-asg.gov.hk/english/pastapi/pastapie.php.
- Lo, J.C.F.; Lau, A.; Fung, J.C.H.; Chen, F. Investigation of enhanced cross-city transport and trapping of air pollutants by coastal and urban land-sea breeze circulations. J. Geophys. Res. 2006, 111, D14. [Google Scholar] [CrossRef]
- Yuan, Z.; Lau, A.; Zhang, H.; Yu, J.Z.; Louie, P.K.; Fung, J. Identification and spatiotemporal variations of dominant PM10 sources over Hong Kong. Atmos. Environ. 2006, 40, 1803–1815. [Google Scholar]
- Civic Exchange. Relative Significance of Local vs. Regional Sources: Hong Kong's Air Pollution. 2007. http://www.civic-exchange.org/eng/upload/files/200703_HKAirPollution.pdf.
- Kaufman, Y.J.; Tanré, L.A.; Remer, L.A.; Vermote, E.; Chu, A.; Holben, B.N. Operational remote sensing of tropospheric aerosol over land from EOS moderate resolution imaging spectroradiometer. J. Geophys. Res. 1997a, 102, 17051–17067. [Google Scholar]
- Levy, C.; Remer, L.A.; Martins, J.V.; Kaufman, Y.J.; Plana-fattori, A.; Redemann, J.; Wenny, B. Evaluation of the MODIS aerosol retrievals over ocean and land during CLAMS. J. Atmos. Sci. 2004, 62, 974–992. [Google Scholar]
- Lee, K.H.; Kim, Y.J.; Hoyningen-Huene, W.V.; Burrow, J.P. Influence of land surface effects on MODIS aerosol retrieval using the BAER method over Korea. Int. J. Remote Sens. 2006, 27, 2813–2830. [Google Scholar]
- Remer, L.; Tanré, D.; Kaufman, Y. Algorithm for remote sensing of tropospheric aerosol from MODIS. Algorithm Theoretical Basis Documents (ATBD's), 2006. http://modis.gsfc.nasa.gov/data/atbd/atbd_mod02.pdf.
- ESA. Exploitation of CHRIS data from the PROBA mission for science and applications.; Experimenters Handbook; 4, Baseline Programme; Oct 1999; p. 15. [Google Scholar]
- Shaker, A.; Nichol, J.E.; Wong, M.S. Topographic mapping from small satellites: a case study of CHRIS/PROBA data. Photogram. Record 2008, 23, 275–289. [Google Scholar]
- Garcia, J.C.; Moreno, J. Removal of noises in CHRIS/PROBA images: application to the SPARC campaign data. Proceedings of Second CHRIS/PROBA Workshop, Frascati, Italy, July; 2004. Available online: http://earth.esa.int/workshops/chris_proba_04/papers/9_GARCIA.pdf.
- Guanter, L.; Alonso, L.; Moreno, J. A method for the surface reflectance retrieval from PROBA/CHRIS data over land: application to ESA SPARC campaigns. IEEE Trans. Geosci. Remote Sens. 2005, 43, 2908–2917. [Google Scholar]
- Kaufman, Y.J.; Tanré, D. Atmospherically resistant vegetation index (ARVI) for EOS-MODIS. IEEE Trans. Geosci. Remote Sens. 1992, 30, 261–270. [Google Scholar]
- Remer, L.A.; Kaufman, Y.J.; Tanré, D.; Mattoo, S.; Chu, D.A.; Martins, J.V.m; Li, R-R.; Ichoku, C.; Levy, R.C.; Kleidman, R.G.; Eck, T.F.; Vermote, E.; Holben, B.N. The MODIS aerosol algorithm, products and validation. J. Atmos. Sci. 2005, 62, 947–973. [Google Scholar]
- Wong, M.S.; Lee, K.H.; Nichol, J.E.; Li, Z.Q. Retrieval of aerosol optical thickness using MODIS 500 × 500m2, a study in Hong Kong and Pearl River Delta region. Proceedings of International Workshop on Earth Observation and Remote Sensing Applications, Beijing, 30 June - 2 July 2008; pp. 1–6. [CrossRef]
- Ichoku, C.; Levy, R.; Kaufman, Y.J.; Remer, L.A.; Li, R-R.; Martins, V.J.; Holben, B.N.; Abuhassan, N.; Slutsker, I.; Eck, T.F.; Pietras, C. Analysis of the performance characteristics of the five-channel Microtops II sunphotometer for measuring aerosol optical thickness and precipitable water vapour. J. Geophys. Res. 2002, 107, D13. [Google Scholar] [CrossRef]
- Wang, J.; Christopher, S.A. Intercomparison between satellite-derived aerosol optical thickness and PM2.5 mass: Implications for air quality studies. Geophys. Res. Lett. 2003, 30, 2095. [Google Scholar] [CrossRef]
- Engel-Cox, J.A.; Holloman, C.H.; Coutant, B.W.; Hoff, R.M. Qualitative and quantitative evaluation of MODIS satellite sensor data for regional and urban scale air quality. Atmos. Environ. 2004, 38, 2495–2509. [Google Scholar]
- Kaufman, Y.J.; Wald, A.E.; Remer, L.A.; Gao, B.C.; Li, R.R.; Flynn, L. The MODIS 2.1um channel - correlation with visible reflectance for use in remote sensing of aerosol. IEEE Trans. Geosci. Remote Sens 1997b, 35, 1286–1297. [Google Scholar]
- Chu, A.; Kaufman, Y.J.; Ichoku, C.; Remer, L.A.; Tanré, D.; Holben, B.N. Validation of MODIS aerosol optical depth retrieval over land. Geophys. Res. Lett. 2002, 29, 1–4. [Google Scholar]
- Herman, J.R.; Celarier, E.A. Earth surface reflectivity climatology at 340–380 nm from TOMS data. J. Geophys. Res. 1997, 102, 28003–28011. [Google Scholar]
- Koelemeijer, R.B.A.; de Haan, J.F.; Stammes, P. A database of spectral surface reflectivity in the range 335–772 nm derived from 5.5 years of GOME observations. J. Geophys. Res. 2003, 108, 28003–28011. [Google Scholar]
- Wong, M.S.; Nichol, J.E. A new algorithm for retrieving aerosol optical thickness over Hong Kong from MODIS satellite images. J. Geograph. Inform. Sci.


| Urban Forest | Band 2: 490 nm | Band 7: 661 nm | ||||
|---|---|---|---|---|---|---|
| Dec-05 | Feb-06 | Sept-06 | Dec-05 | Feb-06 | Sept-06 | |
| AERONET | - | 0.55 | 0.69 | - | 0.38 | 0.44 |
| Microtops II | - | - | 0.72 | - | - | 0.47 |
| Image AOT | 0.50-0.62 | 0.63-0.69 | 0.71-0.75 | 0.24-0.28 | 0.4-0.47 | 0.32-0.41 |
| Rural Forest | Band 2: 490 nm | Band 7: 661 nm | ||||
| Dec-05 | Feb-06 | Sept-06 | Dec-05 | Feb-06 | Sept-06 | |
| AERONET | - | 0.55 | 0.69 | - | 0.38 | 0.44 |
| Microtops II | - | - | 0.67 | - | - | 0.46 |
| Image AOT | 0.43-0.50 | 0.52-0.6 | 0.63-0.69 | 0.21-0.26 | 0.25-0.4 | 0.24-0.39 |
| TOA | Lsurf | Path Reflectance | MSR (mean) | |||||||
|---|---|---|---|---|---|---|---|---|---|---|
| Dec-05 | Feb -06 | Sep -06 | Dec-05 | Feb -06 | Sep -06 | Dec-05 | Feb -06 | Sep -06 | ||
| B2 490nm | 10.4 | 11.3 | 11.5 | 1.4 | 1.5 | 2.0 | 9.0 | 9.8 | 9.3 | 1.64 |
| B18 1019nm | 28 | 30.8 | 31.6 | 26.5 | ||||||
© 2008 by the authors; licensee Molecular Diversity Preservation International, Basel, Switzerland. This article is an open-access article distributed under the terms and conditions of the CreativeCommons Attribution license (http://creativecommons.org/licenses/by/3.0/).
Share and Cite
Nichol, J.E.; Wong, M.S.; Chan, Y.Y. Fine Resolution Air Quality Monitoring from a Small Satellite: CHRIS/PROBA. Sensors 2008, 8, 7581-7595. https://doi.org/10.3390/s8127581
Nichol JE, Wong MS, Chan YY. Fine Resolution Air Quality Monitoring from a Small Satellite: CHRIS/PROBA. Sensors. 2008; 8(12):7581-7595. https://doi.org/10.3390/s8127581
Chicago/Turabian StyleNichol, Janet E., Man Sing Wong, and Yuk Ying Chan. 2008. "Fine Resolution Air Quality Monitoring from a Small Satellite: CHRIS/PROBA" Sensors 8, no. 12: 7581-7595. https://doi.org/10.3390/s8127581