Rural Land Use Change during 1986–2002 in Lijiang, China, Based on Remote Sensing and GIS Data

Abstract
:1. Introduction
2. Study area
3. Methodology
3.1 Data
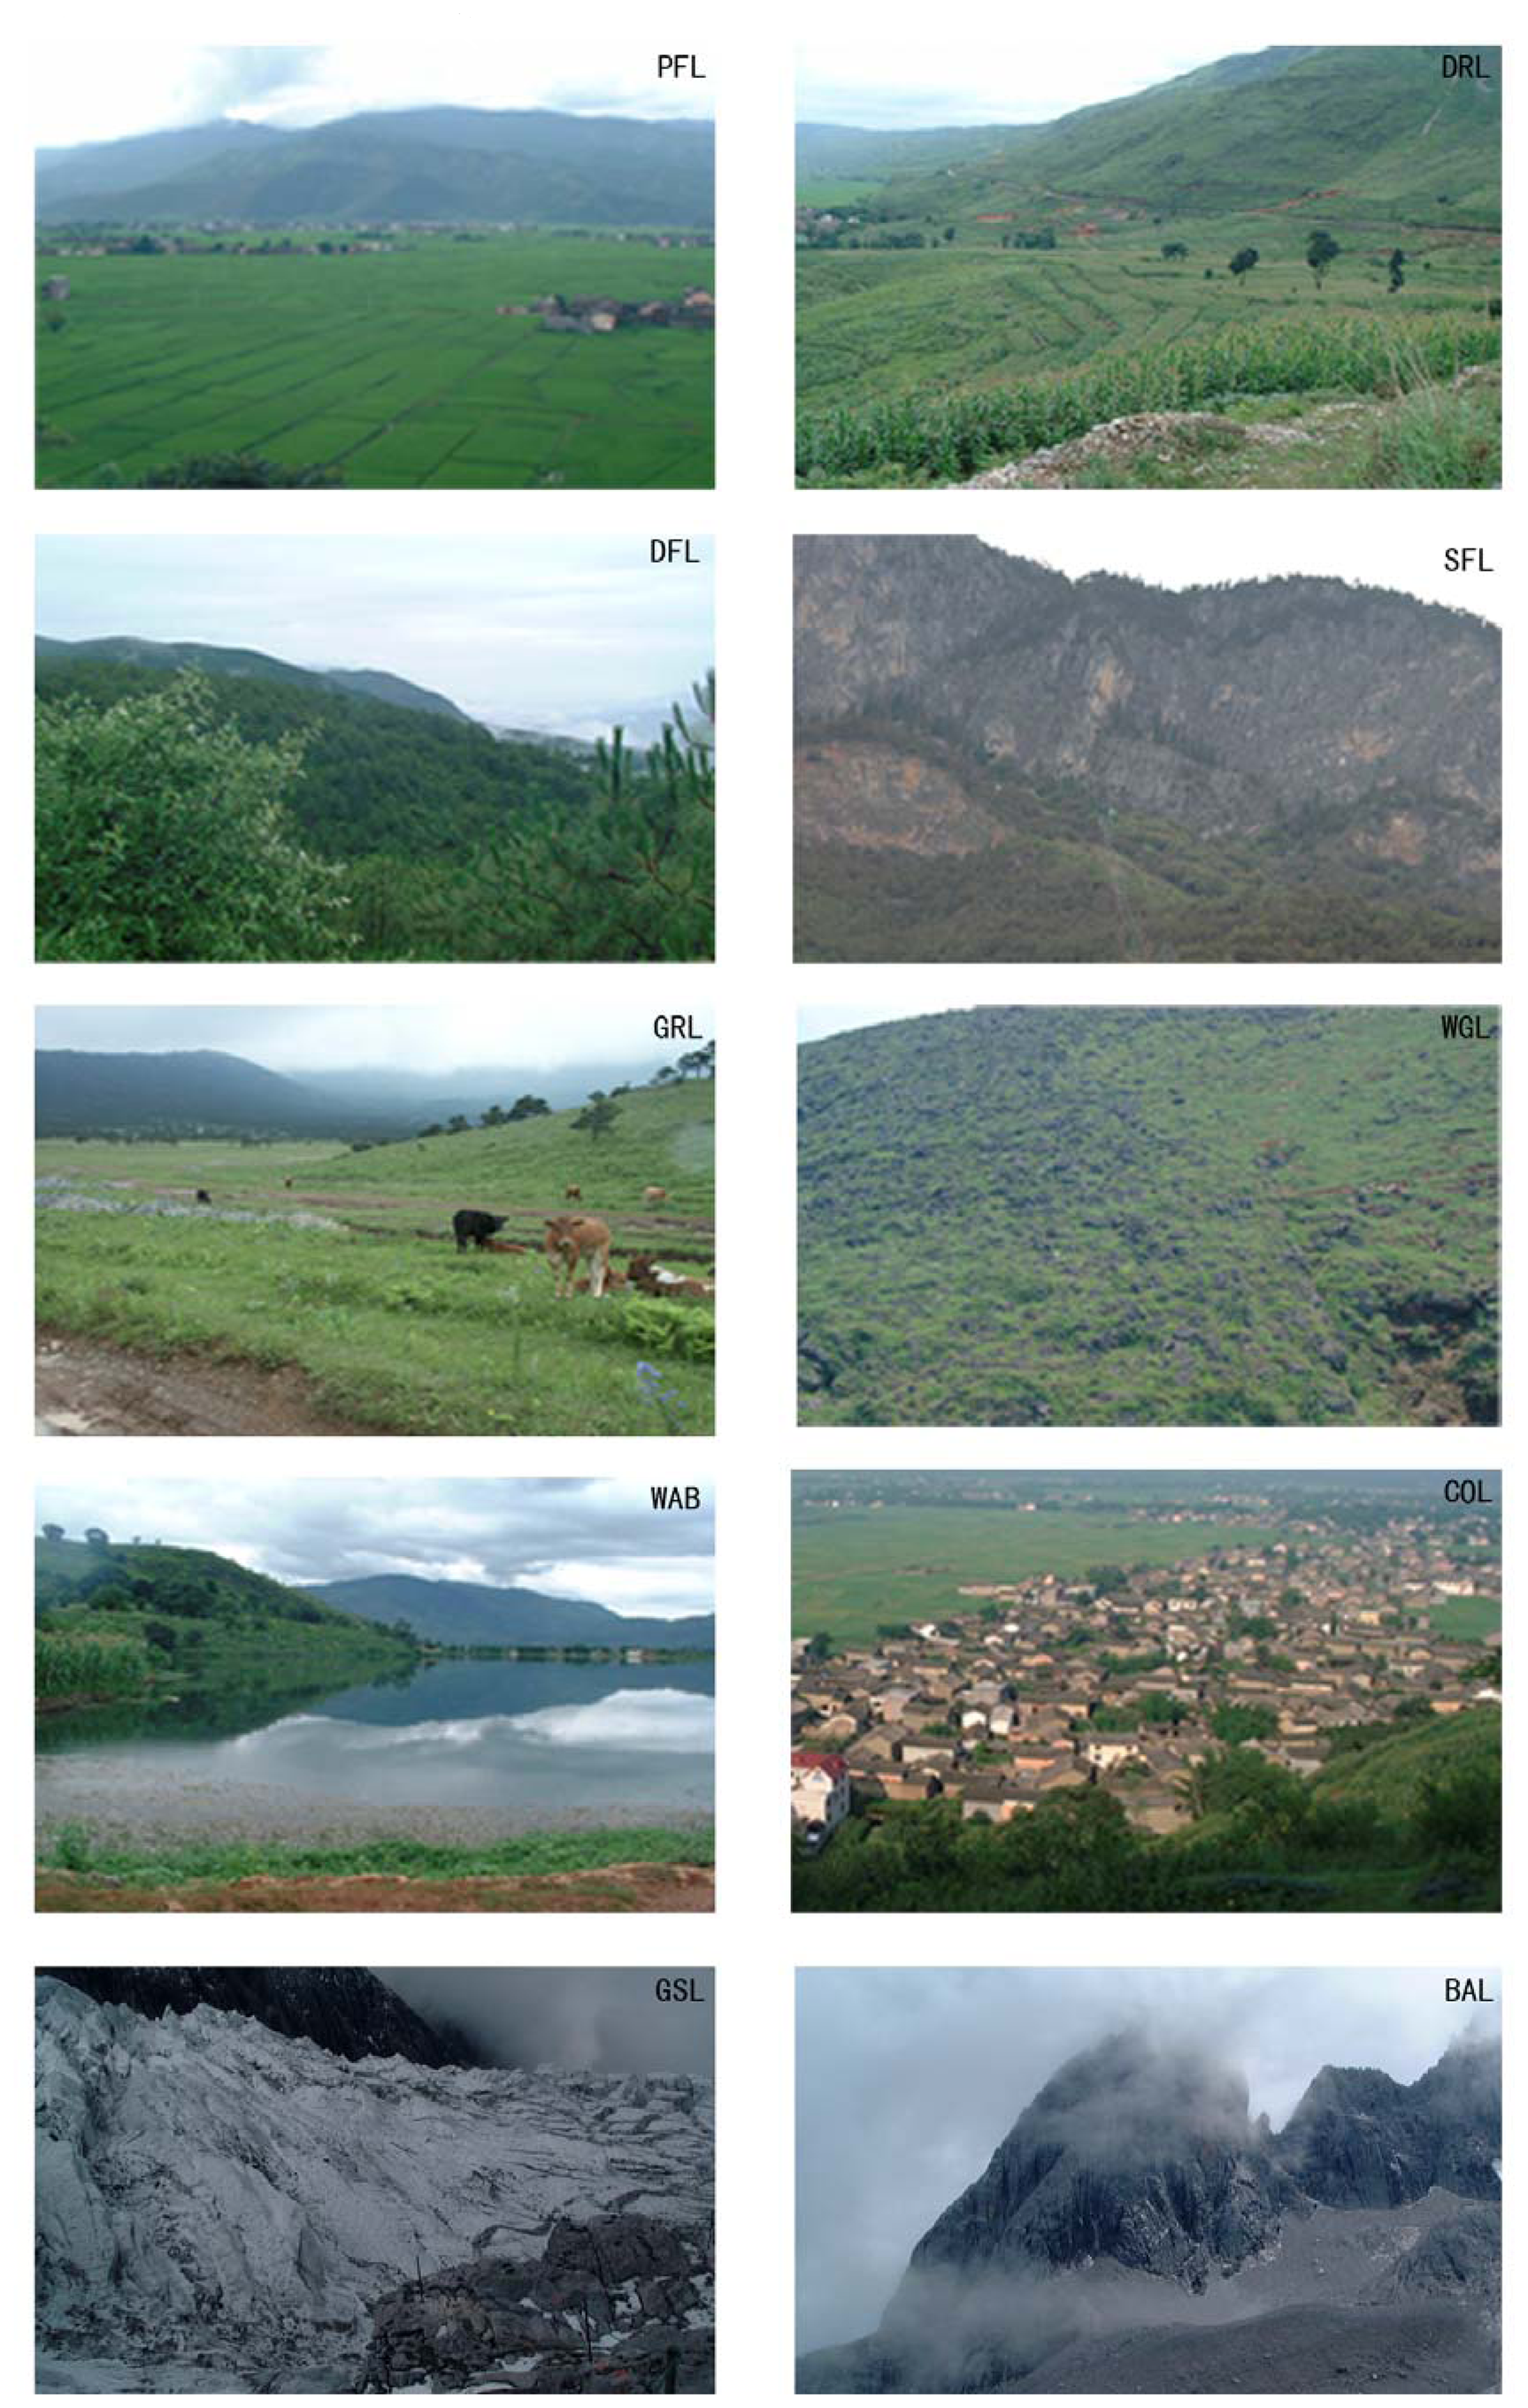
- PAF means irrigated land situated on flat areas, while DRL lacks irrigation water or facilities, relying on natural precipitation;
- DFL refers to the forest land with a coverage density above 30%, while the other forest land was classified as SFL, which includes shrub lands, open woodlands, garden, planted areas with young forest and nurseries;
- GRL means the areas with herbaceous vegetation cover used for grazing, including natural or artificial grassland;
- WGL refers to unused grassland, which usually has a herbage coverage density below 10%;
- WAB included rivers, lakes, reservoirs and ponds, and GSL was covered by permanent glacier or snow in the mountains with an elevation above 4,250 m;
- COL included urban settlements, rural settlements, individual industry and mining land, and transportation and associated green land;
- BAL included bare rock or sand with little vegetation coverage.
3.2 Methods
3.2.1 Analysis of land use change matrix
3.2.2 Analysis of the rate of land use change
- (1)
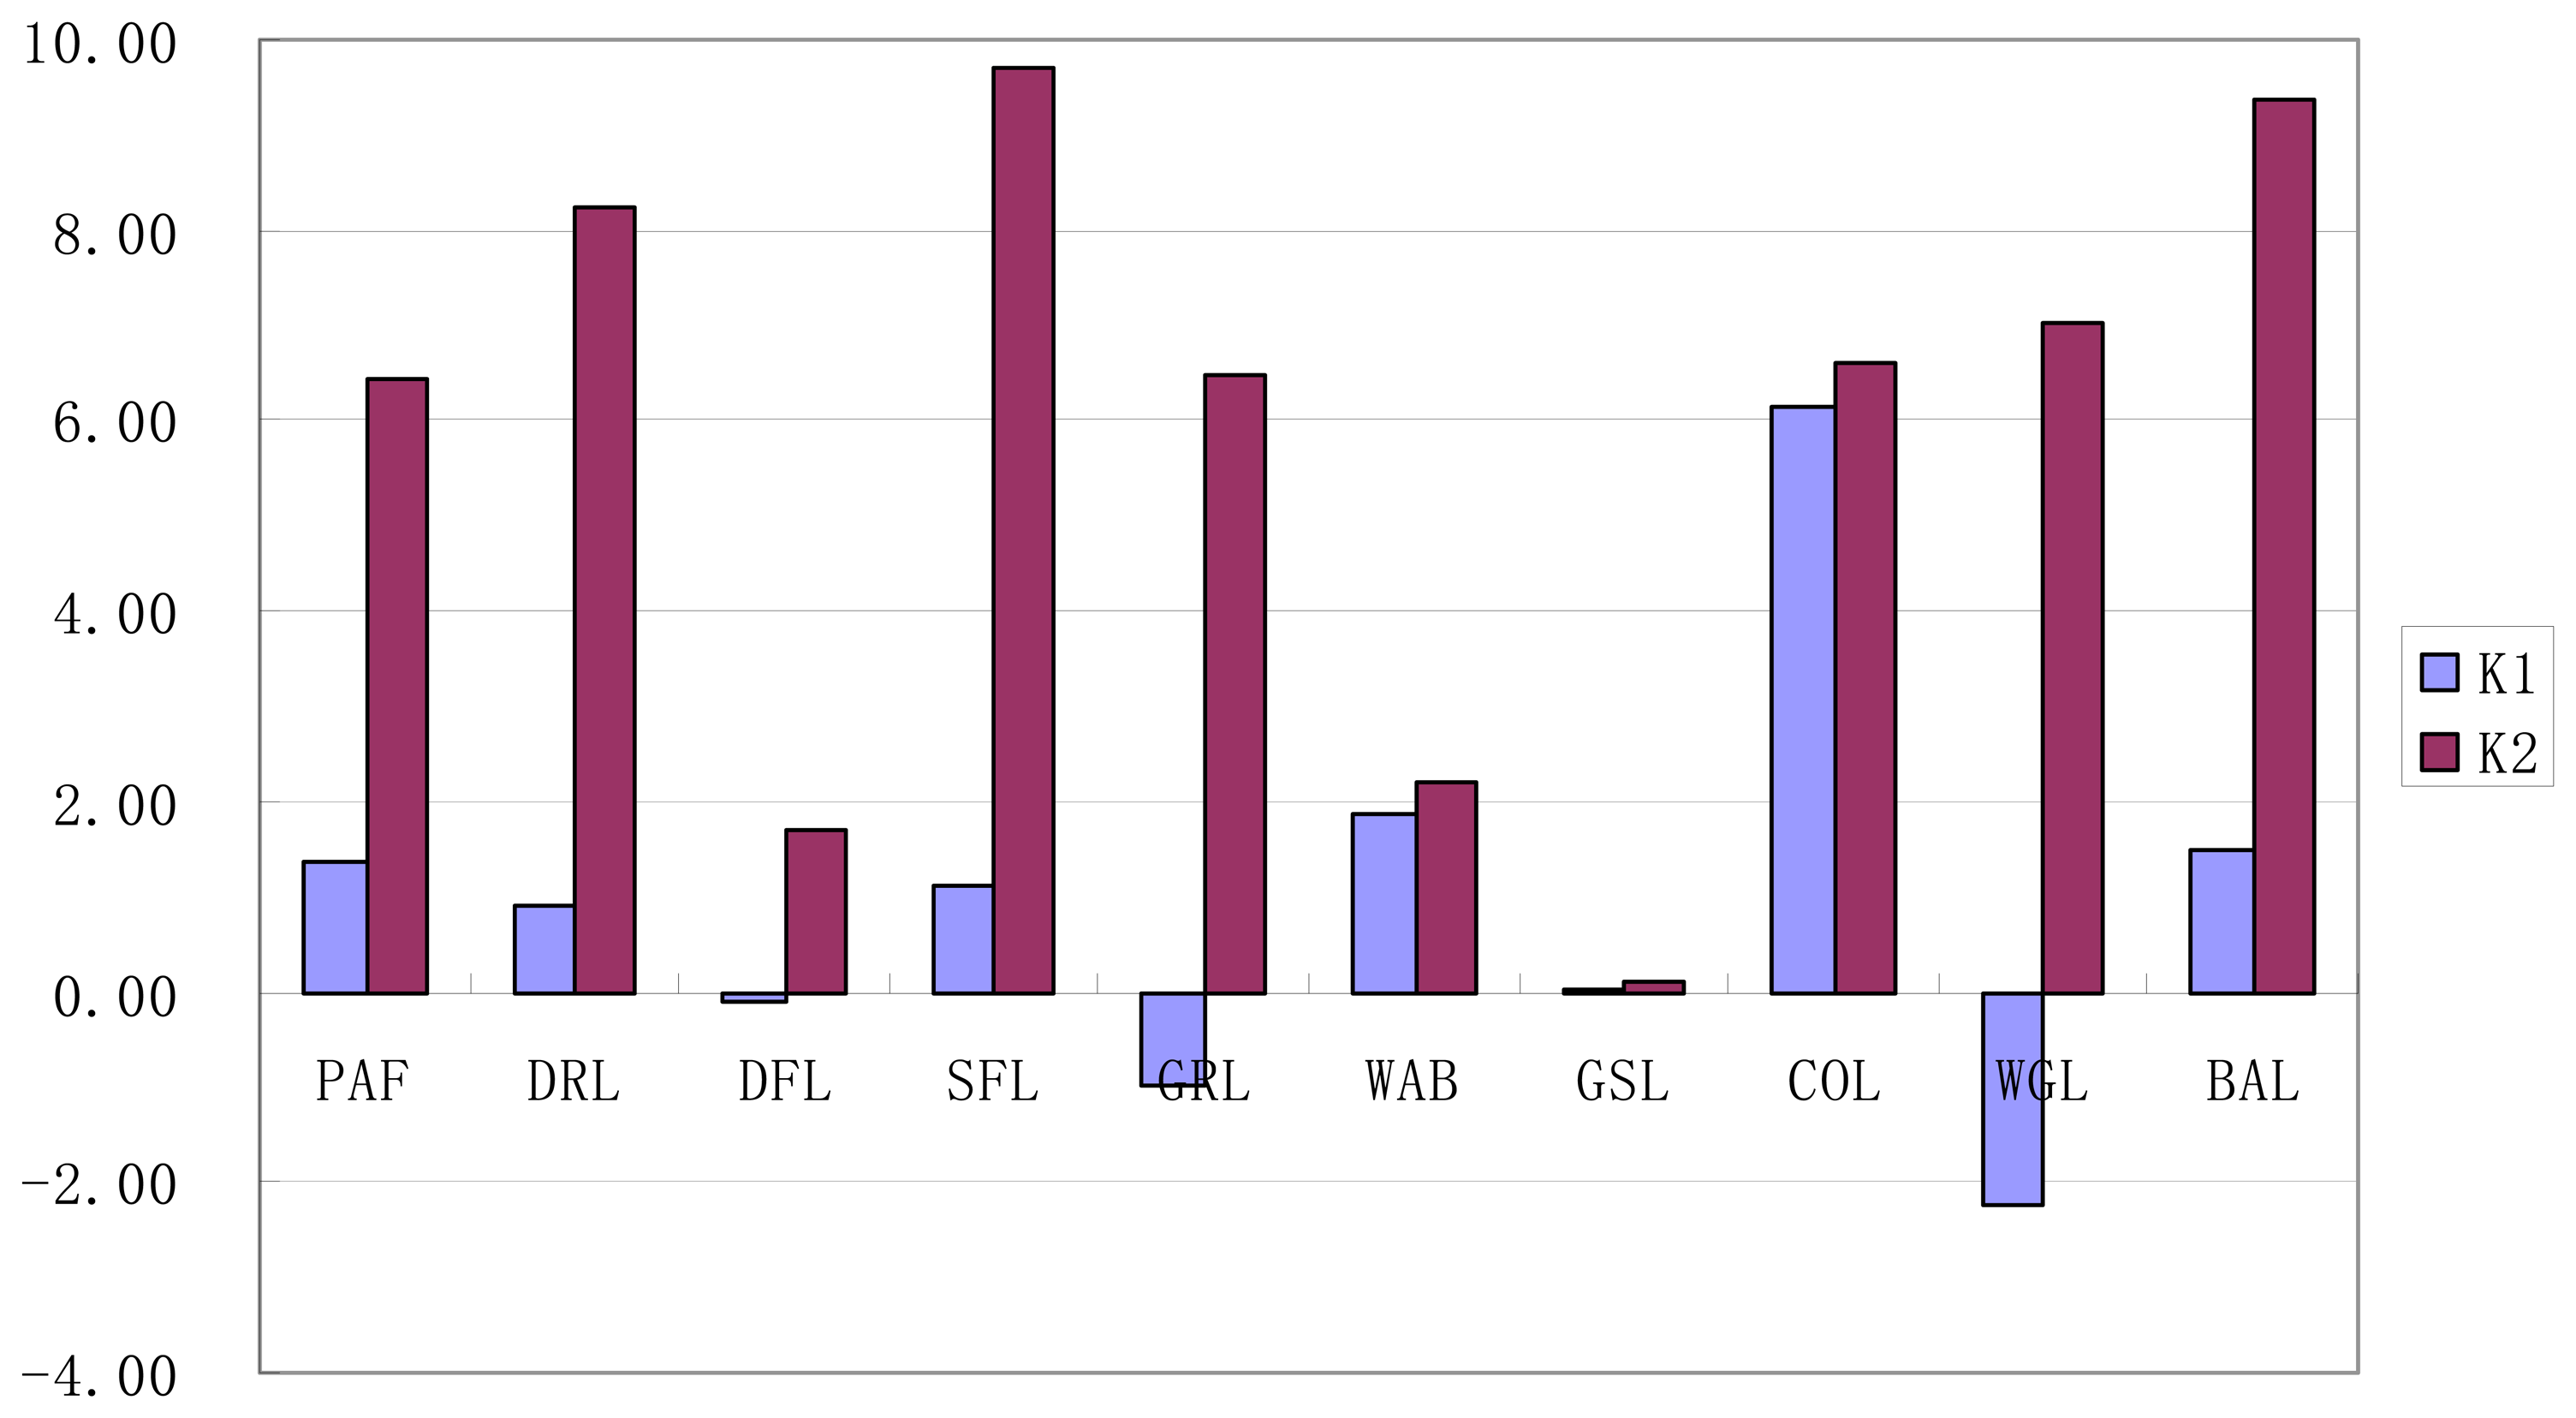
- Change rate of single land use typeAs land use dynamic degree for single land use type can quantitatively measure the change of a certain land use type, the index is recognized as one of the most widely used indices for detecting the land use change rate. It is mostly calculated according to equation (2):where K1 is land use dynamic degree, measuring the change rate of the target land use type; Ua and Ub are the area of the target land use type at the beginning and end of the study period respectively; and T is the study period, which is usually measured with the unit of year.The index of K1 can concisely express the overall characteristics of the change of a certain land use type in the study period, while it is acknowledged that K1 has missed some information on the spatial process of land use change. Generally speaking, there are three change types for a certain land use type in the process of land use change, i.e. no conversion, conversion to other land use types, and conversion from other land use types. It is obvious that what is measured by the index of K1 is the integration of the three kinds of change for the target land use type in the study area, and it cannot express the information on each change type directly. Thus, another index for the change rate of single land use type was constructed according to equation (3):where K2 is land use dynamic degree, measuring the change rate of the target land use type; Δin and Δout are the area of the target land use type conversion from or to other land use types in the study period respectively; and T is the study period, which is usually measured with the unit of year.Focusing on the process of land use change, the index of K2 can effectively reflect the area ratio of the conversion from and to the target land use type. However, it was criticized that K2 could not compare the conversion loss rate and conversion gain rate [59]. As what the index of K1 reflects includes the information on the comparison between conversion loss and gain, both K1 and K2 are used to measure the change rate of single land use type. In details, the index of K2 quantifies the total “loss or gain” conversion of the target land use type; while the index of K1 reflects the algebraic summation of conversion loss and gain of the target land use type, and the absolute value of K1 measures the extent of the relative difference between conversion loss and gain, with a positive sign of the value of K1 for the dominance of conversion gain from other land use types to the target land use types, and a negative sign for the precedence of conversion loss.
- (2)
- Integrated land use change rate for the whole regionIn order to detect the change rate of regional land use as a whole, an index of integrated land use dynamic degree was used in this study, which was calculated according to equation (4):where LUC is integrated land use dynamic degree, measuring the integrated land use change rate for the whole region; ΔLUi→j is the area converted from land use type i to land use type j; n is the number of land use types; LU is the total area of the study area; and T is the study period, which is usually measured with the unit of year.
3.2.3 Analysis of the change of land use patterns
4. Results
4.1 Land use change as a whole
4.2 Land use change matrix during 1986-2002
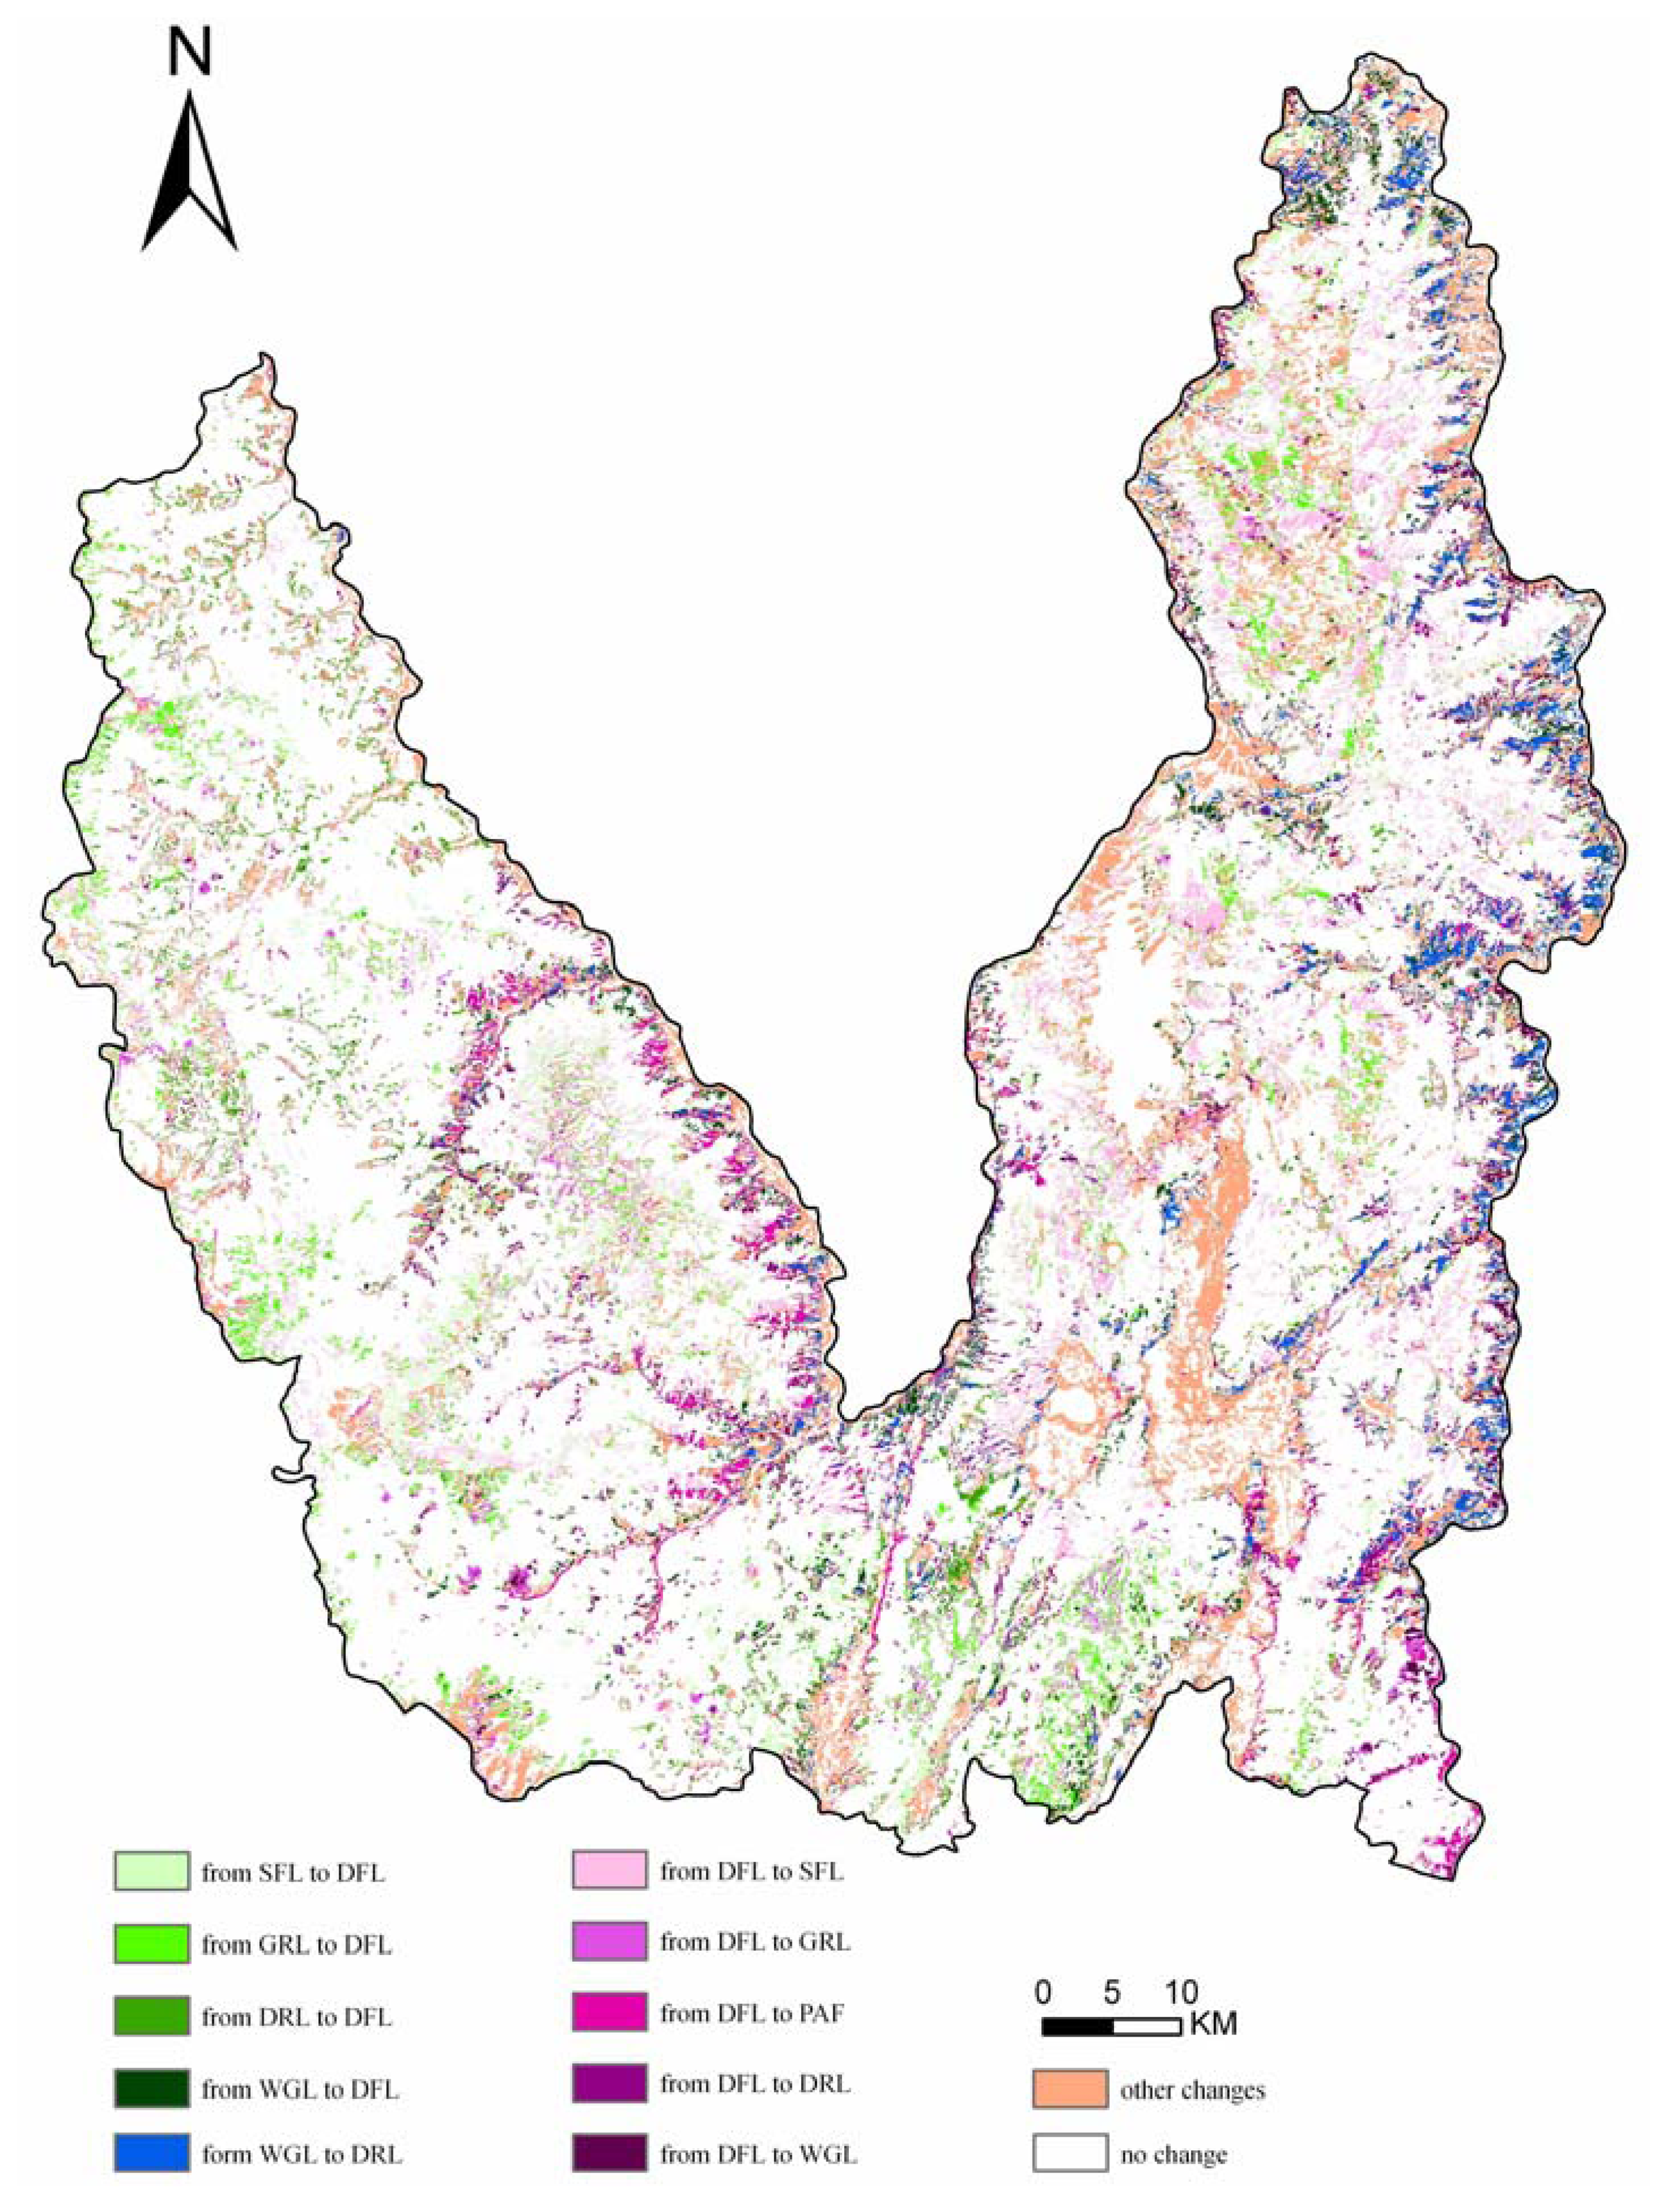
- Glacier or snow-capped land, water body and construction land were the most stable land use types with a conversion loss less than 4% of their total area. Compared to little conversion gain of glacier or snow-capped land, there was a little conversion gain of water body evenly from other land use types except glacier or snow-capped land and construction land, and the total area of construction land was about doubled with a dominant conversion gain from paddy field;
- Dense forest land could also been regarded as a stable land use type with a area ratio of 85.64% unchanged in the study period, and sparse forest land was the main conversion destination. However, due to its dominant area ratio to the total area of the study area, all the conversions from dense forest land to other land use types were dominant in the conversion gain of corresponding land use types;
- Paddy field and dry land showed distinct changes with an area ratio of 40.67% and 58.62% during 1986-2002, respectively. Paddy field was mainly converted into dry land and construction land, while dense forest land was dominant in the conversion loss of dry land. The un-stability of about half of arable land, and the coexistence of abandon and cultivation of arable land, suggested the low soil quality and land productivity in the study area;
- Sparse forest land, bare land and grassland were more unstable with only 31.05%, 36.96% and 40.36% unchanged respectively, while their main conversion destinations were all dense forest land, which was partly due to the initiation of natural forest protection in the study area;
- Waste grassland changed the most during 1986-2002 with 25.74% unchanged, and most converted into dry land and dense forest land.
4.3 Land use change rate during 1986-2002
4.3.1 Change rate of each land use type
- Type I with high annual changing rate and high net increasing rate, only including construction land. The change of construction land was characterized as a great deal of conversion gain with little conversion loss;
- Type II with high annual changing rate and low net increasing rate, including paddy field, dry land, sparse forest land and bare land. Their land use change was represented as a great conversion loss with a little more conversion gain;
- Type III with low annual changing rate and low net increasing rate, including water body and glacier or snow-capped land, which had a little conversion gain and little conversion loss;
- Type IV with high annual changing rate and low net decreasing rate, including grassland and waste grassland. There was a great conversion loss with a little less conversion gain;
- Type V with low annual changing rate and low net decreasing rate, only including dense forest land, which had a little conversion gain with some more conversion loss.
4.3.2 Integrated change rate of sub-regional land use
4.4 Land use pattern change during 1986-2002
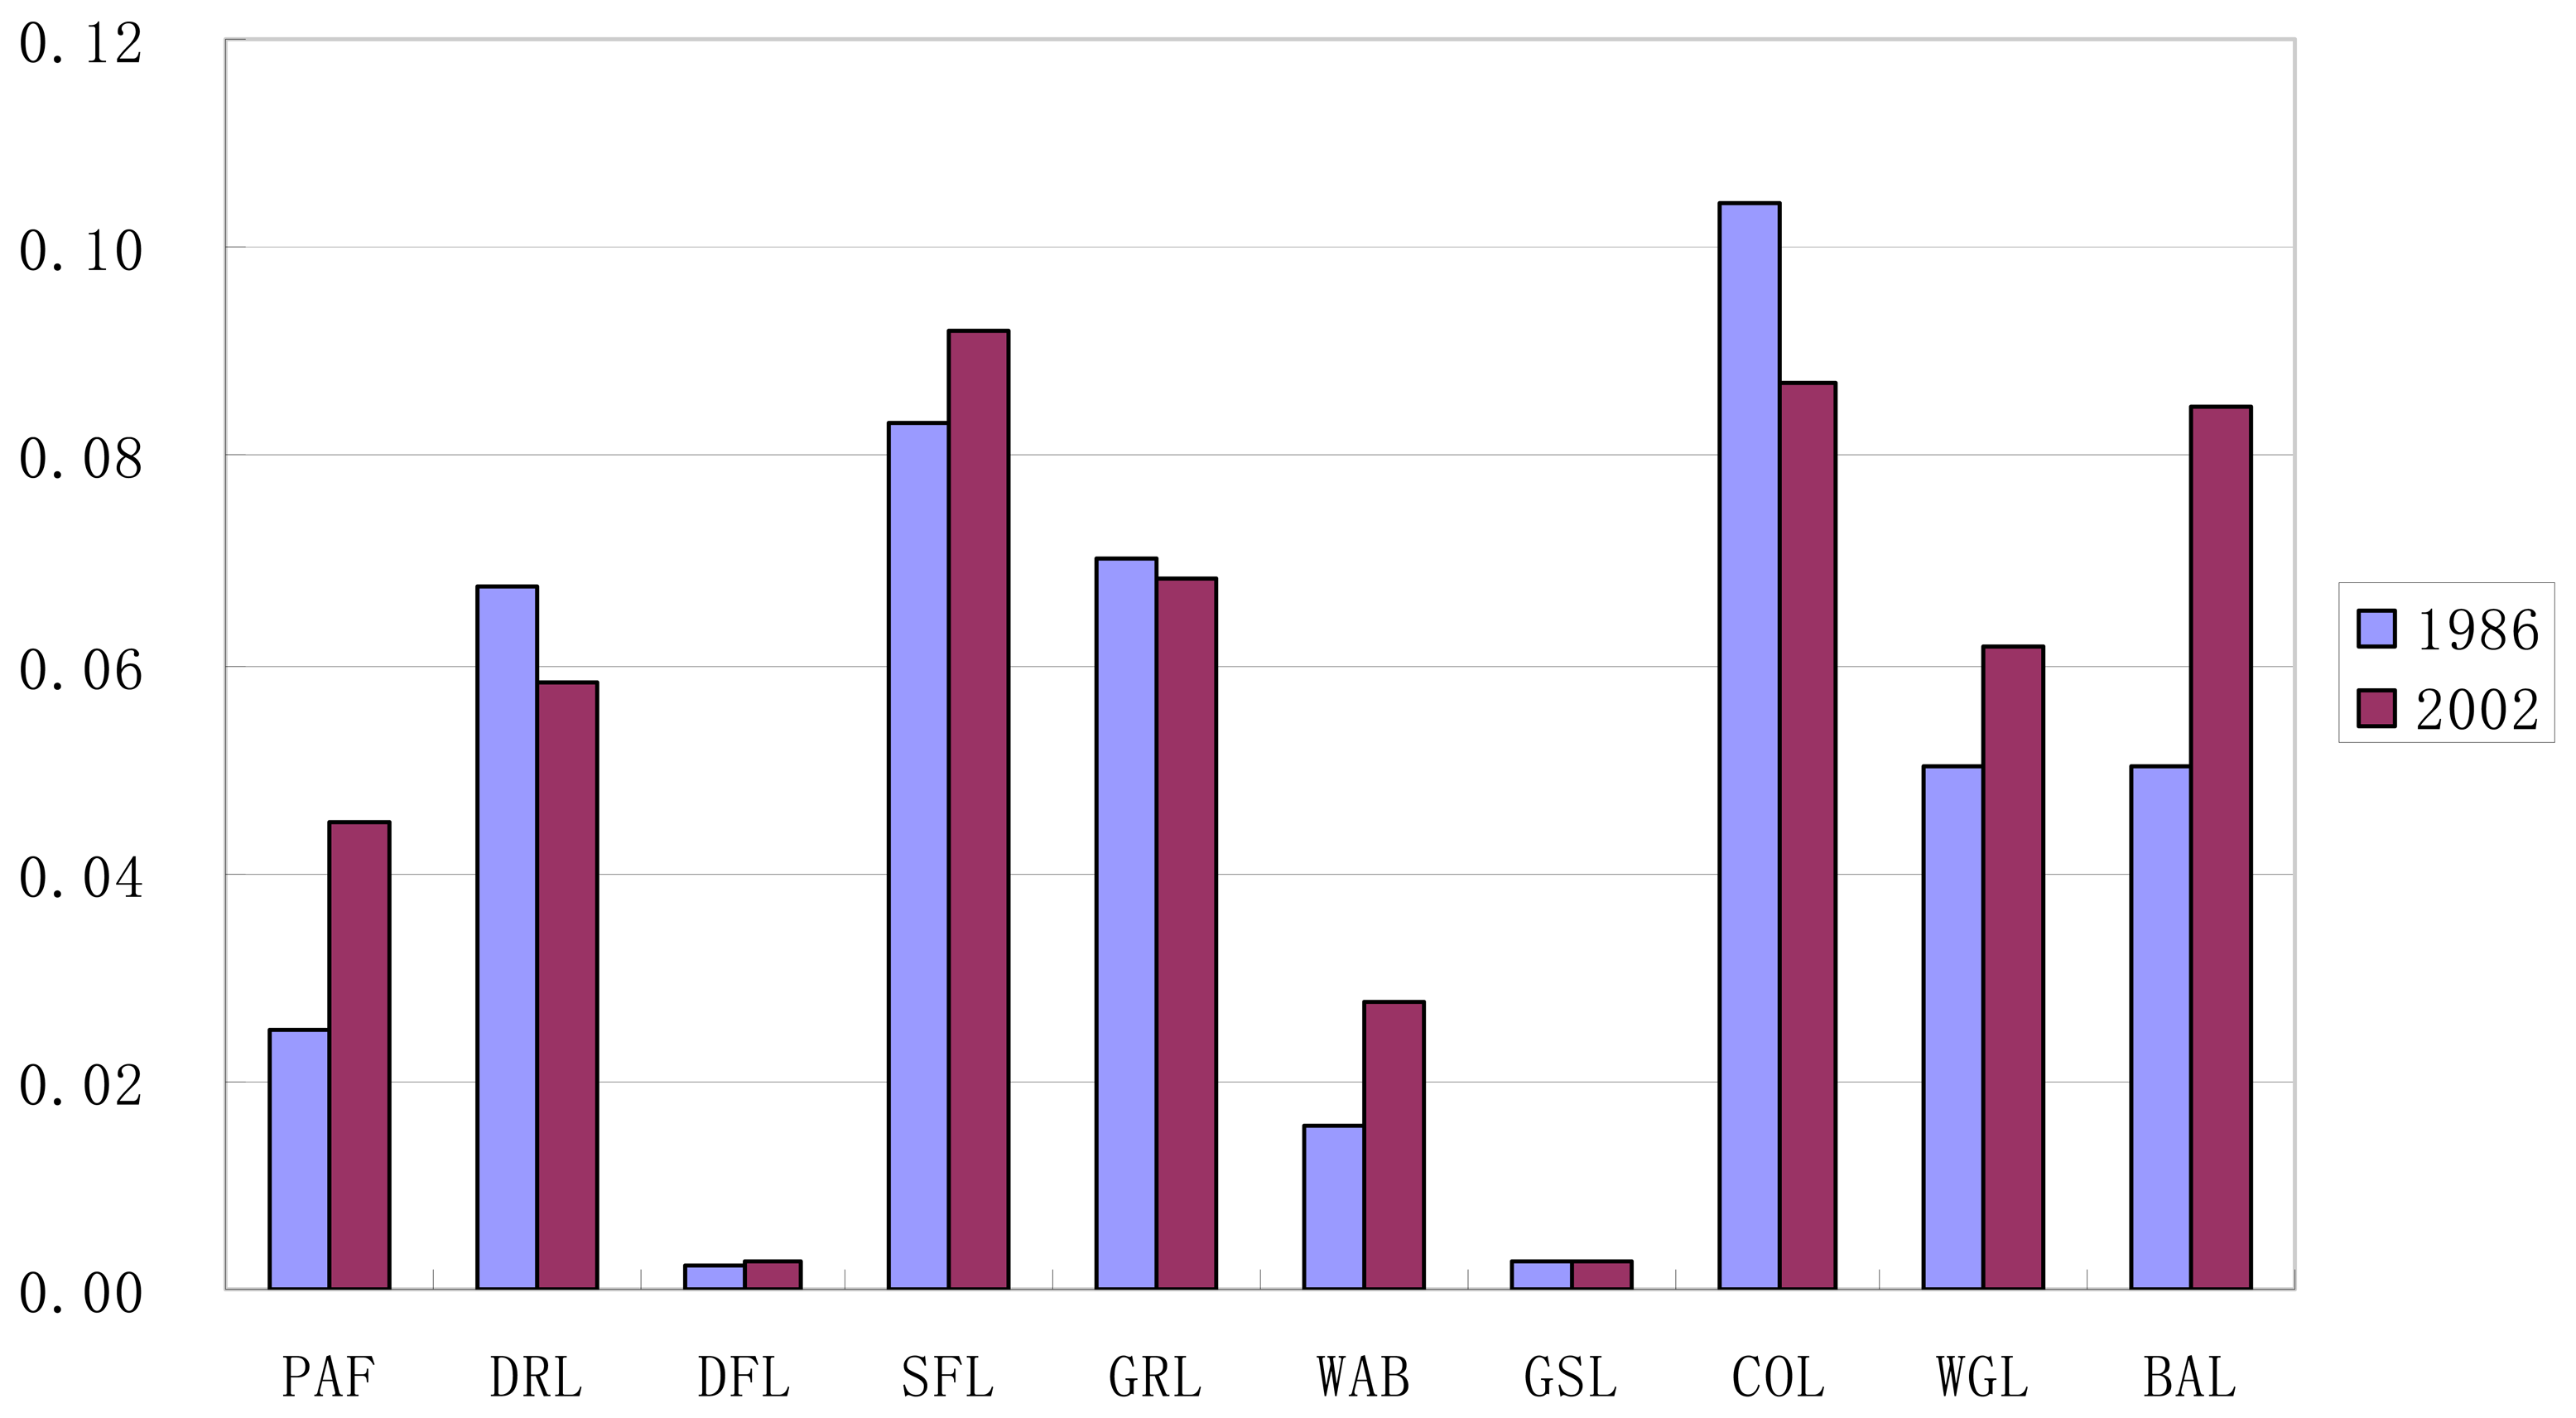
4.4.1 Change of landscape diversity
4.4.2 Change of spatial configuration
4.4.3 Change of patch shape
5. Conclusions
Acknowledgments
References
- Dong, Y.; Forster, B.; Ticehurst, C. Radar backscatter analysis for urban environments. Int. J. Remote Sens. 1997, 18, 1351–1364. [Google Scholar]
- Dewan, A.M.; Yamaguchi, Y. Using remote sensing and GIS to detect and monitor land use and land cover change in Dhaka Metropolitan of Bangladesh during 1960–2005. Environ. Monit. Assess. 2008. [Google Scholar] [CrossRef]
- Prakash, A.; Gupta, R.P. Land-use mapping and change detection in a coal mining area, a case study in the Jharia coalfield, India. Int. J. Remote Sens. 1998, 19, 391–410. [Google Scholar]
- Fazal, S. Urban expansion and loss of agricultural land - a GIS based study of Saharanpur City, India. Environ. Urban. 2000, 12, 133–149. [Google Scholar]
- Weng, Q.H. Land use change analysis in the Zhujiang Delta of China using satellite remote sensing, GIS and stochastic modeling. J. Environ. Manag. 2002, 64, 273–284. [Google Scholar]
- Herold, M.; Goldstein, N.C.; Clarke, K.C. The spatiotemporal form of urban growth: measurement, analysis and modeling. Remote Sens. Environ. 2003, 86, 286–302. [Google Scholar]
- Nagendra, H.; Munroe, D.K.; Southworth, J. From pattern to process: landscape fragmentation and the analysis of land use/land cover change. Agr. Ecosyst. Environ. 2004, 101, 111–115. [Google Scholar]
- Gao, J.; Liu, Y.S.; Chen, Y.F. Land cover changes during agrarian restructuring in Northeast China. Appl. Geogr. 2006, 26, 312–322. [Google Scholar]
- Güler, M.; Yomrahođlu, T.; Reis, S. Using landsat data to determine land use/land cover changes in Samsun, Turkey. Environ. Monit. Assess. 2007, 127, 155–167. [Google Scholar]
- Long, H.L.; Liu, Y.S.; Wu, X.Q.; Dong, G.H. Spatio-temporal dynamic patterns of farmland and rural settlements in Su-Xi-Chang region: implications for building a new countryside in coastal China. Land Use Policy 2008. [Google Scholar] [CrossRef]
- Foley, J.; DeFries, R.; Asner, G.P.; Barford, C.; Bonan, G.; Carpenter, S.R.; Chapin, F.S.; Coe, M.T.; Daily, G.C.; Gibbs, H.K.; Helkowski, J.H.; Hollaway, T.; Howard, E.A.; Kucharik, C.J.; Monfreda, C.; Patz, J.A.; Prentice, I.C.; Ramankutty, N.; Snyder, P.K. Global consequences of land use. Science 2005, 309, 570–574. [Google Scholar]
- Cai, Y.L. A study on land use/ cover change: the need for a new integrated approach. Geograph. Res. 2001, 20, 645–652, in Chinese. [Google Scholar]
- Zhao, G.X.; Lin, G.; Warner, T. Using Thematic Mapper data for change detection and sustainable use of cultivated land: a case study in the Yellow River delta, China. International J. Remote Sens. 2004, 25, 2509–2522. [Google Scholar]
- Muttitanon, W.; Tripathi, N.K. Land use/cover changes in the coastal zone of Bay Don Bay, Thailand using Landsat 5 TM data. Int. J. Remote Sens. 2005, 26, 2311–2323. [Google Scholar]
- Dirk, E.; Andreas, L.; Bernd, Z. Effects of land-use change on deposition and composition of organic matter in Frickenhauser See, northern Bavaria, Germany. Sci. Total Environ. 2006, 369, 178–187. [Google Scholar]
- Vågen, T.-G. Remote sensing of complex land use change trajectories-a case study from the highlands of Madagascar. Agr. Ecosyst. Environ. 2006, 115, 219–228. [Google Scholar]
- Shalaby, A.; Tateishi, R. Remote sensing and GIS for mapping and monitoring land cover and land use changes in the Northwestern coastal zone of Egypt. Appl. Geogr. 2007, 27, 28–41. [Google Scholar]
- Kesgin, B.; Nurlu, E. Land cover changes on the coastal zone of Candarli Bay, Turkey using remotely sensed data. Environ. Monit. Assess. 2008. [Google Scholar] [CrossRef]
- Yang, X.; Lo, C.P. Using a time series of satellite imagery to detect land use and land cover changes in the Atlanta, Georgia Metropolitan Area. Int. J. Remote Sens. 2002, 23, 1775–1798. [Google Scholar]
- Yuan, F.; Sawaya, K.E.; Loeffelholz, B.; Bauer, M.E. Land cover classification and change analysis of the Twin Cities (Minnesota) metropolitan area by multitemporal Landsat remote sensing. Remote Sens. Environ. 2005, 98, 317–328. [Google Scholar]
- Wu, Q.; Li, H.Q.; Wang, R.S.; Paulussen, J.; He, Y.; Wang, M.; Wang, B.H.; Wang, Z. Monitoring and predicting land use change in Beijing using remote sensing and GIS. Landscape Urban Plan. 2006, 78, 322–333. [Google Scholar]
- Fan, F.L.; Weng, Q.H.; Wang, Y. P. Land use and land cover change in Guangzhou, China, from 1998 to 2003, based on Landsat TM/ETM+ Imagery. Sensors 2007, 7, 1323–1342. [Google Scholar]
- Xie, Y.C.; Fang, C.L.; Lin, C.S.; Gong, H.M.; Qiao, B. Tempo-spatial patterns of land use changes and urban development in globalization China: a study of Beijing. Sensors 2007, 7, 2881–2907. [Google Scholar]
- Weng, Q. A remote sensing-GIS evaluation of urban expansion and its impact on surface temperature in the Zhujiang Delta, China. Int. J. Remote Sens. 2001, 22, 1999–2014. [Google Scholar]
- Seto, K.C.; Woodcock, C.E. Monitoring land use change in the Pearl River Delta using Landsat TM. Int. J. Remote Sens. 2002, 23, 1985–2004. [Google Scholar]
- Alphan, H. Land use change and urbanization in Adana, Turkey. Land Degrad. Dev. 2003, 14, 575–586. [Google Scholar]
- Mundia, C.N.; Aniya, M. Analysis of land use/cover changes and urban expansion of Nairobi city using remote sensing and GIS. Int. J. Remote Sens. 2005, 26, 2831–2849. [Google Scholar]
- Tang, Z.; Engel, B.A.; Pijanowski, B.C.; Lim, K.J. Forecasting land use change and its environmental impact at a watershed scale. J. Environ. Manage. 2005, 76, 35–45. [Google Scholar]
- Xiao, J.Y.; Shen, Y.J.; Ge, J.F.; Tateishi, R.; Tang, C.Y.; Liang, Y.Q.; Huang, Z.Y. Evaluating urban expansion and land use change in Shijiazhuang, China, by using GIS and remote sensing. Landscape Urban Plan. 2006, 75, 69–80. [Google Scholar]
- Long, H.L.; Tang, G.P.; Li, X.B.; Heilig, G.K. Socio-economic driving forces of land-use change in Kunshan, the Yangtze River Delta Economic Area of China. J. Environ. Manage. 2007, 83, 351–364. [Google Scholar]
- Long, H.L.; Wu, X.Q.; Wang, W.J.; Dong, G.H. Analysis of urban-rural land-use change during 1995-2006 and its policy dimensional driving forces in Chongqing, China. Sensors 2008, 8, 681–699. [Google Scholar]
- Jat, M.K.; Garg, P.K.; Khare, D. Monitoring and modeling of urban sprawl using remote sensing and GIS techniques. Int. J. Appl. Earth Obs. Geoinf. 2008, 10, 26–43. [Google Scholar]
- Sommer, S.; Hill, J.; Megier, J. The potential of remote sensing for monitoring rural land use changes and their effects on soil conditions. Agr. Ecosyst. Environ. 1998, 67, 197–209. [Google Scholar]
- Jorg, P.; Steffen, M. Assessment of changing agricultural land use: response of vegetation, ground-dwelling spiders and beetles to the conversion of arable land into grassland. Agriculture, Ecosystems & Environment 2003, 98, 169–181. [Google Scholar]
- Zhong, L.S.; Zhang, Y.M.; Zhao, S.D.; Karl, E.R. Land use change and its ecological effect in Qian'an County of Jilin Province. J. Geogr. Sci. 2003, 13, 423–428. [Google Scholar]
- Zhou, W.; Yan, Y.; Zeng, Y.Y.; Zhong, X.H. Land use change and its effect on environment based on farmers' behaviors: a case study in agricultural areas of Tibet, China. Wuhan Univer. J. Nat. Sci. 2005, 10, 767–773. [Google Scholar]
- Ali, A.M.S. Rice to shrimp: land use/land covers changes and soil degradation in southwestern Bangladesh. Land Use Policy 2006, 23, 421–435. [Google Scholar]
- Mottet, A.; Ladet, S.; Coque, N.; Gibon, A. Agricultural land-use change and its drivers in mountain landscapes: a case study in the Pyrenees. Agr. Ecosyst. Environ. 2006, 114, 296–310. [Google Scholar]
- Imbernon, J. Pattern and development of land-use changes in the Kenyan highlands since the 1950s. Agr. Ecosyst. Environ. 1999, 76, 67–73. [Google Scholar]
- Mira, O. Land use changes in Central Kenya from the 1950s- A possibility to generalize? GeoJournal 2000, 51, 203–209. [Google Scholar]
- Jia, B.; Zhang, Z.; Ci, L.; Ren, Y.; Pan, B.; Zhang, Z. Oasis land-use dynamics and its influence on the oasis environment in Xinjiang, China. J. Arid Environ. 2004, 56, 11–26. [Google Scholar]
- Li, Z.; Li, X.; Wang, Y.; Ma, A.; Wang, J. Land-use change analysis in Yulin prefecture, Northwestern China using remote sensing and GIS. Int. J. Remote Sens. 2004, 25, 5691–5703. [Google Scholar]
- Wang, G.X.; Zhang, Y.; Liu, G.M.; Chen, L. Impact of land-use change on hydrological processes in the Maying River basin, China. Sci. China (Series D) 2006, 49, 1098–1110. [Google Scholar]
- Wang, G.X.; Liu, J.Q.; Kubota, J.; Chen, L. Effects of land-use changes on hydrological processes in the middle basin of the Heihe River, northwest China. Hydrol. Process. 2006, 21, 1370–1382. [Google Scholar]
- Qi, S.Z.; Li, X.Y.; Duan, H.P. Oasis land-use change and its environmental impact in Jinta Oasis, arid northwestern China. Environ. Monit. Assess. 2007, 134, 313–320. [Google Scholar]
- Luo, H.L.; Zhu, B.; Chen, G.J.; Gao, M.R. Effects of land use change on eco-environment in Hilly Area of Central Sichuan Basin: a case study of Yanting County, Sichuan Province. Wuhan Univer. J. Nat. Sci. 2003, 8, 981–986. [Google Scholar]
- Yang, Z.S.; Liang, L.H.; Liu, Y.S.; He, Y.M. Land use change during 1960-2000 period and its eco-environmental effects in the middle and upper reaches of the Yangtze River: a case study in Yiliang County, Yunnan, China. J. Mt. Sci. 2004, 1, 250–263. [Google Scholar]
- Shi, Z.H.; Chen, L.D.; Hao, J.P.; Wang, T.W.; Cai, C.F. The effects of land use change on environmental quality in the red soil hilly region, China: a case study in Xianning County. Environ. Monit. Assess. 2008. [Google Scholar] [CrossRef]
- Munyati, C. Wetland change detection on the Kafue Flats, Zambia by classification of a multitemporal remote sensing image dataset. Int. J. Remote Sens. 2000, 21, 1787–1806. [Google Scholar]
- Houhoulis, P.F.; Michener, W.K. Detecting wetland change: a rule-based approach using NWI and SPOT-XS data. Photogramm. Eng. Remote Sens. 2000, 66, 205–211. [Google Scholar]
- Weng, Q. Human-environment interactions in agricultural land use in a South China's wetland region: a study on the Zhujiang Delta in the Holocene. GeoJournal 2000, 51, 191–202. [Google Scholar]
- Zhou, J.; Tachibana, H. Land use/cover changes in Hokkaido wetlands, Yufutsu Mires as a case study. Reports of Taisetsuzan Institute of Science 2003, 37, 23–35. [Google Scholar]
- Wu, W.B.; Yao, J.; Kang, T.J. Study on land use changes of the coal mining area based on TM image. J. Coal Sci. Eng. (China) 2008, 14, 287–290. [Google Scholar]
- Collins, J.B.; Woodcoch, C.E. An assessment of several linear change detection techniques for mapping forest mortality using multitemporal Landsat TM data. Remote Sens. Environ. 1996, 56, 66–77. [Google Scholar]
- Dai, X. L.; Khorram, S. Remotely sensed change detection base on artificial neural networks. Photogramm. Eng. Remote Sens. 1999, 65, 1187–1194. [Google Scholar]
- Mas, J.F. Monitoring land cover changes: a comparison of change detection techniques. Int. J. Remote Sens. 1999, 20, 139–152. [Google Scholar]
- Liu, J.Y.; Liu, M.L.; Zhuang, D.F.; Zhang, Z.X.; Deng, X.Z. Study on spatial pattern of land-use change in China during 1995-2000. Sci. China (Series D) 2003, 46, 373–378. [Google Scholar]
- Zhu, H.Y.; Li, X.B.; He, S.J.; Zhang, M. Land use change in Bohai Rim: a spatial-temporal analysis. J. Geogr. Sci. 2001, 11, 305–312. [Google Scholar]
- Xian, W.; Shao, H.Y.; Zhou, W.C. Process of land use/ land cover change in the area of middle and lower reach of Jialingjiang River. Progr. Geogr. 2005, 24, 114–121, in Chinese. [Google Scholar]
- Grimm, N.B.; Faeth, S.H.; Golubiewski, N.E.; Redman, C.L.; Wu, J.G.; Bai, X.M.; Briggs, J.M. Global change and the ecology of cities. Science 2008, 319, 756–760. [Google Scholar]
- Deng, X.Z.; Huang, J.K.; Rozelle, S.; Uchida, E. Growth, population and industrialization, and urban land expansion of China. J. Urban Econ. 2008, 63, 96–115. [Google Scholar]
- Seto, K.C.; Kaufmann, R.K. Modeling the drivers of urban land use change in the Pearl River Delta, China: integrating remote sensing with socio-economic data. Land Econ. 2003, 79, 106–121. [Google Scholar]
- Weng, Q.H.; Yang, S.H. An approach to evaluation of sustainability for Guangzhou's urban ecosystem. Int. J. Sustain. Dev. World Ecol. 2003, 10, 69–81. [Google Scholar]
- Weng, Q.H.; Yang, S.H. Managing the adverse thermal effects of urban development in a densely populated Chinese city. J. Environ. Manage. 2004, 70, 145–156. [Google Scholar]
- Tan, M.H.; Li, X.B.; Xie, H.; Lu, C.H. Urban land expansion and arable land loss in China – a case study of Beijing–Tianjin–Hebei region. Land Use Policy 2005, 22, 187–196. [Google Scholar]
- Xu, J.C.; Wilkes, A. Biodiversity impact analysis in northwest Yunnan, Southwest China. Biodivers. Conserv. 2004, 13, 959–983. [Google Scholar]
- Li, H.; Wu, J. Use and misuse of landscape indices. Landscape Ecol. 2004, 19, 389–399. [Google Scholar]
- Fu, B.J. The spatial pattern analysis of agricultural landscape in the loess area. Acta Ecol. Sinica 1995, 15, 113–120, in Chinese. [Google Scholar]
- Gustafson, E.J. Quantifying landscape spatial pattern: what is the state of the art? Ecosystems 1998, 1, 143–156. [Google Scholar]
- Hargis, C.D; Bissonette, J.A.; David, J.L. The behavior of landscape metrics commonly used in the study of habitat fragmentation. Landscape Ecol. 1998, 13, 167–186. [Google Scholar]
- Hess, G.R. Pattern and error in landscape ecology: a commentary. Landscape Ecol. 1994, 9, 3–5. [Google Scholar]
- Shao, G.; Liu, D.; Zhao, G. Relationships of image classification accuracy and variation of landscape statistics. Can. J. Remote Sens. 2001, 27, 33–43. [Google Scholar]
- Shao, G.; Wu, J. On the accuracy of landscape pattern analysis using remote sensing data. Landscape Ecol. 2008, 23, 505–511. [Google Scholar]


| Land use type | Number of patches | Area ratio (%) | Mean patch size(hm2) | Mean Patch Perimeter (km) | ||||
|---|---|---|---|---|---|---|---|---|
| 1986 | 2002 | 1986 | 2002 | 1986 | 2002 | 1986 | 2002 | |
| PAF | 750 | 1,633 | 3.99 | 4.86 | 39.73 | 22.25 | 5.8411 | 4.0144 |
| DRL | 2,751 | 2,713 | 5.44 | 6.21 | 14.79 | 17.12 | 3.4388 | 3.6950 |
| DFL | 1,108 | 1,275 | 68.56 | 67.51 | 462.65 | 395.91 | 27.3465 | 23.7128 |
| SFL | 3,848 | 4,989 | 6.17 | 7.26 | 12.00 | 10.88 | 3.4942 | 3.6546 |
| GRL | 2,450 | 2,019 | 4.68 | 3.95 | 14.28 | 14.63 | 3.5825 | 3.2814 |
| WAB | 83 | 188 | 0.70 | 0.91 | 62.8 | 36.06 | 6.9958 | 4.0395 |
| GSL | 23 | 23 | 1.17 | 1.18 | 380.79 | 383.78 | 10.7739 | 10.693 |
| COL | 536 | 887 | 0.69 | 1.37 | 9.57 | 11.47 | 2.9125 | 3.0669 |
| WGL | 2,465 | 1,930 | 6.54 | 4.19 | 19.85 | 16.23 | 4.1566 | 3.5522 |
| BAL | 772 | 1,626 | 2.06 | 2.56 | 19.92 | 11.79 | 4.3692 | 3.0796 |
| Land use type in 1986 | Land use type in 2002 | ||||||||||
|---|---|---|---|---|---|---|---|---|---|---|---|
| PAF | DRL | DFL | SFL | GRL | WAB | GSL | COL | WGL | BAL | Total | |
| PAF | 18,104 | 3,265 | 1,703 | 427 | 162 | 406 | 0 | 3,009 | 2,051 | 1,388 | 30,515 |
| DRL | 3,848 | 17,215 | 11,059 | 3,341 | 2,205 | 104 | 0 | 466 | 2,713 | 653 | 41,604 |
| DFL | 8,652 | 10,697 | 449,050 | 33,296 | 7,708 | 367 | 0 | 524 | 7,970 | 6,082 | 524,346 |
| SFL | 2,402 | 2,935 | 21,230 | 14,652 | 1,340 | 175 | 0 | 429 | 3,662 | 363 | 47,188 |
| GRL | 11 | 573 | 15,745 | 1,263 | 14,445 | 104 | 0 | 0 | 1,156 | 2,495 | 35,792 |
| WAB | 17 | 20 | 18 | 2 | 1 | 5,212 | 0 | 31 | 22 | 30 | 5,353 |
| GSL | 0 | 0 | 13 | 7 | 2 | 2 | 8,902 | 0 | 3 | 21 | 8,950 |
| COL | 89 | 18 | 33 | 1 | 0 | 3 | 0 | 5,087 | 34 | 13 | 5,278 |
| WGL | 4,011 | 12,620 | 10,944 | 1,996 | 3,816 | 360 | 0 | 700 | 12,875 | 2,696 | 50,018 |
| BAL | 63 | 180 | 6,510 | 533 | 544 | 216 | 110 | 213 | 1,564 | 5,823 | 15,756 |
| Total | 37,197 | 47,523 | 516,305 | 55,518 | 30,223 | 6,949 | 9,012 | 10,459 | 32,050 | 19,564 | 764,800 |
| Township | LUC | Population Density (Person/Km2) | GDP per unit area (103 RMB/Km2) | Mean altitude (M) | Township | LUC | Populatin Density (Person/Km2) | GDP per unit area (103 RMB/Km2) | Mean altitude (M) |
|---|---|---|---|---|---|---|---|---|---|
| Baisha | 1.95 | 34.84 | 51.47 | 3,089.46 | Lashi | 1.94 | 110.98 | 223.80 | 2,691.51 |
| Baoshan | 2.63 | 19.43 | 20.28 | 3,033.73 | Liming | 1.27 | 14.80 | 20.35 | 3,034.76 |
| Dadong | 1.84 | 25.23 | 29.87 | 2,806.08 | Longpan | 1.82 | 36.00 | 62.45 | 3,014.71 |
| Daju | 2.17 | 21.21 | 50.34 | 2,990.7 | Longshan | 1.92 | 38.07 | 67.29 | 2,563.16 |
| Dayan | 3.34 | 4,564.47 | 7,084.01 | 2,477.06 | Ludian | 1.42 | 32.93 | 50.08 | 3,047.82 |
| Fengke | 2.60 | 22.66 | 23.27 | 2,615.18 | Mingyin | 2.05 | 23.04 | 26.10 | 2,565.85 |
| Huangshan | 1.80 | 101.59 | 318.90 | 2,727.11 | Qihe | 1.87 | 51.70 | 113.84 | 2,734.46 |
| Jinjiang | 1.28 | 45.73 | 61.87 | 2,133.98 | Renhe | 1.41 | 11.93 | 12.33 | 3,019.07 |
| Jinshan | 2.06 | 82.20 | 151.96 | 2,563.59 | Shigu | 2.22 | 52.75 | 134.93 | 2,640.82 |
| Jinzhuang | 1.89 | 39.66 | 102.97 | 2,607.28 | Shitou | 1.10 | 15.74 | 25.64 | 2,981.85 |
| Jiuhe | 1.67 | 78.84 | 115.43 | 2,661.21 | Tacheng | 0.98 | 34.09 | 56.98 | 2,770.73 |
| Judian | 0.99 | 53.20 | 94.85 | 2,636.71 | Tai'an | 1.72 | 31.27 | 35.82 | 2,830.62 |
© 2008 by the authors; licensee Molecular Diversity Preservation International, Basel, Switzerland. This article is an open access article distributed under the terms and conditions of the Creative Commons Attribution license (http://creativecommons.org/licenses/by/3.0/).
Share and Cite
Peng, J.; Wu, J.; Yin, H.; Li, Z.; Chang, Q.; Mu, T. Rural Land Use Change during 1986–2002 in Lijiang, China, Based on Remote Sensing and GIS Data. Sensors 2008, 8, 8201-8223. https://doi.org/10.3390/s8128201
Peng J, Wu J, Yin H, Li Z, Chang Q, Mu T. Rural Land Use Change during 1986–2002 in Lijiang, China, Based on Remote Sensing and GIS Data. Sensors. 2008; 8(12):8201-8223. https://doi.org/10.3390/s8128201
Chicago/Turabian StylePeng, Jian, Jiansheng Wu, He Yin, Zhengguo Li, Qing Chang, and Tianlong Mu. 2008. "Rural Land Use Change during 1986–2002 in Lijiang, China, Based on Remote Sensing and GIS Data" Sensors 8, no. 12: 8201-8223. https://doi.org/10.3390/s8128201