Imaging In Mice With Fluorescent Proteins: From Macro To Subcellular

AntiCancer, Inc., 7917 Ostrow Street, San Diego, CA 92111-3604, Surgery Dept., University of California, San Diego, 200 West Arbor Dr., San Diego, CA 92103-8220, USA
Sensors 2008, 8(2), 1157-1173; https://doi.org/10.3390/s8021157
Submission received: 15 January 2008
/
Accepted: 19 February 2008
/
Published: 22 February 2008
(This article belongs to the Special Issue Bioanalysis in Vivo/in Vitro)
Abstract
:Whole-body imaging with fluorescent proteins has been shown to be a powerful technology with many applications in small animals. Brighter, red-shifted proteins can make whole-body imaging even more sensitive due to reduced absorption by tissues and less scatter. For example, a new protein called Katushka has been isolated that is the brightest known protein with emission at wavelengths longer than 620 nm. This new protein offers potential for noninvasive whole-body macro imaging such as of tumor growth. For subcellular imaging, to observe cytoplasmic and nuclear dynamics in the living mouse, cancer cells were labeled in the nucleus with green fluorescent protein and with red fluorescent protein in the cytoplasm. The nuclear and cytoplasmic behavior of cancer cells in real time in blood vessels was imaged as they trafficked by various means or adhered to the vessel surface in the abdominal skin flap. During extravasation, real-time dual-color imaging showed that cytoplasmic processes of the cancer cells exited the vessels first, with nuclei following along the cytoplasmic projections. Both cytoplasm and nuclei underwent deformation during extravasation. Cancer cells trafficking in lymphatic vessels was also imaged. To noninvasively image cancer cell/stromal cell interaction in the tumor microenvironment as well as drug response at the cellular level in live animals in real time, we developed a new imageable three-color animal model. The model consists of GFP-expressing mice transplanted with the dual-color cancer cells. With the dual-color cancer cells and a highly sensitive small animal imaging system, subcellular dynamics can now be observed in live mice in real time. Fluorescent proteins thus enable both macro and micro imaging technology and thereby provide the basis for the new field of in vivo cell biology.
1. Introduction
Fluorescent proteins have revolutionized biological science. Green fluorescent protein (GFP) has been shown to be able to be genetically linked with almost any protein providing a permanent and heritable label in live cells to study protein function and location [1]. Many different colors of fluorescent proteins have now been produced in the laboratory or found in nature. With multiple colors, many processes can be visualized simultaneously in cells. Thus, cells can be multiply labeled for live imaging of processes that heretofore could be performed only on fixed and stained cells. What previously could only be seen on gels and blots, can now be visualized in real-time in living cells expressing fluorescent proteins. Our laboratory pioneered the use of fluorescent proteins for in vivo imaging from macro to subcellular [1-3].
2. Noninvasive Imaging
Whole-body imaging with fluorescent proteins depends in large part on the brightness of the protein. Whole-body imaging with fluorescent proteins has been shown to be able to quantitatively track tumor growth and metastasis (Figure 1), gene expression, angiogenesis, and bacterial infection [1] even at subcellular resolution depending on the position of the cells in the animal. Interference by skin autofluorescence is kept to a minimum with the use of proper filters. Very simple equipment such as an LED flashlight with a narrow-band filter and a bandpass emission filter can be used to whole-body image mice implanted with cells expressing fluorescent proteins [4] (Figure 2).
Whole-body imaging is more effective when the fluorescent protein emits at longer wavelengths which are absorbed less by tissues and by physiological molecules such as hemoglobin and are also less scattered [1].
Red-emitting fluorescent proteins were first described in the late 1990s. The first such protein was isolated and cloned from the coral Discosoma sp. obtained from an aquarium shop in Moscow [5] and termed Ds-Red. After extensive modification by mutagenesis, a very bright red protein was eventually isolated, termed DsRed-2 with an emission wavelength peak of 588. DsRed-2 has shown to be very enabling for whole-body imaging and has been used to non-invasively follow cancer metastasis in real time [6] in nude mice (Figure 1) as well as whole-body image dual-color models of tumors expressing DsRed-2 growing in transgenic GFP nude mice as hosts [7].
In 2004, a report appeared [8] describing a series of red-shifted proteins obtained by mutating DsRed. These proteins, termed mCherry, mRaspberry, mPlum, and mTomato, had emission maxima as long as 649 nm. However, these mutants have low quantum yields, thereby reducing their brightness.
A very bright, red-shifted variant has now been isolated with an excitation peak at 588 mm emission peak at 635 nm both of which are relatively non-absorbed by issues and homoglobin. After four cycles of random mutagenesis and further selection for bright, far-red-shifted proteins, Katushka was isolated. Katushka has many favorable properties in addition to its absorption and emission peaks including a rapid maturation time of 20 minutes. Importantly, an extinction coefficient of 65,000 M-1 cm-1 and quantum yield of 0.34, make Katushka the brightest fluorescent protein with an emission maximum beyond 620 nm. In cells, Katushka demonstrated no visible aggregates or other toxic effects [9].
2.1 Non-Invasive Cellular Imaging of Cancer Cell-Stromal Cell Interaction [10]
Cancer cells coexist in a complex association with host-stromal tissue cells. The stroma provides the vascular supply to the tumor in the angiogenesis process as well as many other cell types and functions. The factors that regulate the development of the stromal elements, as well as the influences these constituents have on the tumor, are poorly understood. The lack of information about the interaction between cancer cells and stroma can be attributed in part to lack of suitable models [11]. Tumor progression is a multistep process accompanied by the accumulation of mutations in cancer cells. However, it is now becoming clear that the tumor microenvironment is also critical for malignancy, which is in part the product of interaction between different cancer and host cell types [12].
The heterogeneous and structurally complex nature of the interactive tumor microenvironment is little understood. The relative amount of stroma and its composition vary considerably from tumor to tumor and vary within a tumor over the course of tumor progression. The interaction between cancer cells and stromal cells largely determines the phenotype of the tumor. For example, recent studies have shown that the growth, invasiveness, and angiogenesis of human breast tumor xenografts in mice depend on the presence of stromal fibroblasts [13].
The tumor microenvironment is a potential therapeutic target. Advantages to targeting the stroma cells are that the cells are genetically stable unlike cancer cells and are therefore less likely to develop drug resistance [14, 15]. For example, anti–vascular endothelial growth factor antibodies, which inhibit formation of new blood vessels in the tumor, are used to treat colorectal cancer [16].
To noninvasively visualize cellular and subcellular events in the tumor microenvironment in real time in the live mouse, we used the Olympus IV100 laser scanning microscope with a 0.3-mm-diameter stick objective that is up to 2 cm in length. The system allows an imaging depth that extends to at least 200 μm. This novel imaging system, coupled with the use of the cancer cells labeled in the nucleus with GFP and RFP in the cytoplasm (Figure 3) and a transgenic GFP or RFP mouse as the host (Figure 5), has enabled noninvasive in vivo imaging of the cancer and stromal cells in the tumor microenvironment at the subcellular level. Three-color whole-body imaging of the two-color cancer cells interacting with the GFP-expressing stromal cells was carried out. In this model, drug response of both cancer and stromal cells in the intact live animal was also imaged in real time. Various in vivo phenomena of tumor-host interaction and cellular dynamics were imaged, including mitotic and apoptotic cancer cells, stromal cells intimately interacting with the cancer cells, tumor vasculature, and tumor blood flow (Fig. 4). This new model system enabled the first cellular and subcellular images of unperturbed tumors in the live intact animal. New visible real-time targets for novel anticancer agents are provided in this model, including the color-coded interacting cancer and stromal cells, tumor vasculature, and blood flow. This imageable model should lead to many new insights of the tumor microenvironment [10].
The ability to image nuclear-cytoplamic dynamics in vivo is a major advance in our ability to understand the proliferation, quiescence, dormancy, trafficking, and death of cancer cells in the living animal. With this powerful technology, we will be able to visualize in vivo the most fundamental properties of cancer, including the reversible transition between cancer-cell proliferation and quiescence, how prolonged quiescence may lead to dormancy, the dynamics of cell death and the nuclear-cytoplasmic dynamics of cancer-cell spread. Most importantly, we will have an opportunity to visualize, in real time in the live animal, the activity of novel drugs on these processes as well as how drugs induce cell death at the subcellular level. With this technology, we can expect to discover new classes of drugs for cancer.
2.2 Method of Choice for Whole-Body Imaging
The features of fluorescent-protein-based imaging, such as a very strong and stable signal enable noninvasive whole-body imaging down to the subcellular level [10] (Figure 3), especially with red-shifted proteins, make it far superior to luciferase-based imaging. Luciferase-based imaging, with its very weak signal [17], precluding image acquisition and allowing only photon counting with pseudocolor-generated images, has very limited applications [18]. For example, cellular imaging in vivo is not possible with luciferase. The dependence on circulating luciferin makes the signal from luciferase imaging unstable [18]. The one possible advantage of luciferase-based imaging is that no excitation light is necessary. However, far-red absorbing proteins such as Katushka greatly reduce any problems with excitation, even in deep tissues, as shown by Shcherbo et al. [9].
Proteins such as Katushka [9] as well as photo-activatible [19] and photoconvertible fluorescent proteins [20], provide powerful tools for future whole-body imaging experiments. Imaging instrumentation such as these with variable magnification [21] or scanning lasers [10] and multiphoton microscopy [22] make fluorescent proteins tools of choice for whole-body imaging. Whole-body imaging with fluorescent proteins can now reach the subcellular level using cells labeled in the nucleus with GFP and RFP in the cytoplasm [10]. However, there are misconceptions in the literature suggesting fluorescent protein-based imaging is inferior to luciferase [23-25]. The results described here should greatly clarify this subject.
3. Subcellular Imaging of Cancer Cell Trafficking In Vivo
Cancer cells that escape from the primary site into the blood circulation eventually flow to the capillaries of the organs of the body. In vivo video microscopy has shown that both lung and liver capillaries are very efficient at arresting the flow of cancer cells. Most circulating cancer cells arrest by size restriction. Capillaries are small, typically 3 to 8 μm in diameter. Capillaries allow the passage of RBC which average 7 μm in diameter and are highly deformable. However, many cancer cells are large, being 20 μm or more in diameter. Flow or arrest in capillaries is determined by physical factors, such as the relative sizes of the cells and the capillaries, the blood pressure in the organ and the deformability of the cell [26]. Cancer cells can, under certain conditions, undergo adhesive arrest in the capillary vessels that are larger than the cell diameter.
With a color CCD camera, we could observe highly elongated cancer cells and nuclei in capillaries in the skin flap in living mice (Figure 6). The migration velocities of the cancer cells in the capillaries were measured by capturing images of the dual-color fluorescent cells over time. The cells and nuclei in the capillaries elongated to fit the width of these vessels. The average length of the major axis of the cancer cells in the capillaries increased to approximately four times their normal length. The nuclei increased their length 1.6 times in the capillaries. Cancer cells in capillaries over 8 μm in diameter could migrate up to 48.3 μm/hour. The data suggests that the minimum diameter of capillaries where cancer cells are able to migrate is approximately 8 μm. The use of the dual-color cancer cells differentially labeled in the cytoplasm and nucleus and associated fluorescent imaging provide a powerful tool to understand the mechanism of cancer cell migration and deformation in small vessels [27].
3.1 Real Time Imaging of Nuclear-Cytoplasmic Dynamics of Trafficking and Extravasating Cancer Cells
Using the dual-colored cancer cells and a highly sensitive macroimaging/microimaging system, the Olympus OV100, we developed real-time dynamic subcellular imaging of cancer cell trafficking in live mice. We used this imaging technology to visualize the cytoplasmic and nuclear dynamics of intravascular tumor cell migration and extravasation in live mice [21].
Dual-color cancer cells were injected by a vascular route in an abdominal skin flap in nude mice. The mice were imaged with the Olympus OV100 which has a sensitive CCD camera and five objective lenses, parcentered and parfocal, enabling imaging from macrocellular to subcellular. We observed the nuclear and cytoplasmic behavior of cancer cells in real time in blood vessels as they trafficking by various means or adhered to the vessel surface in the abdominal skin flap (Figure 7). During extravasation, real-time dual-color imaging showed that cytoplasmic processes of the cancer cells exited the vessels first, with nuclei following along the cytoplasmic projections (Figure 8). Both cytoplasm and nuclei underwent deformation during extravasation. Different cancer cell lines seemed to strongly vary in their ability to extravasate. With the dual-color cancer cells and the highly sensitive small animal imaging system described here, the subcellular dynamics of cancer metastasis can now be observed in live mice in real time [21].
3.2 Imaging Quiescence, Proliferation, and Cell Death in Blood Vessels
We have observed the induction of intravascular proliferation, extravasation, and colony formation by cancer cells, critical steps of metastasis, by pretreatment of host mice with the commonly-used chemotherapy drug cyclophosphamide. In contrast, in the unpretreated mice, most cancer cells remained quiescent in vessels without extravasation. HT1080 human fibrosarcoma cells, labeled in the nucleus with GFP and RFP in the cytoplasm, were injected into the epigastric cranialis vein of nude mice. Twenty-four hours before cancer cell injection, cyclophosphamide was administered i.p. Double-labeled cancer cells were imaged at the cellular level in live mice with the Olympus OV100. Cyclophosphamide appeared to interfere with a host process that inhibits intravascular proliferation, extravasation, and extravascular colony formation. Cyclophosphamide does not directly affect the cancer cells since cyclophosphamide has been cleared by the time the cancer cells were injected. These results demonstrate an important unexpected “opposite effect” of chemotherapy that enhances critical steps in malignancy rather than inhibiting them, suggesting that certain current approaches to cancer chemotherapy should be modified [28].
3.3 Imaging of Nuclear-Cytoplasmic Dynamics, Proliferation, and Cell Death of Cancer Cells in the Portal Vein Area
We have visualized the early trafficking of dual-colored cancer cells, labeled with GFP in the nucleus and RFP in the cytoplasm, injected into the portal vein of nude mice. Human HCT-116 colon cancer and mouse mammary tumor (MMT) cells were injected in the portal vein of nude mice. Both cell lines were labeled with GFP in the nucleus and RFP in the cytoplasm. The cells were observed intravitally in the liver at the single-cell level using the Olympus OV100. Most HCT-116-GFP-RFP cells remained in sinusoids near peripheral portal veins. Only a small fraction of the cancer cells invaded the lobular area. Extensive clasmocytosis (destruction of the cytoplasm) of the HCT-116-GFP-RFP cells occurred within 6 hours. The number of apoptotic cells rapidly increased within the portal vein within 12 hours of injection. Apoptosis was readily visualized in the dual-color cells by separation of nucleus and cytoplasm (clasmocytosis). The data suggest rapid death of HCT-116-GFP-RFP cells in the portal vein. In contrast, dual-color MMT-GFP-RFP cells injected into the portal vein mostly survived in the liver of nude mice 24 hours after injection. Many surviving MMT-GFP-RFP cells showed invasive figures with cytoplasmic protrusions. The cells grew aggressively and formed colonies in the liver. However, when the host mice were pretreated with cyclophosphamide, the HCT-116-GFP-RFP cells also survived and formed colonies in the liver after portal vein injection. These results suggest that a cyclophosphamide-sensitive host cellular system attacked the HCT-116-GFP-RFP cells but could not effectively kill the MMT-GFP-RFP cells [29].
3.4 Imaging trafficking of cancer cells in lymphatic vessels
The major pathways of cancer cell dissemination are the lymphatic system and the circulatory system. However, the role of the lymphatic system in cancer metastasis is less well understood compared with the circulatory system [30].
We have shown real-time imaging of cancer cell trafficking in lymphatic vessels. Cancer cells labeled with both GFP in the nucleus and RFP in the cytoplasm were injected into the inguinal lymph node of nude mice. The labeled cancer cells trafficked through lymphatic vessels where they were imaged via a skin flap in real time at the cellular level until they entered the axillary lymph node. The bright fluorescence of the cancer cells and the real-time microscopic imaging capability of the Olympus OV100 small-animal imaging system enabled imaging of the trafficking cancer cells in the lymphatics. Using this imaging technology, we investigated the role of pressure on tumor-cell shedding into lymphatic vessels. Pressure was generated by placing 25- and 250-g weights for 10 s on the bottom surface of a tumor-bearing footpad. Tumor cell fragments, single cells, and emboli shed from the footpad tumor were easily distinguished with the labeled cells and OV100 imaging system. Increasing pressure on the tumor increased the numbers of shed cells, fragments, and emboli (Figure 9). Pressure also deformed the shed emboli, increasing their maximum major axis. Imaging lymphatic trafficking of cancer cells can reveal critical steps of lymph node metastasis [36].
4. Conclusions
The features of fluorescent proteins have enabled the development of powerful in vivo imaging technology. Non-invasive imaging with fluorescent proteins has enabled the real-time tracking of tumors and metastasis at the macro level. Double labeling of cells with GFP in the nucleus and RFP in the cytoplasm and high resolution small animal imaging systems have enabled single-cell and even subcellular imaging. Subcellular imaging has been achieved non-invasively for superficial cells and via skin flaps for deeper cells. Cancer-cell trafficking through the cardiovascular and lymphatic system is the main means of cancer spread throughout the body. Labeling of cells with different color fluorescent proteins in the nucleus and cytoplasm and powerful imaging technologies have enabled the real-time visualization of the nuclear-cytoplasmic dynamics including mitosis and apoptosis. We have been able to visualize the extreme deformation cancer cells undergo in their cytoplasm and to some extent in their nucleus to traffick in narrow vessels and to extravasate. We have also seen the high rate of cell death among trafficking cancer cells perhaps due to host cells which have the intrinsic capability to kill tumor cells. Cancer-cell shedding in lymphatic vessels is due in part to the interstitial pressure of the tumor itself. With the imaging technologies described here essentially any in vivo process can be imaged enabling the new field of in vivo cell biology [31]. Recent applications of the technology described here includes fluorescent proteins with cell-cycle specific proteins such that the cells change color from red to green as they transit from the G1 to S phases [37]. Another recent application is the combinatorial expression of a series of four different color fluorescent proteins resulting in at least 90 different colors of cells in the brain such that the lineage of each can be traced. The technique has been called “Brainbow” [38].
References
- Hoffman, R.M. The multiple uses of fluorescent proteins to visualize cancer in vivo. Nat. Rev. Cancer 2005, 5, 796–806. [Google Scholar]
- Chishima, T.; Miyagi, Y.; Wang, X.; Yamaoka, H.; Shimada, H.; Moossa, A.R.; Hoffman, R.M. Cancer invasion and micrometastasis visualized in live tissue by green fluorescent protein expression. Cancer Res. 1997, 57, 2042–2047. [Google Scholar]
- Yang, M.; Baranov, E.; Jiang, P.; Sun, F-X.; Li, X-M.; Li, L.; Hasegawa, S.; Bouvet, M.; Al-Tuwaijri, M.; Chishima, T.; Shimada, H.; Moossa, A.R.; Penman, S.; Hoffman, R.M. Whole-body optical imaging of green fluorescent protein-expressing tumors and metastases. Proc. Natl. Acad. Sci. USA 2000, 97, 1206–1211. [Google Scholar]
- Yang, M.; Luiken, G.; Baranov, E.; Hoffman, R.M. Facile whole-body imaging of internal fluorescent tumors in mice with an LED flashlight. BioTechniques 2005, 39, 170–172. [Google Scholar]
- Matz, M.V.; Fradkov, A.F.; Labas, Y.A.; Savitsky, A.P.; Zaraisky, A.G.; Markelov, M.L.; Lukyanov, S.A. Fluorescent proteins from nonbioluminescent Anthozoa species. Nat. Biotechnol. 1999, 17, 969–973. [Google Scholar]
- Katz, M.H.; Li, L.; Tsuji, K.; Moossa, A.R.; Katsuoka, K.; Hoffman, R.M.; Bouvet, M. A novel red fluorescent protein orthotopic pancreatic cancer model for the preclinical evaluation of chemotherapeutics. J. Surg. Res. 2003, 113, 151–160. [Google Scholar]
- Yang, M.; Li, L.; Jiang, P.; Moossa, A.R.; Penman, S.; Hoffman, R.M. Dual-color fluorescence imaging distinguishes tumor cells from induced host angiogenic vessels and stromal cells. Proc. Natl. Acad. Sci. USA 2003, 100, 14259–14262. [Google Scholar]
- Shaner, N.C.; Campbell, R.E.; Steinbach, P.A.; Giepmans, B.N.; Palmer, A.E.; Tsien, R.Y. Improved monomeric red, orange and yellow fluorescent proteins derived from Discosoma sp. red fluorescent protein. Nat. Biotechnol. 2004, 22, 1567–1572. [Google Scholar]
- Shcherbo, D.; Merzlyak, E.M.; Chepurnykh, T.V.; Fradkov, A.F.; Ermakova, G.V.; Solovieva, E.A.; Lukyanov, K.A.; Bogdanova, E.A.; Zaraisky, A.G.; Lukyanov, S.; Chudakov, D.M. Bright far-red fluorescent protein for whole-body imaging. Nat. Methods 2007, 4, 741–746. [Google Scholar]
- Yang, M.; Jiang, P.; Hoffman, R.M. Whole-body subcellular multicolor imaging of tumor-host interaction and drug response in real time. Cancer Res. 2007, 67, 5195–5200. [Google Scholar]
- Folkman, J. Angiogenesis and apoptosis. Semin Cancer Biol 2003, 13, 159–67. [Google Scholar]
- Paget, S. The distribution of secondary growths in cancer of the breast. Lancet 1889, 133, 571–3. [Google Scholar]
- Orimo, A.; Gupta, P.B.; Sgroi, D.C.; Arenzana-Seisdedos, F.; Delaunay, T.; Naeem, R.; Carey, V.J.; Richardson, A.L.; Weinberg, R.A. Stromal fibroblasts present in invasive human breast carcinomas promote tumor growth and angiogenesis through elevated SDF-1/CXCL12 secretion. Cell 2005, 121, 335–48. [Google Scholar]
- Ferrara, N.; Kerbel, R.S. Angiogenesis as a therapeutic target. Nature 2005, 438, 967–74. [Google Scholar]
- Kerbel, R.S. A cancer therapy resistant to resistance. Nature 1997, 390, 335–6. [Google Scholar]
- Chen, H.X.; Mooney, M.; Boron, M.; Vena, D.; Mosby, K.; Grochow, L. Phase II multicenter trial of bevacizumab plus fluorouracil and leucovorin in patients with advanced refractory colorectal cancer: an NCI Treatment Referral Center Trial TRC-0301. J Clin Oncol 2006, 24, 3354–60. [Google Scholar]
- Ray, P.; De, A.; Min, J.J.; Tsien, R.Y. Gambhir SS Imaging tri-fusion multimodality reporter gene expression in living subjects. Cancer Res. 64, 1323–1330.
- Hoffman, R.M.; Yang, M. Whole-body imaging with fluorescent proteins. Nat. Protocols 2006, 1, 1429–1438. [Google Scholar]
- Lukyanov, K.A.; Chudakov, D.M.; Lukyanov, S.; Verkhusha, V.V. Innovation: photoactivatable fluorescent proteins. Nat. Rev. Mol. Cell. Biol. 2005, 6, 885–891. [Google Scholar]
- Ando, R.; Hama, H.; Yamamoto-Hino, M.; Mizuno, H.; Miyawaki, A. An optical marker based on the UV-induced green-to-red photoconversion of a fluorescent protein. Proc. Natl. Acad. Sci. USA 2002, 99, 12651–12656. [Google Scholar]
- Yamauchi, K.; Yang, M.; Jiang, P.; Xu, M.; Yamamoto, N.; Tsuchiya, H.; Tomita, K.; Moossa, A.R.; Bouvet, M.; Hoffman, R.M. Development of real-time subcellular dynamic multicolor imaging of cancer cell trafficking in live mice with a variable-magnification whole-mouse imaging system. Cancer Res. 2006, 66, 4208–4214. [Google Scholar]
- Condeelis, J.; Segall, J.E. Intravital imaging of cell movement in tumours. Nat. Rev. Cancer 2003, 3, 921–930. [Google Scholar]
- Gross, S.; Piwnica-Worms, D. Spying on cancer: molecular imaging in vivo with genetically encoded reporters. Cancer Cell 2005, 7, 5–15. [Google Scholar]
- Weissleder, R.; Ntziachristos, V. Shedding light onto live molecular targets. Shedding light onto live molecular targets. Nat. Med. 2003, 9, 123–128. [Google Scholar]
- Ntziachristos, V.; Ripoll, J.; Wang, L.V.; Weissleder, R. Looking and listening to light: the evolution of whole-body photonic imaging. Nat. Biotechnol. 2005, 23, 313–320. [Google Scholar]
- Chambers, A.F.; Groom, A.C.; MacDonald, I.C. Dissemination and growth of cancer cells in metastatic sites. Nat Rev Cancer 2002, 2, 563–572. [Google Scholar]
- Yamauchi, K.; Yang, M.; Jiang, P.; Yamamoto, N.; Xu, M.; Amoh, Y.; Tsuji, K.; Bouvet, M.; Tsuchiya, H.; Tomita, K.; Moossa, A.R.; Hoffman, R.M. Real-time in vivo dual-color imaging of intracapillary cancer cell and nucleus deformation and migration. Cancer Res. 2005, 65, 4246–4252. [Google Scholar]
- Yamauchi, K.; Yang, M.; Hayashi, K.; Jiang, P.; Xu, M.; Yamamoto, N.; Tsuchiya, H.; Tomita, K.; Moossa, A.R.; Bouvet, M.; Hoffman, R.M. Induction of intravascular proliferation, extravasation, and colony formation of cancer cells by cyclophosphamide pretreatment of host mice: an opposite effect of chemotherapy. Cancer Res 2008, 65, 516–520. [Google Scholar]
- Tsuji, K.; Yamauchi, K.; Yang, M.; Jiang, P.; Bouvet, M.; Endo, H.; Kanai, Y.; Yamashita, K.; Moossa, A.R.; Hoffman, R.M. Dual-color imaging of nuclear-cytoplasmic dynamics, viability, and proliferation of cancer cells in the portal vein area. Cancer Res 2006, 66, 303–306. [Google Scholar]
- Nathanson, S.D. Insights into the mechanisms of lymph node metastasis. Cancer 2003, 98, 413–423. [Google Scholar]
- Jiang, P.; Yamauchi, K.; Yang, M.; Tsuji, K.; Xu, M.; Maitra, A.; Bouvet, M.; Hoffman, R.M. Tumor cells genetically labeled with GFP in the nucleus and RFP in the cytoplasm for imaging cellular dynamics. Cell Cycle 2006, 5, 1198–1201. [Google Scholar]
- Yamamoto, N.; Jiang, P.; Yang, M.; Xu, M.; Yamauchi, K.; Tsuchiya, H.; Tomita, K.; Wahl, G.M.; Moossa, A.R.; Hoffman, R.M. Cellular dynamics visualized in live cells in vitro and in vivo by differential dual-color nuclear-cytoplasmic fluorescent-protein expression. Cancer Research 2004, 64, 4251–4256. [Google Scholar]
- Okabe, M.; Ikawa, M.; Kominami, K.; Nakanishi, T.; Nishimune, Y. ′Green mice′ as a source of ubiquitous green cells. FEBS Ltrs. 1997, 407, 313–319. [Google Scholar]
- Vintersten, K.; Monetti, C.; Gertsenstein, M.; Zhang, P.; Laszlo, L.; Biechele, S.; Nagy, A. Mouse in red: red fluorescent protein expression in mouse ES cells, embryos, and adult animals. Genesis 2004, 40, 241–246. [Google Scholar]
- Yang, M.; Jiang, P.; Hoffman, R.M. Whole-body subcellular multicolor imaging of tumor-host interaction and drug response in real time. Cancer Res. 2006, 67, 5195–5200. [Google Scholar]
- Hayashi, K.; Jiang, P.; Yamauchi, K.; Yamamoto, N.; Tsuchiya, H.; Tomita, K.; Moossa, A.R.; Bouvet, M.; Hoffman, R.M. Real-time imaging of tumor-cell shedding and trafficking in lymphatic channels. Cancer Res. 2007, 67, 8223–8228. [Google Scholar]
- Sakaue-Sawano, A.; Kurokawa, H.; Morimura, T.; Hanyu, A.; Hama, H.; Osawa, H.; Kashiwagi, S.; Fukami, K.; Miyata, T.; Miyoshi, H.; Imamura, T.; Ogawa, M.; Masai, H.; Miyawaki, A. Visualizing spatiotemporal dynamics of multicellular cell-cycle progression. Cell 2008, 132, 487–498. [Google Scholar]
- Livet, J.; Weissman, T.A.; Kang, H.; Draft, R.W.; Lu, J.; Bennis, R.A.; Sanes, J.R.; Lichtman, J.W. Transgenic strategies for combinatorial expression of fluorescent proteins in the nervous system. Nature 2007, 450, 56–62. [Google Scholar]
Figure 1.
A, External and B, open images of a single, representative, control mouse at autopsy on day 17 after surgical orthotopic implantation (SOI). Extensive locoregional and metastatic growth is visualized by selectively exciting DsRed2-expressed in the tumors. A strong correlation between the fluorescence visualized externally and that obtained after laparotomy is evident, despite the presence of intra-abdominal ascites. C, Red fluorescent area quantified using external fluorescence imaging correlated strongly with tumor volume measured directly. At autopsy, measurement of externally visualized fluorescent area and direct measurements of the primary tumor of each mouse were obtained. Significant correlation (r 0.89, P 0.05) was observed between these values [6].
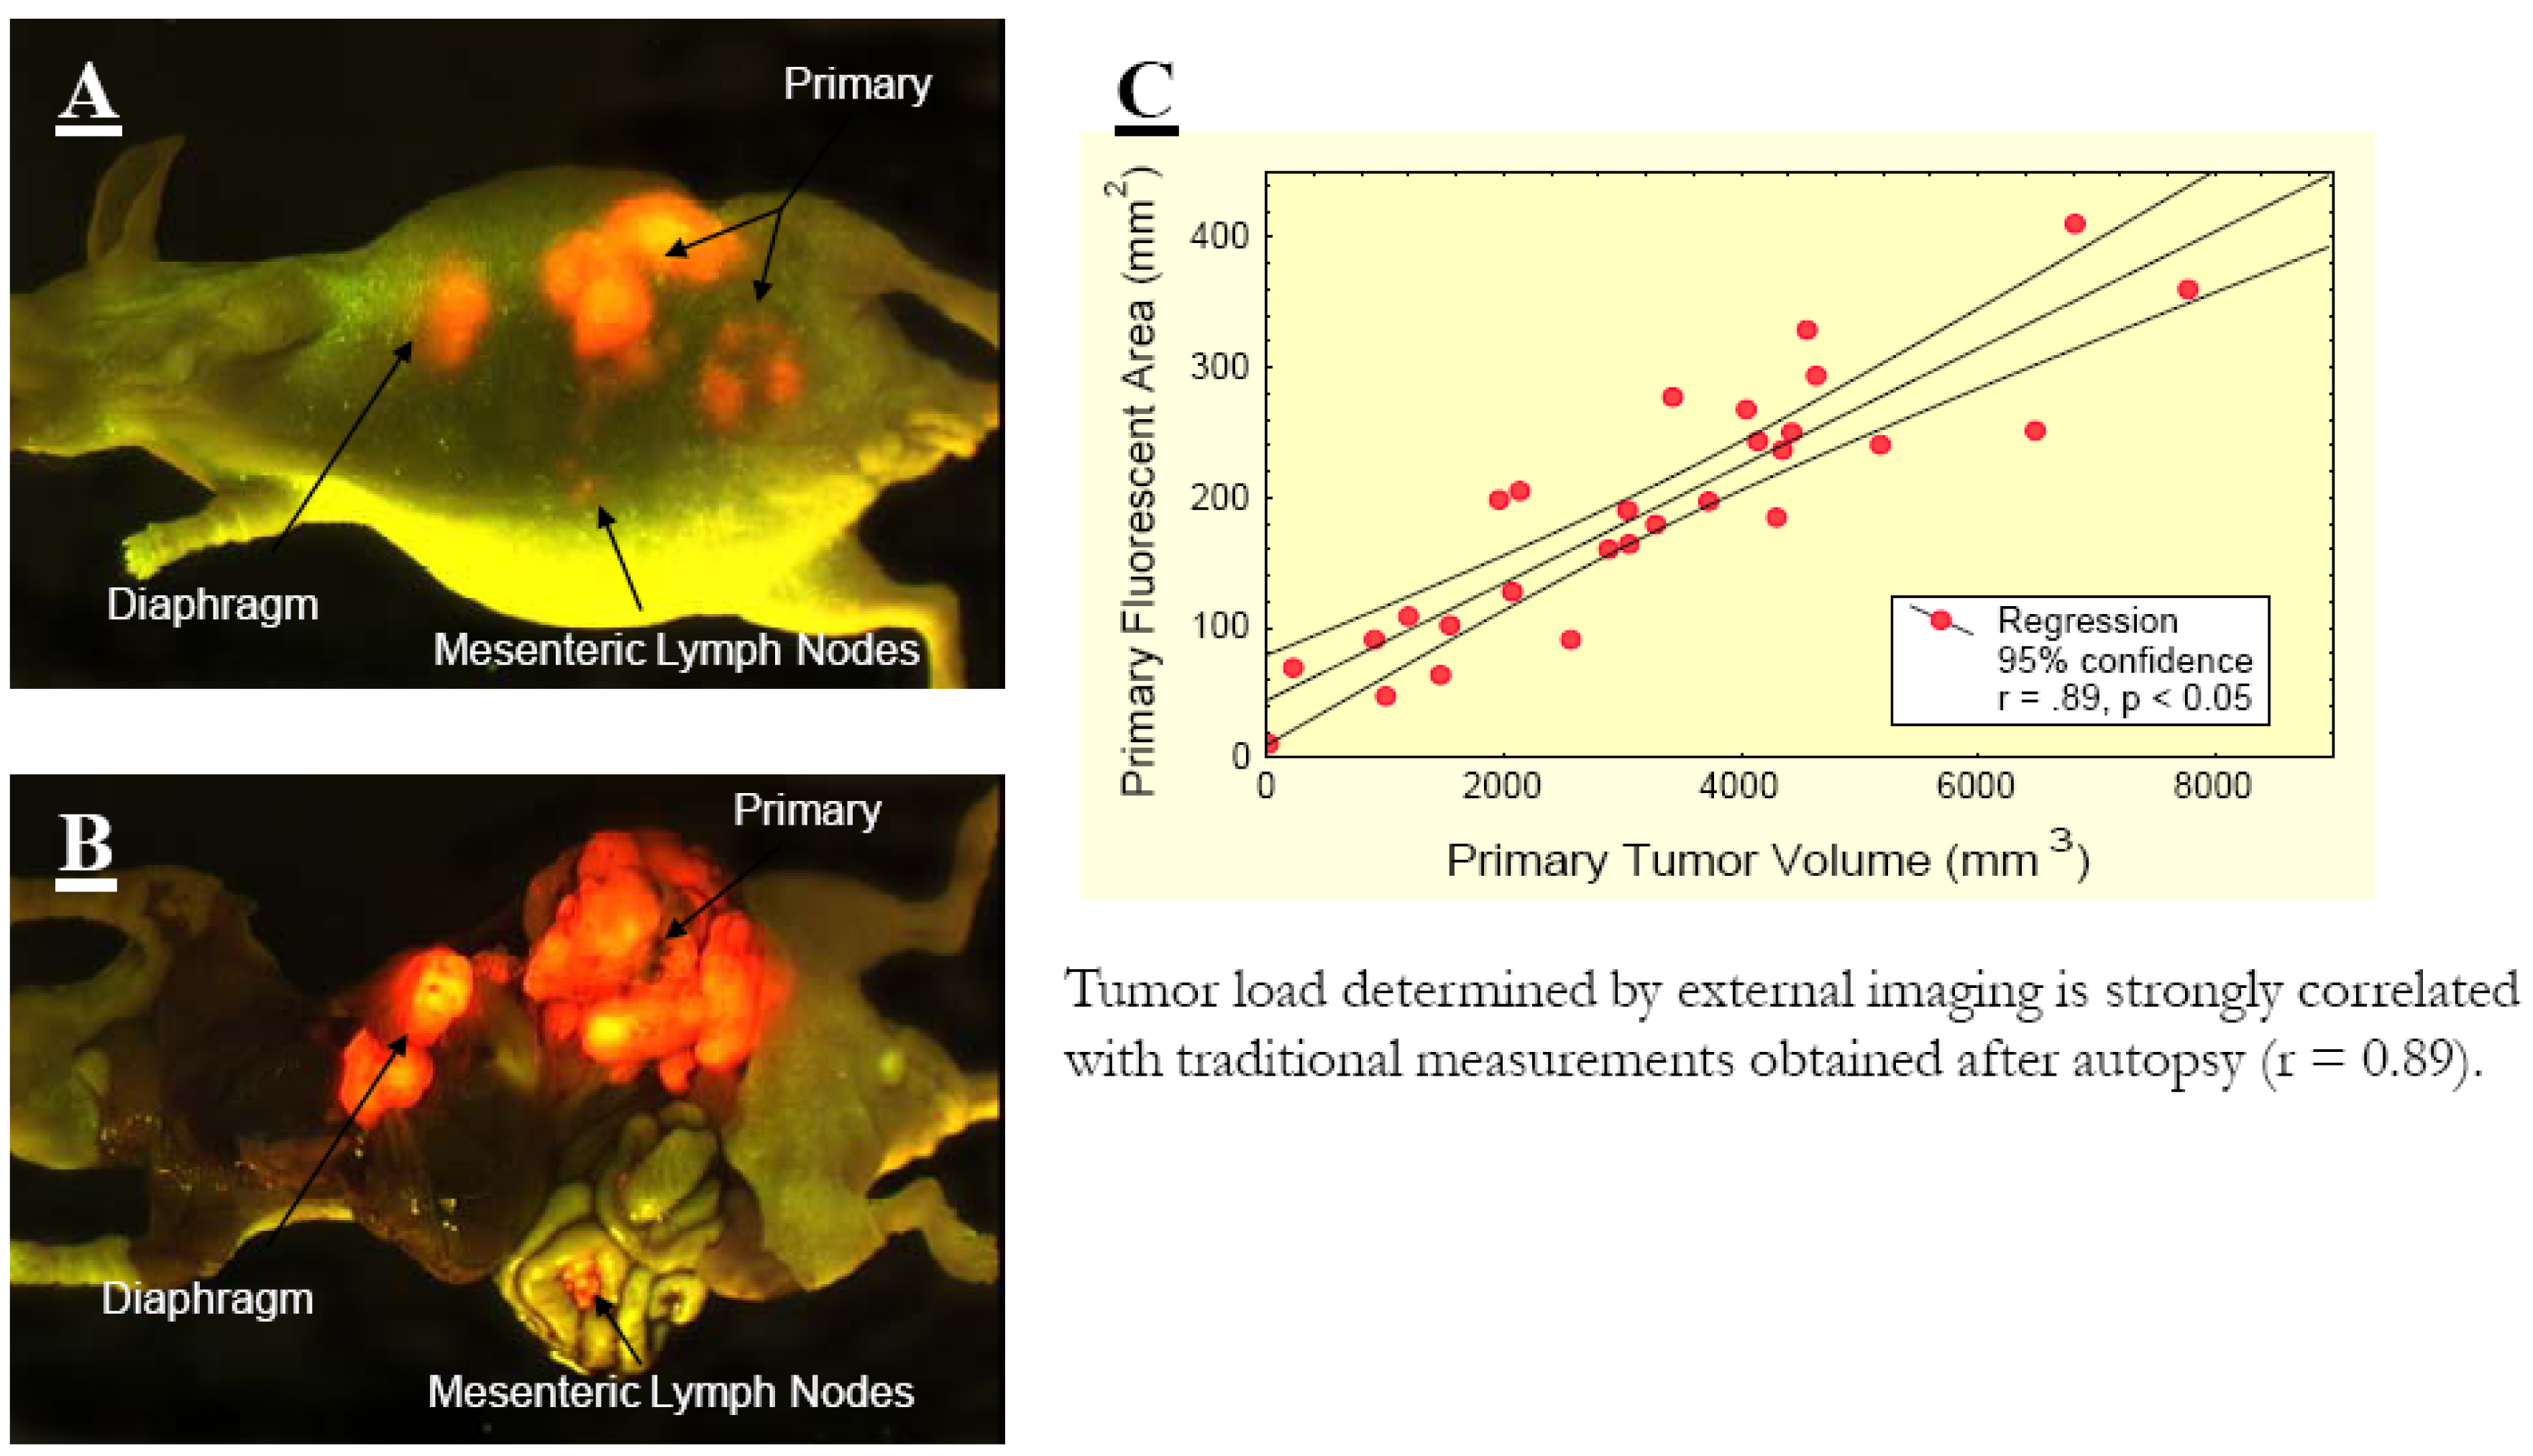
Figure 2.
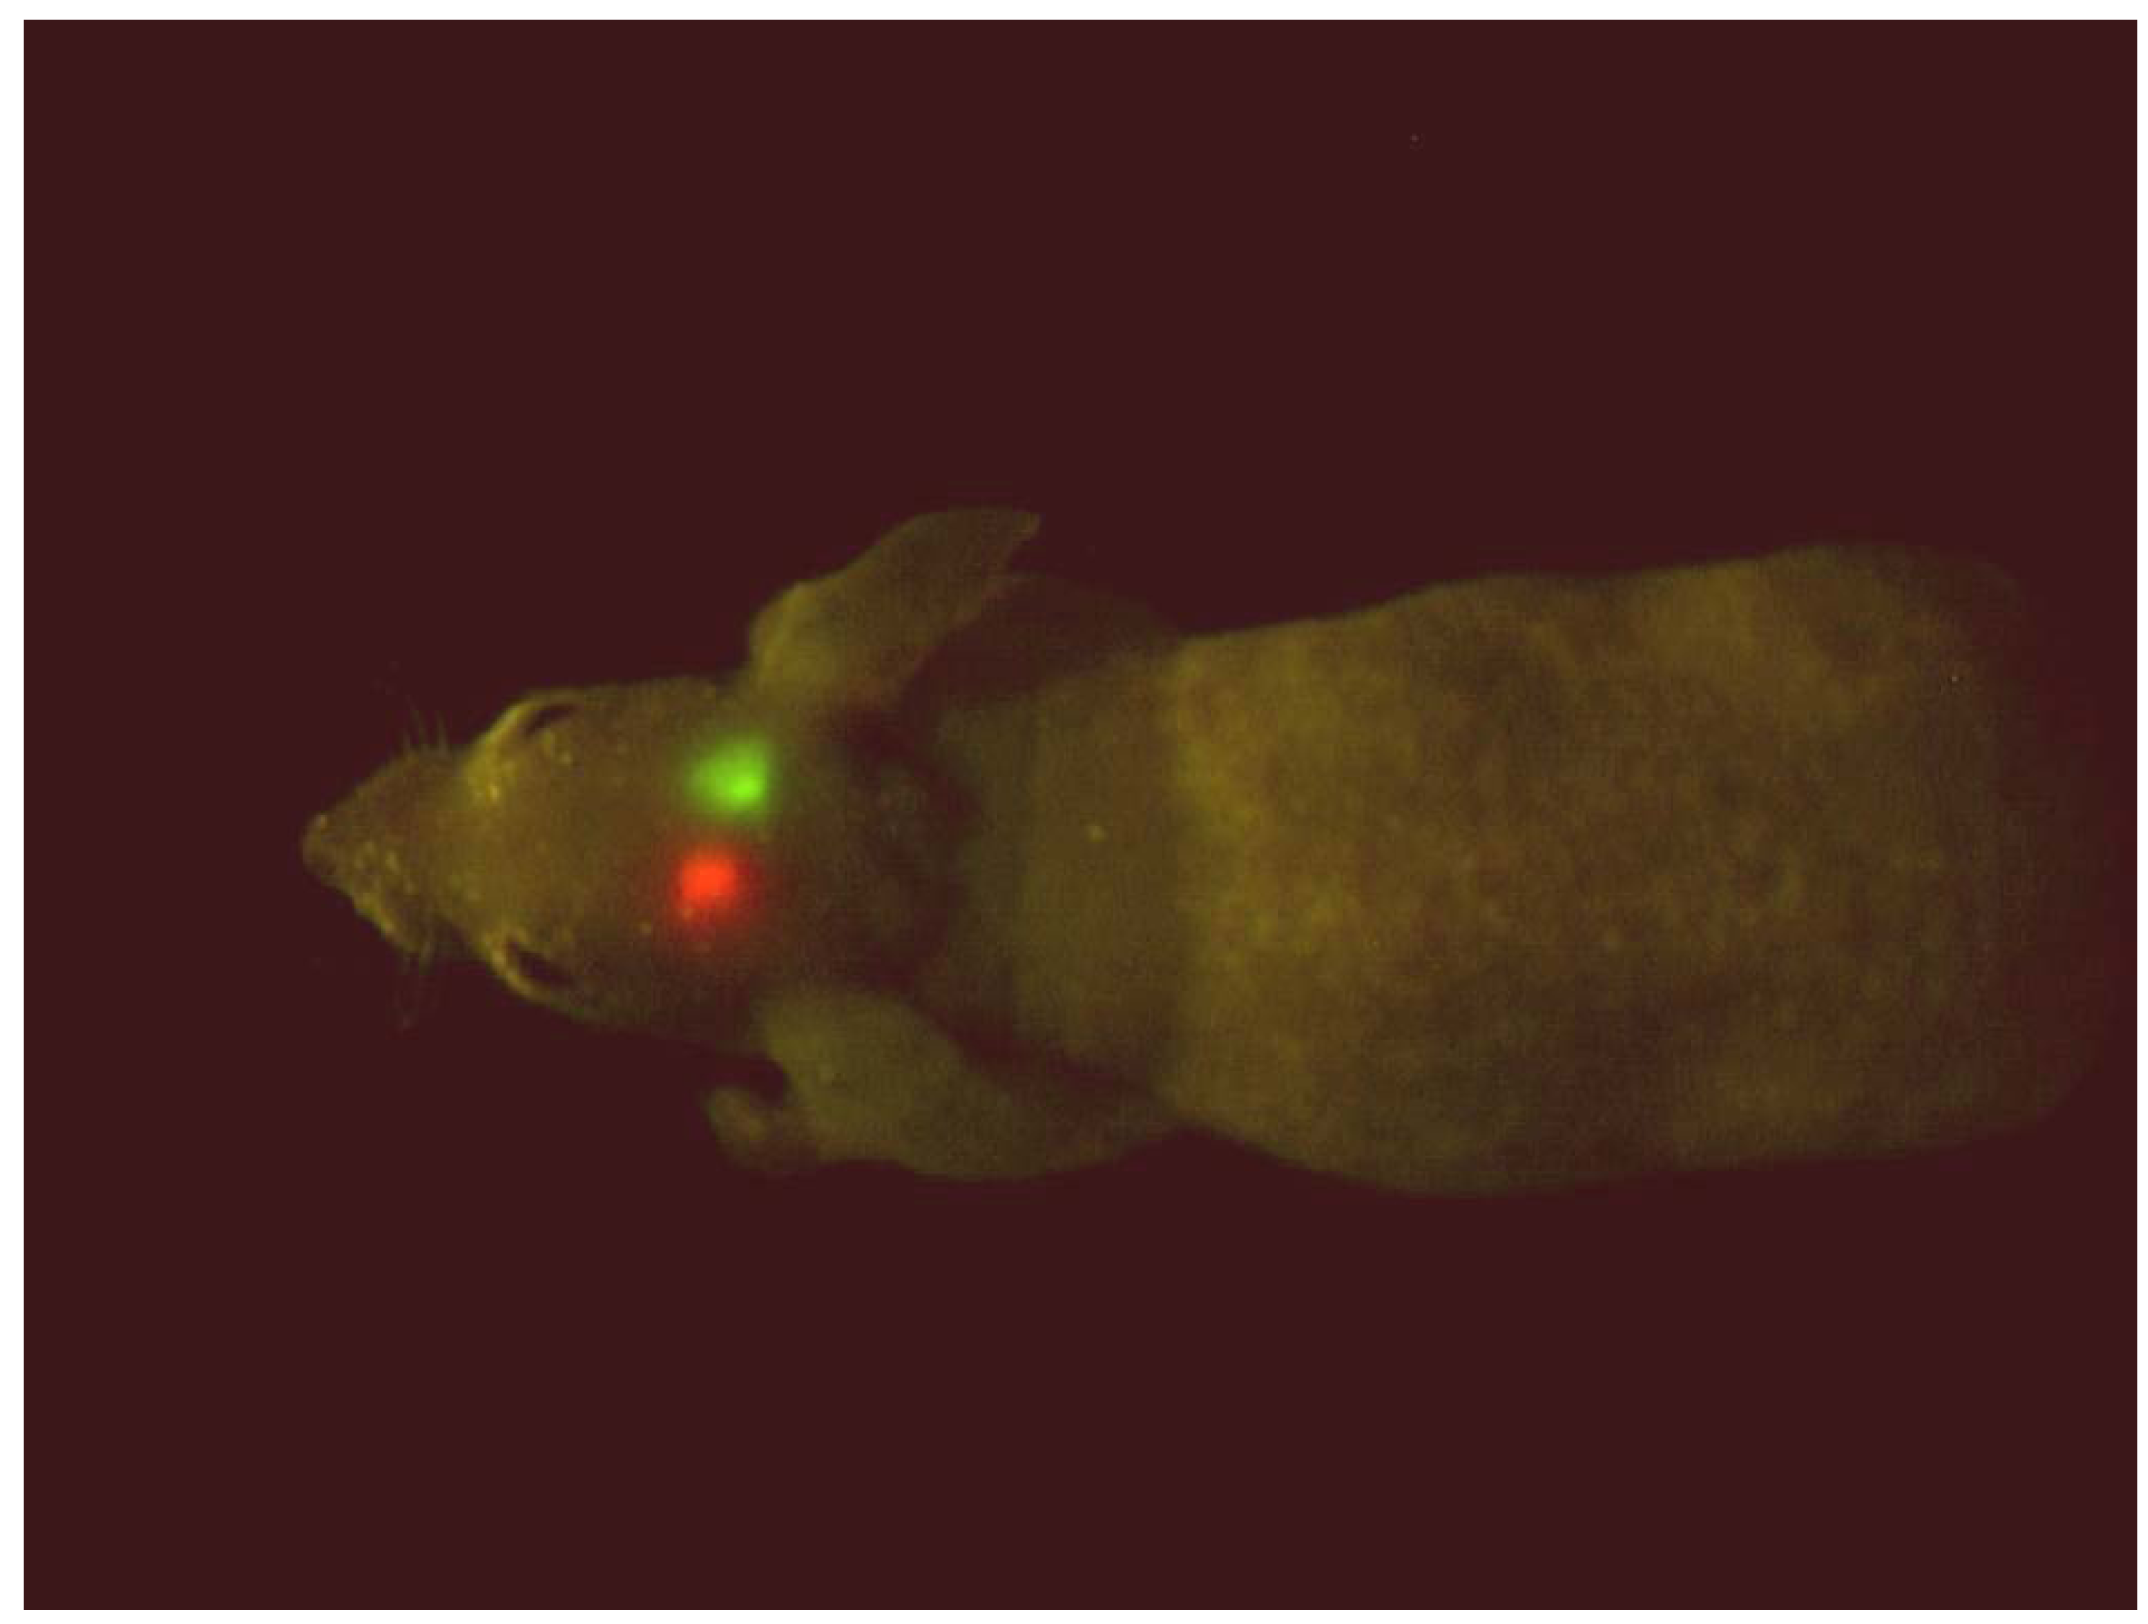
GFP- and RFP-expressing brain tumors implanted in the brain in a single nude mouse. The excitation light was produced with a simple blue-LED flashlight equipped with an excitation filter with a central peak of 470 nm. The image was acquired with a Hamamatsu charge-coupled device (CCD) camera [4].
Figure 2.
GFP- and RFP-expressing brain tumors implanted in the brain in a single nude mouse. The excitation light was produced with a simple blue-LED flashlight equipped with an excitation filter with a central peak of 470 nm. The image was acquired with a Hamamatsu charge-coupled device (CCD) camera [4].

Figure 3.
Mouse mammary tumor (MMT) cells were initially transduced with RFP and the neomycin resistance gene. The cells were subsequently transduced with histone H2B-GFP and the hygromycin resistance gene. Double transformants were selected with G418 and hygromycin, and stable clones were established. Bar = 50 μm [31].
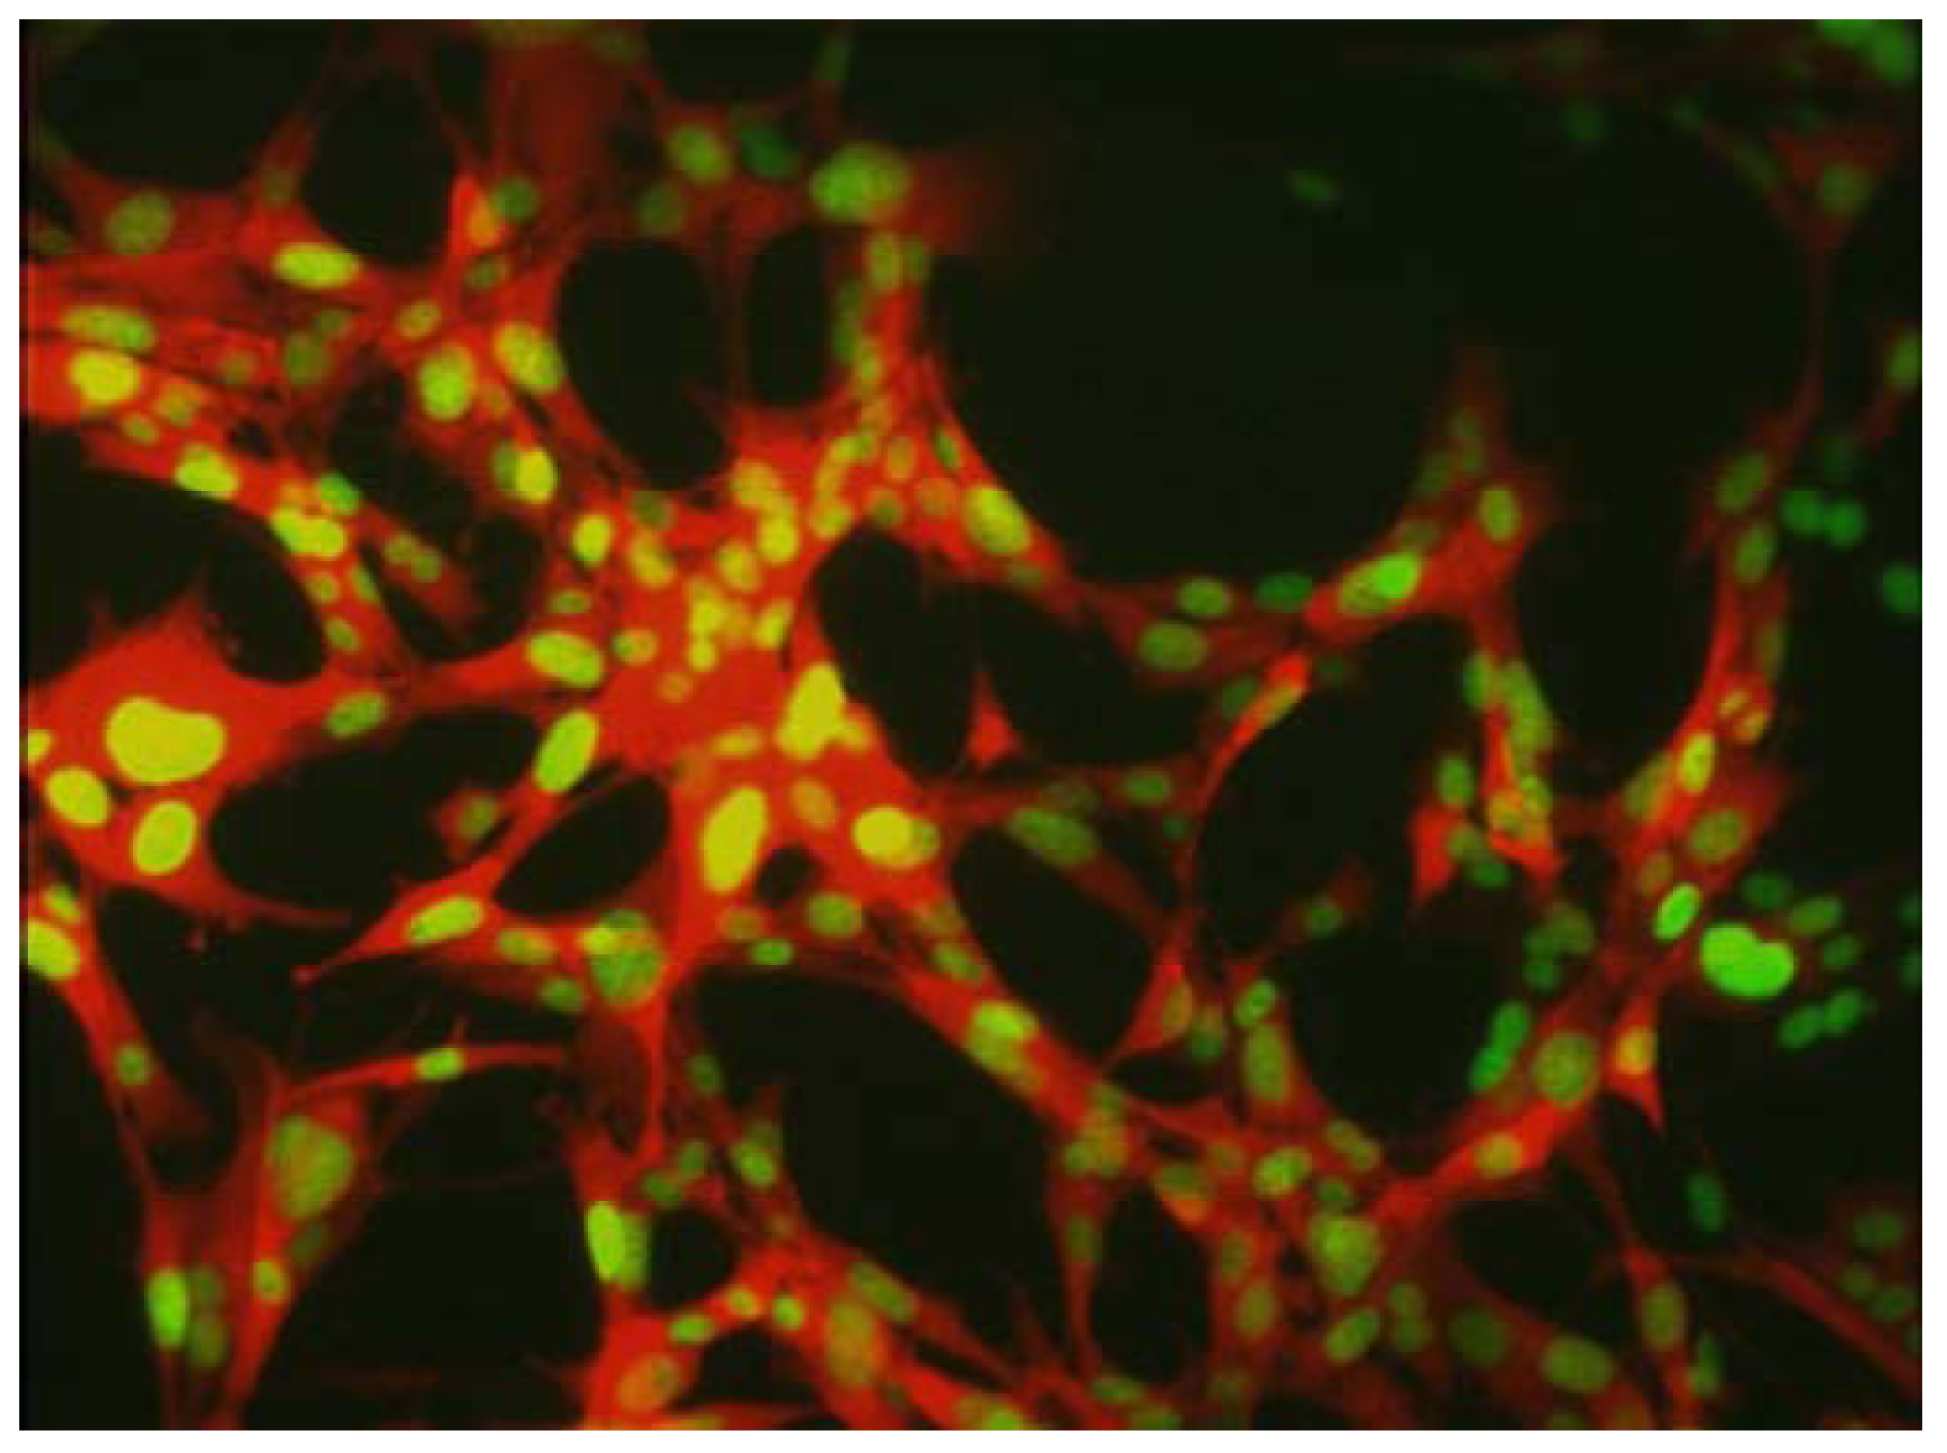
Figure 4.
MMT-GFP-RFP cells were injected in the footpad of GFP transgenic nude mice. A, Whole-body image of untreated MMT-GFP-RFP cells in the footpad of a live GFP mouse. Note the numerous spindle-shaped MMT-GFP-RFP cancer cells interdispersed among the GFP host cells. B, Whole-body image of MMT-GFP-RFP cancer cells in a live GFP nude mouse 12 h after treatment with doxorubicin (10 mg/kg). The cancer cells lost their spindle shape, and the nuclei appear contracted. C, Whole-body image of MMT-GFP-RFP tumor. Numerous spindle-shaped MMT-GFP-RFP cells interacted with GFP-expressing host cells. Well-developed tumor blood vessels and real-time blood flow were visualized by whole-body imaging (arrows). D, In vivo drug response of MMT-GFP-RFP cancer cells and GFP stromal cells 12 h after i.v. injection of 10 mg/kg doxorubicin. All of the visible MMT-GFP-RFP cells lost their spindle shape. Many of the cancer cells fragmented (arrows). Tumor blood vessels were damaged (dashed black lines), and the number of cancer cells was dramatically reduced 12 h after chemotherapy. Bar = 20 μm [10].
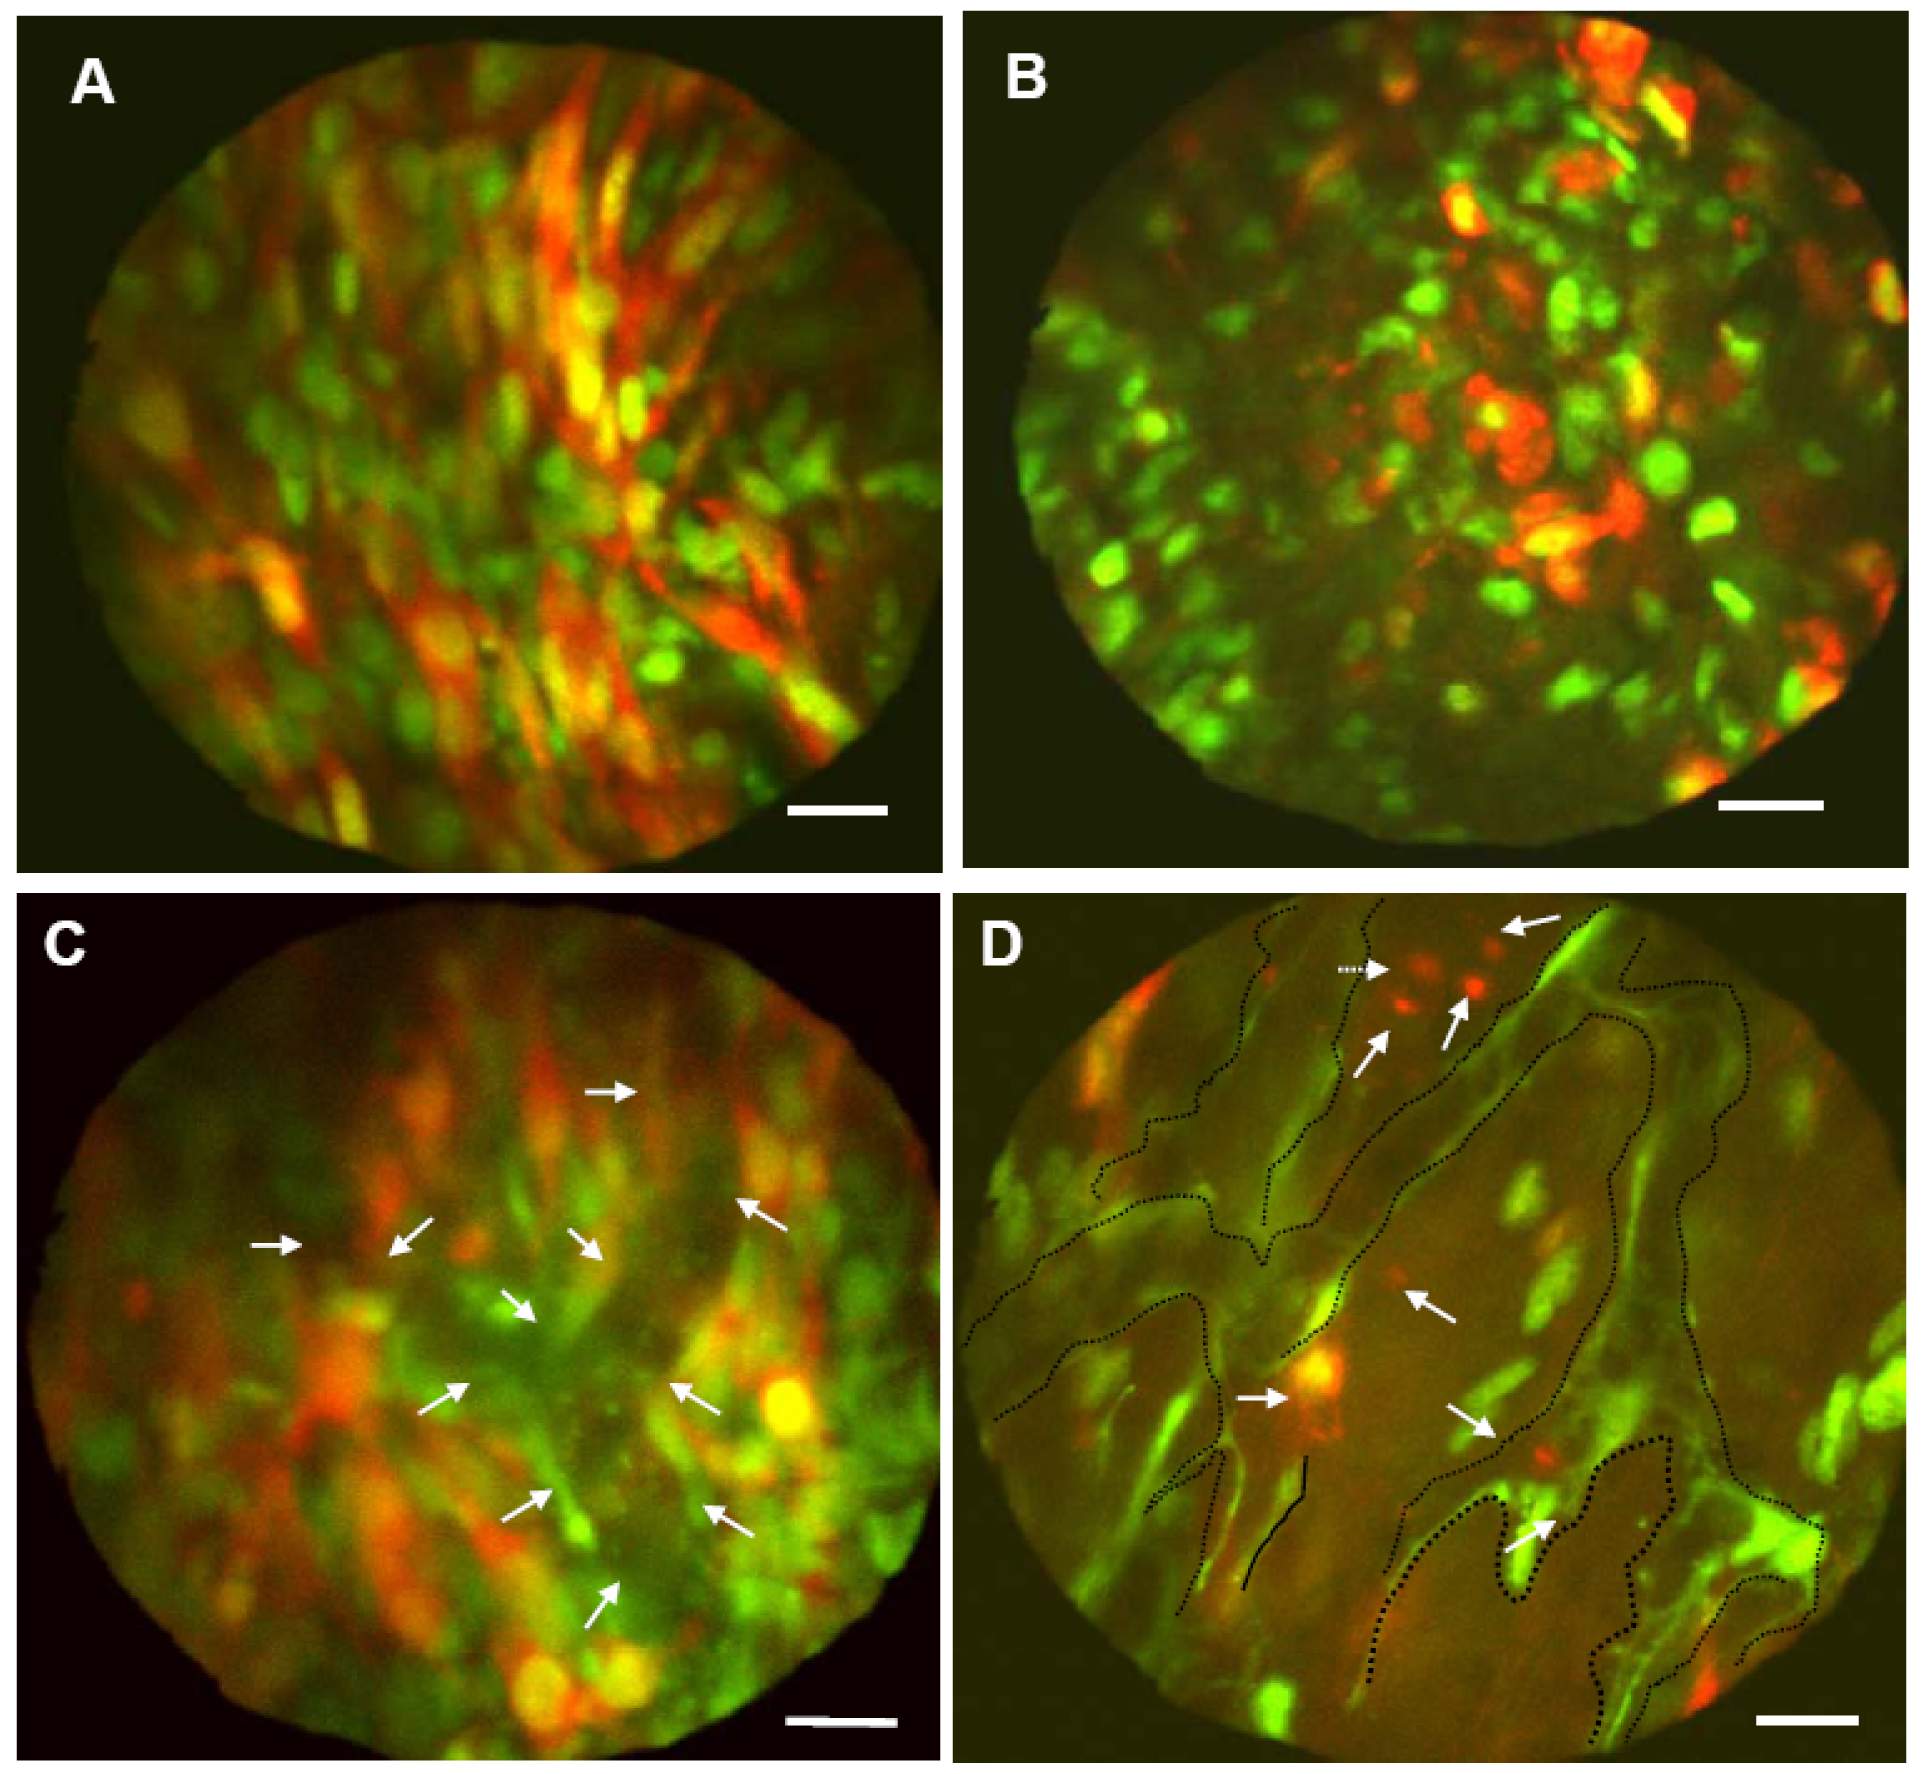
Figure 5.
Transgenic mice ubiquitously-expressing GFP [33] or RFP [34] were originally developed. These mice were crossed on to the nude background [35].
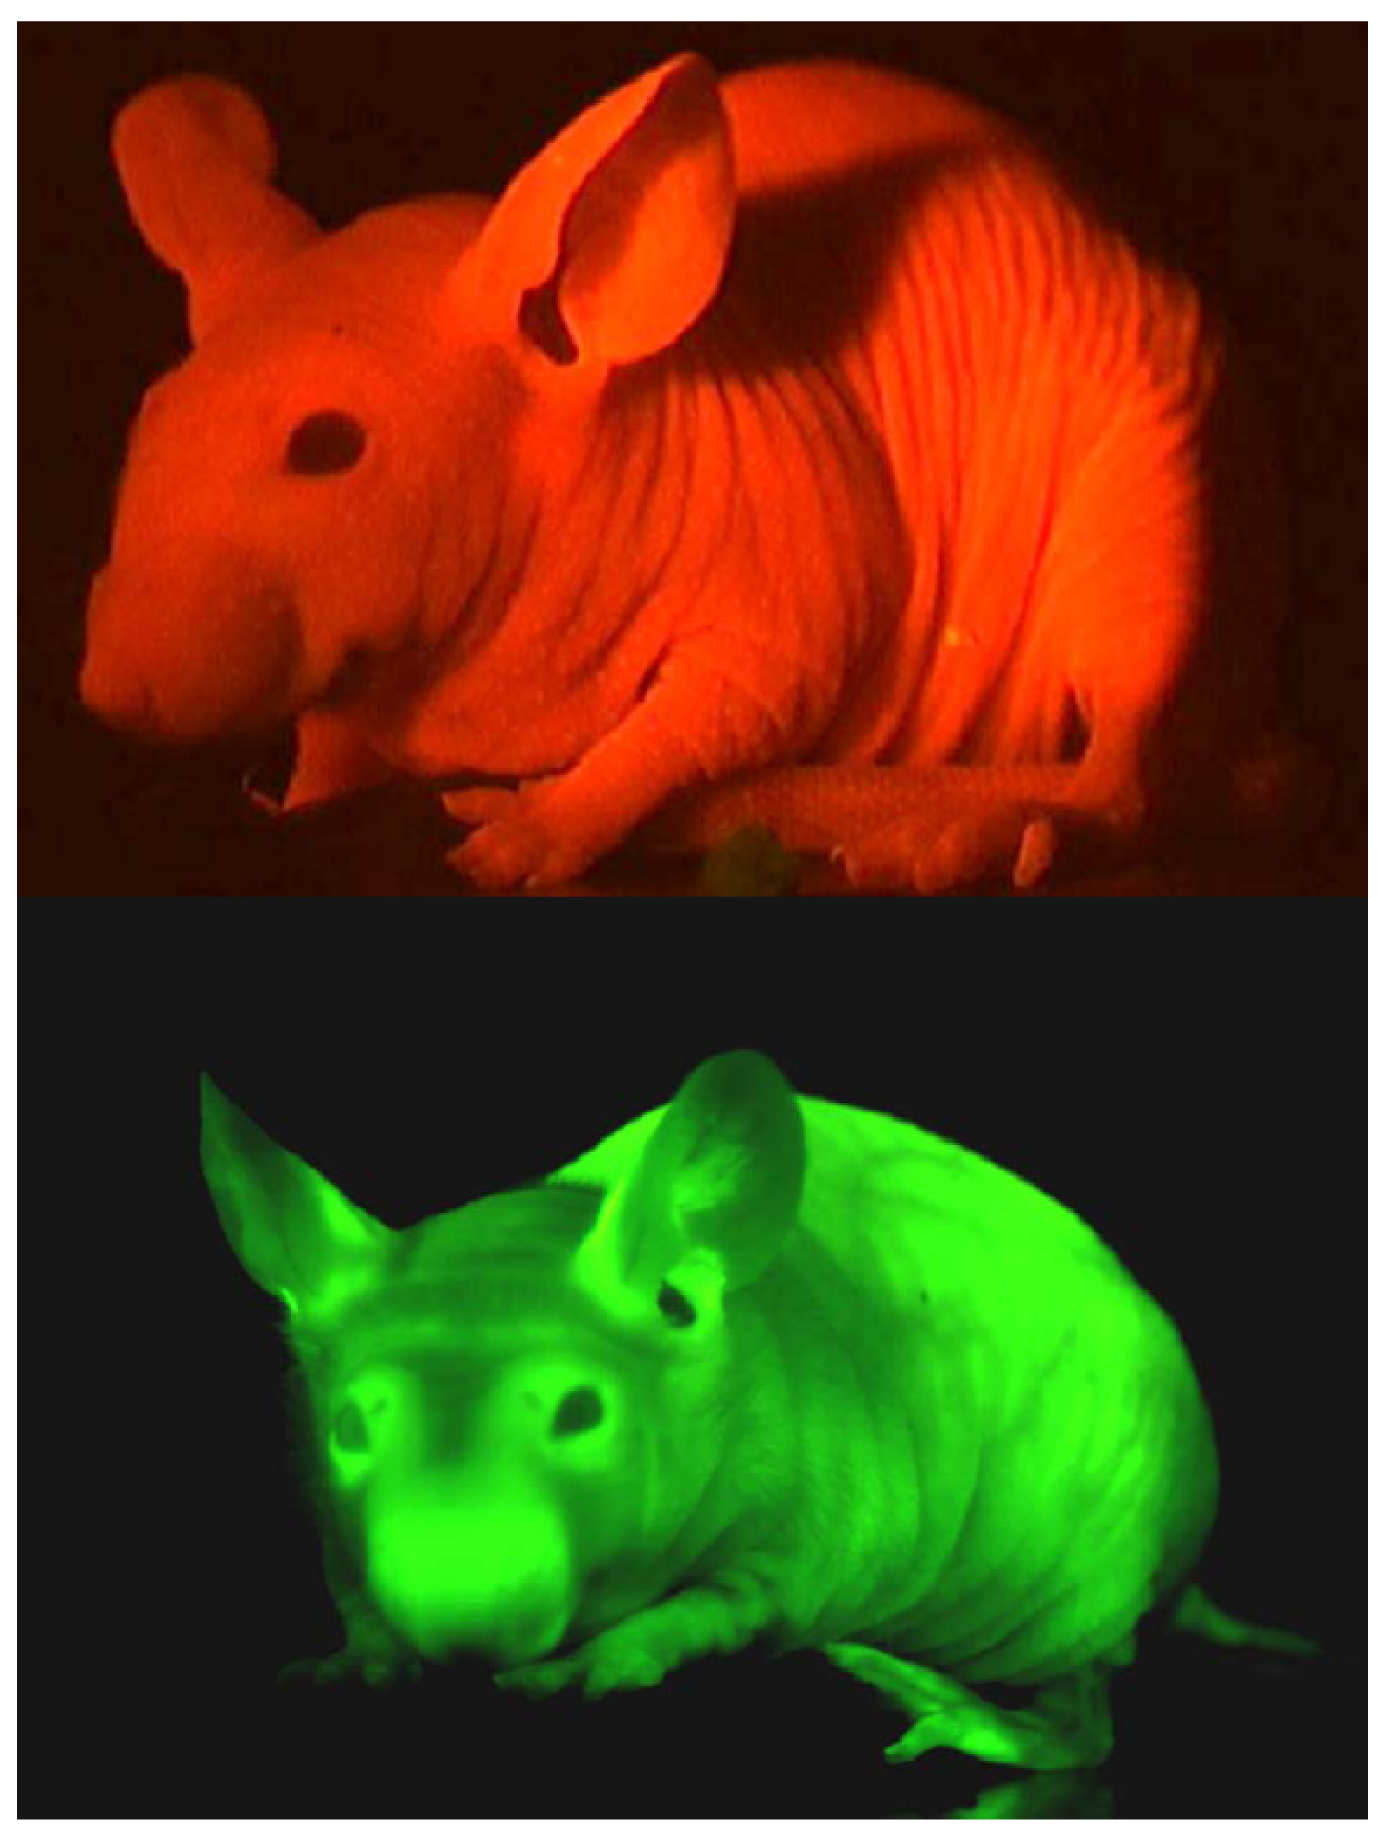
Figure 6.
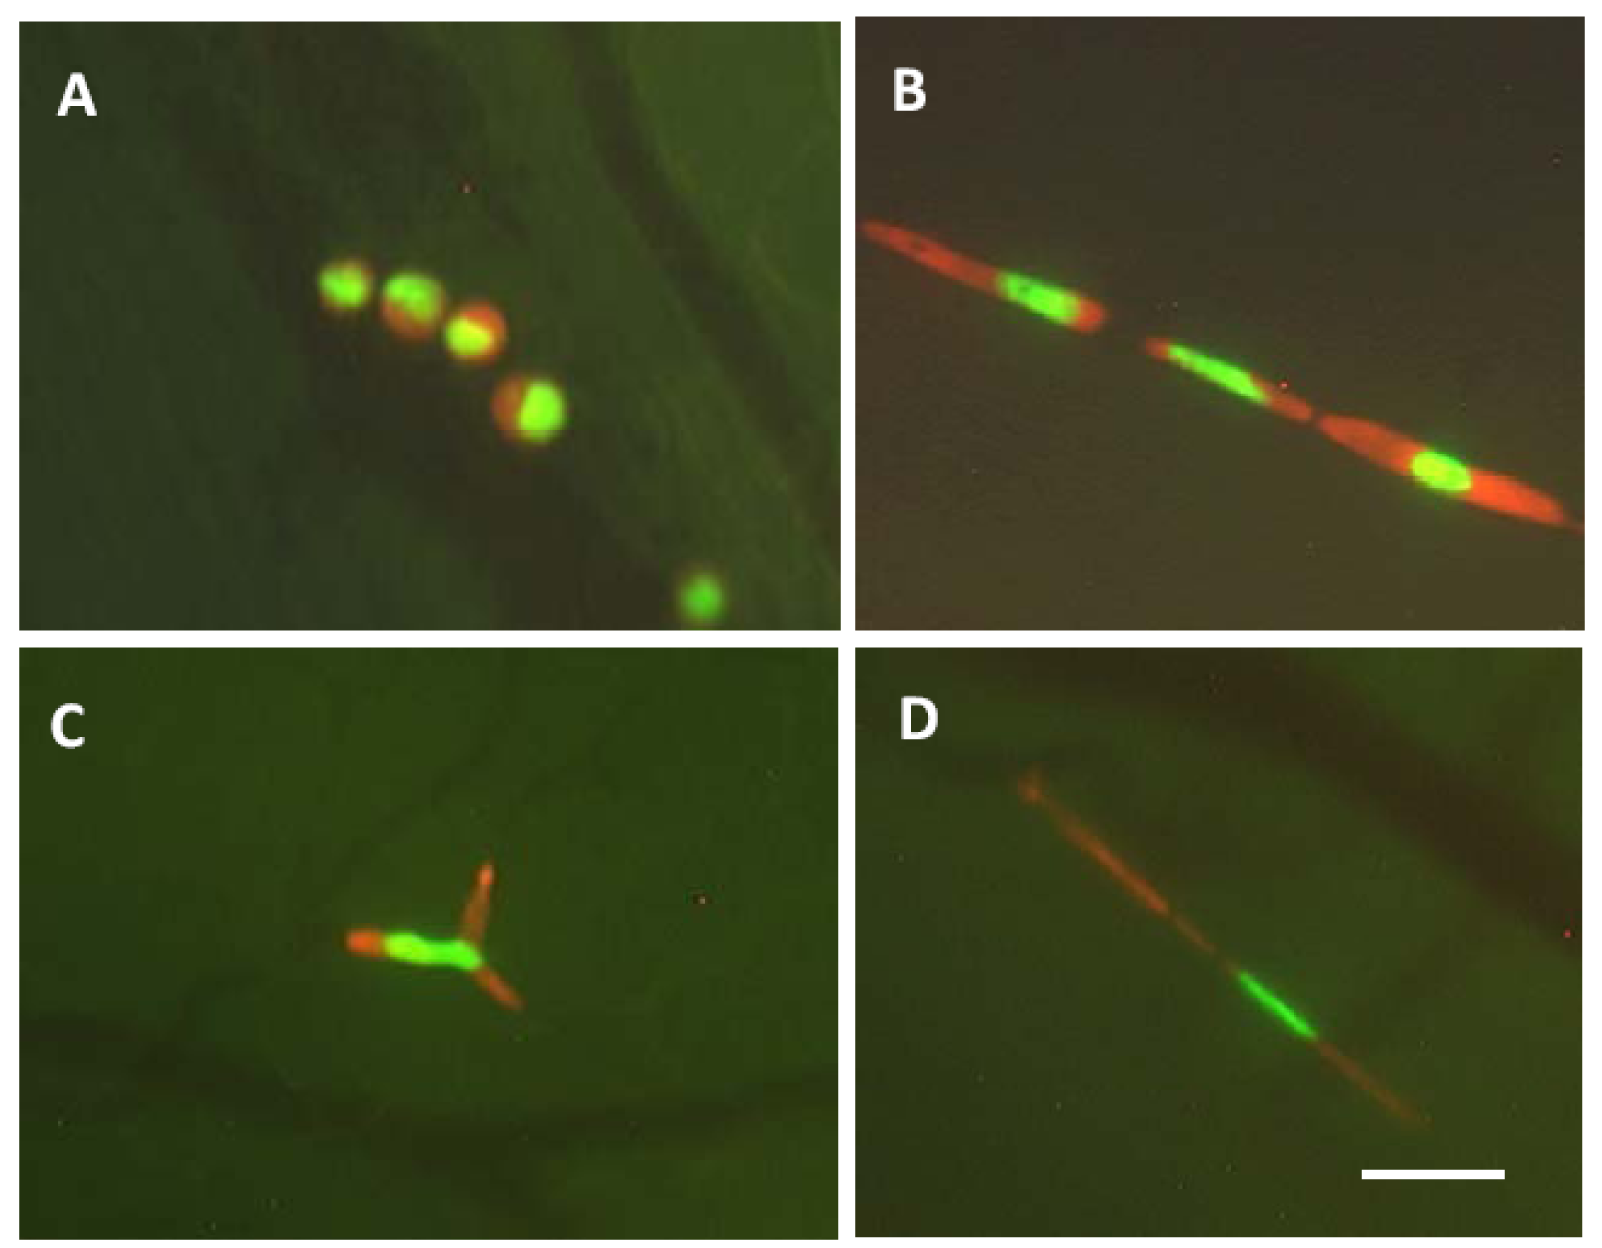
A, Nondeformed cells are within a microvessel. The cells in the microvessel are round and the nuclei oval. The cells occupy the full diameter of the vessel. B, The cells and nuclei are elongated to fit a capillary. C, The cells are arrested at the capillary bifurcation. Because of the difference of the deformability between cytoplasm and nucleus, only the cytoplasm is bifurcated. The nucleus is also deformed but remains intact. D, Cytoplasmic fragmentation in very thin capillary. Bar = 50 μm [27].
Figure 6.
A, Nondeformed cells are within a microvessel. The cells in the microvessel are round and the nuclei oval. The cells occupy the full diameter of the vessel. B, The cells and nuclei are elongated to fit a capillary. C, The cells are arrested at the capillary bifurcation. Because of the difference of the deformability between cytoplasm and nucleus, only the cytoplasm is bifurcated. The nucleus is also deformed but remains intact. D, Cytoplasmic fragmentation in very thin capillary. Bar = 50 μm [27].

Figure 7.
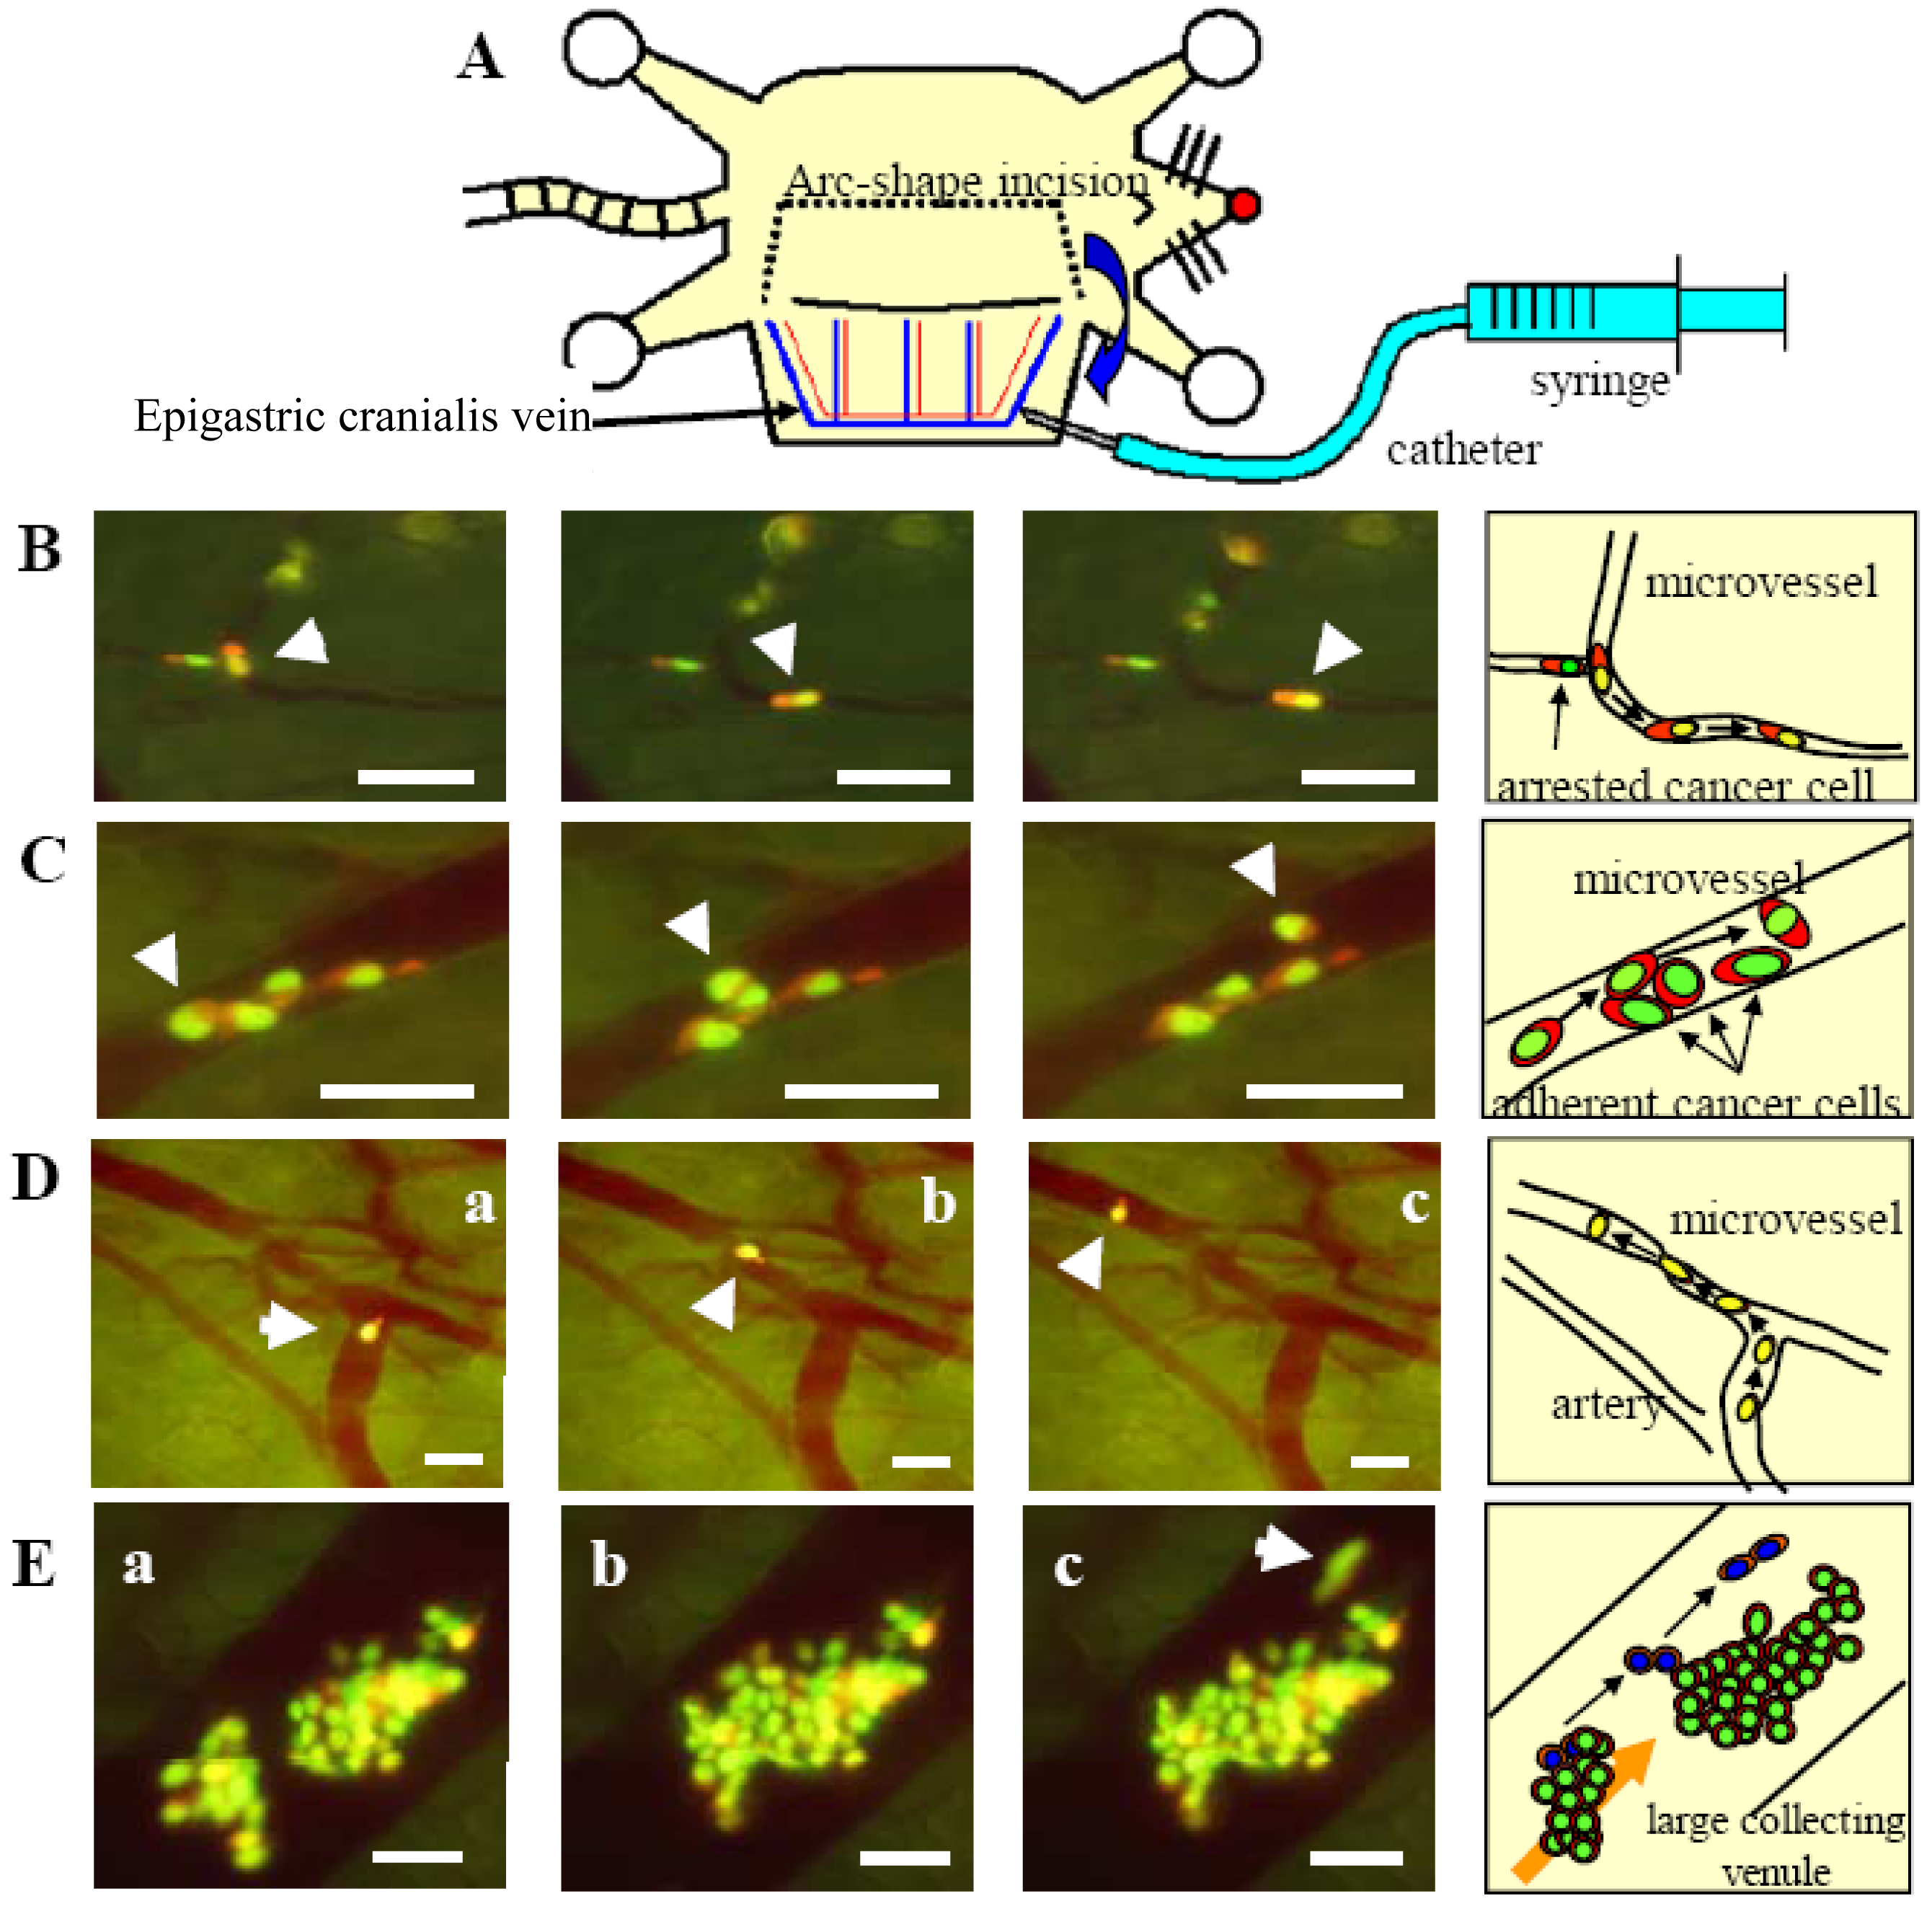
A, Schematic diagram of the skin flap model in live mice for imaging intravascular trafficking and extravasation. An arc-shaped incision was made in the abdominal skin, and then the skin flap was spread and fixed on a flat stand. HT-1080-GFP-RFP cells were injected into the epigastric cranialis vein through a catheter. Immediately after injection, the inside surface of the skin flap was directly observed. B, HT-1080-GFP-RFP cell crawls smoothly along the vessel wall without rolling in a capillary (arrow). The nucleus and cytoplasm are slightly stretched. The nucleus is in the front of the cell while the cell is crawling. When the cell advanced into a part of the capillary where the diameter is smaller than of deformation limit of the cell, the cell could not advance any further. Bar = 100 μm. C, HT-1080-GFP-RFP cell, trafficking at low velocity, advanced between other cells and the vessel wall. The moving cancer cell contacted the other cells (arrow). The cell deformed slightly and continued to move without adhesion. Bar = 100 μm. Right, schematics of (B) and (C). D, One cancer cell migrating in the post capillary with slow velocity. The cytoplasm is at the head of the cell while the cell is moving in a large vein, but the nucleus is at the head in a small vein. The velocity of the cells in (A) and (B) is an average of 24.2 μm/s. The average velocity in cells in (D) and (E), however, is only 6.1 μm/s because the cells are in a narrower vein. Images were taken every 3.30 seconds. Bar = 50 μm. E, Multicellular aggregate collided with another aggregate that was already attached to the vessel wall. The two aggregates attached and formed a larger aggregation. Some cells (arrow) escaped from the aggregate because of weak adhesion and recommenced movement. Images were taken every 1.04 seconds. Bar = 100 μm. Images were acquired in real time with the Olympus OV100. Right, schematics of (B) and (C) [21].
Figure 7.
A, Schematic diagram of the skin flap model in live mice for imaging intravascular trafficking and extravasation. An arc-shaped incision was made in the abdominal skin, and then the skin flap was spread and fixed on a flat stand. HT-1080-GFP-RFP cells were injected into the epigastric cranialis vein through a catheter. Immediately after injection, the inside surface of the skin flap was directly observed. B, HT-1080-GFP-RFP cell crawls smoothly along the vessel wall without rolling in a capillary (arrow). The nucleus and cytoplasm are slightly stretched. The nucleus is in the front of the cell while the cell is crawling. When the cell advanced into a part of the capillary where the diameter is smaller than of deformation limit of the cell, the cell could not advance any further. Bar = 100 μm. C, HT-1080-GFP-RFP cell, trafficking at low velocity, advanced between other cells and the vessel wall. The moving cancer cell contacted the other cells (arrow). The cell deformed slightly and continued to move without adhesion. Bar = 100 μm. Right, schematics of (B) and (C). D, One cancer cell migrating in the post capillary with slow velocity. The cytoplasm is at the head of the cell while the cell is moving in a large vein, but the nucleus is at the head in a small vein. The velocity of the cells in (A) and (B) is an average of 24.2 μm/s. The average velocity in cells in (D) and (E), however, is only 6.1 μm/s because the cells are in a narrower vein. Images were taken every 3.30 seconds. Bar = 50 μm. E, Multicellular aggregate collided with another aggregate that was already attached to the vessel wall. The two aggregates attached and formed a larger aggregation. Some cells (arrow) escaped from the aggregate because of weak adhesion and recommenced movement. Images were taken every 1.04 seconds. Bar = 100 μm. Images were acquired in real time with the Olympus OV100. Right, schematics of (B) and (C) [21].

Figure 8.
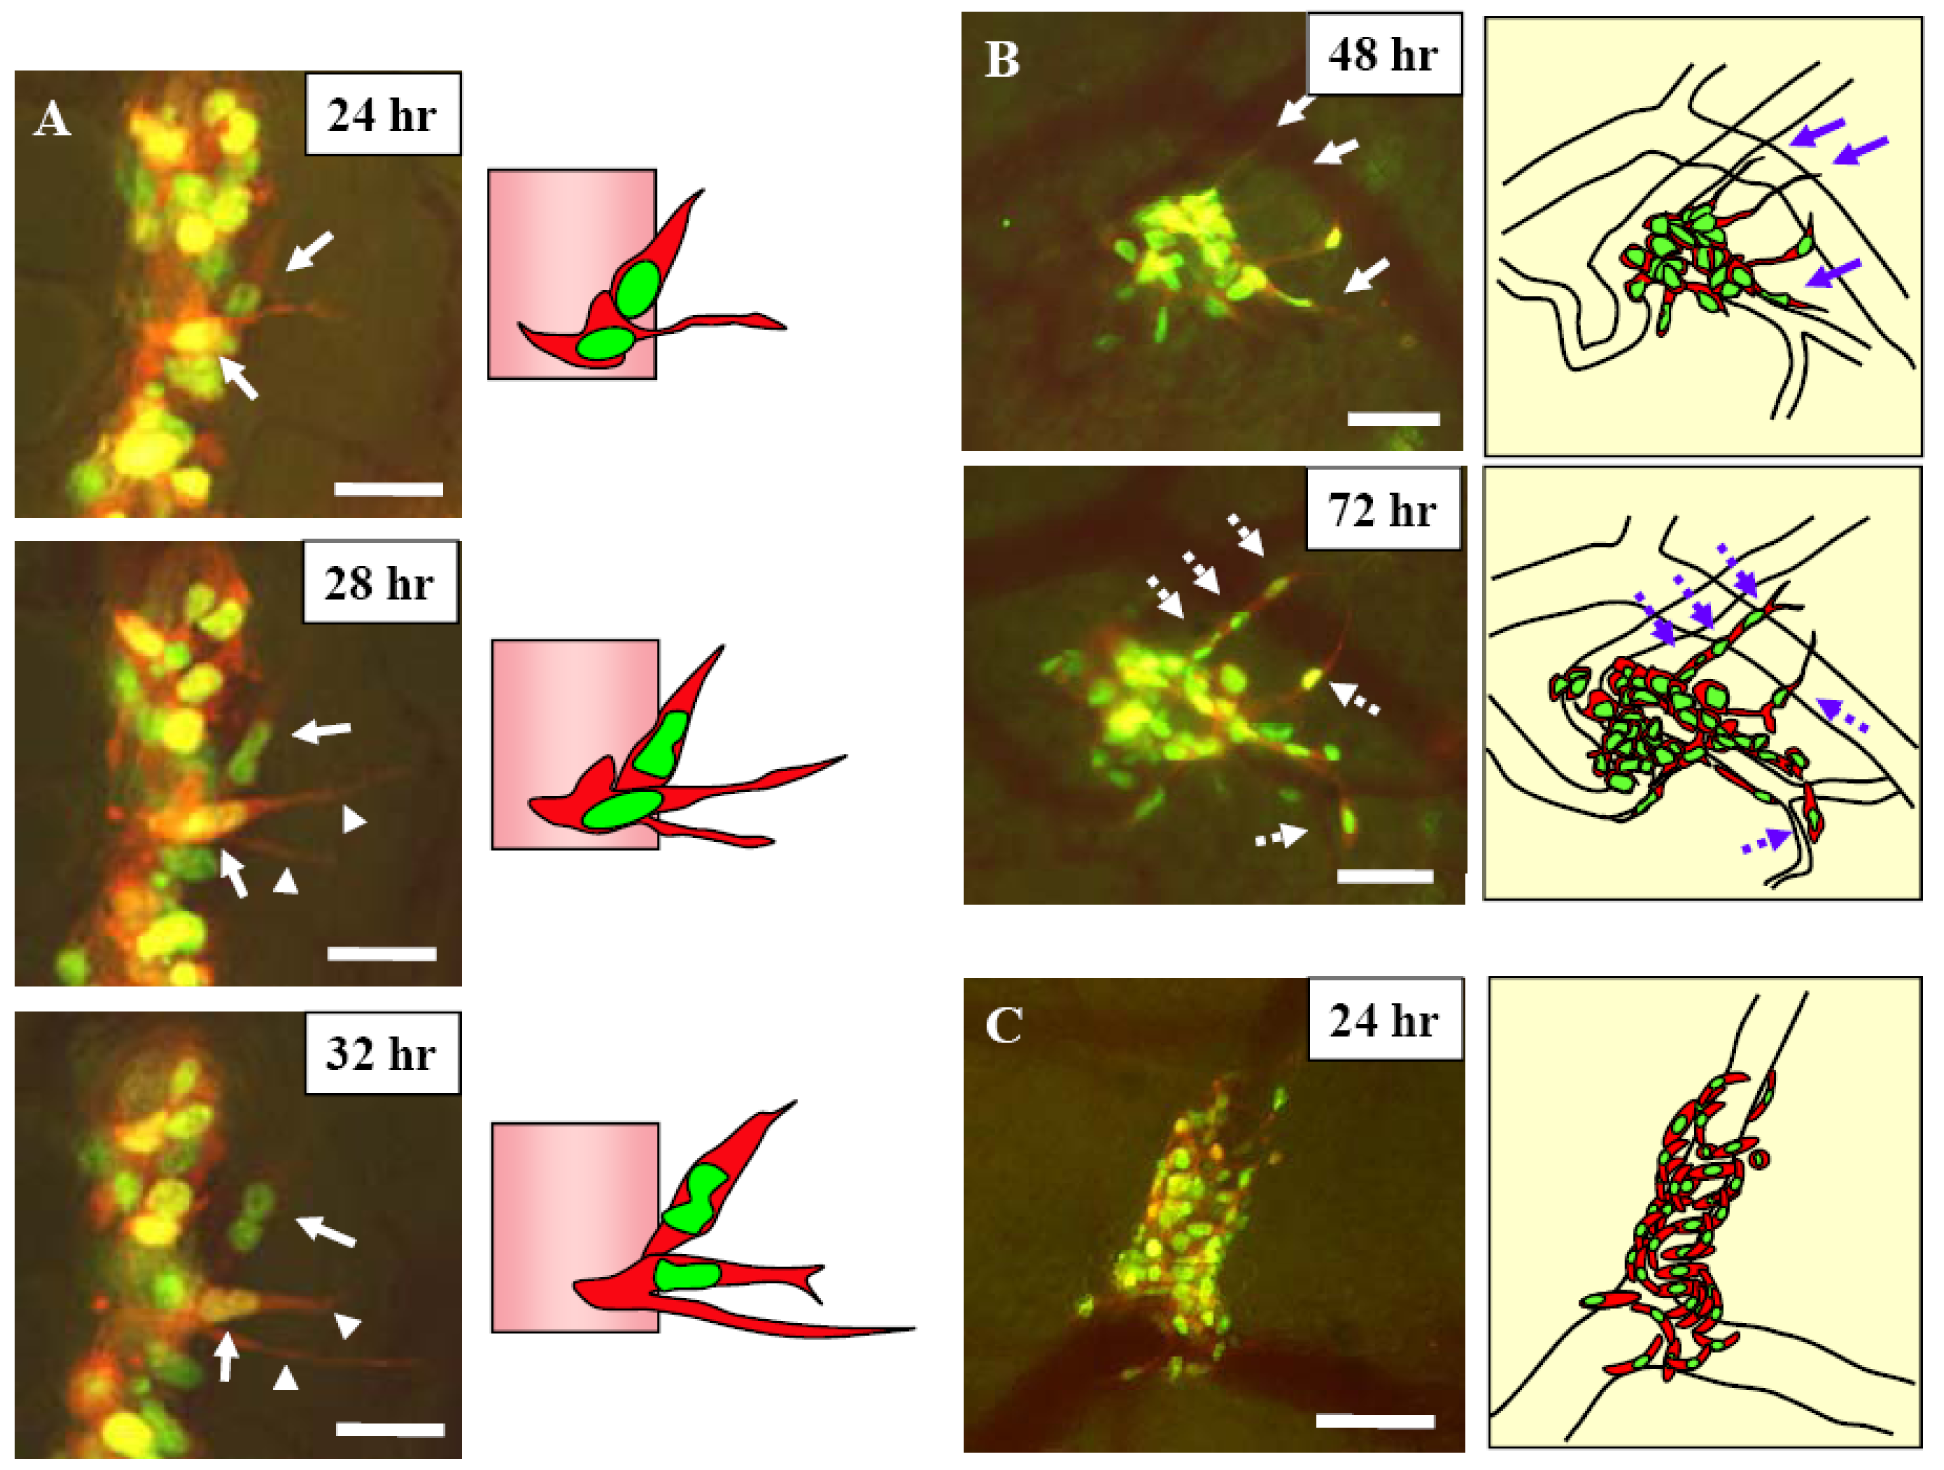
A, 12 hours after injection dual color MMT cells, the skin flap was opened and fixed on a flat stand. Images were acquired every hour for 24 hours with the skin flap open. Two dual color MMT cancer cells are visualized in the process of extravasation 24 hours after injection (arrows). The cancer cells extended fine cytoplasmic projections into the host tissue at the onset of extravasation. One of the cells extended two fine cytoplasmic projections into the host tissue (arrowhead). The nuclei then migrated along the cytoplasmic projection until the whole cell came out of the vessel. Subsequently, the whole cell extravasated. Bar = 20 μm. B, 48 and 72 hours after injection. Cytoplasmic processes were extended along the vessel wall 48 hours after injection (arrows). Cells extravasated in the same direction of the cytoplasmic projections (broken arrows). Images were acquired every 24 hours by opening and closing the skin flap. Bar = 50 μm. C, Invasion and proliferation of MMT cells around a vessel after extravasation. Bar = 50 μm. Images were acquired with the Olympus OV100. Right, schematics of (A), (B), and (C) [21].
Figure 8.
A, 12 hours after injection dual color MMT cells, the skin flap was opened and fixed on a flat stand. Images were acquired every hour for 24 hours with the skin flap open. Two dual color MMT cancer cells are visualized in the process of extravasation 24 hours after injection (arrows). The cancer cells extended fine cytoplasmic projections into the host tissue at the onset of extravasation. One of the cells extended two fine cytoplasmic projections into the host tissue (arrowhead). The nuclei then migrated along the cytoplasmic projection until the whole cell came out of the vessel. Subsequently, the whole cell extravasated. Bar = 20 μm. B, 48 and 72 hours after injection. Cytoplasmic processes were extended along the vessel wall 48 hours after injection (arrows). Cells extravasated in the same direction of the cytoplasmic projections (broken arrows). Images were acquired every 24 hours by opening and closing the skin flap. Bar = 50 μm. C, Invasion and proliferation of MMT cells around a vessel after extravasation. Bar = 50 μm. Images were acquired with the Olympus OV100. Right, schematics of (A), (B), and (C) [21].

Figure 9.
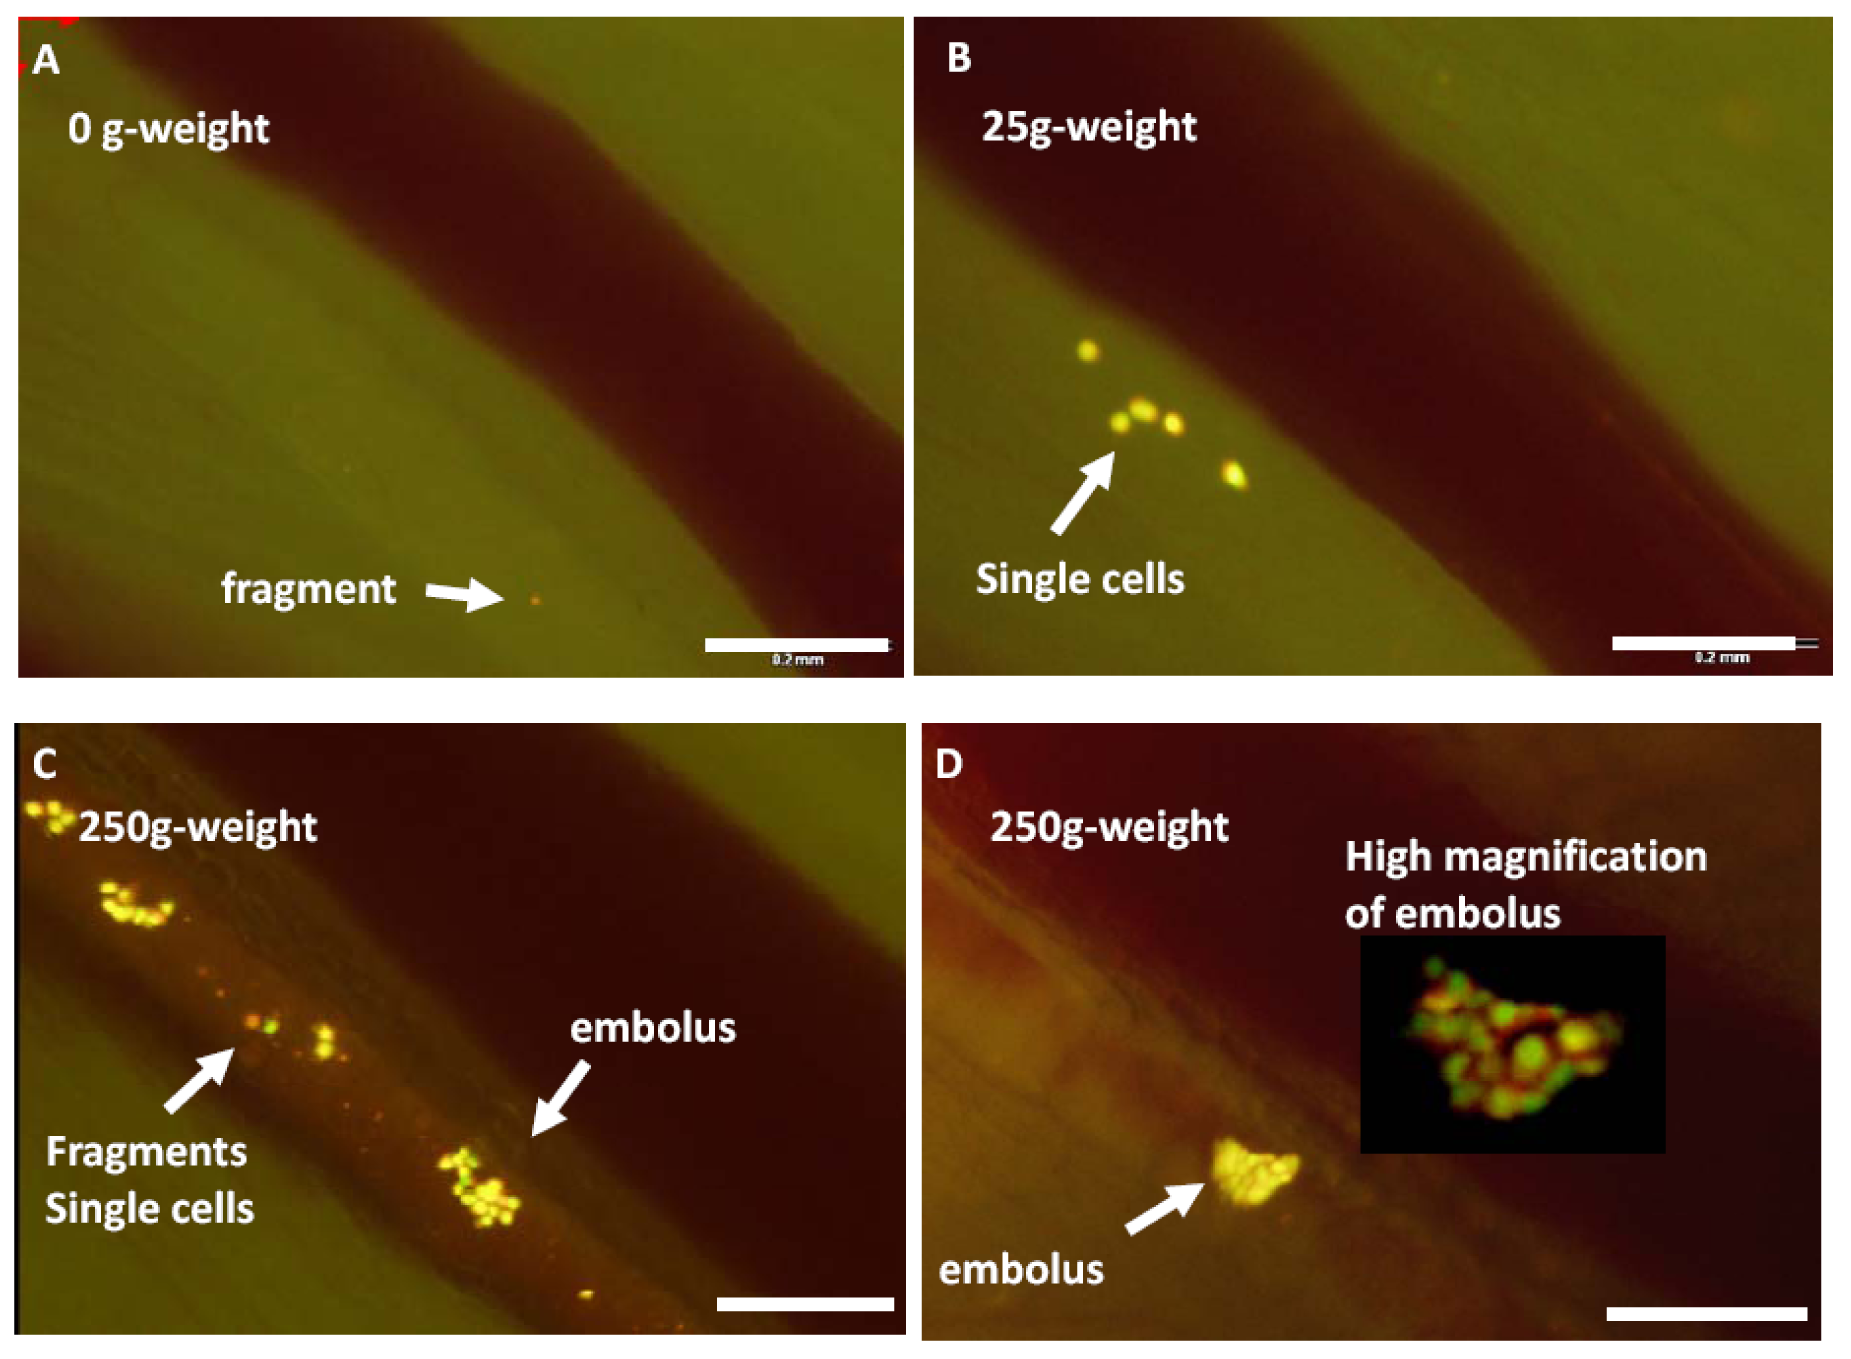
A footpad tumor, formed after injection of HT1080-GFP-RFP cells, was stimulated by 25- or 250-g weight for 10 s each to increase the internal pressure of the tumor. Stimulations were conducted on the same mouse with a minimum 5-min interval. A cylindrical weight with a 10-mm diameter was used for the stimulation. After stimulation, video rate imaging visualized cancer cell trafficking in the lymphatic vessel with the Olympus OV100 system at x100 magnification for 1 min. The numbers of cell fragments, single cells, and emboli shed into the lymphatic vessel were counted by reviewing the saved movie files. The major axis of the maximum-size shed embolus in each experiment was also measured. A, No weight stimulation onto the footpad. There are only a few fragmented cells in the lymph duct. B, After a 10-s stimulation with a 25-g weight on the footpad, single cells as well as cell fragments are observed trafficking in the lymph duct. C and D, After a 10-s stimulation with the 250-g weight on the footpad, more cell emboli, single cells, and fragments were shed in the lymph duct. Dual-color cell was useful to distinguish the cell condition. D, A high magnification image of the embolus is also shown. Bar 200 μm [36].
Figure 9.
A footpad tumor, formed after injection of HT1080-GFP-RFP cells, was stimulated by 25- or 250-g weight for 10 s each to increase the internal pressure of the tumor. Stimulations were conducted on the same mouse with a minimum 5-min interval. A cylindrical weight with a 10-mm diameter was used for the stimulation. After stimulation, video rate imaging visualized cancer cell trafficking in the lymphatic vessel with the Olympus OV100 system at x100 magnification for 1 min. The numbers of cell fragments, single cells, and emboli shed into the lymphatic vessel were counted by reviewing the saved movie files. The major axis of the maximum-size shed embolus in each experiment was also measured. A, No weight stimulation onto the footpad. There are only a few fragmented cells in the lymph duct. B, After a 10-s stimulation with a 25-g weight on the footpad, single cells as well as cell fragments are observed trafficking in the lymph duct. C and D, After a 10-s stimulation with the 250-g weight on the footpad, more cell emboli, single cells, and fragments were shed in the lymph duct. Dual-color cell was useful to distinguish the cell condition. D, A high magnification image of the embolus is also shown. Bar 200 μm [36].
© 2008 by MDPI Reproduction is permitted for noncommercial purposes.
Share and Cite
MDPI and ACS Style
Hoffman, R.M. Imaging In Mice With Fluorescent Proteins: From Macro To Subcellular. Sensors 2008, 8, 1157-1173. https://doi.org/10.3390/s8021157
AMA Style
Hoffman RM. Imaging In Mice With Fluorescent Proteins: From Macro To Subcellular. Sensors. 2008; 8(2):1157-1173. https://doi.org/10.3390/s8021157
Chicago/Turabian StyleHoffman, Robert M. 2008. "Imaging In Mice With Fluorescent Proteins: From Macro To Subcellular" Sensors 8, no. 2: 1157-1173. https://doi.org/10.3390/s8021157