An Auto-Recognizing System for Dice Games Using a Modified Unsupervised Grey Clustering Algorithm

Department of Mechatronic Engineering, Huafan University, Taipei, Taiwan
Sensors 2008, 8(2), 1212-1221; https://doi.org/10.3390/s8021212
Submission received: 17 November 2007
/
Accepted: 14 February 2007
/
Published: 21 February 2008
(This article belongs to the Special Issue Intelligent Sensors)
Abstract
:In this paper, a novel identification method based on a machine vision system is proposed to recognize the score of dice. The system employs image processing techniques, and the modified unsupervised grey clustering algorithm (MUGCA) to estimate the location of each die and identify the spot number accurately and effectively. The proposed algorithms are substituted for manual recognition. From the experimental results, it is found that this system is excellent due to its good capabilities which include flexibility, high speed, and high accuracy.
1. Introduction
In casinos the score of dice is generally obtained by visual inspection because of suspicions about the potential for cheating with electronic devices. Here, we propose an automated detection system with machine vision to execute such inspection. Machine vision is a powerful tool and is widely employed in automatic monitoring and detecting processes. Many applications [1, 2] for dice gambling machines using machine vision have been proposed. Lapanja et al. [1] provided a complete overview of a reliability control module for an electro-mechanical dice gambling machine based on a machine vision technique. The chroma-key principle and the smoothing vectors were used to estimate the location of each die, and a template matching technique was proposed for fine-tuning and detecting the number of spots. However, estimated results depended on the image contrast. Another system [2] which automated the tasks of detection and classification of the dice scores on the playing tables in casinos was based on the online analysis of images captured by a monochrome CCD camera and the spots of dice were extracted. This system includes − (1) the diameter of each spots and the distance between each spots on the die surface had to be known before the detection process, (2) a sort of template matching was repeated to classify dice and all spots associated to each die. In addition, an electromechanical dice gambling machine [3] was established to detect dice location based on contactless electronic ID keys and a scanner. As machine vision was not provided during the recognition process, the suspicion of cheating cannot be eliminated.
Because of the above-mentioned issues, a novel auto-recognition system is proposed to estimate the location of each die and the score of dice accurately and effectively in the games using machine vision techniques. In this paper, the modified unsupervised grey clustering algorithm is proposed to establish an auto-recognition system for several dice in the games. The grey clustering algorithm was primarily based on the grey theory [5-10]. The aims of grey theory are to provide relational analysis, predication, decision, control, and clustering data for the grey system. The grey theory has been applied to research in industry, social system, ecological system, environmental system, education, business management, and traffic control. The grey clustering algorithm is an essential topic in grey system theory. Hsu et al. [11] proposed a system to predict variations of stock market using the grey clustering method. Yang et al. [12] applied a grey prediction model to predict the recovery rate of vegetation according to the satellite images of landslide caused by an earthquake.
The object of the present study is to automatically recognize the score of dice. This study develops an iterative calculation that is suitable for dice identification, and is organized as follows: an image acquisition system, an image processing method, the proposed modified unsupervised grey clustering algorithm, and an auto-recognition system for dice are presented in Section 2. Experimental results are summarized in Section 3. Section 4 contains conclusions about the proposed system.
2. Materials and Methods
2.1. Image acquisition
In order to obtain online images for auto-recognition, a machine vision system was being developed. This system includes a CCD (coupled-charge device) monochrome camera (WAT-902B, Watec Inc) with a zoom lens, a frame grabber (Meteor, Matrox Inc), and a personal computer (Intel Pentium 4 processor 2.4 GHz). Visual Basic 6.0 programming is linked to grab the monochrome images of 640×480 pixels and perform the image processing. The CCD camera was employed for image acquisition with a light intensity of 4150 lx and F4.0 opening (iris diaphragm). The images are stored in the hard drive as tagged image file format (TIF).
2.2. Image processing and modified grey clustering algorithm
Segmenting the spot images of dice is an important procedure in the classification process. The spot images are extracted by using the global thresholding, hole-filling, closing, and opening operators [4], respectively, as illustrated in Figure 1. The location of each die can be obtained according to the images of spots. This geometric characteristic would be treated as the reference data to recognize the spot number.
It is difficult to auto-recognize the score of dice in the acquired images because dice are scattered anywhere in a bowl. A brief summary of the grey relational analysis theorem [5-10] is given before introducing the grey clustering algorithm [8, 9]. Grey relational analysis is an anticipation method for some sequence data with incomplete information. Assume that the normalization sequences are defined as xi = {xi(1), xi(2),…, xi(k)}, where i ∈ I = {1,2,…, m} and k ∈ K = {1,2,…, n}. For a specified reference sequence xi and the comparative sequences xj, j ∈ I = {1,2,…, m}, the grey relational coefficient between xi and xj at the kth datum is defined as
where Δij(k) = |xi(k) − xj (k)|,
,
, and ξ ∈ (0, L] is the distinguishing coefficient which controls the resolution between Δmax and Δmin . Indeed, ξ is an adjustable parameter according to different demands and L is a constant. The role of ξ is to adjust the distinction relation between Δij(k) and Δmax. However, the grey relational coefficient r is always between 0 and 1 for any value of ξ .
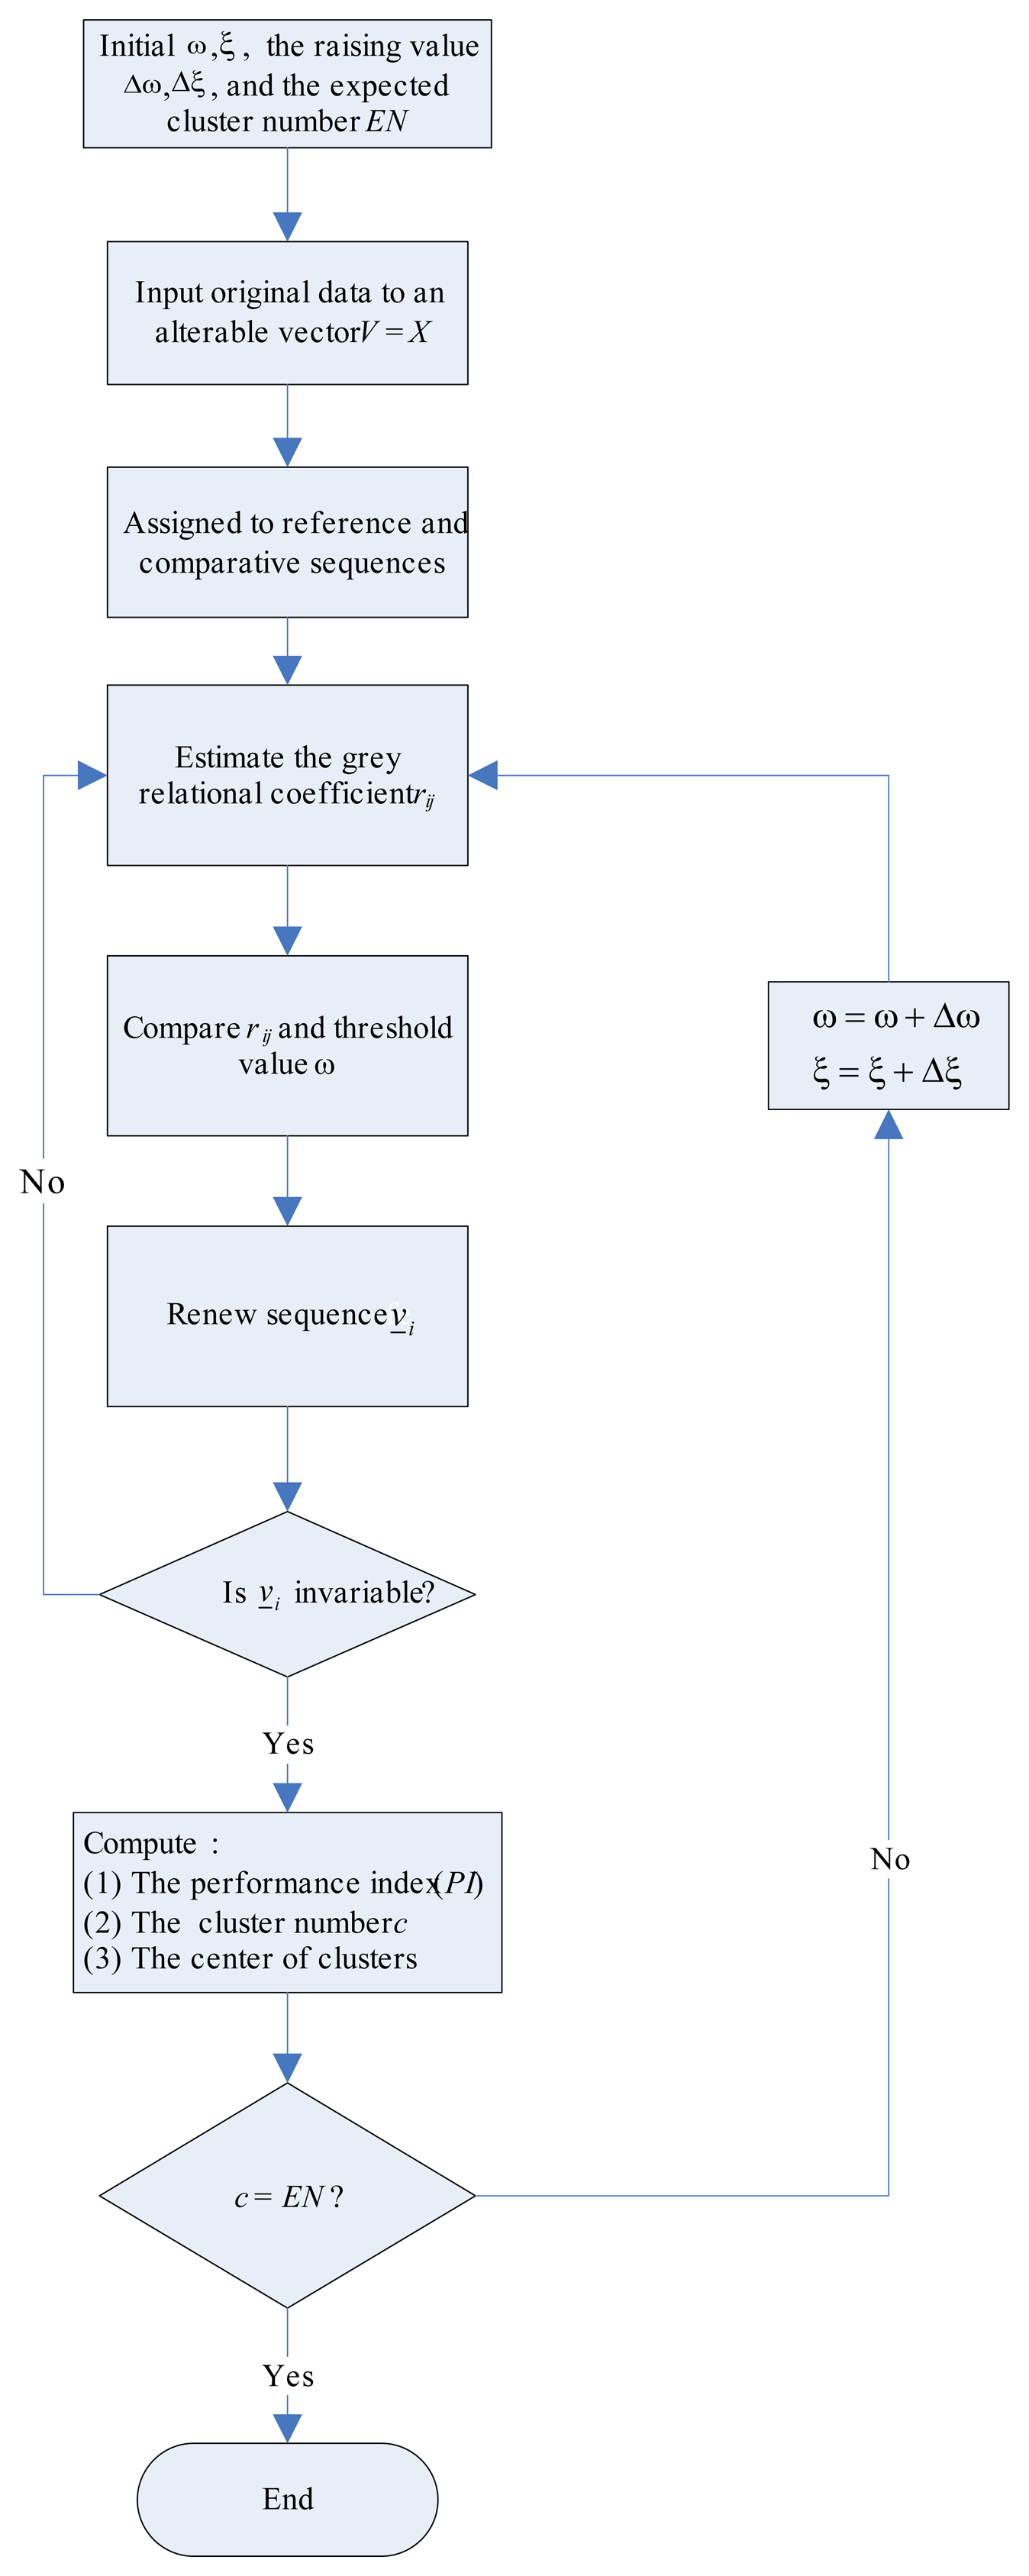
The unsupervised grey clustering algorithm (UGCA) [7] is based on the grey relational analysis. The relational level is obtained according to the grey relation of data. The relational coefficient r is an index that describes the relationship between the data sets. The grey clustering method assembles the data into clustering according to the correlation between those. In this study, the modified unsupervised grey clustering algorithm (MUGCA) is used to classify the dices and is described as follows (Figure 2).
Assume that the n-dimensional input data is defined as X = {x̠1, x̠2, …, x̠n}, and the ith reference sequence is denoted as x̠i = {xi(1), xi(2),…, xi(m)}, where i = 1,2,…, n, and each sequence include m features. The jth comparative sequence is represented as x̠j = {xj(1), xj(2), …, xj(m)}.
- Step 1
- Initialize the weights and parameters
- (1)
- Initialize the weighting ω ∈ (0,1) and the raising value Δω corresponding to the grey relational coefficient.
- (2)
- Initialize the distinguishing coefficient ξ ∈ (0,3] and the raising distinguishing value Δξ.
- (3)
- Initialize the expected number of clusters EN.
- Step 2
- Define an alterable vector V = {ν̠1, ν̠2, …, ν̠n} = X, where ν̠i = x̠i, i = 1,2,…,n.
- Step 3
- Determine the grey relational coefficient rij between the reference sequence ν̠i and the comparative sequence ν̠j aswhere i= 1,2,…, n, j = 1,2,…,n, and .
- Step 4
- Renew the sequence ν̠i = {νi(1), νi(2), …, νi(m)} for i = 1,2,…,n, as follows.where k = 1,2,…,m, and .
- Step 5
- If ν̠i is invariable, then execute the next step continuously, otherwise return to Step 3.
- Step 6
- Compute the performance index (PI) defined aswhere c is the cluster number. Gi,i = 1,2,…,c is the set with the ith clustering data. N(Gi) is the element number of the set Gi and cci is the center of Gi given by
- Step 7
- If c=EN, then stop the process. Otherwise, adjust the parameters (ω = ω + Δω, ξ = ξ + Δξ, and ω < 1, ξ ≤ 3) and go to Step 3. Among those weighting values (ω), the one with the minimal performance index (PI) is termed an optimal value when c = EN.
The biggest difference between UGCA and MUGCA is that the cluster number is an unknown parameter in the UGCA process, but is defined as an expected value in MUGCA process. In addition,the distinguishing coefficient ξ is an adjustable parameter in MUGCA instead of a constant in UGCA. In this paper, we use MUGCA to identify several scattered dices in a bowl. The positions of spots of dices in x-y plane are set as the input features of sequences defined as X = {x̠1,x̠2}, where x̠1and x̠2 are the features of comparative sequences simultaneously. The number of dice is assumed to be the expected cluster number (EN). Parameters m, k and n are the total number of spots, the serial number of spots and the number of input features, respectively. The result of recognition will be incorrect if the obtained cluster number is not equal to the expected cluster number (i.e., the number of dice).
3. Results and Discussion
In this paper, the modified unsupervised grey clustering software (MUGCS) is designed with Matlab 7.0, and the interface of MUGCS is shown in Figure 4.
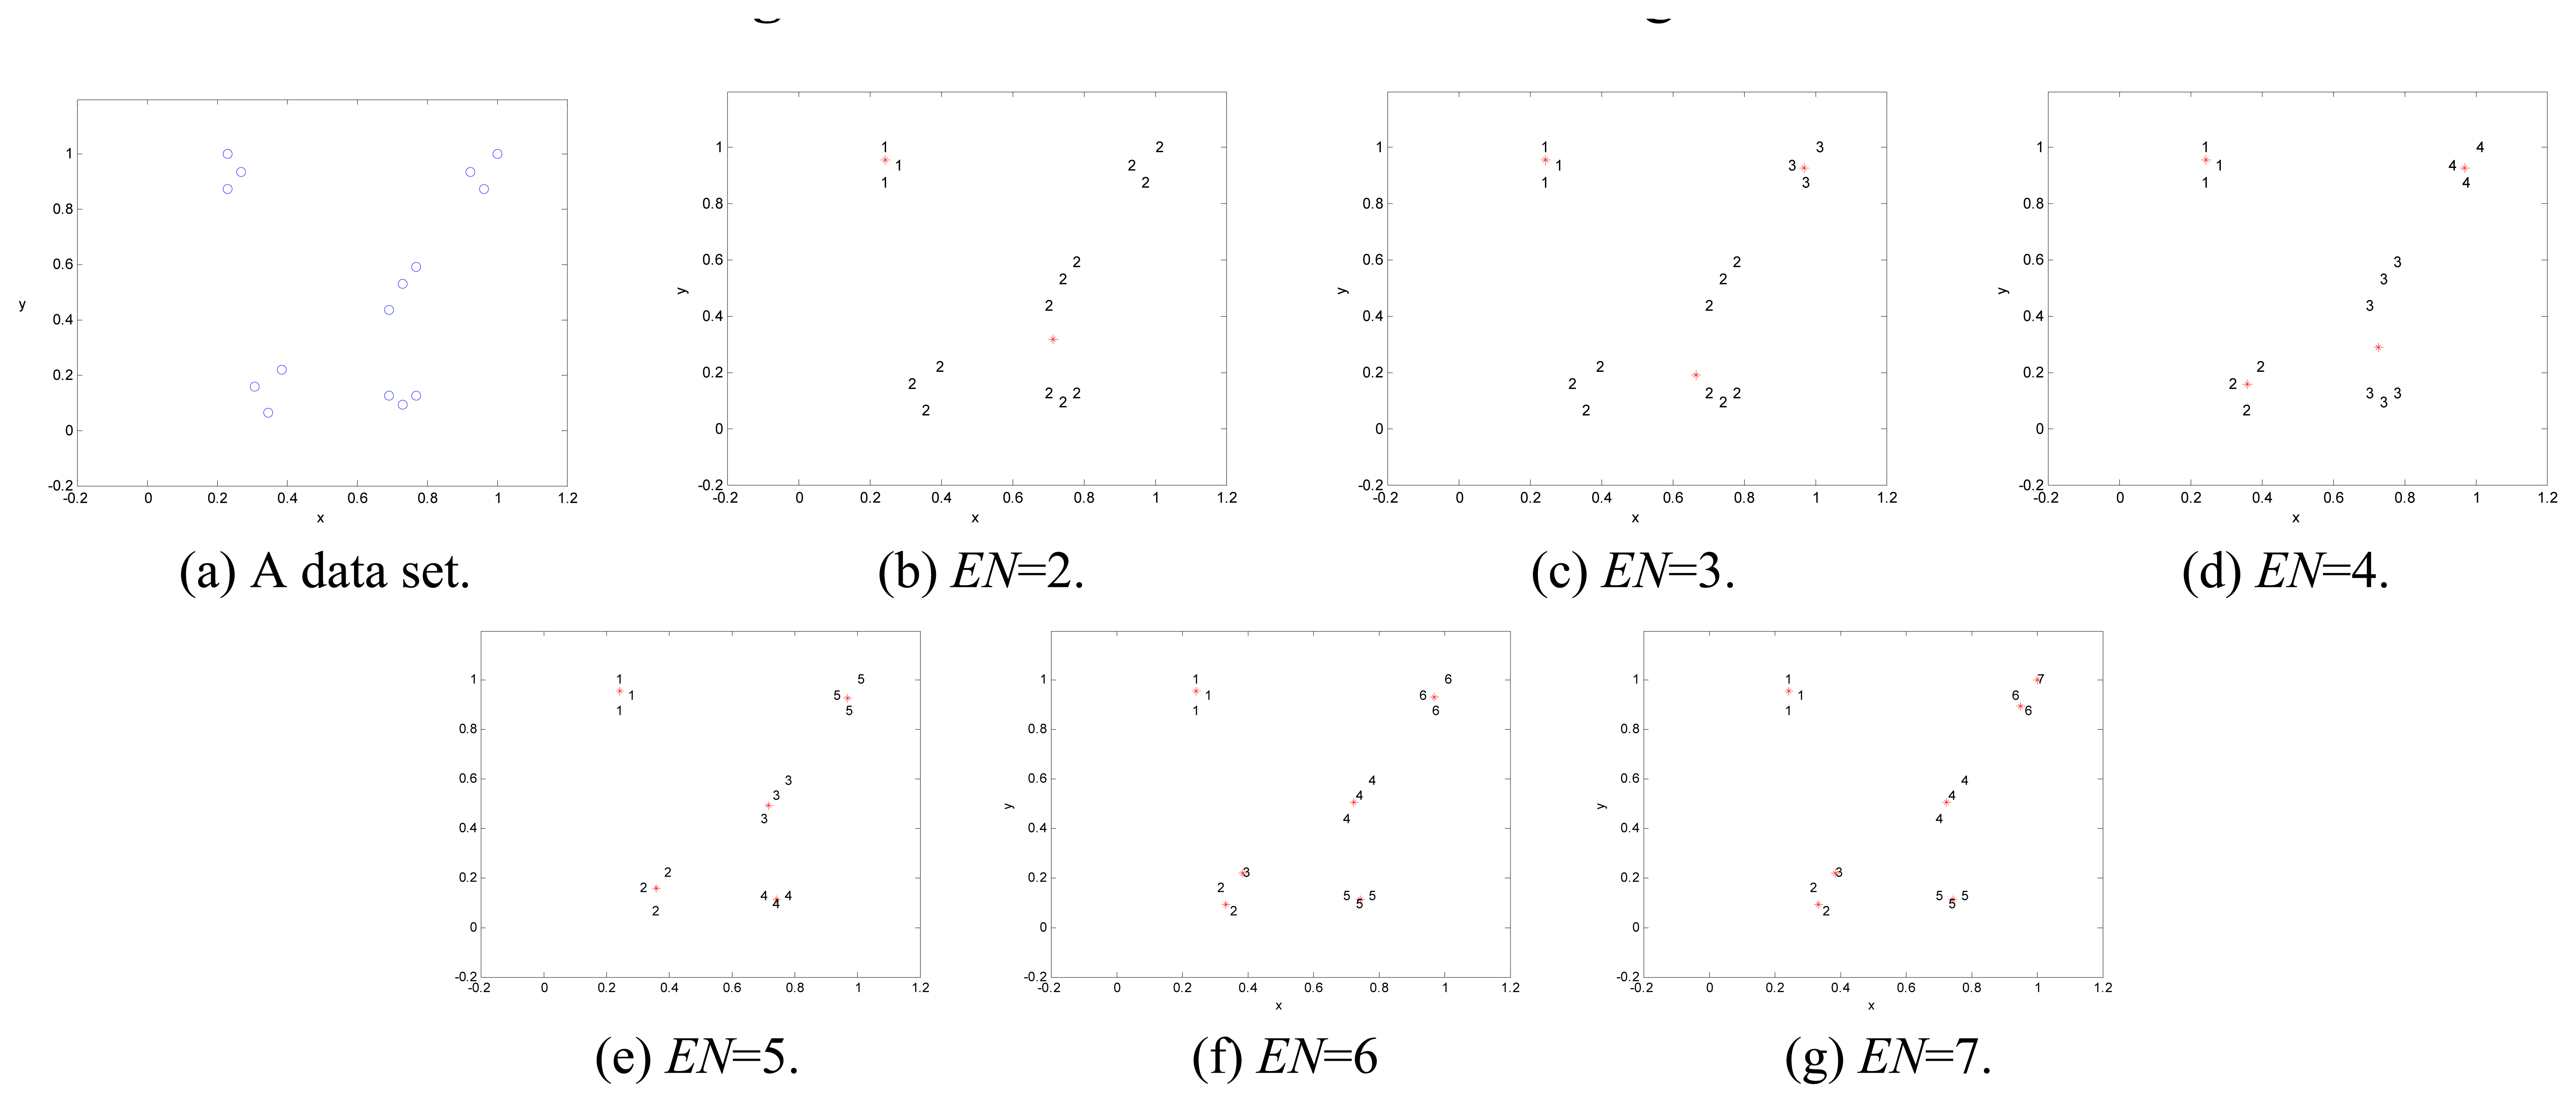
For example, considering a two-dimensional data set, as shown in Figure 5(a), MUGCS is used to classify the clusters for a data set with an initial distinguishing coefficient ξ= 0.1, an initial weighting coefficient ω = 0.2, the raising values Δω = 0.05 and Δξ = 0.1, and the expected cluster numbers EN = 2, 3, 4, 5, 6, 7 individually. The locations and the clustering results of data are indicated in Figures 5(b)-5(g), and the cluster centers are marked by the symbol “*”. The expected cluster number (EN), performance index (PI), and two optimal parameters ξ, ω, are given in Table 1. The value of PI varies while the cluster number is changing. Then, the optimal value of PI can be obtained. Thus, MUGCS can classify a data set to several clusters. Finally, MUGCA is executed to recognize the location and the spot number of each die (cluster) in this study.
The advantages of MUGCA comparing with UGCA are described as follows. The experimental parameters of ω and ξ can't be adjusted in UGCA process automatically. Moreover, EN value is a convergence index and denotes the score of dice, but UGCA process is short of EN value. Therefore, the score of dice can't be found using UGCA correctly and flexibly. Thus, MUGCA is more flexible than UGCA.
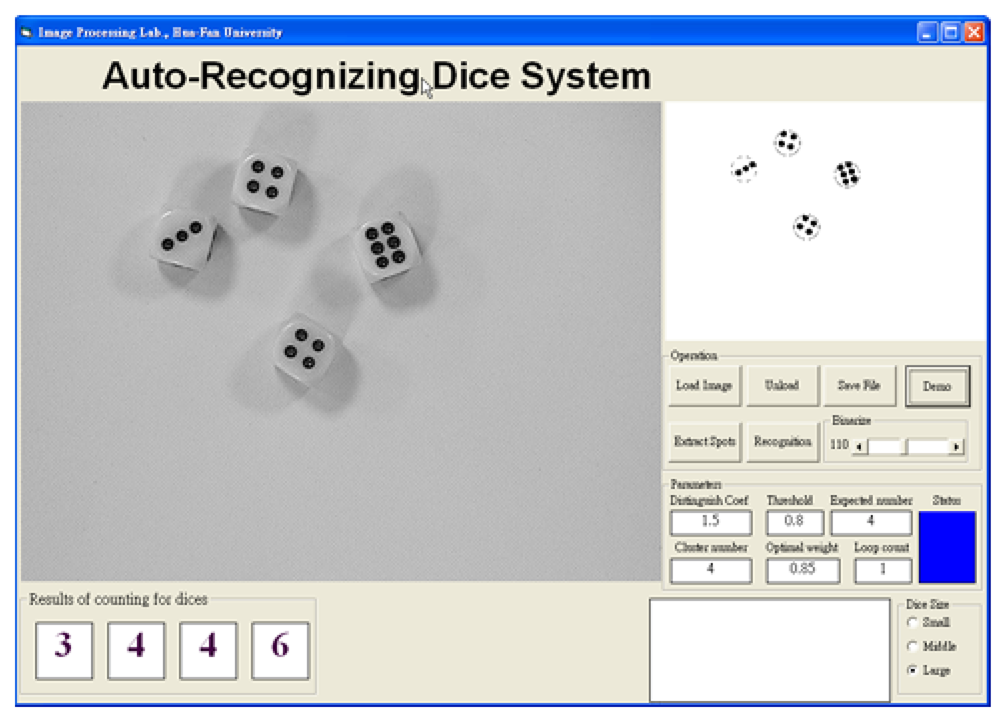
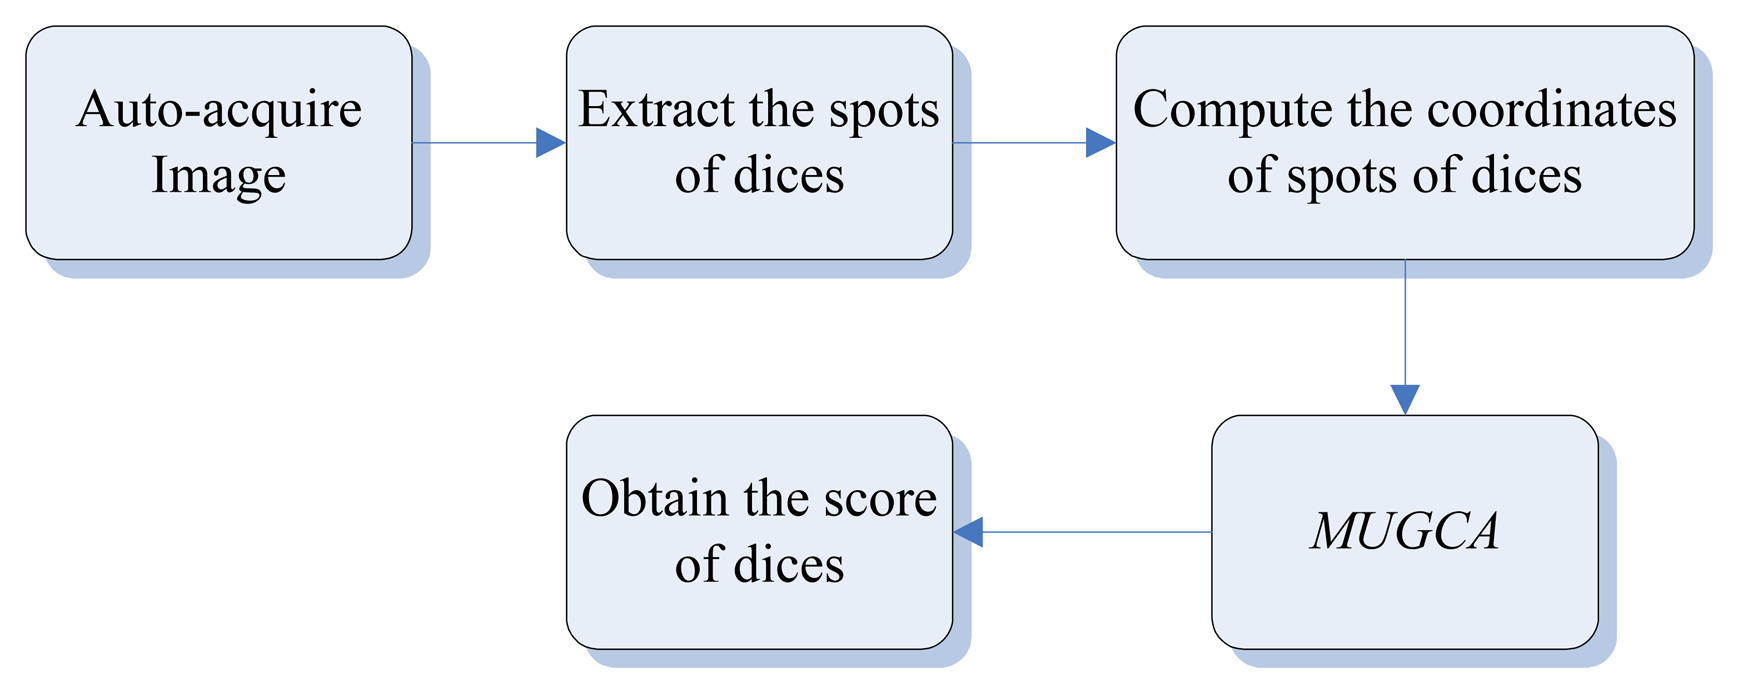
The auto-recognition of dice system (ARDS) software is written using image processing techniques and MUGCA in Visual Basic 6.0 with MIL 8.0 library, as shown in Figure 6. The functions of ARDS include the file operations (acquire, load, and save images), image analysis operations (binary operator, hole-filling, remove noise using closing and opening, compute the coordinates of dice spots), and initializing parameters (initial clustering weighting value, distinguishing coefficient, and the dice number which is given by the user). The optimal clustering weighting, the distinguishing coefficient, and the score of dice can be obtained by ARDS computing. Furthermore, the score of spots for several dice can be estimated exactly and rapidly by ARDS. For example, it takes less than a few seconds for ARDS to identify six dice which are scattered in a bowl, as shown in Figure 6.
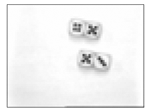
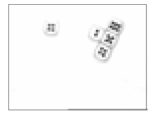
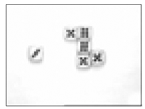
In general, the dices are undistinguishable when they are abreast in a bowl. Three types of four abreast dice are shown in Figure 7. However, the ARDS can easily separate abreast dice as illustrated in Figure 8. Furthermore, the recognizing ability of ARDS is independent of the image size of the dice. The locations of dice in Figure 9(a) and 9(b) are the same, but the acquired images are different in the size of distances between the dices for the different position of the CCD camera. The same classification results are obtained using ARDS software, as shown in Figures 9(c) and 9(d).
One hundred sample sets including 3, 4, 5, and 6 dice were randomly sampled from acquired image in order to test ARDS software. After all, an accuracy rate 100% can be achieved when threshold value setting is between 100 and 150 in binary process under a controllable environment. For example, detection results were 4, 5, 5, 3 instead of 2, 5, 5, 3 when threshold value is 90 as shown in Figure 10. The average of iteration number is 21 after testing by ARDS software. Table 2 presents the classification results of three samples. Even for low contrast images, acceptable results can still be obtained (Figure 11).
PI represents the sum of average distances between clustering data and the clustering center. decreases with increased clustering weight value (which indicated there is a larger cluster number), and PI value decrease as the cluster number increases. When the cluster number is equivalent to the number of dice and PI achieves an optimal value, the location of each die and the score can be exactly determined. The clustering weight value and the distinguishing coefficient keep changing until the dice are exactly identified. The optimal clustering weighting is smaller while the dice are more scattered in a bowl. On the other hand, the optimal clustering weighting is larger while the dice are closer together in a bowl. Thus, the clustering weighting value is the evaluated parameter of the recognition accuracy for determining the location and the score of dice. Therefore, the changing parameter is not irregular with different dice locations. Our proposed system is an unsupervised system and its operation does not require a matching template. The classification process is independence of the size of dice images and is applicable to different styles of dice. In addition, the system is workable even for low contrast images.
4. Conclusions
In this paper, a novel machine vision system is used to identify the score of dice in games. Firstly, we obtain an image of dice using an auto-acquisition method with machine vision. Secondly, the locations of spots on the dice are estimated by the image processing techniques. Finally, a modified unsupervised grey clustering algorithm is proposed to identify the spot number of each die. In traditional methods, manual detection with human eyes is used to recognize dice, thus we propose a methodology which can estimate the score of dice in dice games accurately and effectively. Our system has performed at 100% detection capability.
References and Notes
- Lapanja, I.; Mraz, M.; Zimic, N. Computer vision based reliability control for electromechanical dice gambling machine. Industrial Technology, Proc. IEEE Int. Conf. 2000, 2, 325–328. [Google Scholar]
- Correia, B.A.B.; Silva, J.A.; Carvalho, F.D.; Guilherme, R.; Rodrigues, F.C.; Ferreira, A.M.S. Automated detection and classification of dice. SPIE 1995, 2423, 196–202. [Google Scholar]
- Bergant, U.; Zimic, N.; Lapanja, I. Design considerations of an electromechanical dice gambling machine. Industrial Technology, Proc. IEEE Int. Conf. 2000, 1, 444–447. [Google Scholar]
- Gonzalez, R.C.; Woods, R.E. Digital image processing, 2nd ed.; Prentice Hall: Englewood Cliff, NJ, 2002. [Google Scholar]
- Deng, J.L. Control problems of grey systems. Syst. Control Lett. 1982, 1, 288–294. [Google Scholar]
- Deng, J.L. Introduction to grey system theory. The Journal of Grey System 1989, 1(1), 1–24. [Google Scholar]
- Wen, K.L. Grey systems modeling and prediction.; Yang's Scientific Research Institute: Tucson, AZ, USA, 2004. [Google Scholar]
- Wong, C.C.; Chen, C.C.; Lai, H.R. Fundamental method and applications of grey system.; Gau-Lih: Taiwan, 2001; in Traditional Chinese. [Google Scholar]
- Wong, C.C.; Chen, C.C. Data clustering by grey relational analysis. J. Grey Syst. 1998, 10, 281–288. [Google Scholar]
- Wong, C.C.; Lai, H.R. A new grey relational measurement. J. Grey Syst. 2000, 12, 341–346. [Google Scholar]
- Hsu, Y.T.; Lin, G.G.; Chou, Y.M. Predictions of tops and bottoms of stock market based on grey clustering method. Joint Conf. AI Fuzzy Syst. Grey Syst. 2003. [Google Scholar]
- Yang, C.M.; Chen, J.C.; Peng, L.L.; Yang, J.S.; Chou, C.H. Chi-Chi Earthquake-caused Landslide:grey prediction model for pioneer vegetation recovery monitored by satellite images. Bot. Bull. Acad. Sin. 2002, 43, 69–75. [Google Scholar]
Figure 1.
The dice images.
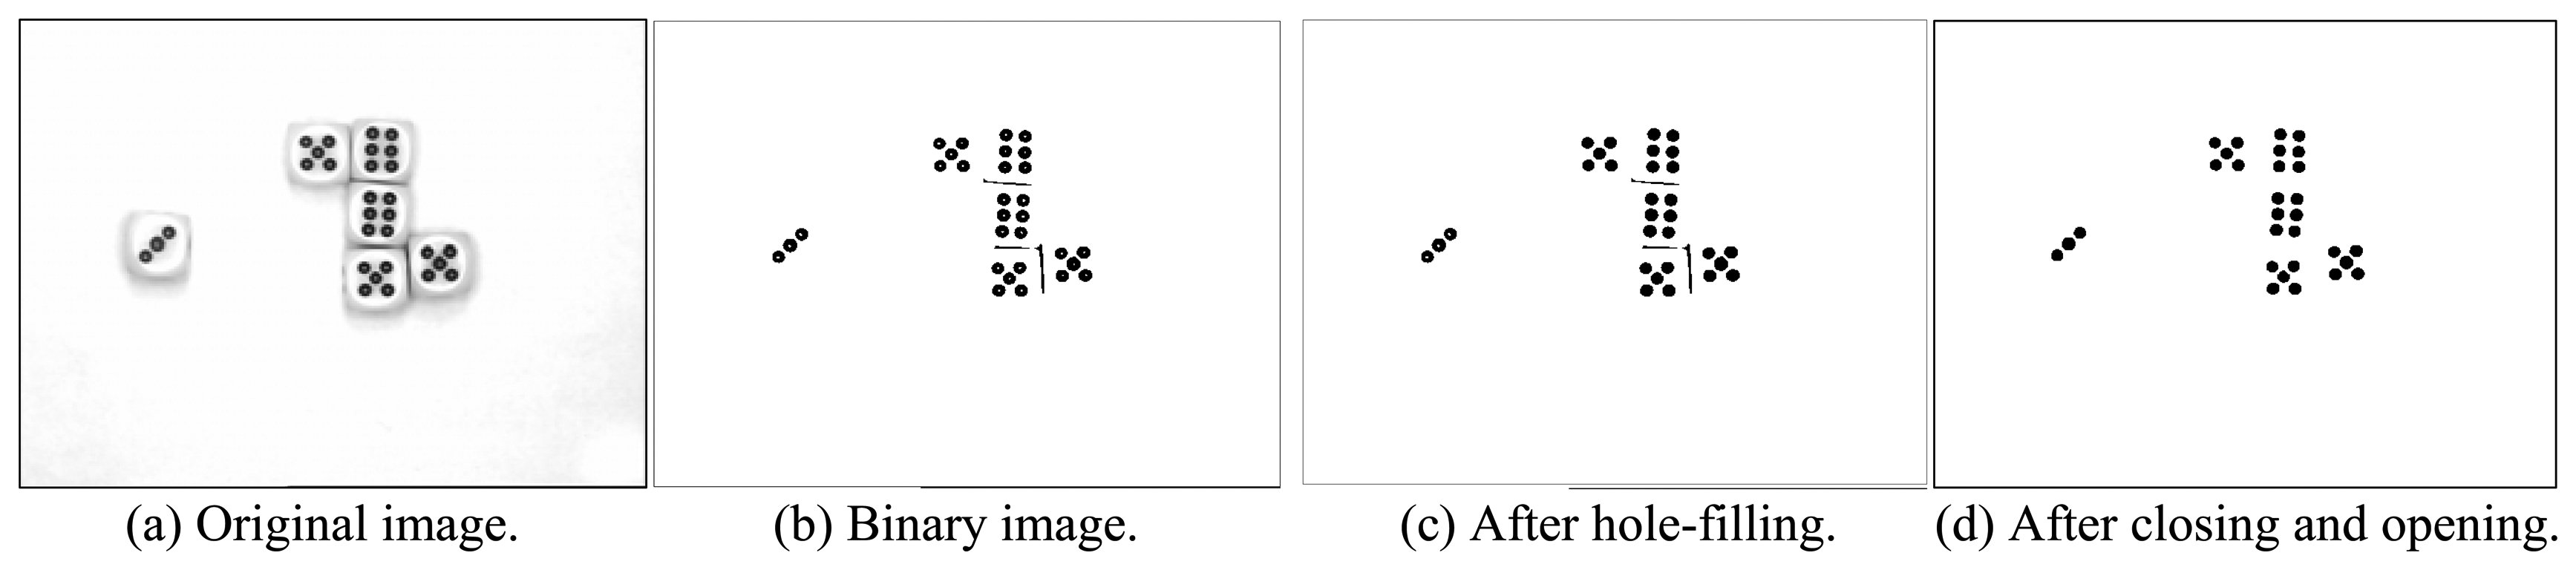
Figure 2.
The steps of MUGCA.

Figure 3.
The steps for recognizing dice.

Figure 4.
The interface of MUGCS.
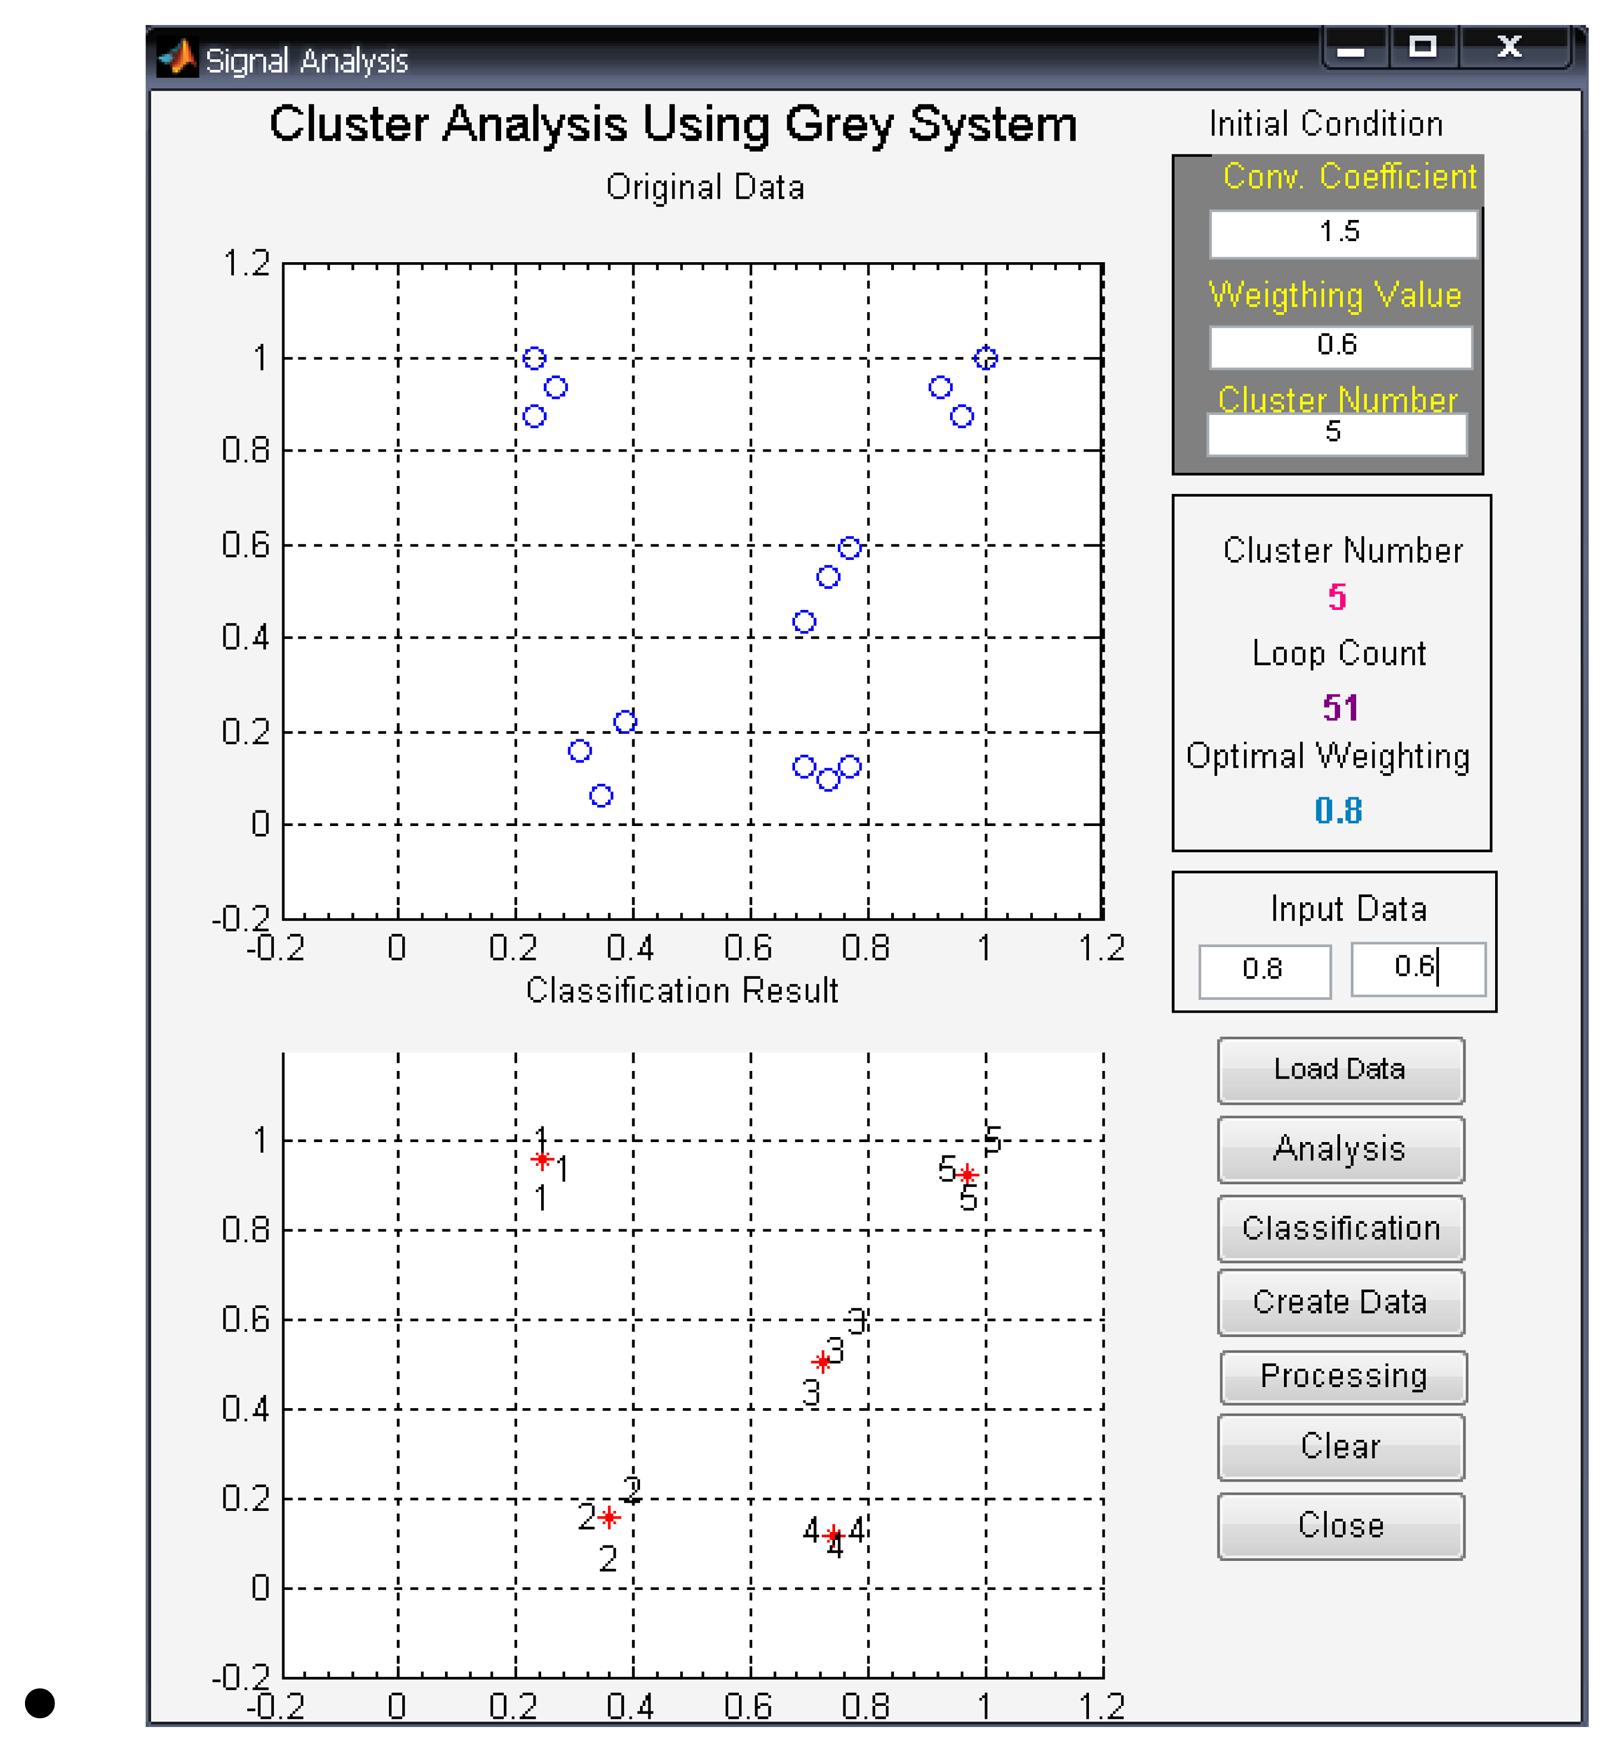
Figure 5.
A data set and the clustering results.

Figure 6.
The interface of ADRS and the results of classification for six dices.
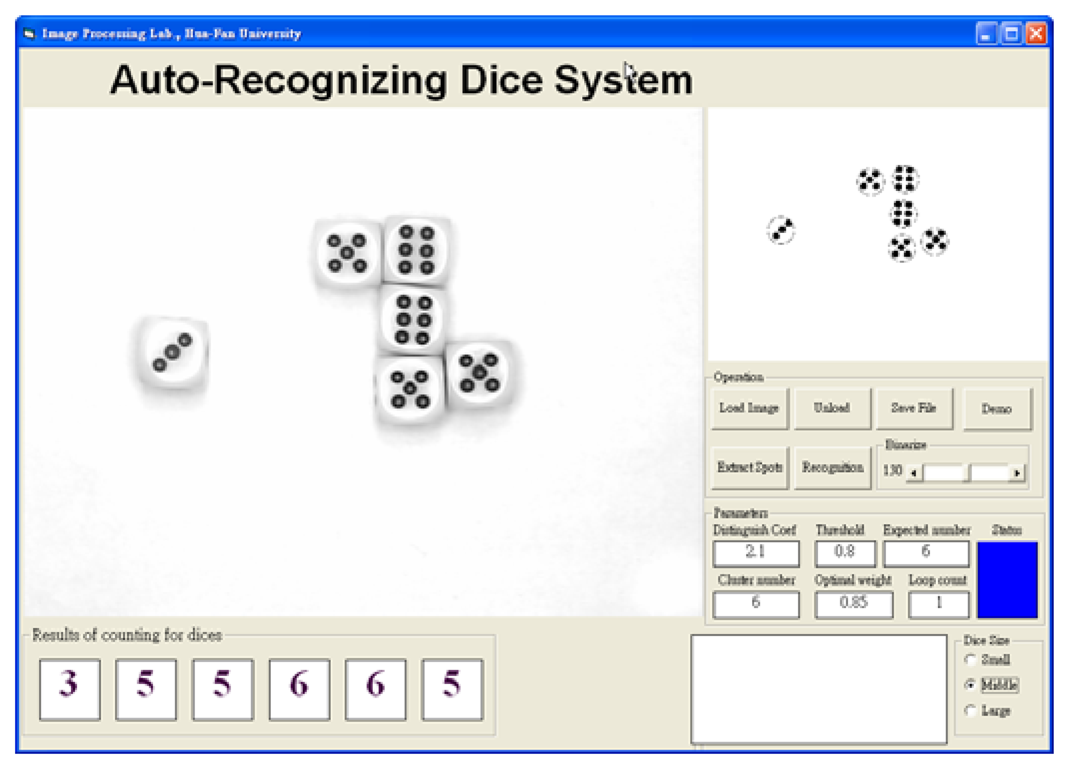
Figure 7.
Abreast dice.
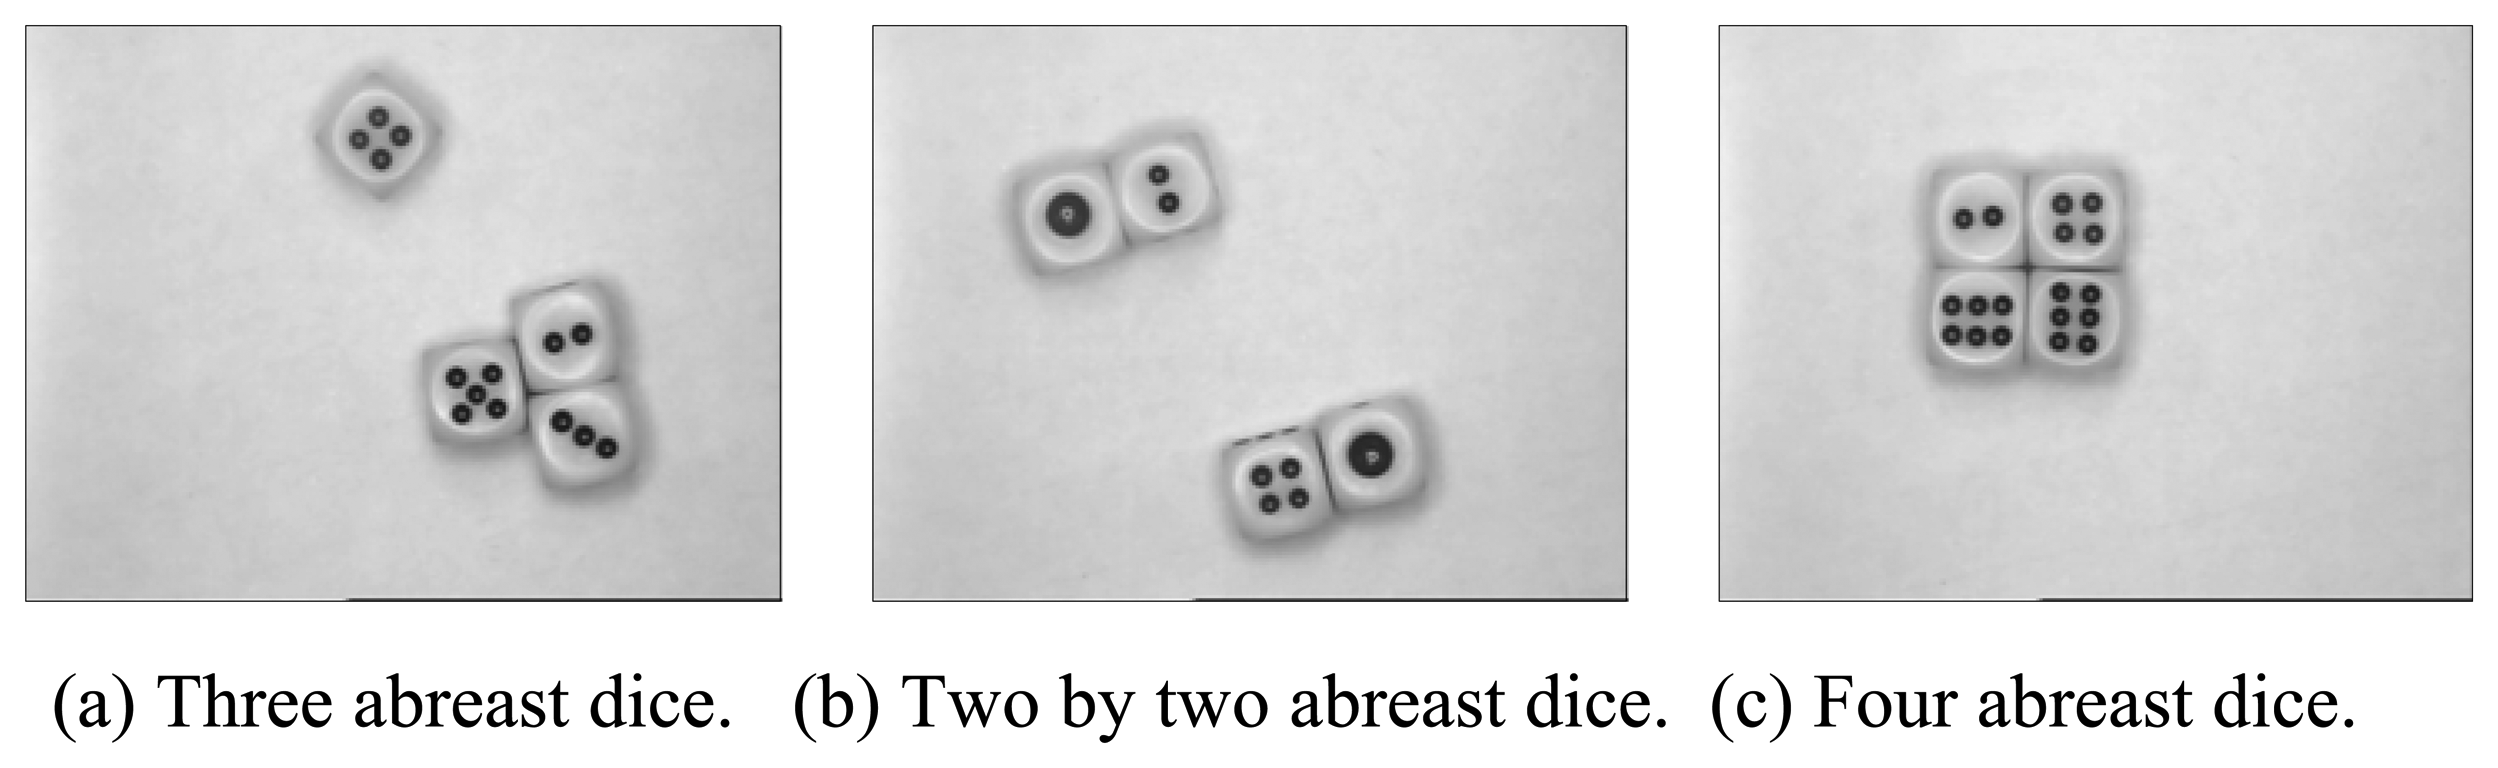
Figure 8.
The classification results for abreast dices with MUGCA.
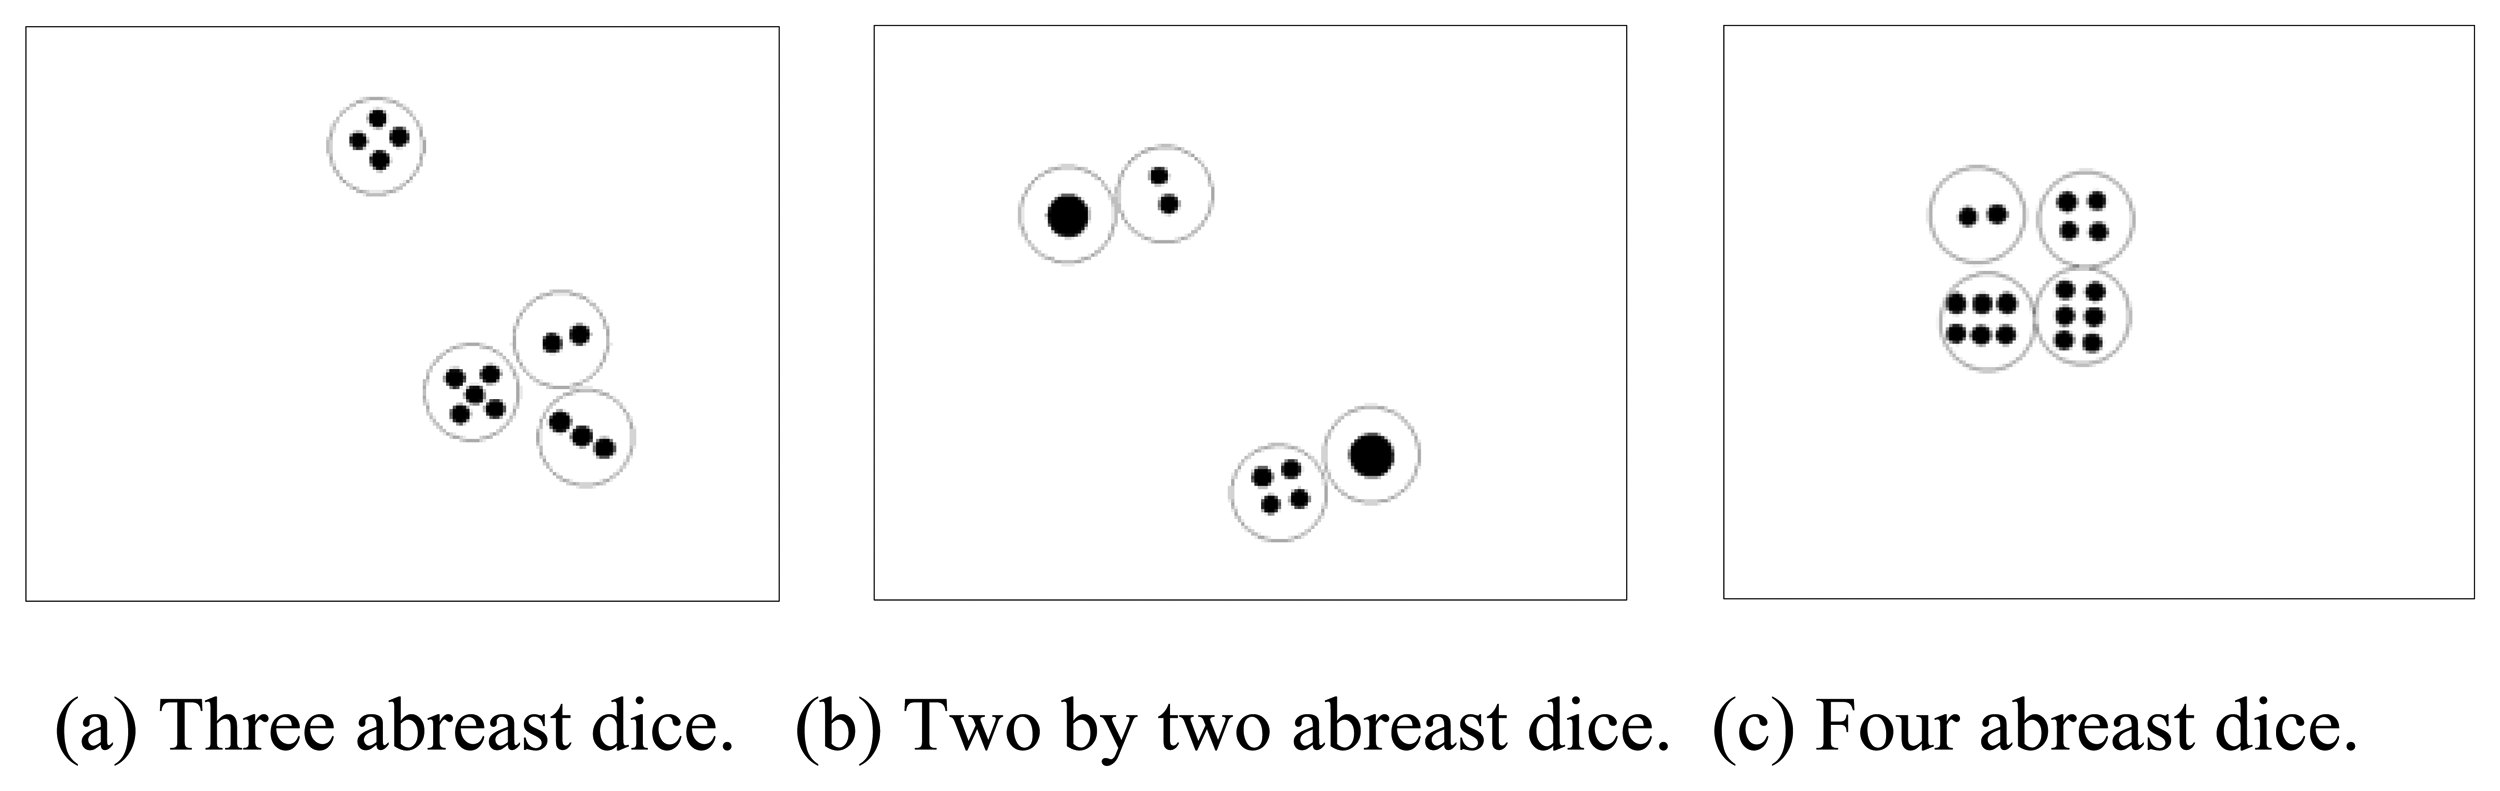
Figure 9.
The classification results for the same dices with different acquiring distances: (a) the original image with the longer distance, (b) the original image with the shorter distance, (c) the classification results with the far CCD camera, (d) the classification results with the close CCD camera.
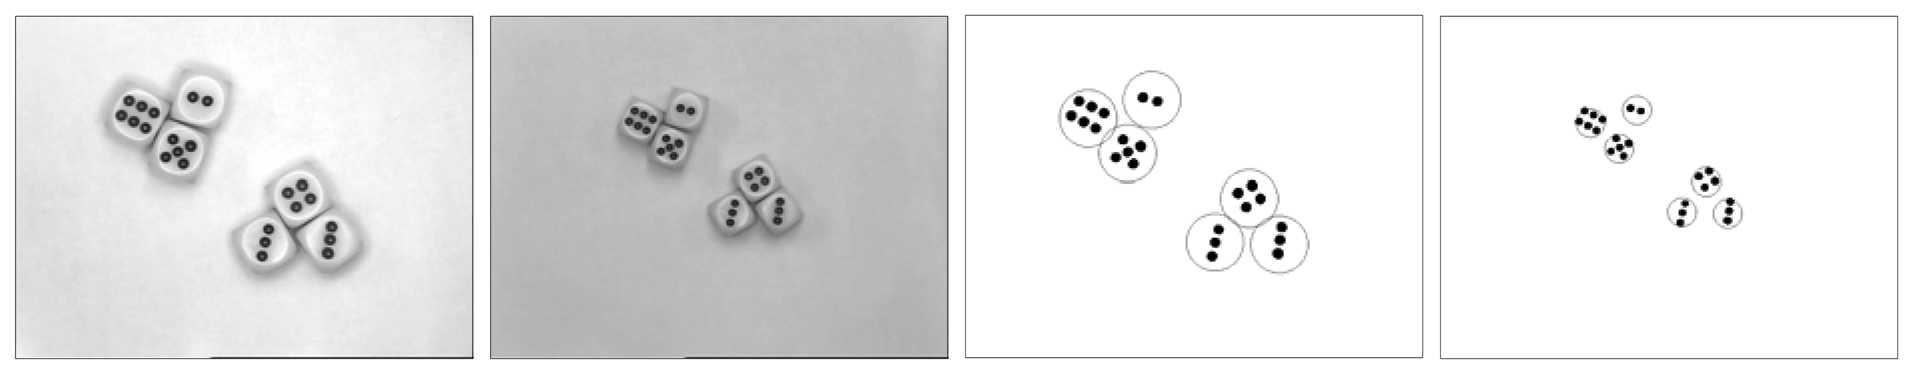
Figure 10.
The classification result when threshold value is 90
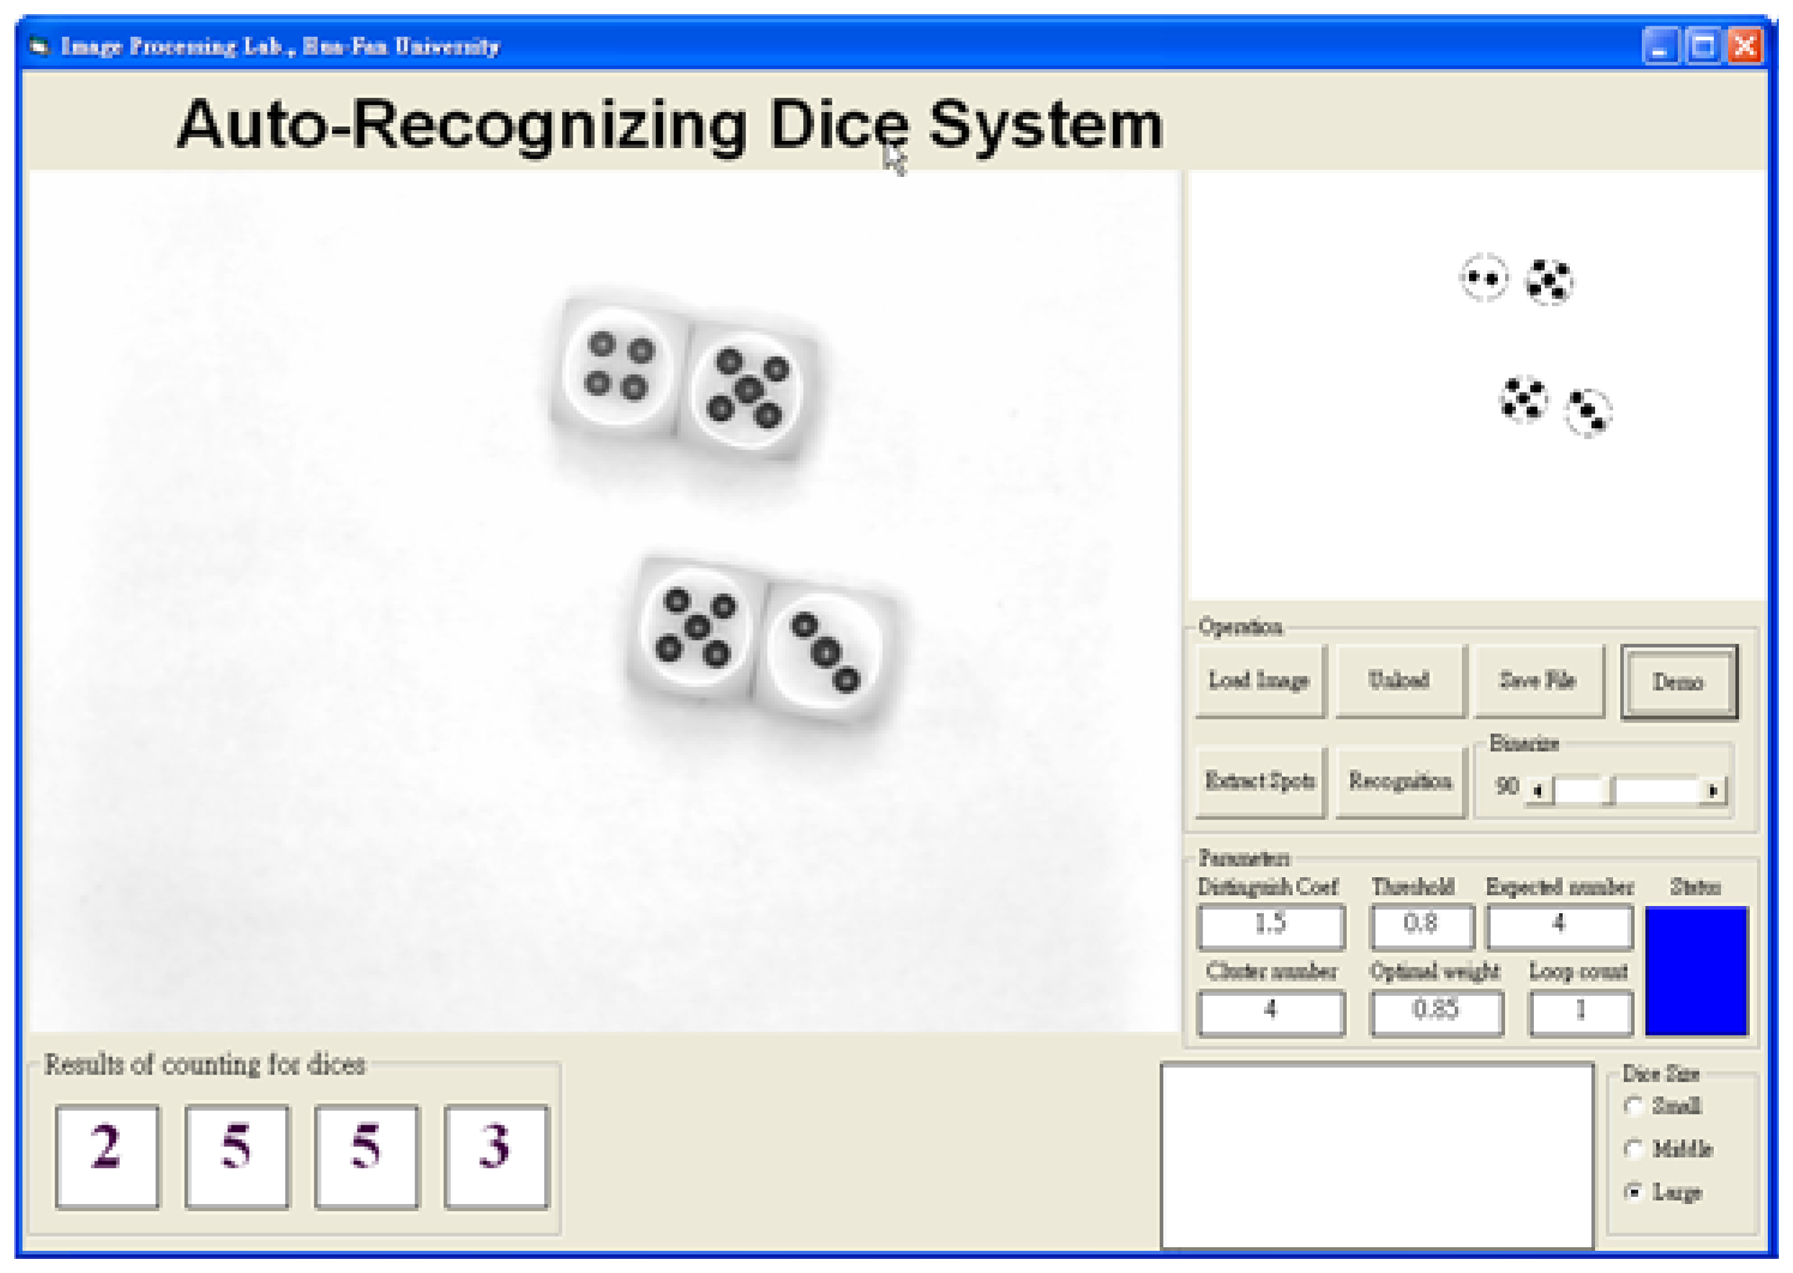
Figure 11.
The classification result for .a low contrast image.

| Optimal | parameters | Expected cluster number (EN) | PI |
|---|---|---|---|
| ω | ξ | ||
| 0.45 | 3.0 | 2 | 4.4854 |
| 0.55 | 2.2 | 3 | 2.6428 |
| 0.75 | 0.7 | 4 | 1.7873 |
| 0.80 | 0.8 | 5 | 0.8575 |
| 0.80 | 1.8 | 6 | 0.6322 |
| 0.85 | 2.2 | 7 | 0.5034 |
| Image | INITIAL ω | INITIAL ξ | OptimAl ω | Optimal ξ | PI | Iteration number | Result |
|---|---|---|---|---|---|---|---|
 | 0.70 | 0.80 | 0.85 | 0.90 | 1.262 | 11 | Correct |
 | 0.70 | 0.80 | 0.90 | 0.90 | 0.815 | 17 | Correct |
 | 0.70 | 0.80 | 0.90 | 1.40 | 0.867 | 35 | Correct |
© 2008 by MDPI Reproduction is permitted for noncommercial purposes.
Share and Cite
MDPI and ACS Style
Huang, K.-Y. An Auto-Recognizing System for Dice Games Using a Modified Unsupervised Grey Clustering Algorithm. Sensors 2008, 8, 1212-1221. https://doi.org/10.3390/s8021212
AMA Style
Huang K-Y. An Auto-Recognizing System for Dice Games Using a Modified Unsupervised Grey Clustering Algorithm. Sensors. 2008; 8(2):1212-1221. https://doi.org/10.3390/s8021212
Chicago/Turabian StyleHuang, Kuo-Yi. 2008. "An Auto-Recognizing System for Dice Games Using a Modified Unsupervised Grey Clustering Algorithm" Sensors 8, no. 2: 1212-1221. https://doi.org/10.3390/s8021212