Evanescent field Sensors Based on Tantalum Pentoxide Waveguides – A Review

1
Fraunhofer Institute for Physical Measurement Techniques, Heidenhofstr. 8, 79110 Freiburg, Germany
2
Institute for Bioprocessing and Analytical Measurement Techniques, Rosenhof, 37308 Heilbad Heiligenstadt, Germany
*
Author to whom correspondence should be addressed.
Sensors 2008, 8(2), 711-738; https://doi.org/10.3390/s8020711
Submission received: 5 November 2007
/
Accepted: 29 January 2008
/
Published: 6 January 2008
(This article belongs to the Special Issue Optical Biosensors)
Abstract
:Evanescent field sensors based on waveguide surfaces play an important role where high sensitivity is required. Particularly tantalum pentoxide (Ta2O5) is a suitable material for thin-film waveguides due to its high refractive index and low attenuation. Many label-free biosensor systems such as grating couplers and interferometric sensors as well as fluorescence-based systems benefit from this waveguide material leading to extremely high sensitivity. Some biosensor systems based on Ta2O5 waveguides already took the step into commercialization. This report reviews the various detection systems in terms of limit of detection, the applications, and the suitable surface chemistry.
1. Introduction
During the last years biosensors based on waveguide technology have attracted increasing attention due to their versatility and ability for use in medium and high throughput applications. Among waveguide-based biosensors, those relying on high refractive index materials such as Ta2O5 are of special interest due to their high stability and high sensitivity, allowing efficient excitation of fluorophores on the waveguide surface in fluorescence-based assays, or highly sensitive recognition of surface coverage changes in the evanescent field for label-free biosensing. Waveguide sensors are confined to processes at the surface and allow therefore discrimination between interactions close to the surface and in the depth of the bulk medium making them an excellent tool for the investigation of surface-bound bioreactions. This review focuses on both fluorescence-based and label-free biosensor systems implementing Ta2O5 surfaces as well as suitable surface chemistries for protein and DNA immobilization.
1.1. Applications
Biotechnological and pharmaceutical research mainly concentrates on target analysis, drug discovery, drug development and disease diagnostics. Therefore highly parallel and highly sensitive measurement systems are needed for a reliable investigation of DNA and proteins. Due to their consumption of small sample volumes, sensor systems using array formats can achieve a low price per test with high specificity and sensitivity. Current DNA microarray applications are gene screening for the detection of novel drug targets, determination of gene mutations and single nucleotide polymorphisms, and gene expression monitoring for the identification of disease specific genes and for the determination of toxic effects of drug candidates. Compared to gene expression, the monitoring of proteins is considerably more complex but offers more insight into the real nature of disease and drug action. In case of DNA microarrays the interaction is limited to polynucleotide sequences or chemically similar polymers whereas the protein microarrays address various interactions of ligand-receptor pairs such as antibody-antigen, enzyme-substrate, cell membrane receptor-ligand, protein-protein/peptide or protein-DNA/RNA [1].
Microarray technologies enable the parallel measurement of a huge number of different biomolecules. Yet amplification in the case of DNA analysis or purification and concentration in the case of protein analyses are necessary to meet the requirement of sensitivity and the dynamic range of most of the available fluorescence scanners on the market. Especially the planar waveguide technology developed by Zeptosens enables a detection of molecules at the picomolar level which is equivalent to zeptomoles of captured antibody [2].
Similar to mRNA, most of the cell proteins (up to 90%) are believed to be present as low copy numbers [3]. Therefore, when no amplification is possible, the highly sensitive evanescent field fluorescence technology is a promising solution to reliably measure low abundance proteins. This can be carried out by specific immobilization of capture molecules for sandwich-like assays consisting of a capture antibody, the molecule (e.g. protein, antibody) of interest and a secondary reporter antibody. Weissenstein et al. developed a multiplexed immunoassay of this kind for simultaneous quantitative monitoring of cancer biomarkers in tissue extracts [4]. Another approach is the spotting of the cell lysate on the hydrophobized waveguide and the subsequent incubation with a specific antibody and a secondary reporter antibody, e.g. for the investigation of tumor markers by spots of lysates of tumor and normal tissue and incubation with tumor specific antibodies [5].
In pharmaceutical research the determination of affinity constants is a crucial step in the development of antibodies and also for affinity studies of new target molecules. Surface plasmon resonance systems are a wide-spread technology applied for this purpose [6, 7]. Ta2O5 waveguide sensors provide also an excellent tool for highly sensitive label-free detection of biomolecules. Various types of grating coupler systems and interferometric systems are suitable for the investigation of binding events in a label-free manner. On the basis of an antibody-antigen interaction the determination of binding constants was shown in [8].
Further applications cover the investigation of functional fluorescence labeled enzymes, e.g. Na,K-ATPase in membrane fragments for the investigation of site-directed ligand binding. The functional receptors integrated in the immobilized biomembrane combined with the waveguide technology offer the advantage that different buffer media and/or specific ligands or inhibitors can be sequentially applied to the same preparation and, subsequently, exchanged in a fast and easy manner [9].
Microscopic image acquisition allows the investigation of large areas with submicron resolution. The sample is stationary while a goniometer scans the angle of the light source where coupling into the waveguide occurs. Such systems allow the detection of any fluorescence dye at a certain place marking an antibody, or a dye released by a vesicle/cell upon changes in the environment or monitoring focal adhesions in transfected cells without any disruptive rinsing. Grandin et al. [10] demonstrated the applicability on human fibroblast cells fixed and stained for vinculin (Alexa Fluor 488, Molecular Probes), a focal adhesion protein. Further applications are the investigation of processes such as cellular uptake of fluorescently labeled beads and/or drugs. Multicolour capabilities enable cellular screening for drug targeting applications.
1.2. Characteristics of Ta2O5 substrates
Ta2O5 is an optically transparent metal oxide with a high refractive index. Because of its high dielectric constant it is likely to replace thin SiO2 layers as capacitor insulators in high density dynamic random access memories [11]. Production processes of thin films of Ta2O5 include for example Chemical Solution Deposition (CSD) [11-13], Metal Organic Chemical Vapor Deposition (MOCVD) [14], Plasma Enhanced Chemical Vapor Deposition (PECVD) [15, 16], Low Pressure Chemical Vapor Deposition (LPCVD) [17] or Reactive Magnetron Sputtering [18].
Coated as a thin film on a substrate material with lower refractive index, Ta2O5 films provide an ideal waveguiding material. The attenuation is < 3 dB/cm. The optimal film thickness for evanescent field applications lies between 100 and 200 nm with an refractive index around 2 [19]. The best excitation field strength and surface properties are demonstrated for 150 nm thin Ta2O5 films. Generally, the crucial parameters for the application in biosensor applications are the efficiency of launching the light into the waveguide, the propagation losses of the light beam, and the evanescent field strength. The coupling of light into the waveguide or outcoupling is normally realized by embossed or etched gratings.
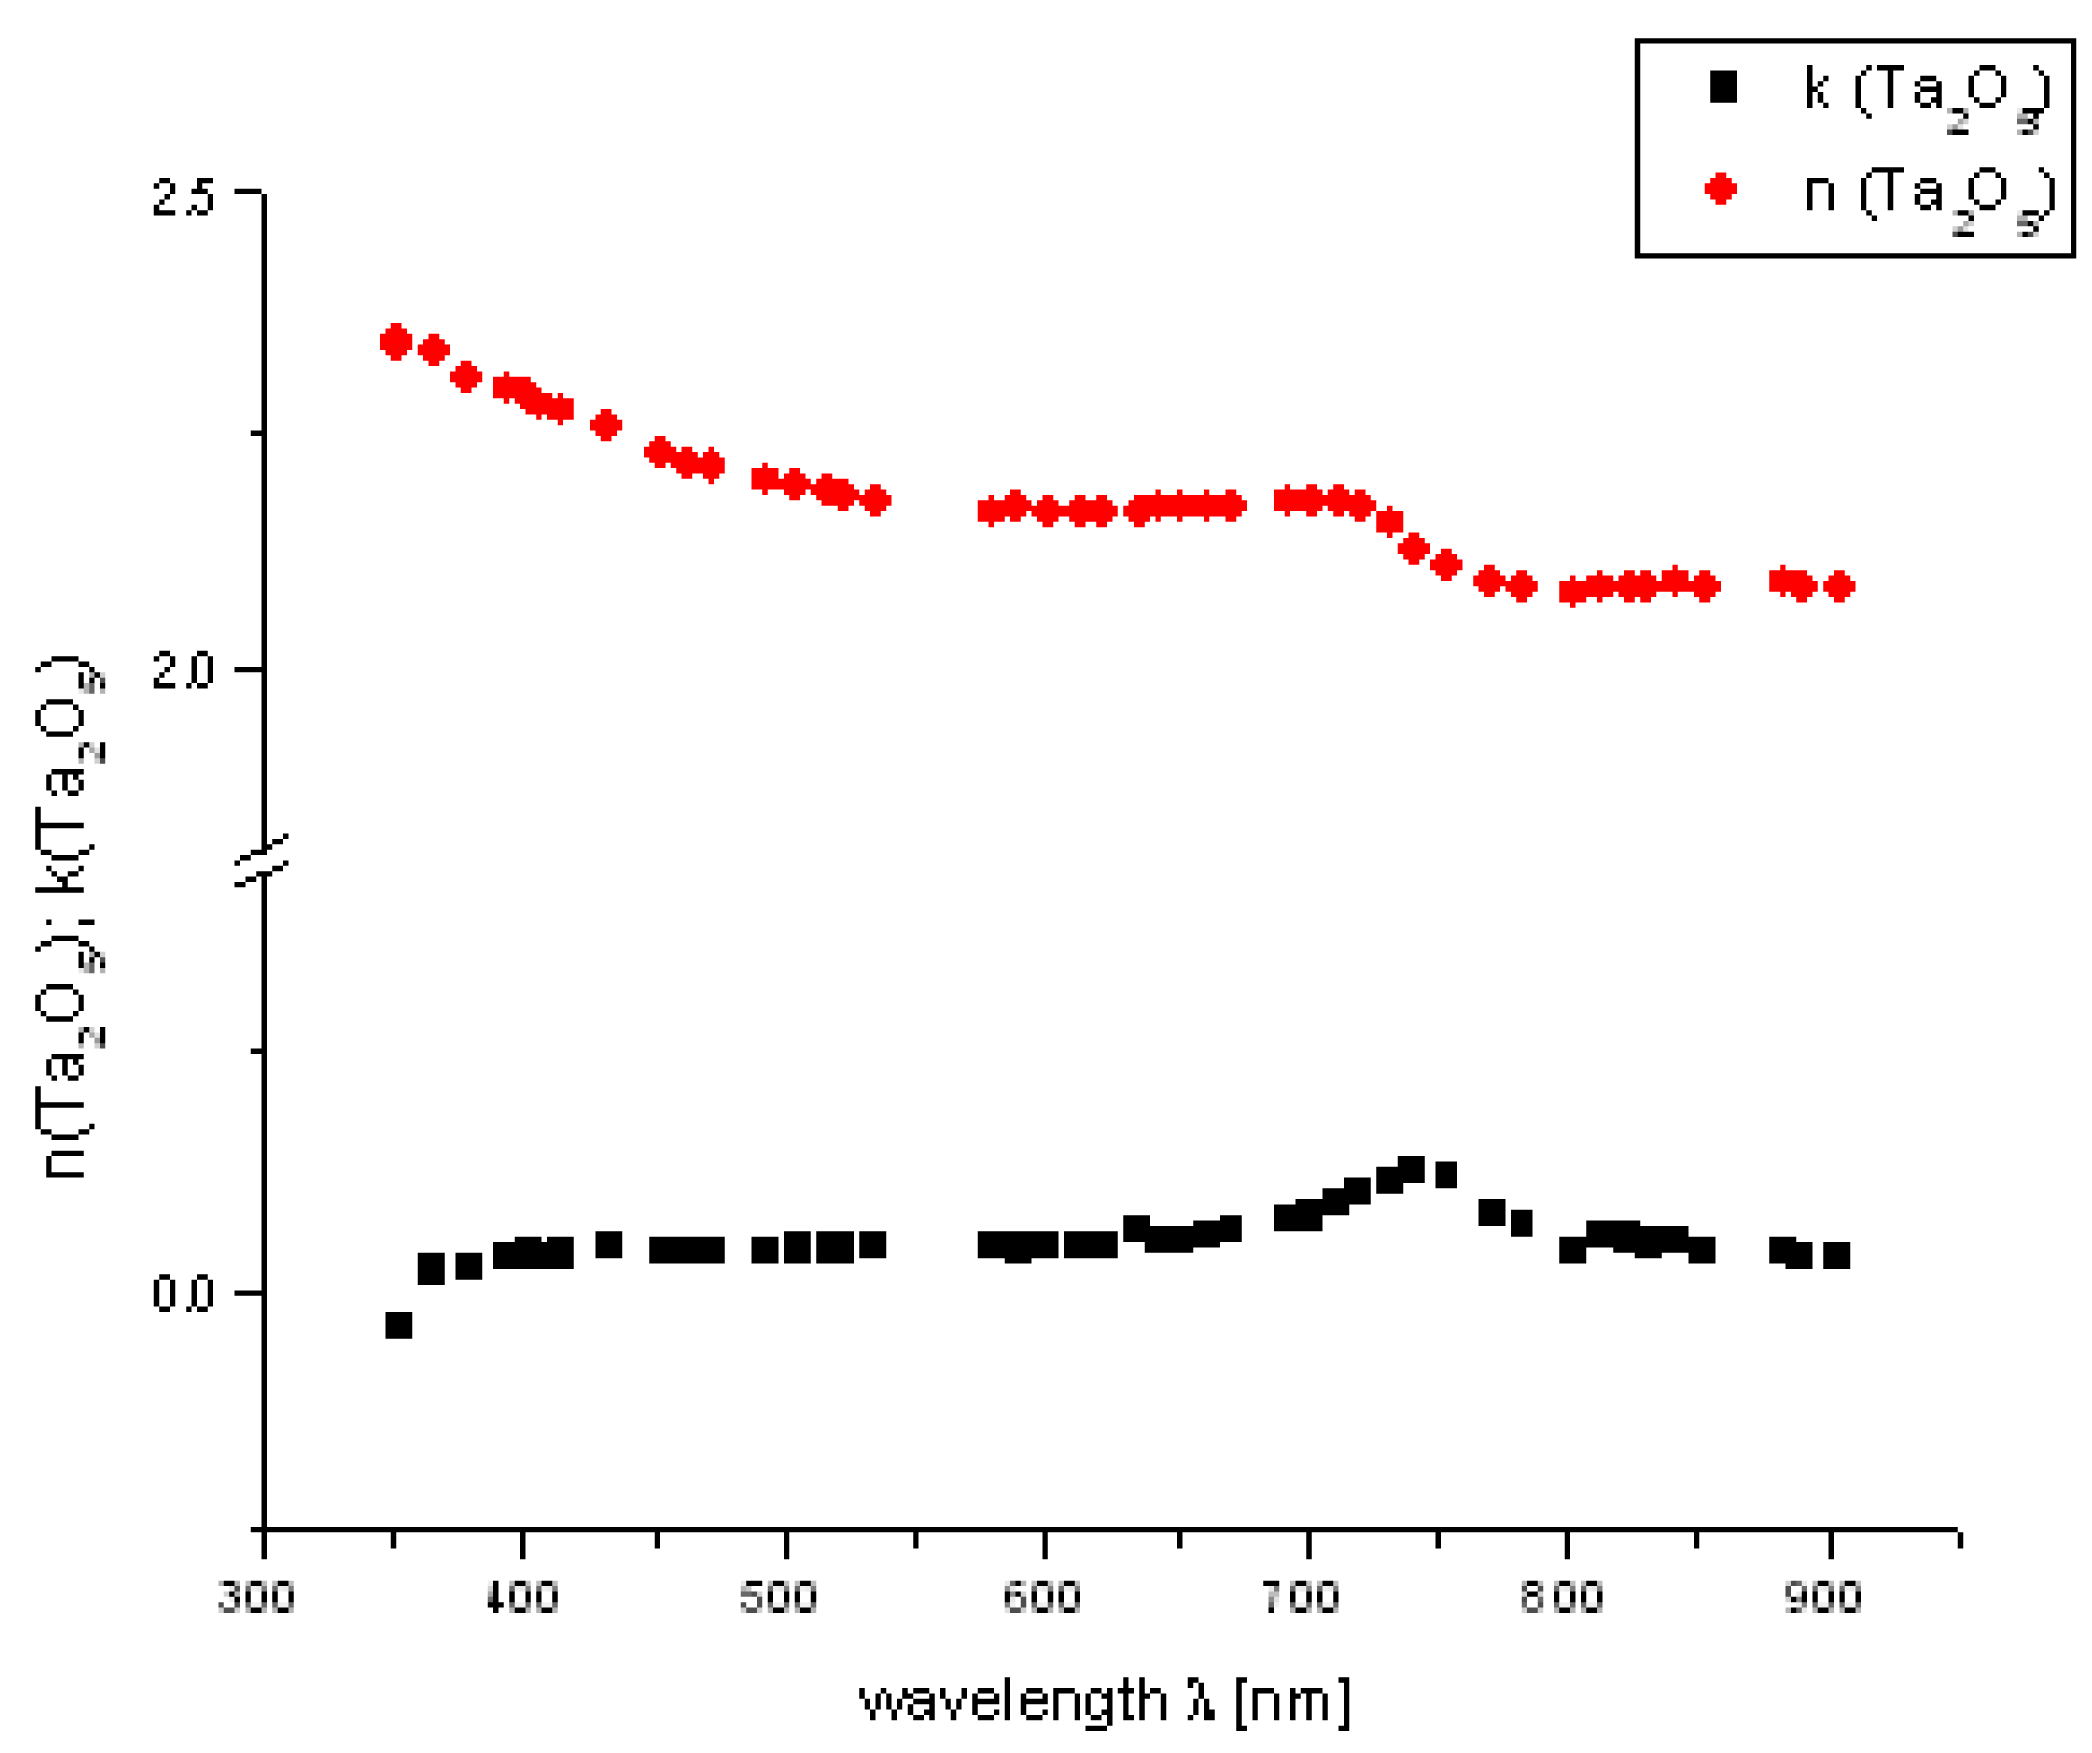
For ellipsometric analysis (EP3, Nanofilm Technologie GmbH, Göttingen, Germany) we used Ta2O5 films on a glass substrate manufactured by Oerlikon (former Unaxis Optics), Liechtenstein. The refractive index of the Ta2O5 films was n = 2.1 ± 0.02 at λ = 633 nm. We characterized those layers at a laser-wavelength of λ = 532 nm, a refractive index n = 2.1 and an extinction coefficient k = 0.02 and determined the thickness of Ta2O5 with 161.4 nm ± 0.1 nm and a mean square error (MSE) of 0.89. The layer thickness was specified with 160 nm by Oerlikon. Figure 1 shows the determined refractive indices and extinction coefficients via spectroscopic ellipsometry at an angle of incidence of 50°.
1.3. Basic principles of evanescent field sensing
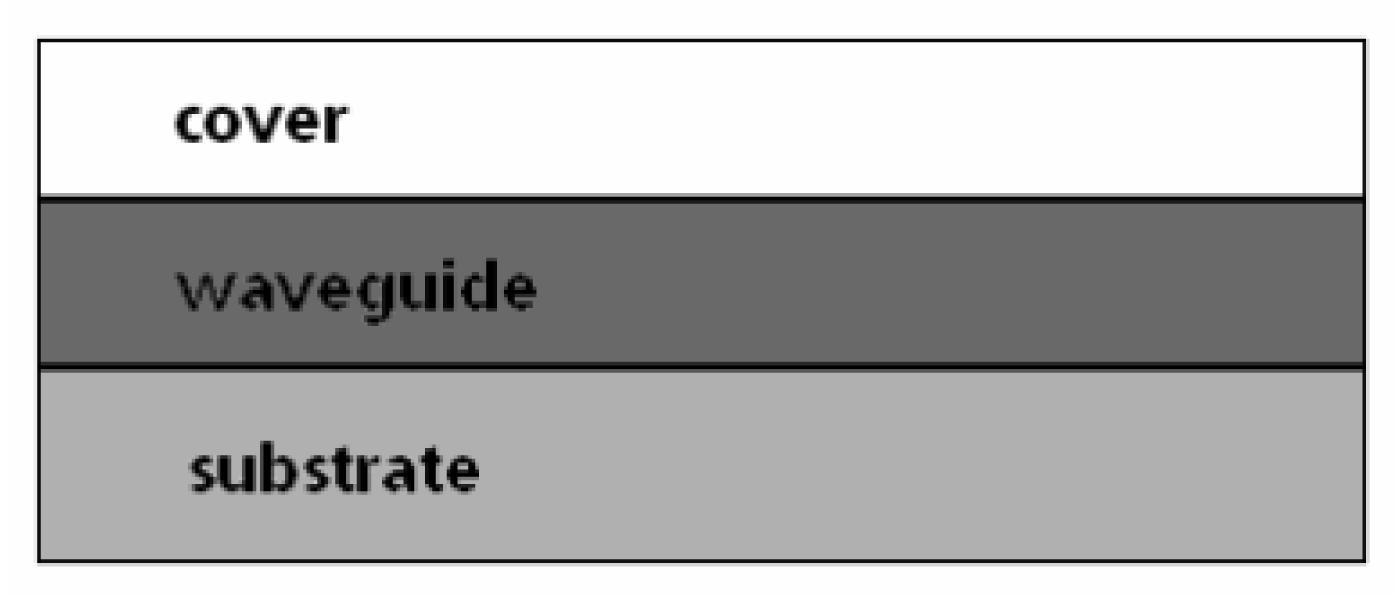
The fundamental discovery by Lukosz and his colleagues in the 1980's that waveguides with high refractive indices alter their light-guiding characteristics upon changes in their environment, e.g. ambient humidity, provided the basis for the extensive use of planar optical waveguides in chemical and biochemical sensors. Here we concentrate on describing a three-layer planar waveguide system:
The underlying phenomenon, the evanescent field above the waveguide surface, is described theoretically in [20] and can be outlined as follows: light outside a (planar) waveguide structure forms an exponentially attenuated wave in perpendicular direction z, which is characterized by the following expression (decay factor):
with λ0 being the vacuum wavelength and nc, nw the refractive indices above the waveguide surface (cover) and of the waveguide, respectively. φ is the angle of reflection inside the waveguide at the waveguide-cover interface.
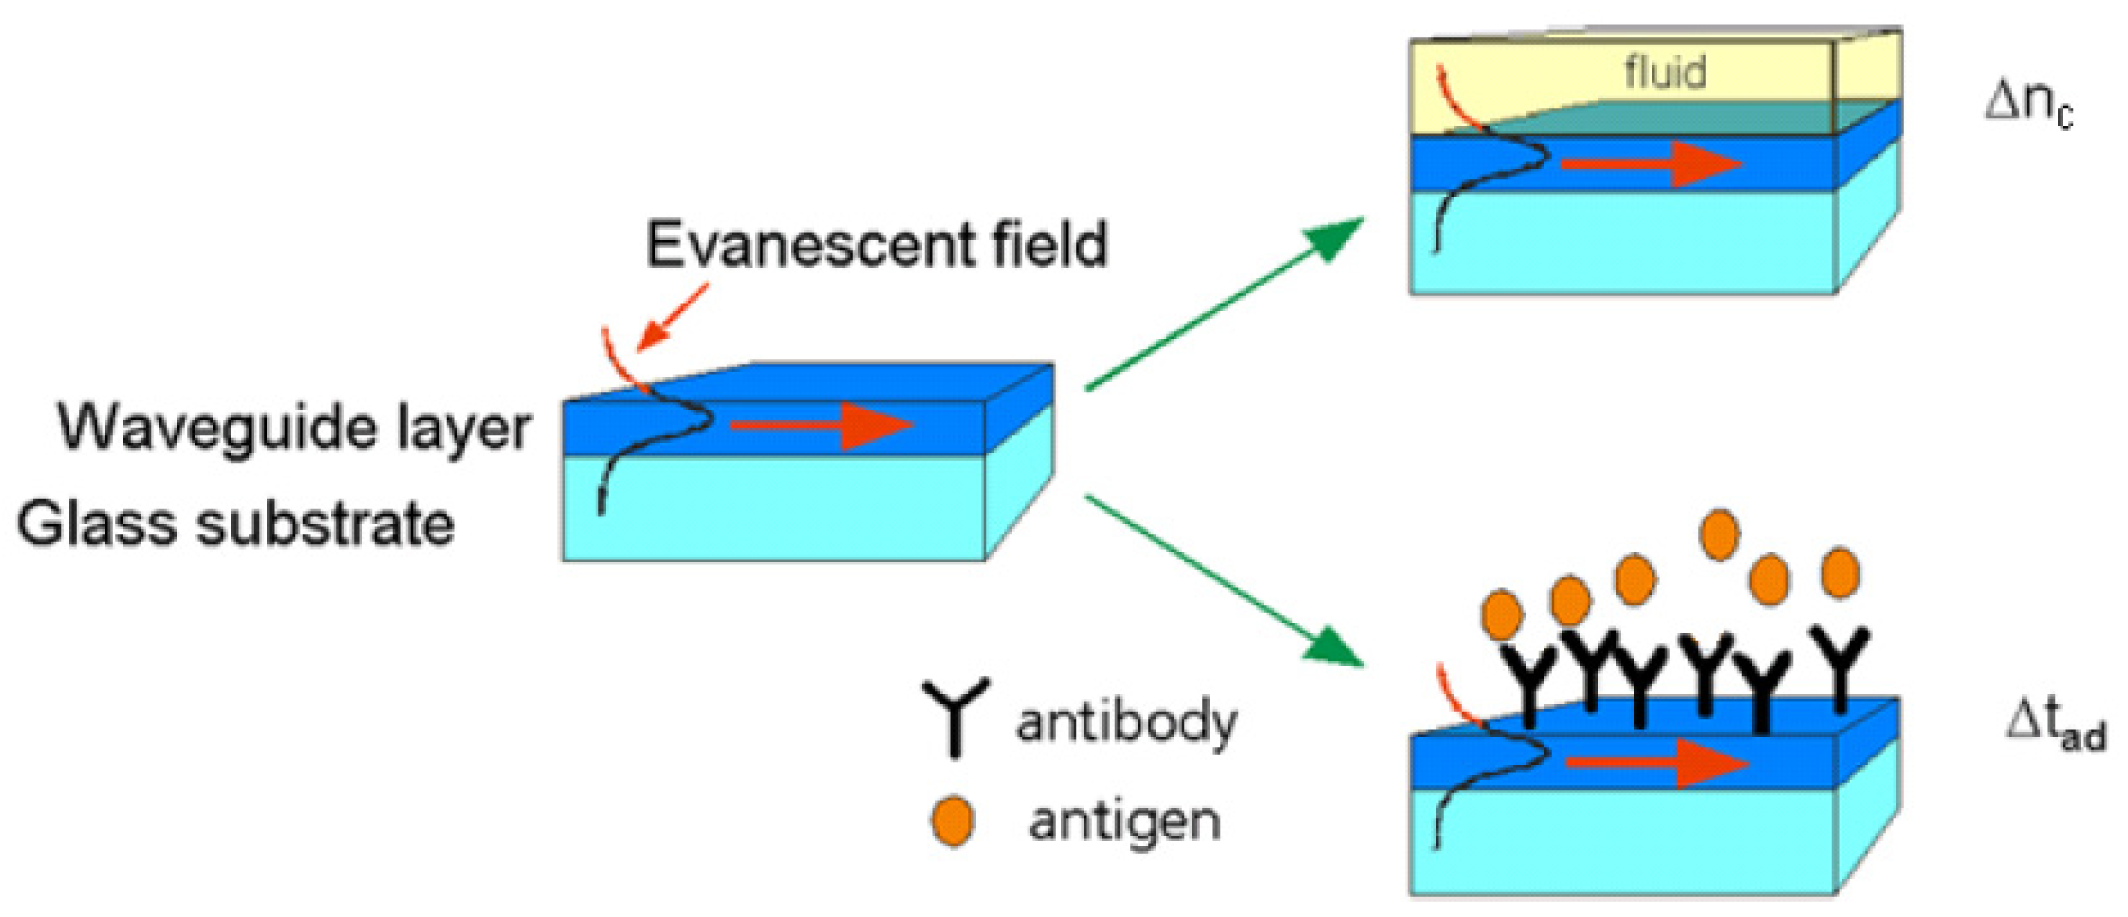
The evanescent field, typically extending 30-100 nm into the cover layer, is sensitive to two types of ambient changes: either, a liquid/gaseous sample is covering the sensing region, altering the cover refractive index nc, or molecules from a liquid/gaseous sample adsorb to the waveguide surface forming a thin adlayer of a specific refractive index nad. This sensing principle can be exploited as a tool for monitoring the adsorption/binding of any kind of chemical or biological molecule. Upon ambient changes on the surface of a waveguide, the phase velocity vp of the guided mode is decreased as follows:
with c denoting the vacuum speed of light. The effective refractive index neff of a waveguide depends on the following parameters:
- λ = wavelength
- ns = refractive index of the substrate
- nw = refractive index of the waveguide
- nc = refractive index of the cover
- d = waveguide thickness
- nad = refractive index of adlayer
- tad = adlayer thickness
Figure 3 illustrates the principle of evanescent field sensing:
Biosensor systems such as grating couplers [22, 23] or interferometers [24-27] directly measure effective refractive index changes. The considerations above are only valid for nonporous waveguides, i.e. diffusive processes are neglected. The general expression for changes in neff is given by
where the last summand can be omitted for nonporous waveguides and will not be treated in the following.
From this expression and the mode equation
where
is the wave number, d the thickness of the waveguiding film and φc and φs the phase shifts that the wave undergoes when being totally reflected at the boundaries
with ρ = 0 for TE and ρ = 1 for TM modes, we can derive the sensor sensitivity to cover refractive index changes
again for a three-layer planar waveguide. These calculations are described in greater detail in [20], and here only the main result shall be given:
where deff is the effective waveguide thickness comprising the waveguide thickness d and the penetrations depths Δzw (c,s) of the evanescent field into substrate and cover.
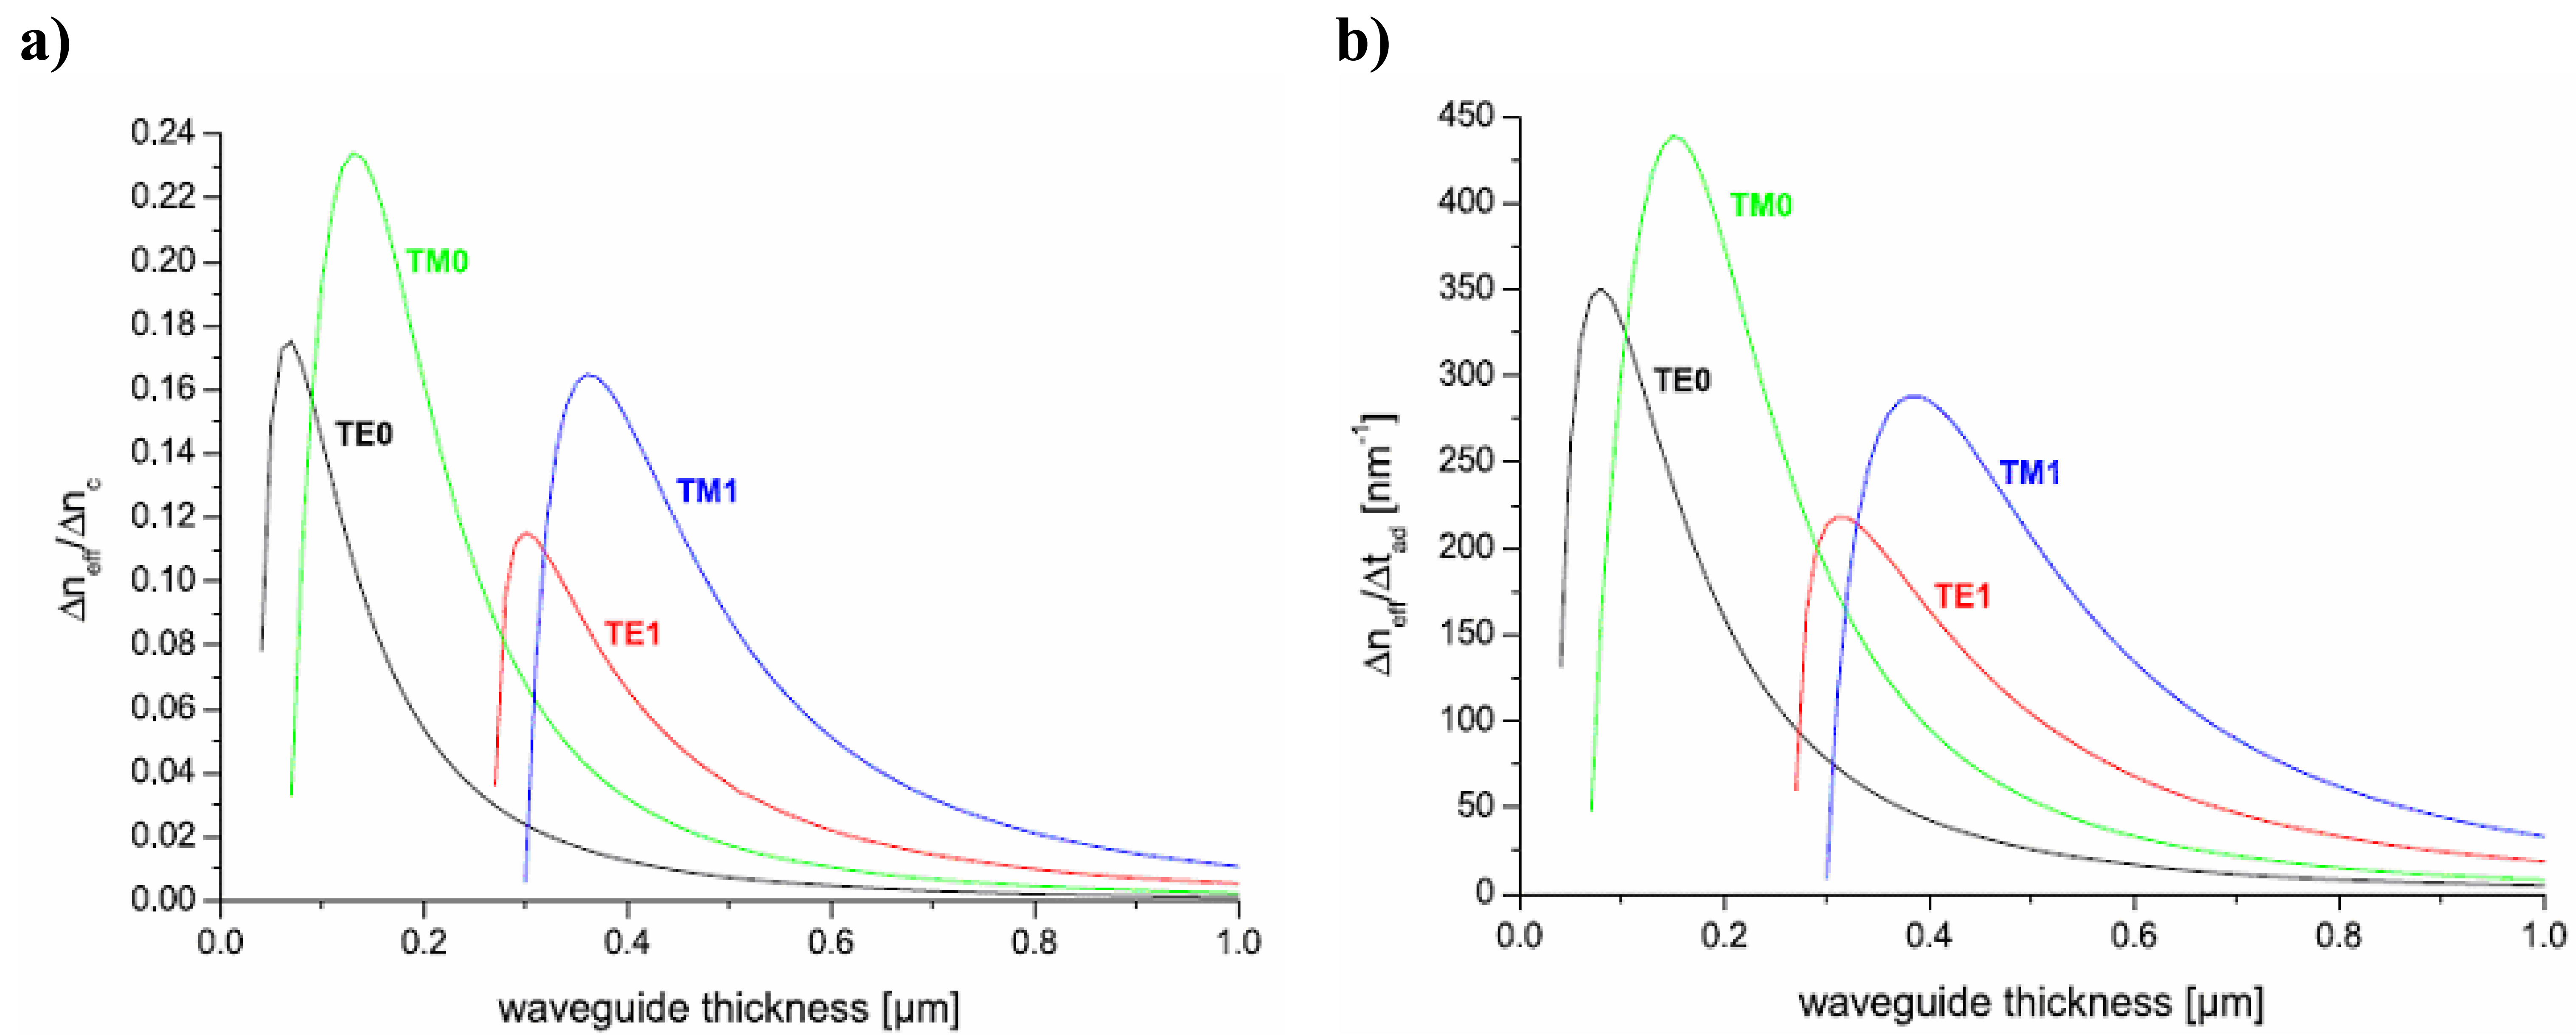
Figure 4 shows the sensitivities
and
versus waveguide thickness for the first two TE-and TM modes (0 and 1). It can be seen that TM modes yield higher sensitivities for the given parameters and that a waveguide thickness of 150-160 nm should be optimal for TM.
Eq. 8 also implies that high sensitivities are reached for monomode waveguides with a high difference between the waveguide refractive index and the substrate refractive index.
The sensitivity to changes in the surface adlayer becomes important when considering the adsorption or binding of various kinds of molecules. In the following it is assumed that the molecules form a homogeneous adlayer with Δtad≪λ Again, the complete derivation can be found in [20] and here only the result is given:
Apart from determining the surface adlayer thickness of an adsorbed molecule layer, it is interesting to determine the surface coverage to have an easier comparison with other techniques available for monitoring biomolecular interactions. The formation of a homogeneous adlayer on the waveguide surface due to molecule adsorption or binding with Δtad≪λ is used as a model.
Starting from eq. 4 describing the changes in Δneff with surface adlayer changes and considering only the first summand
this expression can be expanded to:
For
a literature value of 0.188 ml/g can be considered suitable for most proteins [28-30] as well as a refractive index of nad = 1.45. Inserting eq. 13 and the derived sensitivity constant from eq. 9 into eq. 11 yields
for d = 154 nm as typical value for the waveguide thickness, nc = 1.333 for the refractive index of aqueous solutions and nad = 1.45 for proteins, for TE mode, and
for TM mode and the same parameters as used in Fig. 4.
2. Sensor systems
2.1. Label-free systems
2.1.1. Grating coupler
Grating coupler systems rely on the phenomenon that coupling of a light beam of a certain wavelength into a waveguide via a grating only occurs at a certain angle of incidence that is defined by the coupling condition (eq. 16). Therefore the effective refractive index and the mass coverage can be determined by monitoring the incoupling angle. The coupling condition is valid for the outcoupling of a light beam as well.
with n being the refractive index of the ambient medium (air, buffer), k the diffraction order, λ0 the vacuum-wavelength, and Λ the grating period. When using light sources with a small spectral width such as lasers, the range of coupling angles α is minimized due to the high coherence length, resulting in an accurate determination of neff.
Grating couplers based on planar waveguides represent sensitive integrated optical chemical sensors and biosensors since they react both to changes in the refractive index of a liquid or gaseous cover medium (with Δneff< 2 x 10⁻⁵) and to the adsorption or binding of molecules (thickness d of the adsorbed layer < 0.01 nm) [20]. With an optimized waveguide thickness in combination with a high refractive index the direct observation of biochemical reactions with high sensitivity is feasible [23]. A waveguide material having a high refractive index leads to a large change of neff upon adsorption of molecules. Together with a grating coupler setup such waveguides allow label-free investigations of immunoaffinity reactions: one binding partner is immobilized onto the waveguide surface while the corresponding analyte is in solution, and their binding can be monitored in real time [23]. The advantage of grating couplers is the direct coupling of light into the waveguide via the grating at the coupling angle α with maximum coupling efficiency at the resonance condition (eq. 16). The coupling efficiency can be increased with an optimized grating modulation depth [31]. By switching between TE and TM mode operation during a measurement, a grating coupler is able to deconvolve the sensor signal into information about changes in both thickness and the refractive index of an adsorbate layer [32]. This is a clear advantage over surface plasmon resonance sensors operating only in TM mode, where one of these parameters must be assumed to calculate the other (see eq. 13).
The waveguides of the first grating coupler systems were developed mainly on the basis of TiO2. After an introduction of these first systems we focus on grating couplers based on Ta2O5-waveguides. Input, output and reflection grating couplers are mentioned in Bilitewski et al. [23] as the three types of grating coupler configurations, which will be described in this order below.
In the case of an input grating coupler, a laser beam is focused onto the grating area of a planar waveguide at a variable angle α. Coupling into the waveguide occurs after diffraction at the grating satisfying eq. 16 and a signal is subsequently recorded by the detector. The instrument measures the shifts of the effective refractive indices n(TE0) and n(TM0) of the guided TE0 and TM0 modes.
In the 1980's, Lukosz et al. discovered that these input grating couplers responded to the adsorption of water or other molecules out of the gaseous phase with high sensitivity, and based on this they designed first input grating coupler setups implementing SiO2-TiO2 monomode waveguides, which achieved an refractive index change resolution of Δneff, min = 1.4 x 10⁻³ [33].
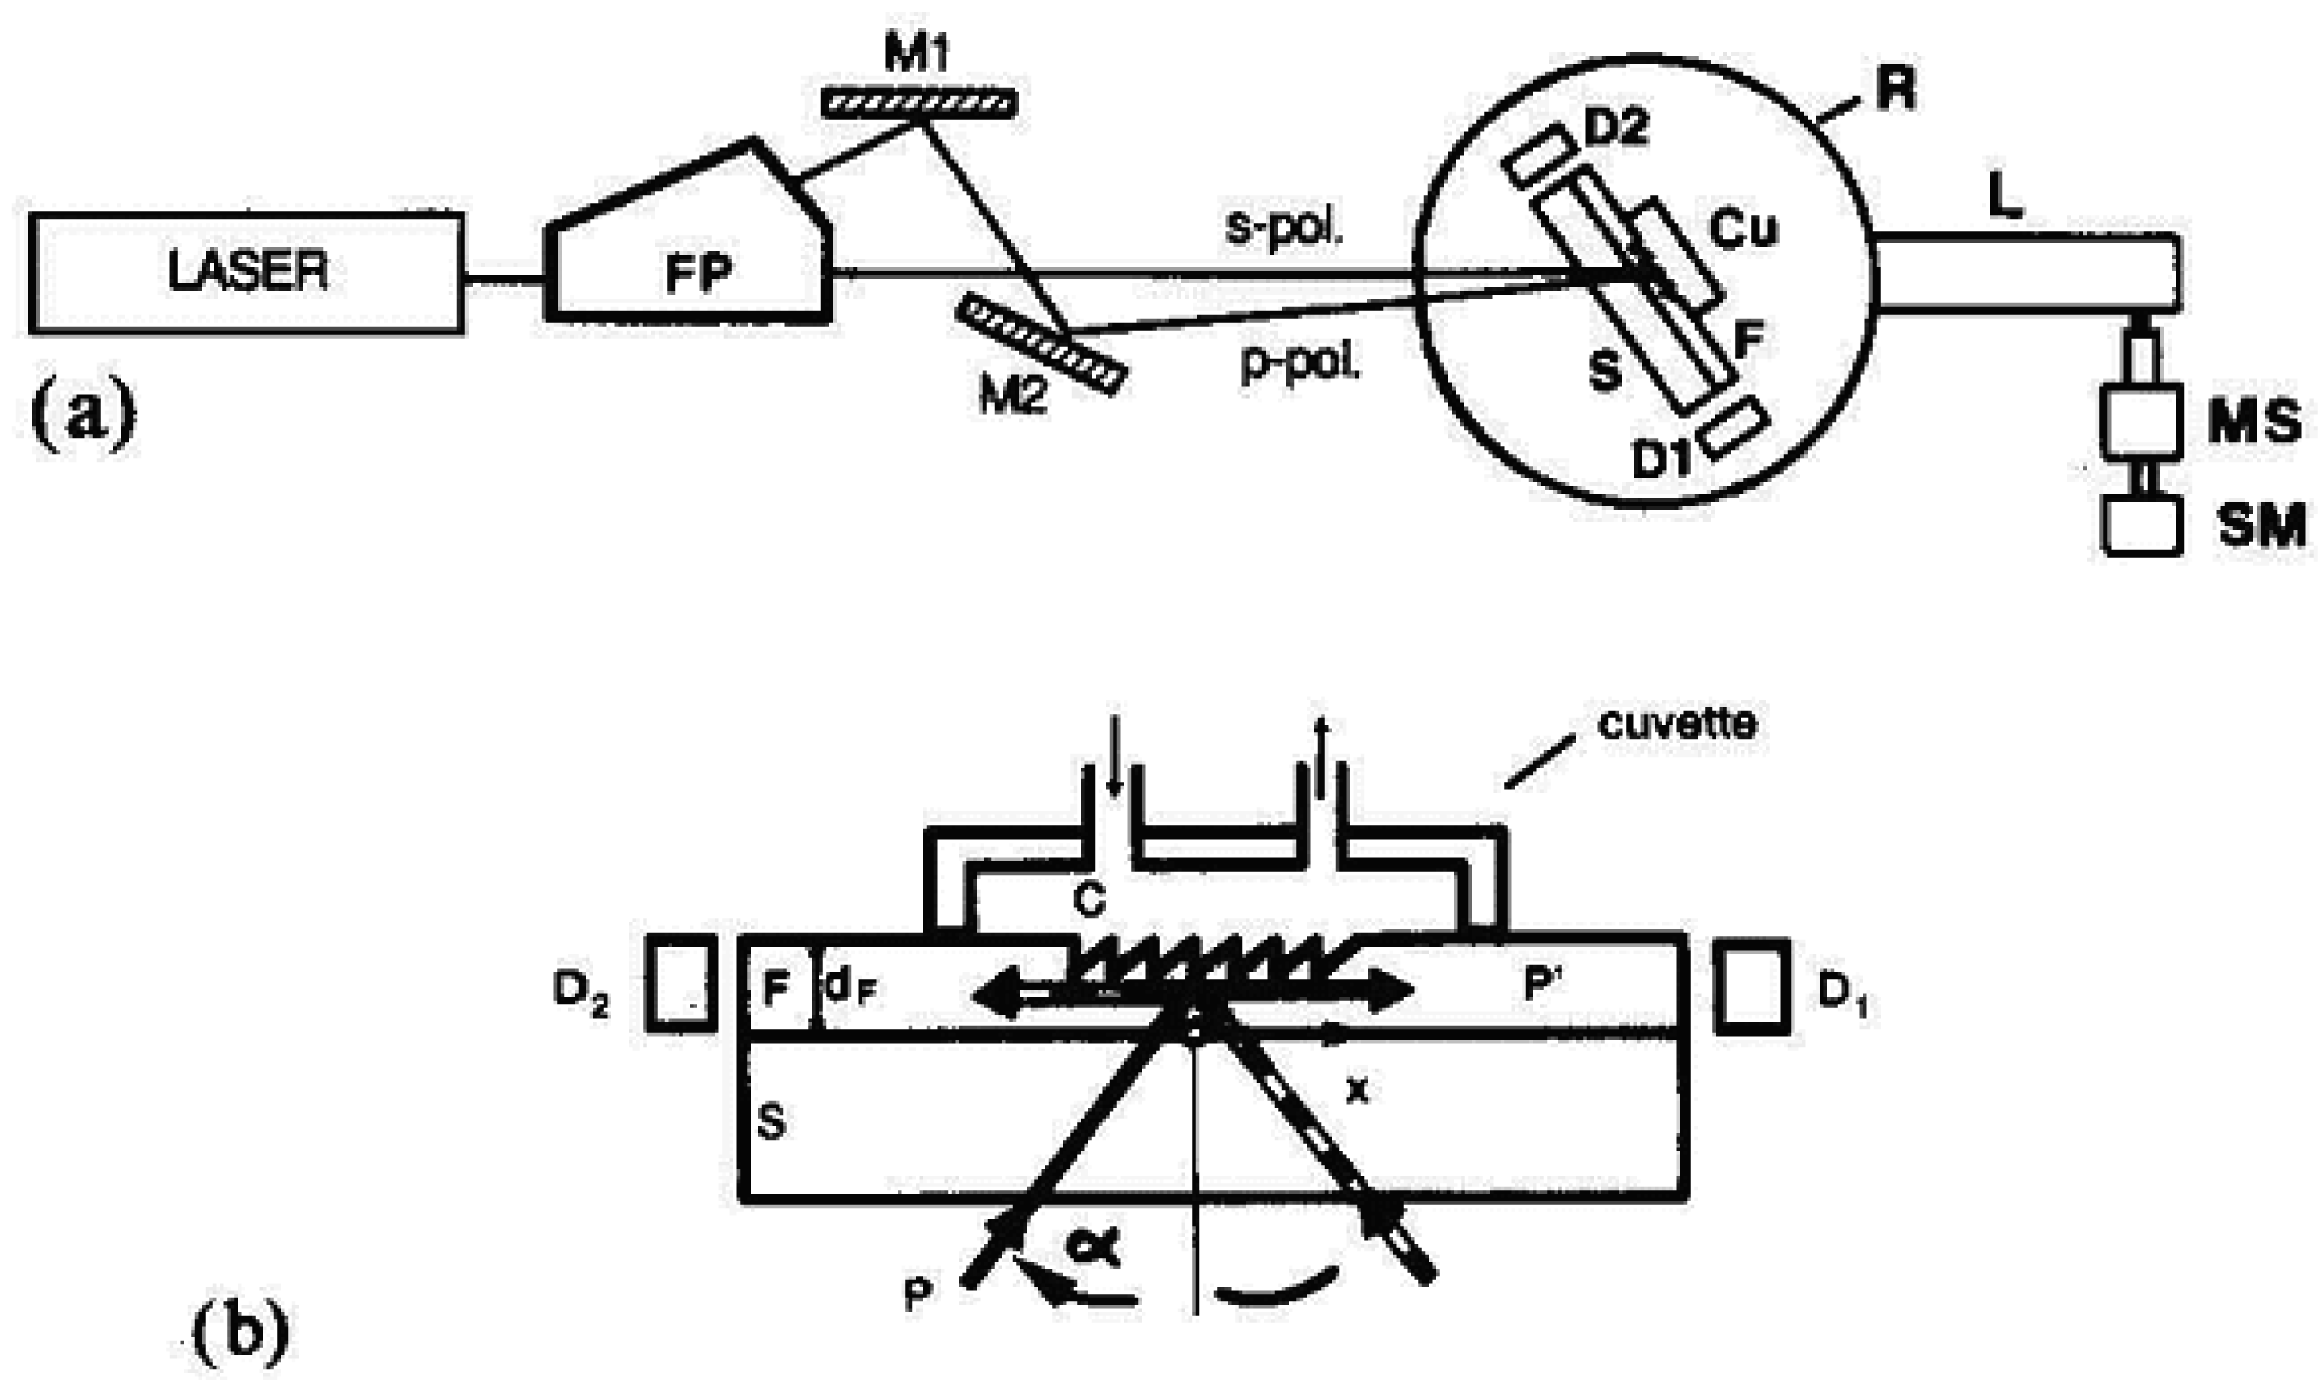
Along with further developments of the input grating coupler, this detection limit could be gradually improved and several chemo- and immunoassays performed by Nellen and Lukosz [32, 34]. Fig. 5 shows schematically the basic setup of an input grating coupler sensor. To excite TE0 and TM0 modes in the waveguide, an s- and a p-polarized laser beam (corresponding to TE and TM) are scanned at a variable angle, which depends on the surface mass coverage and thereby the effective refractive index. Two photodetectors mounted on a rotation stage detect the signal, rendering the mechanical setup demanding. The grating requires a highly precise mechanical movement of the rotation stage including waveguide sensor and fluidic parts.
Nellen et al. investigated the adsorption of human immunoglobulin G (h-IgG) out of a buffer solution with h-IgG concentrations varying from 10 mg/mL to 0.5 μg/mL with this input grating coupler and reached a detection limit of Δneff, min = 5 x 10⁻⁶, corresponding to c < 6 μg/mL) [32].
Bier et al. used a grating coupler system, still implementing SiO2-TiO2 waveguides, to show a calibration procedure via appropriate regeneration steps for the first time along with an immunoassay for the detection of the pesticide s-triazine (terbutryn) out of drinking water [35]. They also investigated the influence of unspecific binding on the performance of their assay and how the sensitivity of the assay can be enhanced. In this publication, a preliminary detection limit of 15 μg/L s-triazine in a competitive assay was reached.
Polzius et al. performed an on-line, direct detection of monoclonal antibodies out of a perfused bioreactor in the range of 10 to 150 μg/mL including regeneration [36]. They compared the direct assay format with an off-line, competitive assay with sample concentrations between 0.8 and 7 μg/mL. The competitive assay yielded a higher sensitivity, yet was indirect and involves more elaborate sample handling. The direct detection out of the bioreactor ensured easy sampling, however recalibration was needed during long-term measurements, which limits a continuous operation of the sensor. As a strategy to enhance assay sensitivity, they proposed the use of Ta2O5 waveguides instead of SiO2-TiO2, which was the basis for their further work with grating couplers.
Using Ta2O5 waveguides for their grating coupler system, again Polzius et al. showed that not only a high-refractive index waveguide material is a decisive step towards assay sensitivity, but also the linker chemistry for receptor immobilization [37]. With the model affinity system protein G and human IgG, a comparison of protein G adsorption, covalent attachment via silane linkers, and avidin-mediated chemistry lead to the conclusion that protein G adsorption results in similar assay sensitivities as with covalent linking, yet is easier to perform and also relatively stable. Coupling via avidin-biotin bridges yielded higher system response. The use of carboxy-dextran matrices, which generally increase the binding capacity of surfaces for immobilization, increased avidin immobilization, yet the final assay sensitivity only to a small extent.
In another publication the same group presented the grating coupler as suitable label-free sensor system for the determination of kinetic rate constants along with detection limits in terms of molecular weight [38]. A detection limit of ∼2000 Da was determined in a direct assay format. A competitive approach is proposed for the detection of small molecules with a molecular weight below 1000 Da such as biotin.
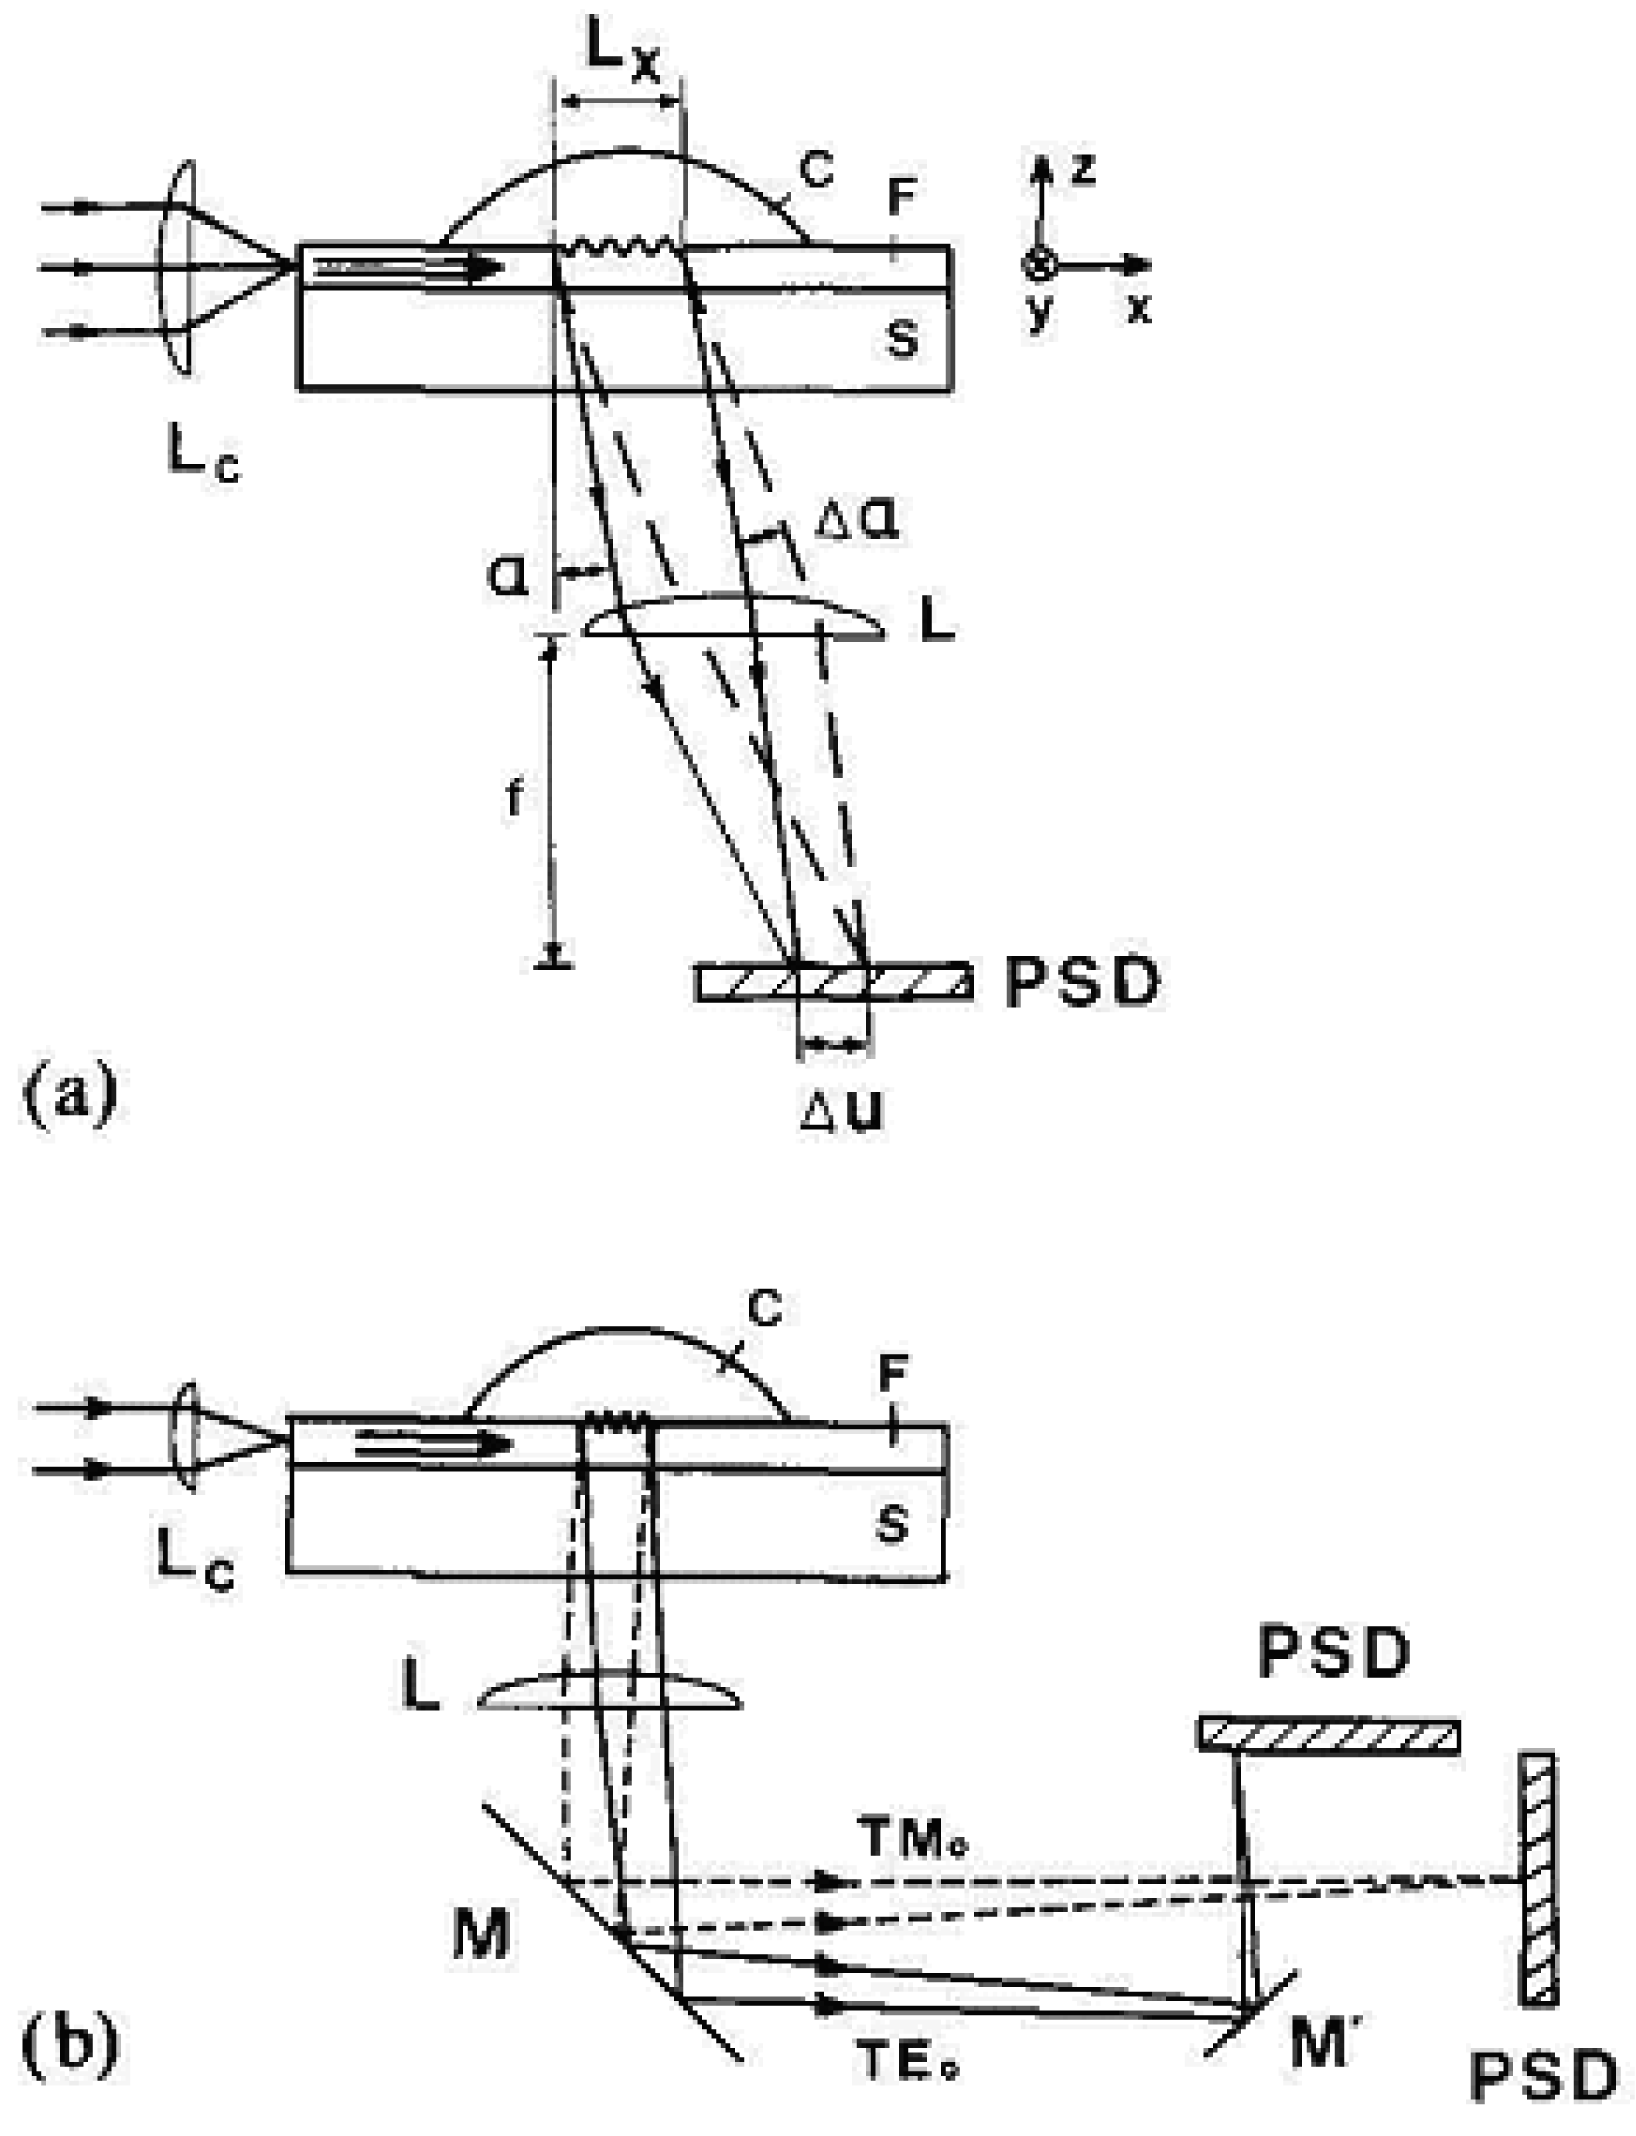
A variation of the input grating coupler setup where the outcoupling angle is monitored is called output grating coupler and is described in greater detail in [39]. Output grating couplers can be operated without any moving parts, leading to a much faster response time (sub-millisecond). The principle is the reverse of the input grating coupler, i.e. responding with a change in the outcoupling angle α caused by an alteration of the effective refractive index neff of the guided mode. Light is coupled into the horizontally positioned waveguide, outcoupled via a grating and focused by a spherical lens L of focal length f on a position-sensitive detector (PSD) (Figure 6). The output angle is proportional to the position u (independent of the measured intensity I [22]) of the signal without errors due to light scattering. In 1991, Lukosz et al. [22] used an output grating coupler for investigating the adsorption of avidin and h-IgG on a SiO2-TiO2 waveguide surface, for direct immunosensing (h-IgG to anti-h-IgG) and subsequently for determining refractive indices, thicknesses and surface coverages, reaching a resolution of Δneff, min = 3 x 10⁻⁶.
Both input and output grating couplers require complex mechanical setups and are suitable for high throughput, e.g. for screening applications, only to a very limited extend. The rotation stage moving the sensor chip in input grating couplers does not allow highly parallel operation, and in the output grating coupler the front end coupling cannot be realized for high-throughput purposes.
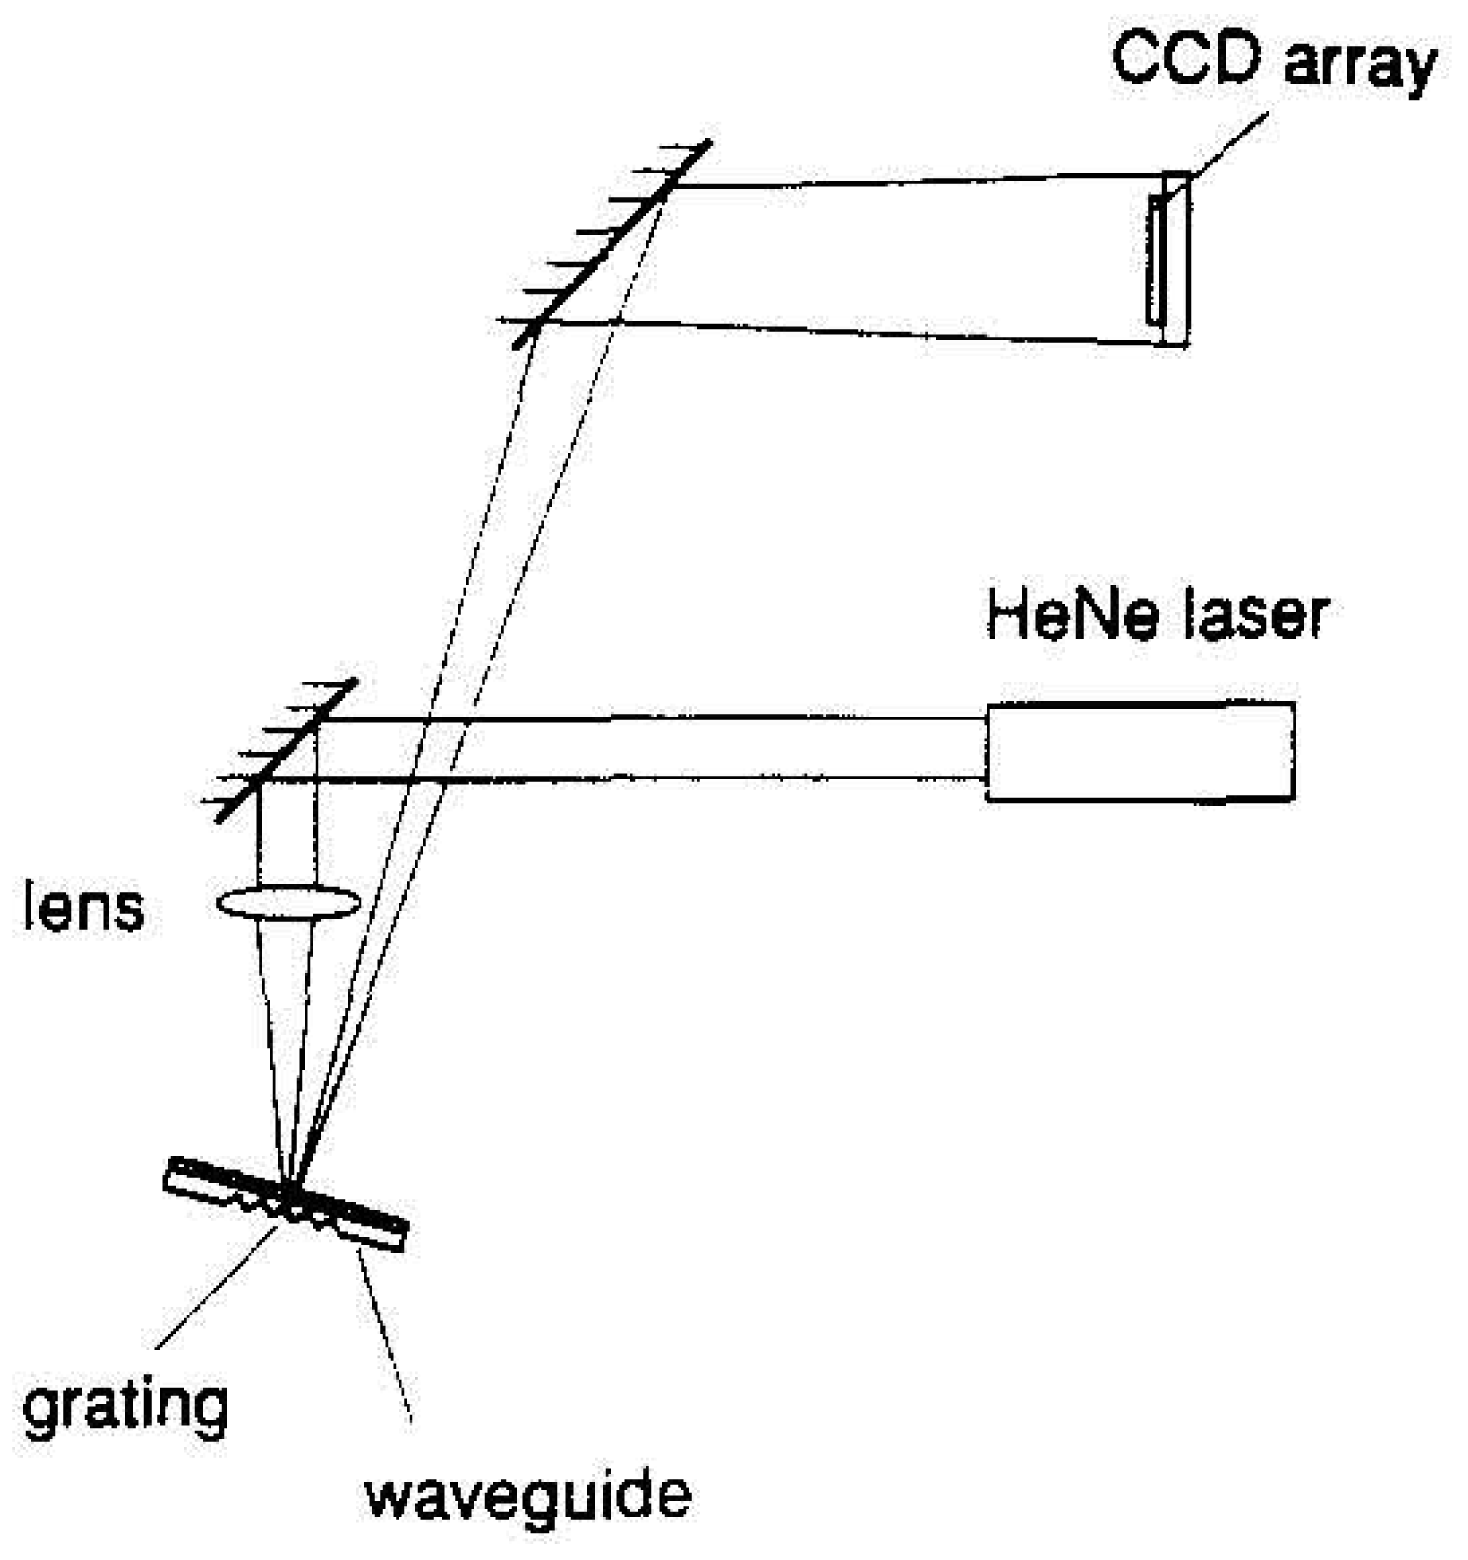
To overcome such limitations, Brandenburg et al. developed an integrated optical grating coupler in reflected-mode operation having the advantage that no critical alignments for coupling light into the waveguide were necessary and that any moving parts could be avoided. The system, at first implemented using TiO2- and SiO2- waveguides, was applicable in humidity sensing with a resolution of Δneff, min = 1 x 10⁻⁵ [40]. In 1996, Brandenburg et al. reached a resolution of about Δneff, min = 3 x 10⁻⁶ in reflected-mode operation with an integrated optical grating coupler based on Ta2O5-waveguides. They calculated a detection limit of 0.2 μg/mL or 1.4 x 10⁻⁹ M for human IgG using protein G as capture molecule [41]. The set-up is shown in Figure 7. A laser beam is focused by a lens onto an embedded grating in a Ta2O5-waveguide layer, thereby creating a continuum of coupling angles. The optical device is arranged in order to cover all coupling angles in the range of 0.7° expected during the measurement. Only the light obeying the coupling condition (eq. 16) is coupled into the waveguide, such that in the reflected beam a dark line corresponding to the coupling angle at the measured effective refractive index can be observed. On a CCD array the reflected light is detected and in the resulting intensity distribution the minimum position is determined.
Using this experimental setup, nucleic-acid hybridization experiments were carried out for immobilization of DNA as a receptor for real-time biosensing [42]. Brynda et al. used this setup for the detection of human β2-microglobulin [43] and real-time measurements of analytes in blood plasma [44]. A protein multilayer consisting of alternating BSA-biotin (bovine serum albumin modified with biotin) and streptavidin layers was investigated to verify the penetration depth of the evanescent field of the reflected-mode grating coupler in [45]. In these investigations with 12 protein monolayers on a surface a change in Δneff decreased from approximately 8 x 10⁻⁴ to less than 4 x 10⁻⁵ for a single monolayer, indicating a filling of the evanescent field. Further the detection limits both for these proteins (10 pg/mm2) and for an indirect immunoassay of the pesticide simazine (0.25 μg/L) were determined.
In conclusion it can be said that the grating couplers were successively improved from first input grating couplers working with SiO2-TiO2 waveguides towards the implementation of Ta2O5 waveguides with appropriate linker chemistries and improved mechanical setups. Unlike input and output grating couplers, the reflected-mode grating coupler can furthermore be used for parallel measurements involving formats such as microtiterplates; each sensing area can be minimized without loss of sensitivity.
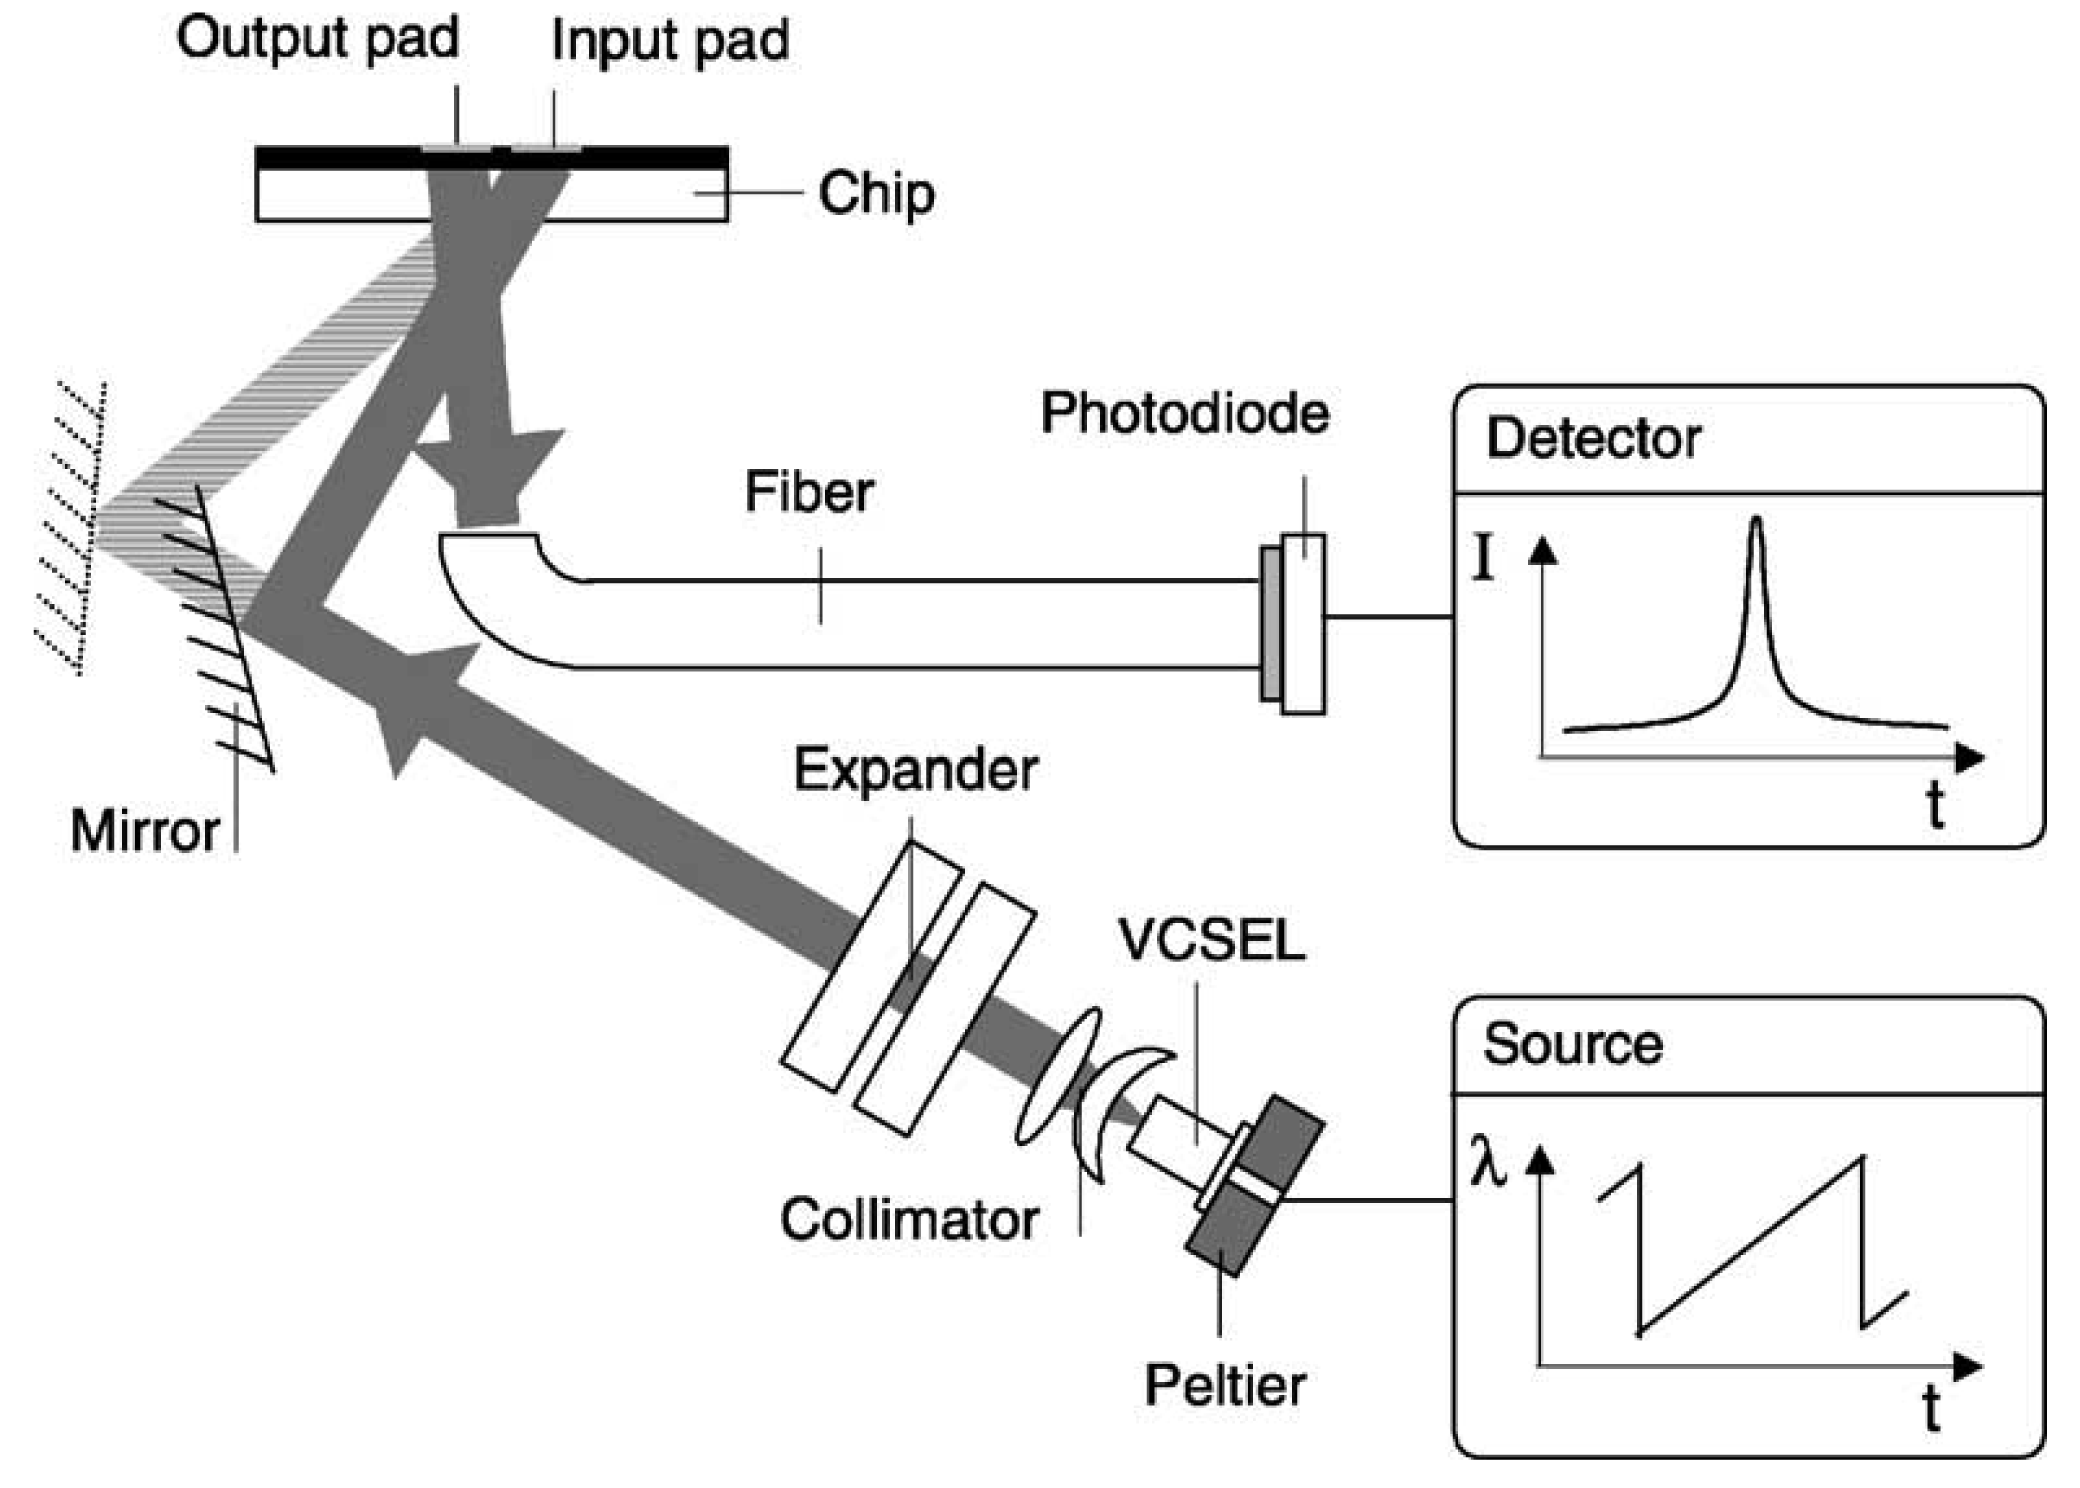
Cottier et al. [46] presented the wavelength interrogated optical sensor (WIOS) which includes both in- and outcoupling of a wave by means of a grating (Figure 8). A vertical cavity surface emitting laser diode (VCSEL) with a saw-tooth wavelength modulation served as a laser source. The collimated laser beam is directed by a mirror towards the input pad for coupling and travels along the waveguide. An output pad couples the light out that is finally collected by a multi-mode fiber and detected by a photodiode.
Sensor chips consisting of Ta2O5 (Unaxis Optics, Liechtenstein) on glass were used to reach a high stability and reproducibility. With a detection limit of Δneff,min < 10-6 the sensor was in the first instance used for bulk refractometry. In affinity measurements the binding reaction of 1 μg/mL biotin to neutravidin was investigated indicating a detection limit below 200 Da. With a reference pad the standard deviation could be reduced from 0.009 to 0.005 peak position units, corresponding to 100 fg/mm2, and a detection limit of 0.3 pg/mm2.
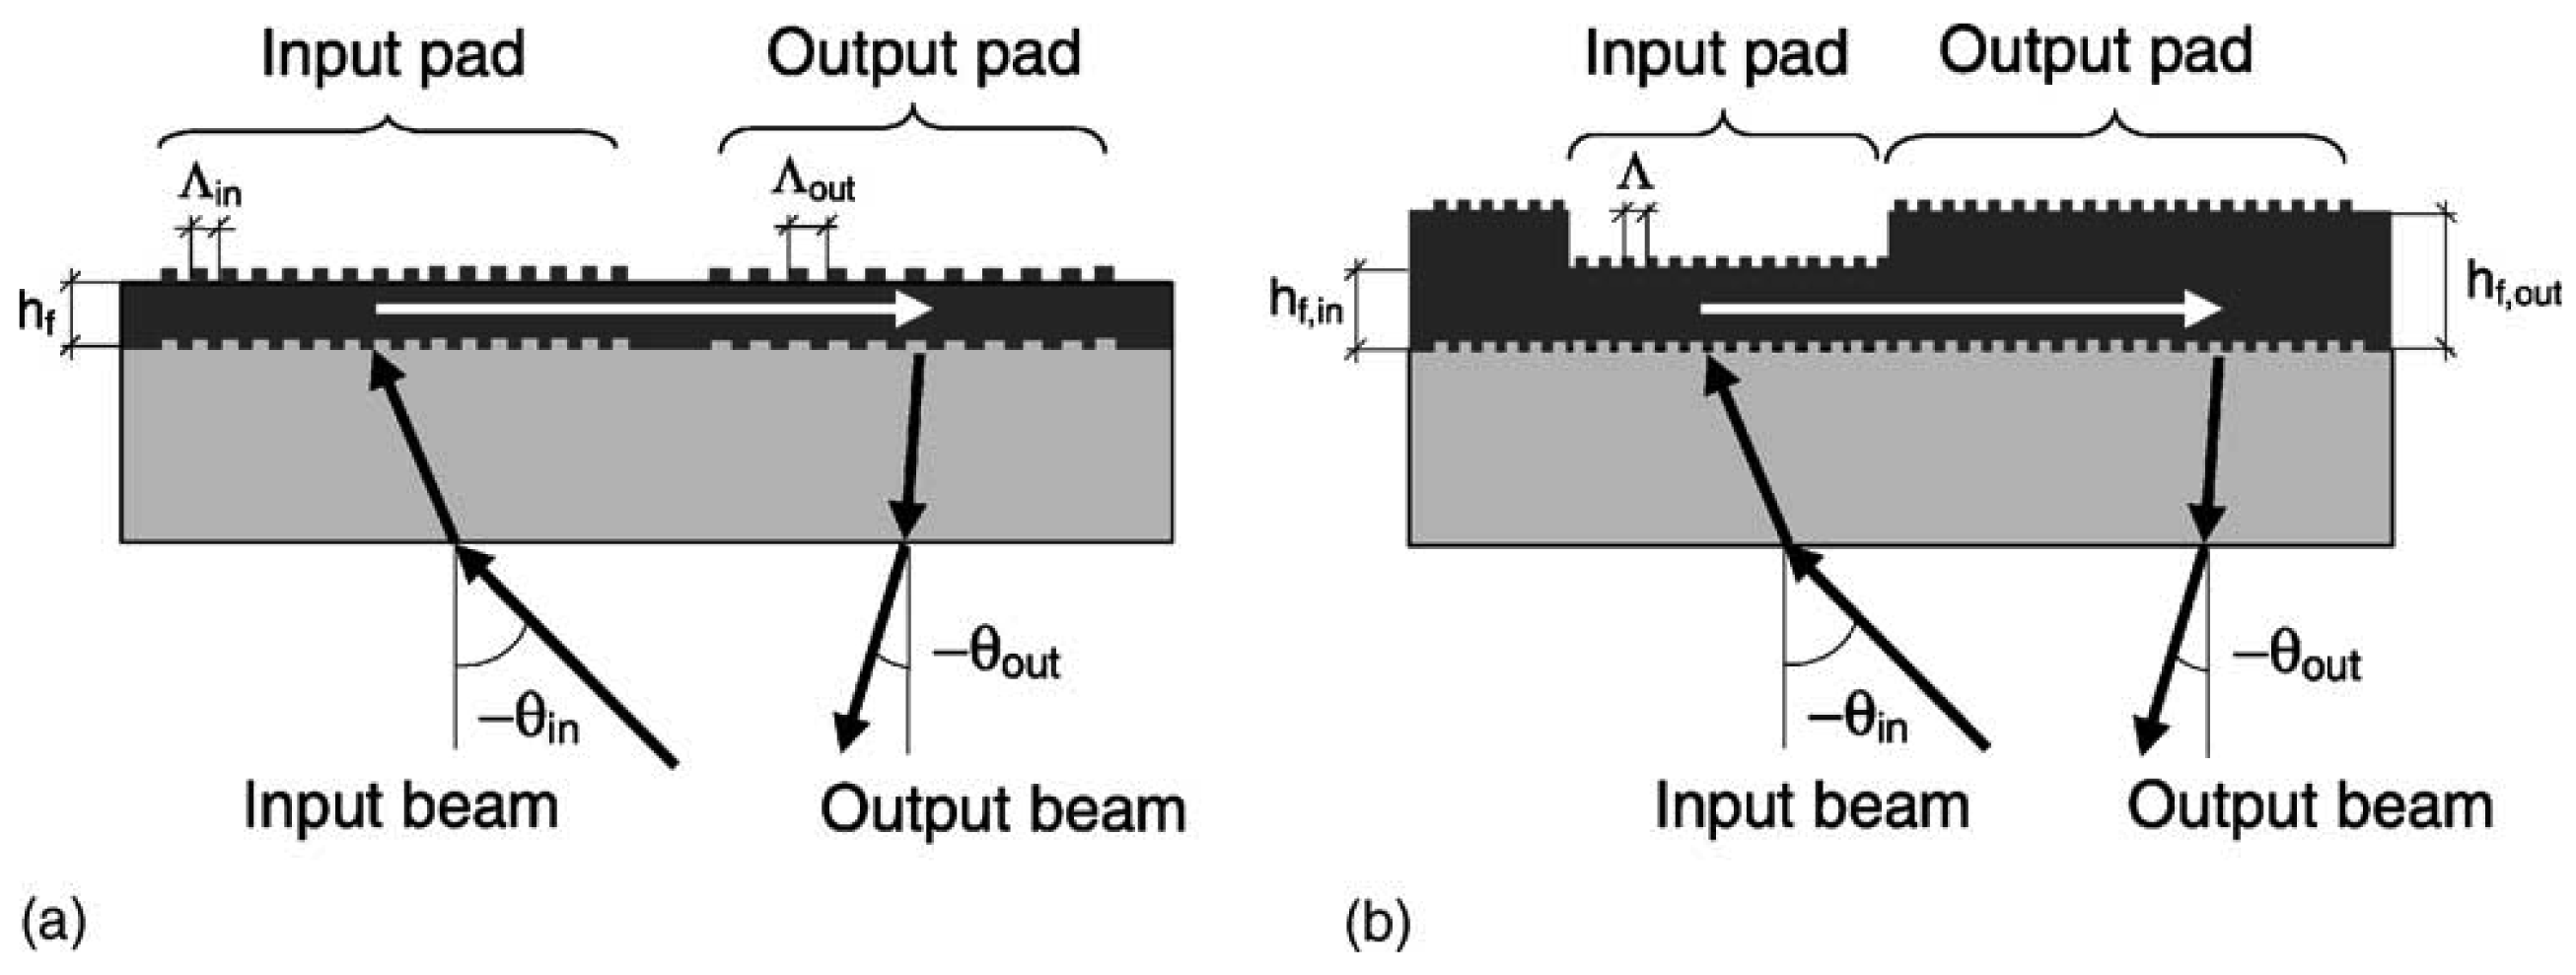
The basic principle of the WIOS is to scan for the resonance peak of a grating coupler. A monomode waveguide is structured with two corrugated grating regions, one providing the incoupling region for the incident beam, the other for outcoupling, respectively. While the latter exhibits a thickness of 300 nm, the incoupling region is 150 nm thick, both structured by dry etching. After excitation of a guided wave and penetration into adjacent layers of the multilayer-waveguide, the optical properties change and affect the phase shift upon Fresnel reflection. According to this, the change of the effective refractive index can be observed by monitoring the resonance peak of the incoupling grating. For different sensing applications the WIOS enables two configurations: one exhibits a grating with different periods for in- and output pad, the other a uniform grating with different film heights (Figure 9).
As a summary the following table gives an overview on the different types of grating couplers and their detection limits:
2.1.2. Interferometer
Another class of label-free optical biosensors is represented by various interferometric systems, among them the Rayleigh interferometer [47], Mach-Zehnder interferometer [27], Hartman interferometer [25, 48] and Young interferometer setups [21, 26, 49]. Other interferometric approaches include for example the integrated-optical difference interferometer [50] and the spectral correlation method [51]. To date, only the Young interferometer described in [24] implements Ta2O5 as waveguide sensor material.
Lukosz et al. [52] compared the theoretical sensitivities of integrated-optical sensor systems including surface plasmon resonance and interferometric sensors and predicted interferometer-based techniques to have the highest sensitivity. Distinctive features of Young interferometers are space-resolved signals, i.e. the interference pattern known from a double slit where the phase shift can be evaluated with high precision, and their ability to reference external influences with a reference path. Figure 10 shows schematically the Young interferometer from [21]. Light passes through several optical components before being split in two beams by a double slit and coupled into the waveguide via a grating. The two beams travel through the waveguide forming the sensing and reference path. The analyte solutions are passed over the surface with a two-channel flow cell covering measurement and reference channel separately. If the surface mass coverage changes, e.g. due to analyte binding, the phase velocity of the guided light and thereby the effective refractive index is changed. From the interference pattern the corresponding phase shift is now determined according to
where ΔΦ and L are the phase shift and the interaction length on the waveguide chip, respectively.
In this system, the reference path can be addressed with sample solutions or buffers as well, which has the advantage of being able to reference ambient fluctuations such as temperature variations and also different buffer conditions, for example complex buffer matrices. This renders the system especially suitable for applications involving complex buffers, e.g. cell lysates, which is described in greater detail in [8]. The real-time monitoring of signals enables the determination of the affinity constant and the association and dissociation kinetics of the binding partners. The sensitivity of the interferometer system is with Δneff of 9 x 10⁻⁹ equivalent to a change in surface coverage of 13 fg/mm2.
2.2. Evanescent field fluorescence systems
2.2.1. Array systems
Screening applications require the development of systems for analyzing DNA and proteins in a highly parallel analysis format. An established array-based sample analysis offers high specificity and sensitivity at low price per parameter. Most DNA microarrays consist of a microscope slide spotted with probe DNA. For identification of mRNA, it is extracted from the cell and transcribed into cDNA, which is marked by fluorescent labels. After hybridization to the probe DNA, a reader system detects the amount of bound/labeled DNA.
Based on luminescence excitation on planar Ta2O5 waveguide surfaces Duveneck et al. [31] published in 1997 an optical bioaffinity sensor. While label-free systems are generally mass-sensitive and the size of the analyte molecule correlates with the achievable sensitivity, the use of reporter molecules like fluorophores makes the sensitivity of sensor systems independent of the size of the analyte molecule. Therefore luminescence-based systems offer better limits of detection compared to label-free methods.
Via a grating etched into the glass substrate, the excitation light is coupled into the waveguide and detection can be carried out in two different ways: either the emission light of the detection area and the excitation light waveguide end-face are monitored by photodiodes combined with an amplifier or a photomultiplier with a photon counting unit (“volume detection”); or backcoupled emission light is guided as a pure mode to a second outcoupling grating and light of different wavelength is separated by different outcoupling angles (“grating detection”). Both detection principles are shown in Figure 11.
Coupling efficiencies into the transducer were optimized by a modulation of the grating depth. For second-order gratings the best depth is 8-9 nm, independent of excitation wavelength. With first-order gratings for the visible spectral region (grating periods far below 500 nm) coupling efficiency could be further increased up to 50 % coupling efficiency of a HeNe laser beam with 320 nm grating period and a waveguide thickness of 150 nm.
The applicability was shown for protein A/F-IgG binding studies on silanized Ta2O5 waveguides that were incubated with protein A. Then F-IgG was applied and visualized via increasing luminescence signal and decreasing transmission signal. DNA hybridization assays with 16-mers on silanized waveguides exhibited a preliminary detection limit of 100 attomoles of complementary Cy5-labeled oligonucleotides, applied at a concentration of 0.1 pM.
In 1998 Pawlak et al. [9] used a similar set-up to that developed by Duveneck et al. On this system Pawlak et al. investigated site-directed ligand binding using FITC-labeled ATPase by immobilizing membrane fragments. This approach offers the advantage that detergent solubilization is not necessary as is the case for the reconstitution of proteins and aqueous media can be easily exchanged for different assays. The difference to the set-up shown in the left part of Figure 11 was that Pawlak used a photon counting photomultiplier tube system and an excitation filter combined with a photodiode in the detection optics for measuring surface-scattered light for referencing.
Based on the aforementioned developments Zeptosens designed the ZeptoREADER [1, 2, 19], a platform for highly sensitive measurements based on planar waveguide technology (PWG) shown in Figure 12.
The setup exhibits a surface-confined, very strong electromagnetic field for efficient and selective excitation of fluorescent labels on the surface. Via a diffractive grating an incident laser-beam (635, 532 and 492 nm optional) is coupled into a Ta2O5 waveguide on top of a transparent substrate. The evanescent field with a penetration depth of about 200 nm into the adjacent medium ensures that only fluorophores close to the surface are excited, which leads to an improvement of the signal-to-noise ratio as well as a highly sensitive and precise measurement.
The fluorescence emission light is collected by an objective and focused on a CCD camera enabling imaging of waveguide chip areas of about 5 mm x 7 mm leading to microarray applications. A filter wheel with interference filters selects the emission wavelength of the applied fluorophores.
An enhanced sensitivity of two orders of magnitude compared to conventional confocal scanners could be reached [1, 19]. For medium and high-throughput applications Zeptosens equipped the system with a stacker capable of holding waveguide chips or carriers adapted to the 96-well plate format arranging five chips. Furthermore, they can use a 96-well plate consisting of a base plate with the waveguide structure and a mounted plastic 96-well structure. The sample can be applied using manual or robotic multipipettors or by a flow-cell.
The performance of this system was demonstrated by multiple marker quantification. A set of three cytokines, human interleukins IL-2, IL-4 and IL-6 were simultaneously measured on an antibody array as multiplexed sandwich immunoassay equivalent to ELISA. They determined limits of detection in the range of 1-15 pg/mL for all three investigated interleukins and a variation of signals within one microarray of < 10%. Regarding the chip-to-chip uncertainty the assay precision showed a coefficient of variation ≤ 15%.
For the determination of system sensitivity different concentrations of Cy5-labeled immunoglobulin G were measured. The limit of detection was a spotted concentration of 2 pM labeled antibody per spot (diameter 150 μm), corresponding to an amount of 0.8 zeptomole of antibody or 500 protein molecules at a dye/protein ratio of ∼5 [2]. The sensitivity of the system enables a dynamic range up to six decades of surface densities of immobilized fluorescent molecules.
Biological marker molecules are used for monitoring health status, progress of diseases or success of treatment. Basically, protein microarrays realize on the one hand protein expression patterns and on the other hand the protein function, activity and concentration. They are applicable for parallel and miniaturized investigations of protein-ligand interactions. The Zeptosens system is also reported to be used for detecting mold mycotoxins [53], or the development towards point-of-care diagnostic systems for the monitoring of multiple tumor markers [54].
For deciphering information in genes both DNA and protein microarray systems enable monitoring of many biological reactions in an efficient and highly parallel way. Owing to the high performance these systems allow sensitive analysis without amplification of low abundant genes/proteins as well as tissue specific investigations of their functions.
Neuschäfer et al. [55] report on an evanescent resonator platform offering superior sensitivity for fluorescence-based microarrays. This platform is based on the same setup as shown in Fig. 11, yet the receptor molecules are spotted directly onto the grating structure and the binding of fluorescently labeled molecules is monitored via a CCD camera. The groove depth of the corrugated structure is optimized to effectively excite the fluorophores. Measurements with Cy5-labeled cDNA yielded a 100-fold increase in signal intensity in resonance mode compared to the epifluorescence mode.
2.2.2. Microscopy
For highly surface sensitive, dynamic and quantitative in-situ analysis of processes on bio-interfaces Grandin et al. developed a biosensing platform, the Waveguide Excitation Fluorescence Microscope (WExFM). Based on fluorescence excitation by an evanescent field the system represents an add-on to a standard inverted microscope offering high target sensitivity for fluorescence detection (femtomolar range), multicolor, in-situ, temporal resolution as well as large area analysis with submicron resolution and a “built in”-calibration of fluorescent light gain. Laser light is coupled into a planar waveguide (Microvacuum: SixTi(1-x)O2 with x ≅ 0.25; refractive index n = 1.77; thickness d = 200 nm or Zeptosens: Ta2O5 with n ≈ 2.2; d ≈ 150 nm) of this system by an optical grating at a specific angle found by scanning a goniometer (Figure 13). A shift of the refractive index due to the adsorption of molecules or changes in the ambient solution are determined by measuring the incoupling angle similarly to the system by Tiefenthaler et al. [33, 56]. Incoupled light travelling along the waveguide is detected by a photodiode arranged at its end. Light within the evanescent field (ca. 100-200 nm) excites fluorescent molecules, e.g. labeled proteins, bound to the surface. The illuminated area is ca. 1 mm x 20 mm. Since the sample remains stationary the system is especially suitable for imaging applications. Furthermore, multicolor experiments are feasible because of co-incident laser beams of different wavelength. The detection is carried out via the microscope objective and a CCD camera or a photo multiplier tube, not limited to any magnification. As a result of their experiments Grandin et al. reported a detection limit < 1 ng/mL (< 20 pM) in case of Alexa Fluor 488 labeled streptavidin (Molecular Probes, Netherlands) [10].
Applications are seen in the surface immobilization of e.g. protein receptors as well as in monitoring surface events (binding interactions, release of fluorescent dyes from vesicles or cells and time evolution of focal adhesions in transfected cells) without any disturbing background signals or any rinsing.
3. Surface chemistry
Various applications require a tailor-made surface modification depending on lipid, DNA, protein or cell-based analysis. High quality substrates with well-defined and reproducible surface properties and optimized surface chemistries are needed to immobilize the capture proteins homogeneously and in a functional conformation. Different strategies have to be considered, since the diversity of capture proteins extends from known binders (e.g. antibodies) to proteins with additional functions e.g. soluble enzymes or, even more delicate to immobilize, water insoluble membrane proteins like ion channel or G-protein coupled receptors (GPCRs), the main targets of pharmaceutical research [57].
Generally, sensors with extremely high sensitivity are developed by physicists and engineers. However, the described sensors consist of more than the optical arrangement. Their applicability depends not only on the physical sensitivity, the linking between the Ta2O5 surface and the analyte is of at least the same importance since it determines the specificity, stability, the number of binding sites, its accessibility, the reversibility and finally the sensitivity by the affinity of the capture molecule. Well-defined, reproducible surface properties and optimized surface chemistries are required for functional immobilization of capture molecules. Therefore many requirements have to be met to create an applicable sensor surface that renders reliable measurement results. Especially for label-free detection systems, generally being mass-sensitive, unspecific binding of interfering molecules is an issue and thus a surface that reduces unspecific binding to a minimum is crucial. Various surface modifications for Ta2O5-based sensors have evolved over the past years.
In most publications the quality of the sensing layer is assessed through application measurements. A low density of functional groups on the surface can be tolerated for the immobilization of comparably large molecules. For this obvious reason the established silane chemistry, that works very well on silicon oxide substrates due to the creation of the siloxane entity and the fitting geometrical dimensions, has been transferred to the Ta2O5 surfaces.
Formation of amino groups on the surface can be achieved using amino-functionalized organosilanes, e.g. 3-aminopropyltriethoxysilane [41] or 4-aminobutyldimethylethoxysilane [45] forming a siloxane at the interface. Due to their three dimensional structure dextran layers can enhance the number of binding sites. The amino-functionalized surface can be activated by a subsequent reaction step with 1-ethyl-3-(3-dimethylaminopropyl) carbodiimide (EDC) and succinic anhydride to couple a dextran layer to the surface [45].
Cottier et al. applied a dextran modified with photosensitive diazirine for photolinker polymer immobilization of IgG antibodies [46]. After deposition of protein probes, e.g. antibodies, and the photolinker polymer onto the surface, irradiation at 350 nm leads to the formation of reactive carbenes. Some carbenes undergo insertion reactions with covalent bonds of probe proteins, others bind to the material surface [58].
To create an epoxy modified surface, 3-(glycidoxypropyl)trimethoxysilane (GOPS) can be used for a successful functionalization of the Ta2O5 waveguide. Budach et al. [59] applied this chemistry for performing fluorescence-based oligonucleotide hybridization assays demonstrating the extremely high sensitivity of a planar waveguide measurement platform. Electrostatic interaction with a positively charged graft copolymer (poly(L-lysine)-g-poly(ethylene glycol) can also serve as surface modification for hybridization assays [19].
Brynda et al. synthesized a flexible network in situ in a grating coupler instrument by repeated successive adsorption of anti-b2-microglobulin (anti-B2M) and dextran sulphate (DS) followed by glutaraldehyde crosslinking of anti-B2M and washing out DS [43]. This antibody network proved to enhance the sensitivity if the size of the detected antigen allows the penetration through the network. The glutaraldehyde crosslinking can be also used to build up a BSA network for subsequent antibody immobilization [44].
Polzius et al. [37] compared covalent and non-covalent immobilization strategies by binding of protein G as capture molecule for immunoglobulin G (IgG) to the waveguide. The best signal response showed an avidin mediated immobilization using a carboxymethyl dextran matrix coupled by EDC/N-hydroxysulfosuccinimide. A potentially less efficient method is the immobilization of biotinylated protein G to avidin directly adsorbed to Ta2O5. Binding via aldehyde functions after converting an APTS silanized surface with glutaraldehyde, direct protein binding to the APTS surface or after activation by bis(sulfosuccinimidyl)suberate or glutaraldehyde activation also work as coupling methods but exhibit lower binding capacities. The weakest IgG binding efficiency was observed with protein G immobilization via GOPS silanization.
Common to all publications cited above is the investigation of surface modifications by indirect methods, i.e. quality assessment based on the binding efficiency using DNA hybridization or immunoassays. Direct analyses of surface modifications on Ta2O5 by angle dependent X-ray photoelectron spectroscopy (XPS), atomic force microscopy (AFM), contact angle measurement or time-of-flight secondary ion mass spectrometry (ToF-SIMS) are published by the Laboratory of Surface Science and Technology, ETH Zurich [60, 61]. They obtained highly-oriented self-assembled monolayers (SAM) of octadecyl phosphoric acid on Ta2O5 surfaces. For the preparation of the waveguides 500 μM octadecyl phosphoric acid ester [C3H37OPO(OH)2] was dissolved in n-heptane/2-propanol in a 100/0.4 solvent mixture and filtered by a 0.2 μm cellulose nitrate filter. The SAM was formed by subsequent immersion in this solution for up to 48 h, rinsing with 2-propanol and blow-drying with He. AFM images of the produced layer show small areas with a hexagonal pattern with an average nearest-neighbour distance of 0.49 nm ± 0.01 nm. Nevertheless an ordered structure of the molecular layer is not clearly observable over larger areas. Calculations using published bond lengths [62] (0.16 nm for the O-P, 0.14 nm for the O-C, and 0.17 nm for the O-Ta) result in a density of the phosphate and hydrocarbon regions of 2.0 g/cm3 and 1.1 g/cm3, respectively. Taking these data into account for angle resolved XPS with an evaluation based on a three layer model for thin oxide films on metallic substrates (1st substrate Ta2O5, 2nd phosphate interfacial layer, 3rd hydrocarbon layer) a thickness of 2.2 nm ± 0.2 nm was found for the octadecylphosphate (ODP) monolayer at all emission angles. ToF-SIMS spectra showed high occurrence of tantalum oxide phosphate species and indicate a close packing of the ODP molecules. To some extent more than one phosphate head group is coordinated to one tantalum ion. The ToF-SIMS data are in very good accordance to the expected model of coordination of ODP on Ta2O5 involving the presence of both bidentate phosphate anchor groups bound to one tantalum ion and of monodentate coordination of two phosphate head groups to one tantalum ion (Figure 14). By near-edge X-ray absorption fine structure spectroscopy (NEXAFS) an average tilt angle of 30-35° was experimentally determined. With this value and the total length of the ODP molecule of 2.5 nm a theoretical thickness of 2.1 nm ± 0.05 nm was calculated showing good agreement with the theoretical value obtained in the experiment.
Mixed monolayers of dodecylphosphate and 12-hydroxy dodecylphosphate were produced to control the surface wettability within a water contact angle between 110° and 50° [63].
Pawlak et al. [2] applied these hydrophobic surfaces onto waveguide substrates produced by self-assembly from 0.5 mM dodecylmonophosphate at room temperature in aqueous solution [63]. This procedure allows spontaneous immobilization of (Cy5-)labelled antibodies to determine the limit of detection and the dynamic range of the Zeptosens system or to create antibody arrays for the detection of human interleukins (IL-2, IL-4, IL-6) for multiple marker quantification in an ELISA equivalent multiplexed sandwich immunoassay. For the investigation of biomembrane fragments he used hexadecylmonophosphate in isopropyl alcohol for hydrophobization with subsequent self-assembly of a lipid monolayer for controlled and stable physisorption of membrane fragments [9].
Recently, De Palma et al. [64] investigated the formation of organosilane self-assembled monolayers on Ta2O5 applying the model compound n-decyltrichlorosilane. After cleaning by piranha solution and ammonia followed by drying on a hotplate at 110 °C under N2 atmosphere, the surface substrates were treated by UV/O3. Then the silanization was performed in a solution of dried toluene containing 0.5% (v/v) n-decyltrichlorosilane followed by rinsing with toluene, CCl4, acetone, H2O, and methanol to remove noncovalently bound silanes. After drying the samples under N2 flow they were finally heated on a hotplate at 110 °C to promote potential cross-linking between the silanes (siloxane formation). Infrared spectroscopic analysis of the va(CH2) and vs(CH2) frequencies indicated well-ordered silane layers on Ta2O5 with ∼2922 cm-1 and ∼2853 cm-1, respectively. The ellipsometric thickness was determined to 1.1 nm ± 0.01 nm assuming a refractive index of 1.45 for the silane layer. This thickness can be explained by a tilt angle of 45° for the alkyl chains with respect to the surface normal which is in accordance to XPS measurements. Therefore the van der Waals interactions between the alkyl chains can contribute to the layer stability. Cyclovoltammetry measurements confirmed the formation of a dense silane layer.
4. Summary and conclusion
Optical biosensors have proven to be very sensitive, stable and reliable detection systems in the recent years. Depending on the application they can be integrated in automatic high-throughput analysis but also used for highly sensitive experiments in the research laboratory. The systems exhibit accessibility for the add-on of flow cells or pipetting devices. High refractive index materials enable the investigation of bioreactions at the surface within the evanescent field. Particularly, based on Ta2O5 several sensor systems in various extensions were developed with the advantage of high sensitivity and measurement in presence of the sample without any rinsing. The spatially limited evanescent field at the surface can be applied for both surface confined fluorescence excitation and label-free detection of refractive index changes.
Systems based on monitoring of refractive index changes are suitable for the determination of affinity constants and kinetic studies. Grating coupler and interferometer devices were developed for this purpose. The advantage of a simple sample preparation without reporter molecule faces the disadvantage of non-specific binding of matrix molecules since the signal depends mainly on the mass coverage on the surface without any discrimination of molecules. The sensitivity of label-free systems with 13 fg/mm2 in the case of an interferometer arrangement does not reach the detection limits of evanescent field fluorescence systems, since they are independent of the molecular mass of the analyte and detection limits of 500 molecules (dye/protein ratio ∼5) per 150 diameter spot are reached.
Applications were demonstrated for various model assays, such as immunoreactions or oligonucleotide hybridization and for multiplexed assays in array format like monitoring of tumor markers. The reported publications lead to the conclusion that all technical aspects concerning sampling and detection have been addressed. Implementing evanescent field sensors into the laboratory process techniques and targeted development for specific applications, for example, portable point-of-care devices, will lead to a broader distribution of this technology. A broad applicability will be achieved by consequent assay development.
References
- Ehrat, M.; Kresbach, G.M. DNA and protein microarrays and their contributions to proteomics and genomics. Chimia 2001, 55, 35–39. [Google Scholar]
- Pawlak, M.; Schick, E.; Bopp, M.A.; Schneider, M.J.; Oroszlan, P.; Ehrat, M. Zeptosens' protein microarrays: A novel high performance microarray platform for low abundance protein analysis. Proteomics 2002, 2, 383–393. [Google Scholar]
- Miklos, G.L.; Maleszka, R. Protein functions and biological contexts. Proteomics 2001, 1, 169–178. [Google Scholar]
- Weissenstein, U.; Schneider, M.J.; Pawlak, M.; Cicenas, J.; Eppenberger-Castori, S.; Oroszlan, P.; Ehret, S.; Geurts-Moespot, A.; Sweep, F.C.G.J.; Eppenberger, U. Protein chip based miniaturized assay for simultaneous quantitative monitoring of cancer biomarkers in tissue extracts. Proteomics 2006, 6, 1427–1436. [Google Scholar]
- Templin, M.F.; Stoll, D.; Pawlak, M.; Joos, T.O. Protein Microarrays: Neue Systeme für die Proteomforschung. GIT Labor-Fachzeitschrift 2006, 50, 890–892. [Google Scholar]
- Homola, J.; Vaisocherová, H.; Dostálek, J.; Piliarik, M. Multi-analyte surface plasmon resonance biosensing. Methods 2005, 37, 26–36. [Google Scholar]
- Rich, R.L.; Myszka, D.G. Survey of the year 2003 commercial optical biosensor literature. J. Mol. Recogn. 2005, 18, 1–39. [Google Scholar]
- Hoffmann, C.; Schmitt, K.; Brandenburg, A.; Hartmann, S. Rapid protein expression analysis with an interferometric biosensor for monitoring protein production. Anal. Bioanal. Chem. 2007, 387, 1921–1932. [Google Scholar]
- Pawlak, M.; Grell, E.; Schick, E.; Anselmetti, D.; Ehrat, M. Functional immobilization of biomembrane fragments on planar waveguides for investigation of side-directed ligand binding by surface-confined fluorescence. Faraday Discuss. 1998, 111, 273–288. [Google Scholar]
- Grandin, H.M.; Staedler, B.; Textor, M.; Vörös, J. Waveguide excitation fluorescence microscopy: A new tool for sensing and imaging the biointerface. Biosens. Bioelectron. 2006, 21, 1476–1482. [Google Scholar]
- Zhang, J.-Y.; Bie, L.-J.; Boyd, I.W. Formation of high quality tantalum oxide films at 400°C by 172 nm radiation. Jpn. J. Appl. Phys. 1998, 37, L27–L29. [Google Scholar]
- Vargas, S.; Arroyo, R.; Haro, E.; Rodriguez, R. Effects of cationic dopants on the phase transition temperature of titania prepared by the sol-gel method. J. Mater. Res. 1999, 14, 3932–3937. [Google Scholar]
- Joshi, P.C.; Cole, M.W. Influence of postdeposition annealing on the enhanced structural and electrical properties of amorphous and crystalline Ta2O5 thin films for dynamic random access memory applications. J. Appl. Phys. 1999, 86, 871–880. [Google Scholar]
- Mattsson, M.S.; Niklasson, G.A. A frequency response and transient current study of β-Ta2O5: methods of estimating the dielectric constant, direct current conductivity and ion mobility. J. Appl. Phys. 1999, 85, 2185–2191. [Google Scholar]
- Kim, I.; Kim, J.-S.; Cho, B.-W.; Ahn, S.-D.; Chun, J.-S.; Lee, W.-J. Effects of deposition temperature on the electrical properties of electron cyclotron resonance plasma-enhanced chemical vapor deposition Ta2O5 film and the formation of interfacial SiO2. J. Mater. Res. 1995, 10, 2864–2869. [Google Scholar]
- Lai, B.C.; Yu, J.-C.; Lee, J.-Y. Ta2O5/Silicon barrier height measured from MOSFETs fabricated with Ta2O5 gate dielectric. IEEE Electron Device Letters 2001, 22, 221–223. [Google Scholar]
- Kim, J.-W.; Nam, S.-D.; Lee, S.-H.; Won, S.-J.; Kim, W.-D.; Yoo, C.-Y.; Park, Y.-W.; Lee, S.-I.; Lee, M.-Y. Electrical properties of crysatalline Ta2O5 with Ru electrode. Jpn. J. Appl. Phys. 2000, 39, 2094–2097. [Google Scholar]
- Jooste, B.R.; Viljoen, H.J. A study of piezoelectric orthorombic Ta2O5. J. Mater. Res. 1998, 13, 475–482. [Google Scholar]
- Duveneck, G.L.; Abel, A.P.; Bopp, M.A.; Kresbach, G.M.; Ehrat, M. Planar waveguides for ultra-high sensitivity of the analysis of nucleic acids. Anal. Chim. Acta 2002, 469, 49–61. [Google Scholar]
- Tiefenthaler, K.; Lukosz, W. Sensitivity of grating couplers as integrated-optical chemical sensors. J. Opt. Soc. Am. B 1989, 6, 209–220. [Google Scholar]
- Schmitt, K. A new waveguide interferometer for the label-free detection of biomolecules. PhD Thesis, Université Louis Pasteur, Strasbourg, 2006. [Google Scholar]
- Lukosz, W.; Clerc, D.; Nellen, P.M.; Stamm, C.; Weiss, P. Output grating couplers on planar optical waveguides as direct immunosensors. Biosens. Bioelectron. 1991, 6, 227–232. [Google Scholar]
- Bilitewski, U.; Bier, F.; Brandenburg, A. Immunobiosensors based on grating couplers. In Methods in Biotechnology; Vol. 7, Affinity Biosensors – Techniques and Protocols; Mulchandani, A., Ed.; Humana Press: Totowa, NJ, 1998; pp. 121–134. [Google Scholar]
- Schmitt, K.; Schirmer, B.; Hoffmann, C.; Brandenburg, A.; Meyrueis, P. Interferometric biosensor based on planar optical waveguide sensor chips for label-free detection of surface bound bioreactions. Biosens. Bioelectron. 2007, 22, 2591–2597. [Google Scholar]
- Schneider, B.H.; Edwards, J.; Hartman, N. Hartman interferometer: versatile integrated optic sensor for label-free, real-time quantification of nucleic acids, proteins, and pathogens. Clin. Chem. 1997, 43, 1757–1763. [Google Scholar]
- Ymeti, A.; Kanger, J.S.; Wijn, R.; Lambeck, P.V.; Greve, J. Development of a multichannel integrated interferometer immunosensor. Sens. Actuators B 2002, 83, 1–7. [Google Scholar]
- Weisser, M.; Tovar, G.; Mittler-Neher, S.; Knoll, W.; Brosinger, F.; Freimuth, H.; Lacher, M.; Ehrfeld, W. Specific bio-recognition reactions observed with an integrated Mach-Zehnder interferometer. Biosens. Bioelectron. 1999, 14, 405–411. [Google Scholar]
- De Feijter, J.A.; Benjamins, J.; Veer, F.A. Ellipsometry as a tool to study the adsorption behaviour of synthetic and biolpolymers at the air-water interface. Biopolymers 1978, 17, 1759–1772. [Google Scholar]
- Sober, H. Handbook of Biochemistry, Second Edition ed; Chemical Rubber Co.: Cleveland, Ohio, 1970. [Google Scholar]
- Brandenburg, A.; Krauter, R.; Künzel, C.; Stefan, M.; Schulte, H. Interferometric sensor for detection of surface-bound bioreactions. Appl. Optics 2000, 39, 6396–6405. [Google Scholar]
- Duveneck, G.L.; Pawlak, M.; Neuschäfer, D.; Bär, E.; Budach, W.; Pieles, U.; Ehrat, M. Novel bioaffinity sensors for trace analysis based on luminescence excitation by planar waveguides. Sens. Actuators B 1997, 38-39, 88–95. [Google Scholar]
- Nellen, P.M.; Tiefenthaler, K.; Lukosz, W. Integrated optical input grating couplers as biochemical sensors. Sensors and Actuators 1988, 15, 285–295. [Google Scholar]
- Lukosz, W.; Tiefenthaler, K. Directional switching in planar waveguides effected by adsorption-desorption processes. Proc. 2nd Eur. Conf. Integrated Optics., Florence, Italy; 1984. [Google Scholar]
- Nellen, P.M.; Lukosz, W. Integrated optical input grating couplers as chemo- and immunosensors. Sensors and Actuators 1990, B1, 592–596. [Google Scholar]
- Bier, F.F.; Jockers, R.; Schmid, R.D. Integrated optical immunosensor for s-triazine determination: regeneration, calibration and limitations. Analyst 1994, 119, 437–441. [Google Scholar]
- Polzius, R.; Bier, F.F.; Bilitewski, U.; Jäger, V.; Schmid, R.D. On-line monitoring of monoclonal antibodies in animal cell culture using a grating coupler. Biotechnology and Bioengineering 1993, 42, 1287–1292. [Google Scholar]
- Polzius, R.; Schneider, T.; Bier, F.F.; Bilitewski, U. Optimization of biosensing using grating couplers: immobilization on tantalum oxide waveguides. Biosens. Bioelectron. 1996, 11, 503–514. [Google Scholar]
- Polzius, R.; Dieβel, E.; Bier, F.; Bilitewski, U. Real-time observation of affinity reactions using grating couplers: determination of the detection limit and calculation of rate constants. Anal. Biochem. 1997, 248, 269–276. [Google Scholar]
- Lukosz, W.; Nellen, P.M.; Stamm, C.; Weiss, P. Output grating couplers on planar waveguides as integrated optical chemical sensors. Sensors and Actuators 1990, B1, 585–588. [Google Scholar]
- Brandenburg, A.; Gombert, A. Grating couplers as chemical sensors: a new optical configuration. Sens. Actuators B 1993, 17, 35–40. [Google Scholar]
- Brandenburg, A.; Polzius, R.; Bier, F.; Bilitewski, U.; Wagner, E. Direct observation of affinity reactions by reflected-mode operation of integrated optical coupler. Sens. Actuators B 1996, 30, 55–59. [Google Scholar]
- Bier, F.F.; Kleinjung, F.; Scheller, F.W. Real-time measurement of nucleic-acid hybridization using evanescent-wave sensors: steps towards the genosensor. Sens. Actuators B 1997, 38-39, 78–82. [Google Scholar]
- Brynda, E.; Houska, M.; Brandenburg, A.; Wikerstal, A.; Skvor, J. The detection of human beta2-microglobulin by grating coupler immunosensor with three dimensional antibody networks. Biosens. Bioelectron. 1999, 14, 363–368. [Google Scholar]
- Brynda, E.; Houska, M.; Brandenburg, A.; Wikerstal, A. Optical biosensors for real-time measurement of analytes in blood plasma. Biosens. Bioelectron. 2002, 17, 665–675. [Google Scholar]
- Piehler, J.; Brandenburg, A.; Brecht, A.; Wagner, E.; Gauglitz, G. Characterization of grating couplers for affinity-based pesticide sensing. Appl. Optics 1997, 36, 6554–6562. [Google Scholar]
- Cottier, K.; Wiki, M.; Voirin, G.; Gao, H.; Kunz, R.E. Label-free highly sensitive detection of (small) molecules by wavelength interrogation of integrated optical chips. Sens. Actuators B 2003, 91, 241–251. [Google Scholar]
- Chen, K.; Hsu, C.; Su, D.-C. Interferometric optical sensor for measuring glucose concentration. Appl. Optics 2003, 42, 5774–5776. [Google Scholar]
- Schneider, B.H.; Dickinson, E.L.; Vach, M.D.; Hoijer, J.V.; Howard, L.V. Highly sensitive optical chip immunoassays in human serum. Biosens. Bioelectron. 2000, 15, 13–20. [Google Scholar]
- Cross, G.H.; Reeves, A.A.; Brand, S.; Popplewell, J.F.; Peel, L.L.; Swann, M.J.; Freeman, N.J. A new quantitative optical biosensor for protein characterisation. Biosens. Bioelectron. 2003, 19, 383–390. [Google Scholar]
- Stamm, C.; Dangel, R.; Lukosz, W. Biosensing with the integrated-optical difference interferometer: dual-wavelength operation. Optics Communications 1998, 153, 347–359. [Google Scholar]
- Nikitin, P.I.; Valeiko, M.V.; Gorshkov, B.G. New direct optical biosensors for multianalyte detection. Sens. Actuators B 2003, 90, 46–51. [Google Scholar]
- Lukosz, W. Principles and sensitivities of integrated optical and surface plasmon sensors for direct affinity sensing and immunosensing. Biosens. Bioelectron. 1991, 6, 215–225. [Google Scholar]
- Der Pilzgift-Detektiv. Bayer Research 2006, 18, 92–95.
- Petry, C. Biochips in der Diagnostik. GIT Labor-Fachzeitschrift 2006, 10, 938–942. [Google Scholar]
- Neuschäfer, D.; Budach, W.; Wanke, C.; Chibout, S.-D. Evanescent resontor chips: a universal platform with superior sensitivity for fluorescence-based microarrays. Biosens. Bioelectron. 2003, 18, 489–497. [Google Scholar]
- Tiefenthaler, K. Grating couplers as label-free biochemical waveguide sensors. Biosens. Bioelectron. 1993, 6, 35–37. [Google Scholar]
- Knowles, J. Medicines for the new millenium: hunting down disease. Odyssey 1997, 3, 18–24. [Google Scholar]
- Caelen, I.; Gao, H.; Sigrist, H. Protein density gradients on surfaces. Langmuir 2002, 18, 2463–2467. [Google Scholar]
- Budach, W.; Abel, A.P.; Bruno, A.E.; Neuschäfer, D. Planar waveguides as high-performance sensing plantforms for fluorescence-based multiplexed oligonucleotide hybridization assays. Anal. Chem. 1999, 71, 3347–3355. [Google Scholar]
- Brovelli, D.; Hähner, G.; Ruiz, L.; Hofer, R.; Kraus, G.; Waldner, A.; Schlösser, J.; Oroszlan, P.; Ehrat, M.; Spencer, N.D. Highly oriented self-assembled alkanephosphate monolayers on tantalum(V) oxide surfaces. Langmuir 1999, 15, 4324–4327. [Google Scholar]
- Textor, M.; Ruiz, L.; Hofer, R.; Rossi, A.; Feldmann, K.; Hähner, G.; Spencer, N.D. Structural chemistry of self-assembled monolayers of octadecylphosphoric acid on tantalum oxide surfaces. Langmuir 1999, 16, 3257–3271. [Google Scholar]
- Handbook of Chemistry and Physics.; 1997; Boca Raton, FL (USA); CRC Press.
- Hofer, R.; Textor, M.; Spencer, N.D. Alkyl phosphate monolayers, self-assembled from aqueous solution onto metal oxide surfaces. Langmuir 2001, 17, 4014–4020. [Google Scholar]
- De Palma, R.; Laureyn, W.; Frederix, F.; Bonroy, K.; Pireaux, J.-J.; Borghs, G.; Maes, G. Formation of dense self-assembled monolayers of (n-decyl)trichlorosilanes on Ta/Ta2O5. Langmuir 2007, 23, 443–451. [Google Scholar]
Figure 1.
Refractive index n and extinction coefficient k of a thin Ta2O5 layer on glass (n = 1.52) versus wavelength (light source: Xe arc lamp with corresponding interference filters); measurements performed at an angle of incidence of 50° by means of spectroscopic ellipsometry (EP3, Nanofilm Technologie GmbH, Göttingen, Germany).

Figure 2.
Three-layer planar waveguide system comprising substrate, waveguide and cover layer, with refractive indices ns, nw, and nc, respectively.
Figure 2.
Three-layer planar waveguide system comprising substrate, waveguide and cover layer, with refractive indices ns, nw, and nc, respectively.

Figure 3.
The principle of evanescent field sensing. A waveguide layer on a substrate is guiding a light mode with phase velocity v1. A change in the effective refractive index and thus a decrease in the phase velocity v2 < v1 is caused by either a change in the cover refractive index Δnc or a change in the adlayer thickness Δtad due to molecule adsorption, e.g. binding of an antigen to a capture antibody. From [21].

Figure 4.
Theoretical sensitivities of a waveguide to a) cover refractive index changes and b) surface adlayer changes versus waveguide thickness. Parameters for calculation: ns = 1.52, nw = 2.1, nc = 1.333 and λ = 675 nm. From [21].
Figure 4.
Theoretical sensitivities of a waveguide to a) cover refractive index changes and b) surface adlayer changes versus waveguide thickness. Parameters for calculation: ns = 1.52, nw = 2.1, nc = 1.333 and λ = 675 nm. From [21].

Figure 5.
(a) Schematic of the input grating coupler instrument. In an angular scan, the TE0 and TM0 modes are successively excited by an s- and a p-polarized laser beam. L = lever arm; MS = micrometer screw; SM = stepping motor; Cu = cuvette; Laser = He-Ne laser (λ = 632.8 nm); FP = Foster prism; M1 and M2 = mirrors; P = incident power; P′ = power of incoupled guided mode; α = angle of incidence; D1 and D2 = silicon photodetectors. (b) Detailed view of the sensor: C = liquid cover; F = waveguiding film of thickness dF on glass substrate S. From [34], Copyright Elsevier (1990).

Figure 6.
(a) Schematic of output grating coupler sensor; F = waveguide; S = substrate; C = sample; Lc = cylindrical lens of short focal length fc (e.g. fc = 5 mm); L = cylindrical lens of focal length f (e.g. f = 300 mm); α = outcoupling angle; Δα = change in outcoupling angle proportional to the effective index change Δn; PSD = position-sensitive-detector; Δu = displacement of centre of the light spot on the PSD. (b) Schematics of output grating coupler measuring the effective index changes Δn(TE0) and Δn(TM0) of the TE0 and TM0 modes; M, M′ = mirrors. From [39], Copyright Elsevier (1990).

Figure 7.
Optical arrangement for reflected-mode operation of integrated optical grating coupler. From [41], Copyright Elsevier (1996).
Figure 7.
Optical arrangement for reflected-mode operation of integrated optical grating coupler. From [41], Copyright Elsevier (1996).

Figure 8.
Schematic of wavelength interrogated optical sensor WIOS. From [46], Copyright Elsevier (2003).
Figure 8.
Schematic of wavelength interrogated optical sensor WIOS. From [46], Copyright Elsevier (2003).

Figure 9.
(a) Cut through dual period sensor chip. (b) Cut through thickness-modulated sensor chip. From [46], Copyright Elsevier (2003).
Figure 9.
(a) Cut through dual period sensor chip. (b) Cut through thickness-modulated sensor chip. From [46], Copyright Elsevier (2003).

Figure 10.
Young interferometer as described in [21]. Light from a light source is coupled into the waveguide sensor chip by a grating after being split in two beams by a double slit. The two beams are guided separately down the waveguide, forming sensing and reference path, and coupled out by a second grating. The interference pattern is recorded behind another double slit by a CCD line sensor.

Figure 11.
left: Schematic optical set-up used for first model-assays for ‘volume detection’, interference filters were used for selection of the excitation or emission light and photodiodes or photomultiplier for signal detection; right: comparison of set-ups for volume detection and detection of backcoupled and guided luminescence light, using a second outcoupling grating where different wavelength can be discriminated by the outcoupling angle. From [31], Copyright Elsevier (1997).

Figure 12.
Detection principle of evanescent field fluorescence on planar waveguides (principle of ZeptoREADER): excitation light is coupled into a thin-film waveguide; surface confined fluorescence of bound labeled molecules is detected by a CCD camera. Adapted from [2, 19]

Figure 13.
Schematic of the Waveguide Excitation Fluorescence Microscope (WExFM); photograph of the system on a standard inverted microscope. From [10], Copyright Elsevier (2005).
Figure 13.
Schematic of the Waveguide Excitation Fluorescence Microscope (WExFM); photograph of the system on a standard inverted microscope. From [10], Copyright Elsevier (2005).

Figure 14.
Bidentate und monodentate phosphate coordination to tantalum ions. Adapted from [61].
Figure 14.
Bidentate und monodentate phosphate coordination to tantalum ions. Adapted from [61].


| Type | Waveguide material | Citation | Detection limit (Δneff, min) | Detection limit by model system |
|---|---|---|---|---|
| Input | SiO2-TiO2 | Nellen et al. 1988 | 5 x 10⁻⁶ | 6 μg/mL anti-h-IgG to adsorbed h-IgG |
| SiO2-TiO2 | Nellen and Lukosz 1990 | 2 x 10⁻⁶ | 0.16 μg/mL anti-h-IgG to adsorbed h-IgG | |
| SiO2-TiO2 | Bier et al. 1994 | 15 μg/L terbutryn (pesticide) in a competitive assay | ||
| SiO2-TiO2 | Polzius et al. 1993 | 10 to 150 μg/mL mouse IgG to immobilized anti-mouse IgG, 0.8 to 7 μg/mL mouse IgG in competitive assay format | ||
| Ta2O5 | Polzius et al. 1997 | Mr = 2000 Da (biotinylated somatostatin) | ||
| Output | SiO2-TiO2 | Lukosz et al. 1991 | 3 x 10⁻⁶ | 4 μg/mL anti-h-IgG to adsorbed h-IgG |
| Reflected mode | Ta2O5 | Brandenburg et al. 1996 | 3 x 10⁻⁶ | 0.2 μg/mL; 1.4 x 10⁻⁹ M h-IgG (to adsorbed protein G) |
| Ta2O5 | Piehler et al. 1997 | 3 x 10⁻⁶ | 10 pg/mm2 BSA-biotin/strepatavidin-multilayer, 0.25 μg/L simazine (herbicide) inhibition assay | |
| In- and Output | Ta2O5 | Cottier 2003 | <10-6 | 0.3 pg/mm2 biotin to immobilized neutravidin |
© 2008 by MDPI Reproduction is permitted for noncommercial purposes.
Share and Cite
MDPI and ACS Style
Schmitt, K.; Oehse, K.; Sulz, G.; Hoffmann, C. Evanescent field Sensors Based on Tantalum Pentoxide Waveguides – A Review. Sensors 2008, 8, 711-738. https://doi.org/10.3390/s8020711
AMA Style
Schmitt K, Oehse K, Sulz G, Hoffmann C. Evanescent field Sensors Based on Tantalum Pentoxide Waveguides – A Review. Sensors. 2008; 8(2):711-738. https://doi.org/10.3390/s8020711
Chicago/Turabian StyleSchmitt, Katrin, Kerstin Oehse, Gerd Sulz, and Christian Hoffmann. 2008. "Evanescent field Sensors Based on Tantalum Pentoxide Waveguides – A Review" Sensors 8, no. 2: 711-738. https://doi.org/10.3390/s8020711