Ground Based Ultraviolet Remote Sensing of Volcanic Gas Plumes

Department of Geography, University of Sheffield, Winter Street, Sheffield, S10 2TN, UK
*
Author to whom correspondence should be addressed.
Sensors 2008, 8(3), 1559-1574; https://doi.org/10.3390/s8031559
Submission received: 19 February 2008
/
Accepted: 6 March 2008
/
Published: 10 March 2008
(This article belongs to the Special Issue Sensors for Disaster and Emergency Management Decision Making)
Abstract
:Ultraviolet spectroscopy has been implemented for over thirty years to monitor volcanic SO2 emissions. These data have provided valuable information concerning underground magmatic conditions, which have been of utility in eruption forecasting efforts. During the last decade the traditionally used correlation spectrometers have been upgraded with miniature USB coupled UV spectrometers, opening a series of exciting new empirical possibilities for understanding volcanoes and their impacts upon the atmosphere. Here we review these technological developments, in addition to the scientific insights they have precipitated, covering the strengths and current limitations of this approach.
1. Introduction
It is estimated that some 9% of Earth's population live within 100 km of historically active volcanoes [Small and Naumann, 2001]; these pose considerable hazards both locally and globally, resulting in the loss of some 100,000 lives during the last century alone [Witham, 2005]. The last two hundred years have witnessed a number of spectacular eruptions, foremost among which was Tambora in Indonesia during 1815, which ejected 50 cubic kilometres of magma, resulting in over 71,000 fatalities in the immediately impacted region as a consequence of the blast itself, and the subsequent ash fall, which smothered and contaminated crops and water supplies, leading to starvation and disease [Oppenheimer, 2003]. The most lethal eruption of the 20th century was Mt. Pelée in Martinique, when, during 1902, the lava dome collapsed, precipitating a deadly pyroclastic flow of hot rocks, ash and gas down the flanks of the volcano into the principal town, St. Pierre, thereby killing all but two of the ≈28,000 inhabitants. In antiquity, the AD 79 eruption of Vesuvius destroyed Pompeii and Herculaneum, and the 17th century BC eruption of Santorini (Greece) precipitated enormous tsunamis, which may have contributed to the demise of the Cretan Minoan civilisation.
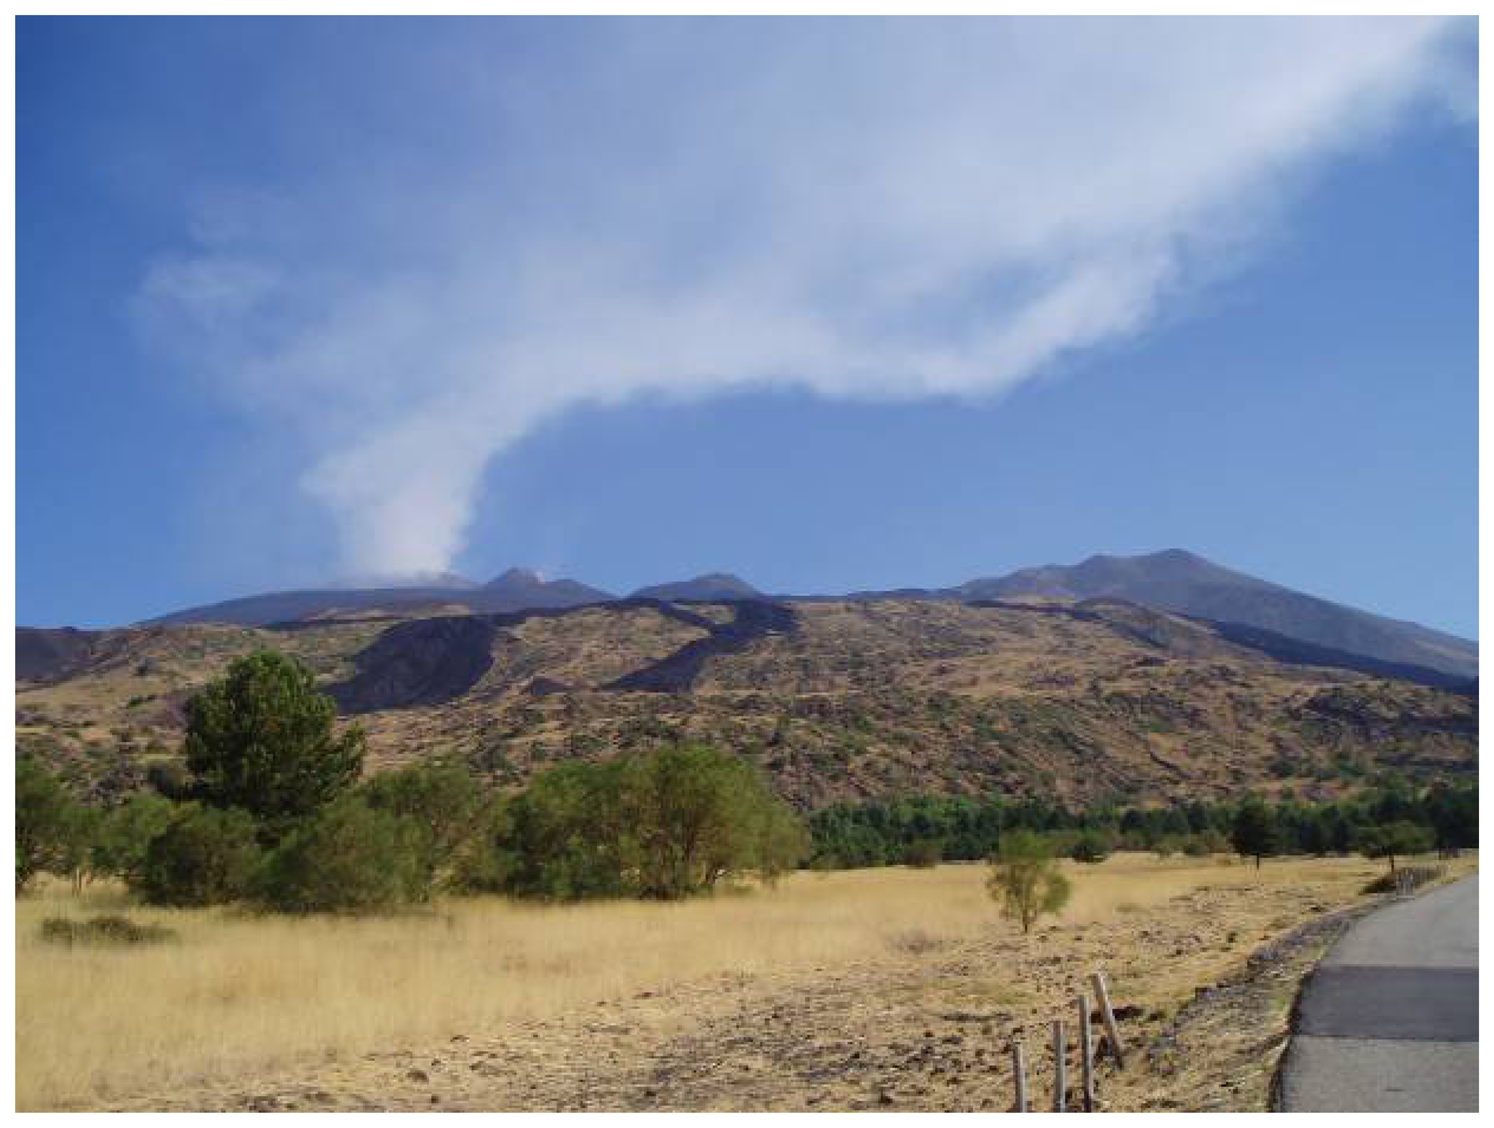
There is, therefore, considerable interest in the development and implementation of novel technologies for better monitoring volcanic activity, with a view to improving the accuracy of hazard assessments and eruption forewarnings. Of particular interest are sensors for measuring the chemical composition and emission rates of gases (species include H2O, CO2, SO2, HCl, HF, H2, S2, H2S, CO and SiF4) released by volcanoes, from magma to the atmosphere, both prior to and during eruptions; data which provide valuable information concerning the masses and motions of underground magmas. For instance, increases in the plume CO2/SO2 ratio have been observed prior to recent eruptions of Mt. Etna [Aiuppa et al., 2007], elevated CO2 fluxes before an eruption of Usu volcano, Japan [Hernández et al., 2001], and high SO2/HCl in advance of an explosion on Stromboli, Italy [Aiuppa et al., 2004]. Immediately prior to the 1991 eruption of Mt. Pinatubo, scientists observed a tenfold increase in SO2 emission rate, which in parallel with other data collected, precipitated a 80,000 person evacuation that saved many thousands of lives [Daag et al., 1996]. The non-eruptive plume released from Mt. Etna, the most prodigious, time averaged, volcanic gas emitter on Earth, is shown in Figure 1.
Volcanic gases also have important impacts upon Earth's radiation budget and atmospheric chemistry, in particular through the oxidation of SO2, to form sulphate aerosols, which reflect sunlight back to space and act as cloud condensation nuclei [Robock, 2000], thus increasing the planet's albedo and causing surface cooling. For instance, the 1991 eruption of Mt. Pinatubo reduced temperatures by ≈ 0.4 °C, completely offsetting, for a number of years thereafter, the anthropogenic Greenhouse effect [McCormick et al., 1995]; likewise the Tambora eruption caused the 1816 “Year without a summer”, leading to crop failures and food riots across Europe. Furthermore, some scientists believe that more pronounced prehistoric volcanism could have been responsible for biotic mass extinction events [e.g., Courtillot and Olson, 2007]. It is now imperative to improve our characterisation on these effects in order to properly deconvolve natural forcings, to better constrain anthropogenic causes of present day climate change.
The acidic volcanic gases are also of interest given their deleterious impacts upon ecosystems: either when diffused through soils on the flanks [Farrar et al., 1995], or wet or dry deposited from the downwind plume [Delmelle et al., 2002; Iwashita et al., 2006]. An extreme recent example of this was the 1783-4 eruption of Laki in Iceland [Thordarson et al., 1996], whose degassing severely fumigated pasturelands and fields, resulting in the starvation of a quarter of the island's population. Such plumes also pose major hazards to aviation; for instance a commercial Boeing 747 temporarily lost power in all four engines upon inadvertently flying through the plume of Redoubt volcano, Alaska during 1989. Whilst there was no loss of life, the ash and gas damage to the aircraft was estimated at $80 million [Casadevall, 1994].
In this article we review the ground based application of ground based ultraviolet (UV) remote sensing to the measurement of volcanic gases.
2. Ground based volcano remote sensing
Traditionally volcanic gases have been measured by collecting samples directly from active craters and fumaroles and transferring them to laboratories and subjecting them to various analytical procedures [e.g., Symonds et al., 1994]. Whilst this approach provides the most detailed possible geochemical information, it can pose considerable dangers to monitoring personnel, therefore volcanologists have increasingly turned to ground based remote sensing over the last decades, whereby gas measurements can be made with the observers safely decoupled (at distances ≥ 1 km) from the target. Remote sensing provides the further advantages over direct sampling that real time data analysis is possible, contamination issues associated with the samples' collection and analysis are avoided, and the measurements are integrated over the entire plume, rather than focused on discrete fumaroles (whose gas compositions can be highly heterogeneous), thereby enabling single measurement capture of the volcano's bulk degassing geochemistry.
Remote sensing operates on the principle, highlighted in Figure 2, of measuring light, from the background sky, direct sun, or an artificial lamp source, which has transited, and been partially absorbed by, the volcanic gas plume. By taking the ratio of a spectrum measured with {I(λ)} to that without the gas in the optical path {Io(λ)} and applying a logarithm, the absorbance caused by the plume is obtained, after Beer's law:
As each plume gas species characteristically absorbs at defined wavelengths, according to its unique molecular structure, analysis of the locations of the spectral absorptions, and their magnitudes, provides information on which gases are present, and their concentrations, respectively. In practice, this is achieved, after (1), by fitting the absorbance spectrum with absorption cross sections σ(λ) of the species of interest in order to determine the concentrations N × d, which represent the mean number density of molecules in the plume N, multiplied by the plume thickness d.
Volcanic plumes can also be remotely sensed from space. This began in 1982, when an anomalously high “ozone” signal was observed over Mexico following the eruption of El Chichón volcano, by the Total Ozone Mapping Spectrometer [Krueger, 1983]. It was soon realised that this corresponded to absorption of radiation by plume SO2, in the ozone UV bands; subsequently, this sensor and others have been routinely used to identify and track volcanic clouds, in order to issue warnings to aviation authorities. The primary scientific contribution of satellite remote sensing has been towards quantifying the climatic impacts of large explosive paroxysms, which eject material to the stratosphere [e.g., Bluth et al., 1993] (e.g., Mt. Pinatubo), due to the sensors' broad spatial coverage, yet relatively high detection limits. Recently, however, newer more sensitive instruments have been flown, such as the Ozone Monitoring Instrument, which are capable of imaging non-eruptive plumes, degassed passively to the troposphere, thereby greatly broadening the utility of satellite borne volcanic surveillance [e.g., Krotkov et al., 2006]. Notwithstanding these developments, ground based spectroscopy, with its lower detection limits, and greater spatial and temporal resolution, still provides the optimal means of remotely sensing degassing under all but the most cataclysmic phases of eruptions, with a view to improving our understanding of volcanic dynamics and the capacity to forecast eruptions; hence the focus of this article.
3. Ultraviolet spectroscopy of volcanic plumes
The vast majority of ground based remotely sensed plume observations concern SO2, the third most abundant volcanogenic gas, which can be readily resolved, via its strong UV absorption features (≈ 300 nm), above this species' low ambient atmospheric concentrations. Observations of SO2 flux have been made for over thirty years with correlation spectrometers [e.g., Stoiber et al., 1983], which have been recently upgraded with compact and inexpensive (200g; ≈ €3000) USB powered CCD detector array based dispersive spectrometers (e.g., the Ocean Optics Inc. USB2000) [McGonigle et al., 2002; Galle et al., 2003]. Measurements are performed by traversing beneath the volcanic plume, in a car, on foot, by plane or boat (Figure 3a), with the instrumentation shown in Figure 3b. The USB2000 collects zenith skylight via a telescope and optical fibre; the spectra, georeferenced using data from a handheld GPS receiver, are captured to a laptop computer and processed in real time.
The spectra collected underneath the plume are evaluated for their gas concentrations according to (1), with respect to {Io(λ)}, which is recorded at the start of the traverse before the plume is encountered. As a slight addition to the generic procedure outlined above, the absorbance spectrum is high pass filtered and fitted with a high pass filtered version of the SO2 absorption cross section. This, so called differential optical absorption spectroscopy routine eliminates broadband attenuation caused by plume aerosols, and isolates the fine spectral resolution structure of the SO2 absorption. Each concentration is multiplied by the distance traversed during that spectrum's acquisition and analysis, projected onto a plane perpendicular to the plume transport direction. These products are then summed over the plume width and multiplied by the plume transport speed to output the SO2 flux. All of this can be achieved with the purpose written software interface: volcanoSO2.exe [McGonigle, 2007] (Figure 4). An alternative spectral retrieval procedure, whereby the observed plume absorbance is fitted against those measured at the start of the traverse, with quartz SO2 cells of known concentrations, has also been developed [Horton et al., 2006].
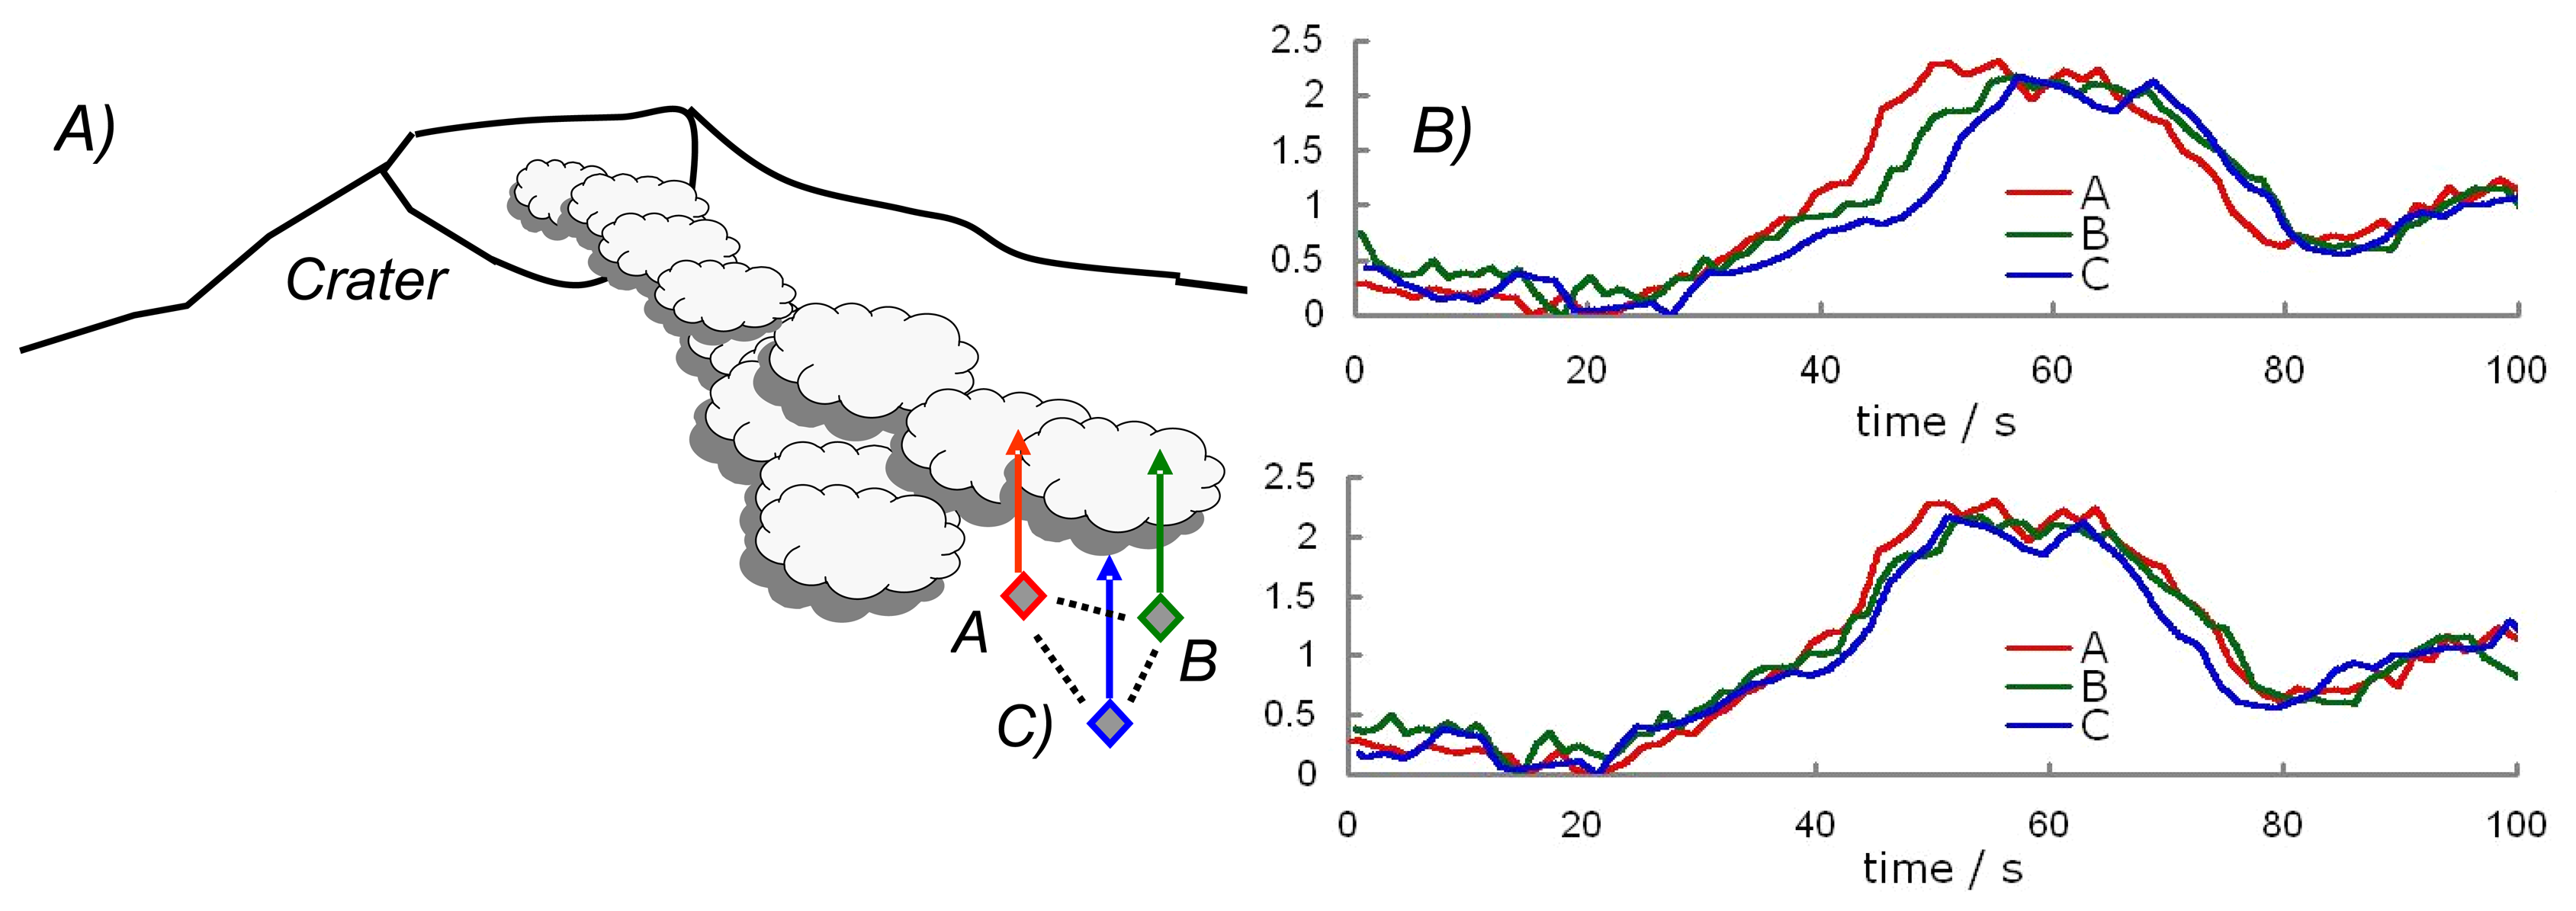
The plume speeds were traditionally assumed to equate to the output from crater rim anemometers; however these data may bear little resemblance to that of the plume overhead the traverse location, due to the complex wind fields surrounding volcanoes, thus introducing considerable error into the flux computations. This problem has been tackled recently by installing two or three under plume spectrometers, each recording SO2 time series, at different distances downwind of the source at the point of interest e.g., on the traverse route [McGonigle et al., 2005; Williams-Jones et al., 2006] (Figure 5a). These capture the longitudinal structure of the plume as it passes overhead (Figure 5b), caused by rapid variations (1 – 10s seconds timescale) in source strength, and the plume segregating into discrete parcels as it is advected downwind. By cross-correlating two such data series, to determine the temporal lag between them, and by dividing the inter-spectrometer distance by this, the component of the plume velocity projected onto the inter-spectrometer vector is determined, thus enabling considerably more accurate flux estimations than possible hitherto. The three spectrometer approach has the advantage over that with two units, that with two derived velocity components the plume velocity vector (e.g., magnitude and direction) can be determined directly; in the latter case the plume direction needs to be assumed, adding to the measurement uncertainty.
UV spectroscopy has been widely applied to volcanoes worldwide over the last decades in order to investigate how SO2 fluxes vary with activity, [e.g., Malinconico, 1979; Caltabiano et al., 1994; Daag et al., 1996; Sutton et al., 2001; Edmonds et al., 2003a], with heightened emissions observed during eruptions as degassing magma batches reach the surface. As activity subsides and the magma chamber is not replenished, the fluxes then dwindle, as occurred exponentially over an eight year period, following the 1980 eruption of Mt. St. Helens [McGee, 1992]. Pre-eruptive degassing depends on whether the volcano is open or closed conduit, e.g., whether the gases are free to escape to the atmosphere, or are blocked, for instance by an overlying rock carapace. In the former case observed fluxes can increase as magmas rise to depths at which pressures are no longer sufficient to confine the dissolved gases. In the latter case, low pre-eruptive fluxes are observed, as gases exsolve, but remain in the volcanic edifice, pressurising, likely leading to vent clearing explosion, as occurred during the St. Helens eruption.
Whilst SO2 fluxes in isolation have utility in the understanding and parameterisation of volcanic phenomena, these data are most fruitfully interpreted in parallel with other contemporaneously obtained geochemical and geophysical data [e.g., Watson et al., 2000], for instance, on Mt. Etna, where strong correlations between seismicity and gas emission rate have been observed [Leonardi et al., 2000]. Another example was a series of explosions of Galeras volcano, Colombia in 1993, one of which resulted in the loss of nine lives, and each were preceded by reduced SO2 fluxes and increasing “long period” seismic signals, analogous to the acoustic resonances formed in organ pipes. These observations were interpreted, after the fact, to indicate a sealing and ultimately explosive pressurisation of the system, perhaps caused by precipitation of dissolved minerals from hydrothermal systems in gas pathways to the surface [Fischer et al., 1994]. In the absence of corroborating data in such situations, low SO2 fluxes could be erroneously interpreted to indicate a waning in activity.
So SO2 fluxes can provide information on the masses of underground magmas, whether these are rising or falling, if they are passively losing their gases, or being recharged via fresh intrusions in advance of future eruptions, and whether systems are sealing, perhaps leading to explosions. One of the most intriguing results of these spectroscopic observations, however, is that volcanoes are capable of emitting prodigious quantities of SO2 with little or no associated lava eruption [e.g., Delgado-Granados et al., 2001]; one recent example is Miyakejima volcano in Japan, which released up to 54 kt day-1 during 2000 [Kazahaya et al., 2004], exceeding, momentarily, the previous time averaged emission for all the volcanoes on Earth. Such scenarios have demanded the development of descriptive models, such as one in which the majority of emissions are proposed to arise from a gas rich bubbly cupola atop the magma chamber, rather than from the erupted magma itself [Wallace, 2001].
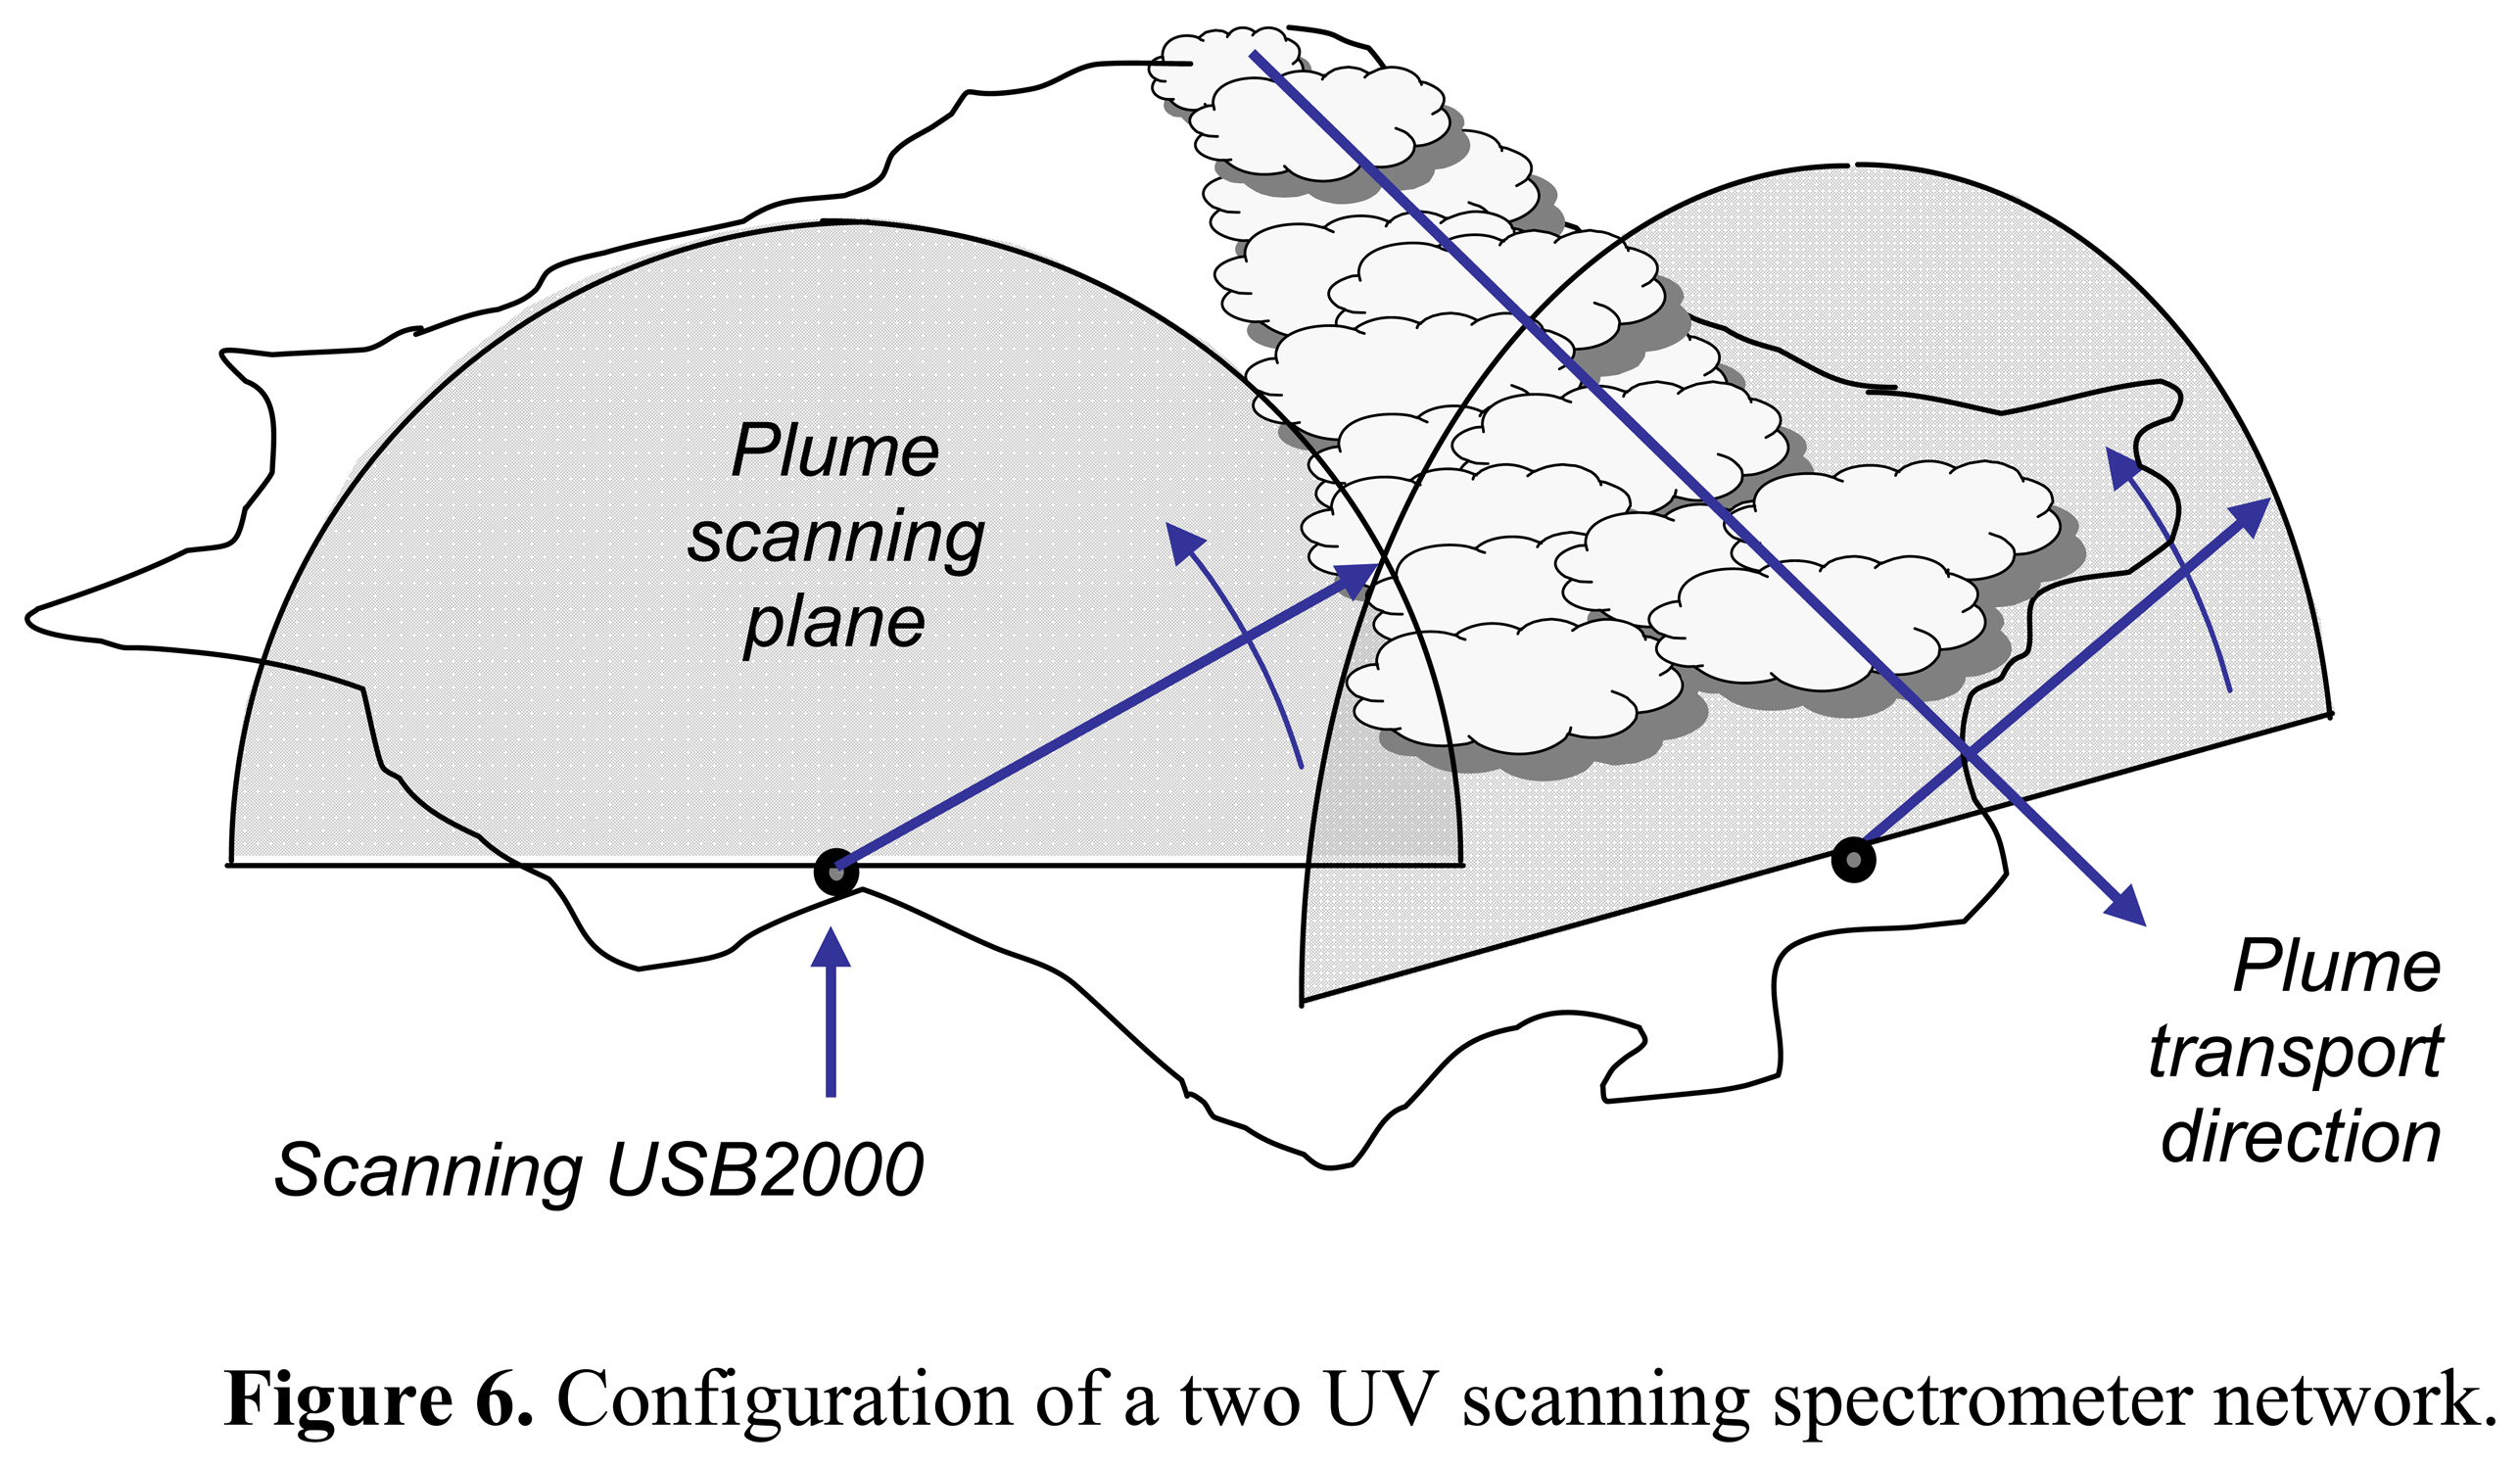
Traverse measurements are typically made at most a few times per day, due to the manual requirement to drive, fly or sail beneath the plume. However this time resolution is insufficient to capture many volcanic phenomena, and disallows non-aliased corroboration with volcanic geophysical streams, e.g., seismic and ground deformation data are normally acquired at least once per second, thus precluding the fullest scientific insights. In response a number of faster SO2 flux monitoring methodologies have been recently developed, such as that in which the plume is scanned from below from a fixed position [Edmonds et al., 2003b; McGonigle et al., 2003] (Figure 6). This is achieved by aligning the telescope horizontally, sub-plume and pointed towards the source, with light coupled into it via a turning mirror, mounted to a computer controlled stepper motor. As the mirror rotates, so too does the spectrometer's field of view, achieving scanning in a plane perpendicular to the plume direction. For routine observations, a network of scanners is required, in order to capture the plume under all wind direction conditions; furthermore, tomographic analysis of those data reveals the plume height, which is a required parameter for the flux computation, when scanning. Such installations have now been made on a number of volcanoes worldwide, providing data every few minutes, and fresh perspectives into degassing driven volcano conduit dynamics, for instance concerning the transition between explosive and effusive behaviour on Soufrière Hills volcano, Montserrat [Edmonds et al., 2007].
Various plume imaging techniques have been developed, in addition, for instance, a two dimensional CCD array based unit, for transverse plume observations, with the first dimension capturing spectra, each corresponding to a vertical segment of the plume, as indexed by the second array dimension. By then “pushbroom” scanning in a horizontal plane, 2D images are generated, with a time resolution of minutes, as reported by Bobrowski et al. [2006]; this approach could be of great utility in capturing the spatio-temporal distribution of ultraviolet absorbing species in volcanic plumes, with a view to better understanding chemical processes occurring therein. Ultraviolet cameras have also been used to capture plume SO2 images [Bluth et al., 2007; Mori and Burton, 2006]. These data can then be used to determine fluxes with frequencies of order 1 Hz, or even faster, with the plume transport speed determined by cross-correlating concentration time series from two pixels within the image, aligned along the vector of plume motion, by analogy to the multiple spectrometer plume speed method detailed above. Whilst this approach is spectrally broadband, thus provides less accurate concentrations than those achievable with the USB2000, its time resolution is completely unprecedented, auguring the possibility of the cameras becoming a routinely used volcano monitoring tool in the future.
Ground based remotely sensed SO2 flux data, in parallel with satellite observations have been used to derive estimates for total global volcanogenic degassing of some 20 Tg year-1 [e.g. Stoiber et al., 1987; Andres and Kasgnoc, 1998; Halmer et al., 2002], as well as fluxes from individual volcanic arcs, which when compared with inputs from the subducting slab, enable the question of gas mass balance at convergent boundaries to be addressed [e.g., Mather et al., 2006]. Whilst this flux is only around a fifth of the anthropogenic value, the sulphate loading of the atmosphere may be comparable from both sources, as volcanoes entrain their plume at higher altitudes, where the aerosol lifetimes are considerably longer than at the surface [Graf et al., 1997], indicating the very important role of volcanism in offsetting the anthropogenic greenhouse effect. When combined with other volcanic gas data (e.g., X/SO2 concentration ratios for species X of interest) the fluxes of other volcanogenic emissions (e.g., Br and I [Aiuppa et al., 2005a]; H2S [Aiuppa et al., 2005b]; HCl and HF [Halmer et al., 2002]; CO2 [Aiuppa et al., 2006] and Hg [Bagnato et al., 2007]) have also been determined, thus quantifying their role in atmospheric chemistry and in global geochemical cycles.
It is of course also possible to directly remotely sense gases other than SO2 in volcanic plumes with UV spectroscopy; so far the species: H2S [O'Dwyer et al., 2003], NO2 [Oppenheimer et al., 2005], BrO [Bobrowski et al., 2003; Oppenheimer et al., 2006a], ClO [Lee et al., 2005] and OClO [Bobrowski et al., 2007] have been detected, in addition. The latter observations are of particular significance, as those species are implicated in halogen catalysed ozone destruction reactions, implying that these plumes could exert important controls upon the troposphere's oxidation capacity [Gerlach, 2004]. The ability to remotely measure the plume concentration ratios of multiple volcanic gas species is also very important in unravelling subterranean volcanic processes, and whilst UV spectroscopy has contributed somewhat in this regard, the real breakthroughs have come through Fourier transform infrared (FTIR) spectroscopy [e.g., Notsu et al., 1993; Francis et al., 1998], the second most commonly used spectroscopic plume monitoring technique, which is often employed in tandem with volcanic SO2 monitoring. FTIR can measure ratios such as SO2/HCl; as these species exsolve from magma at different depths, these data provide information on the depth from which the emitted gas is sourced. This additional information is very useful in developing models describing volcanic behaviour and has been recently applied with great effect to better understanding fire fountaining [Allard et al., 2005], and strombolian explosive activity [Oppenheimer et al., 2006b; Burton et al., 2007].
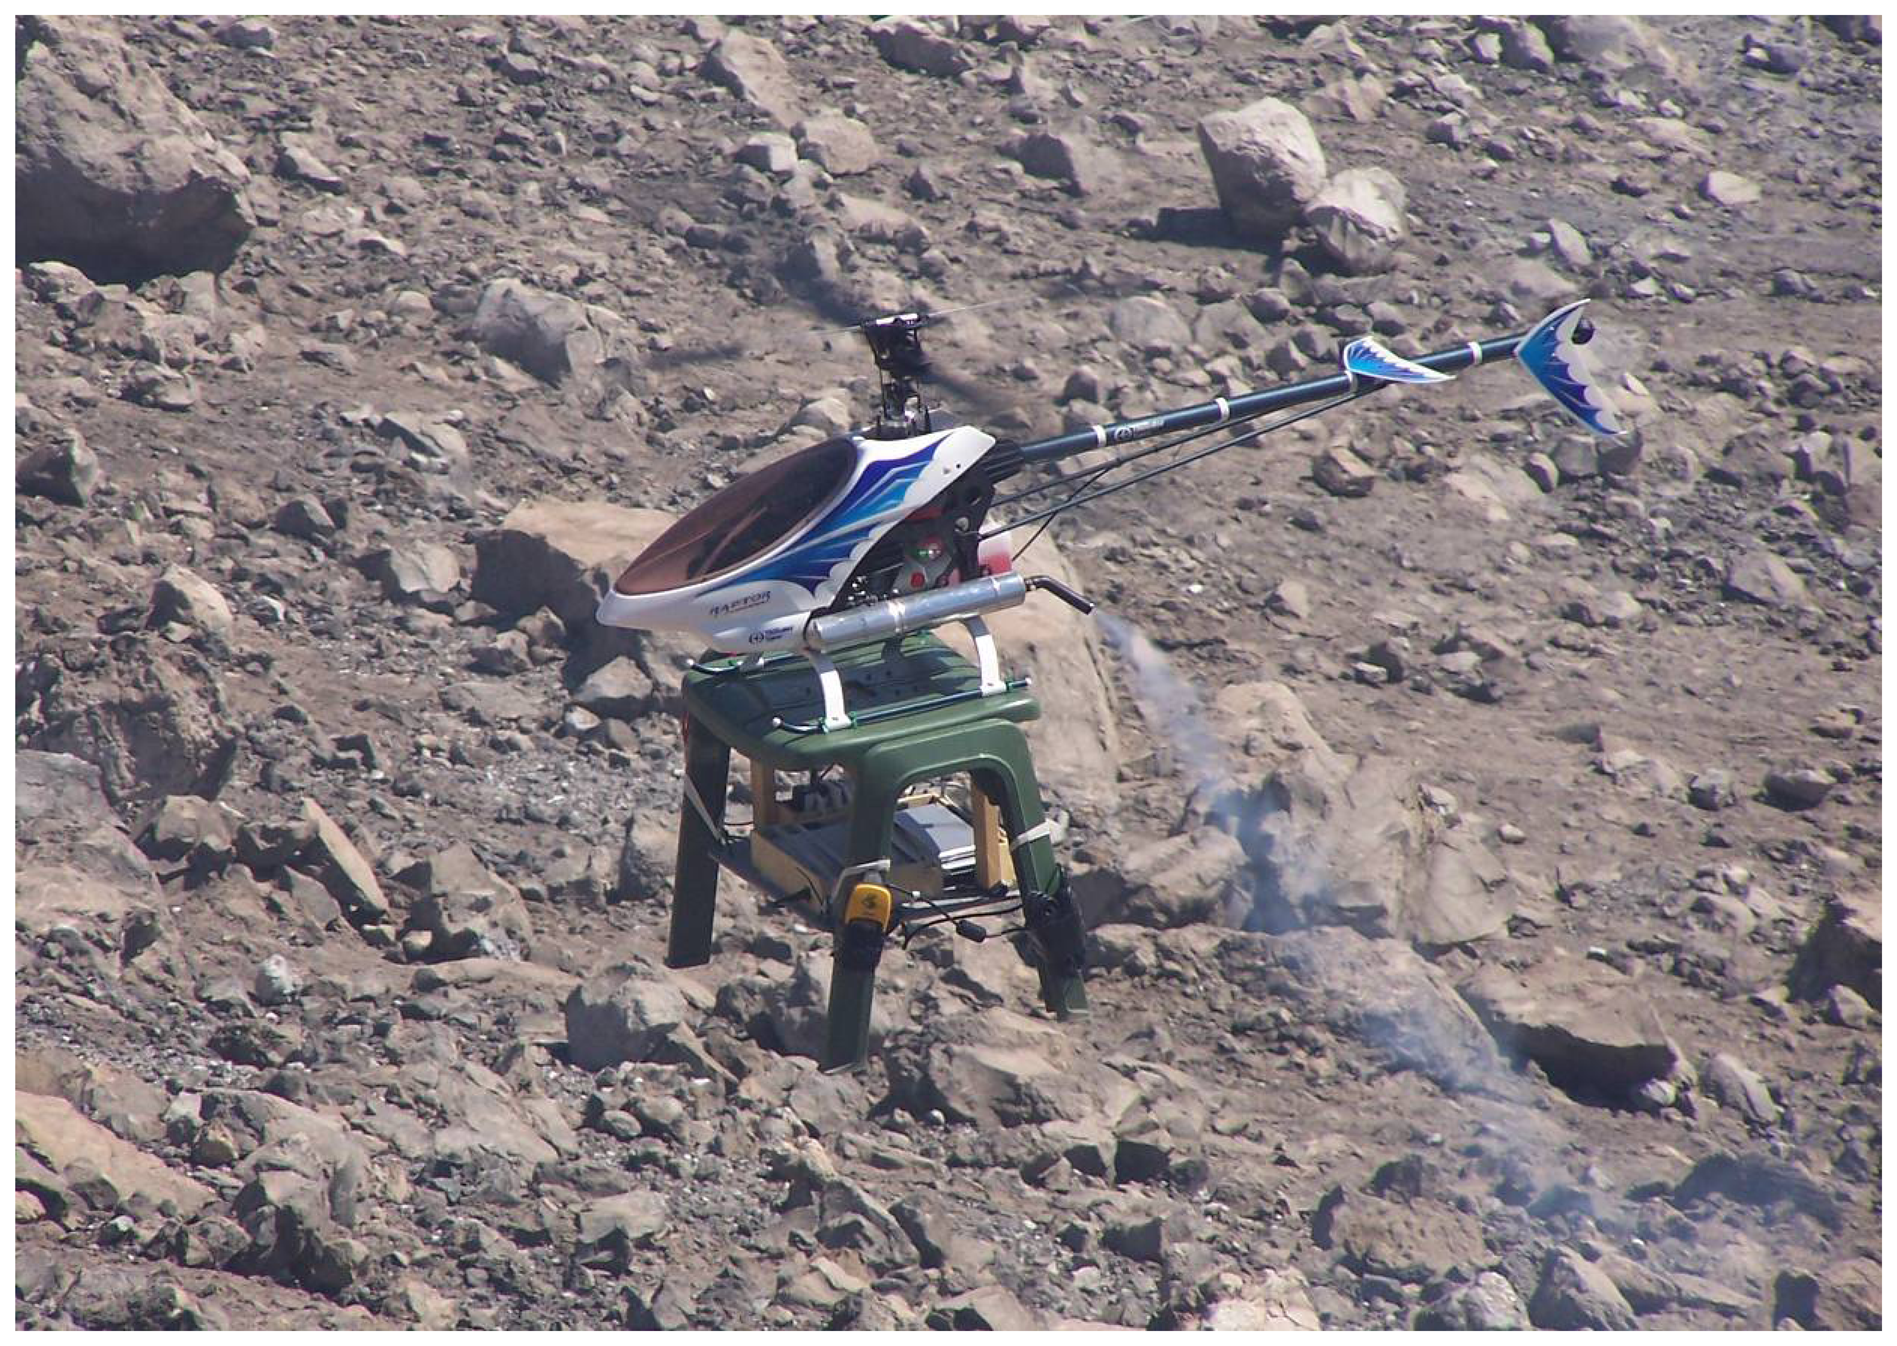
Whilst attention has focused upon SO2 flux measurements, in view of the ease with which this plume species can be spectroscopically resolved, CO2, which is less soluble in intervening hydrothermal systems, and exsolves from magma at greater depths, could provide far more profound and accurate proxies for magmatic conditions. As such, considerable efforts have been made over the last decades, to devise a remote sensing technique suitable for monitoring this species' emission rates. This has been to no avail, however, as passive vertically pointing spectroscopy attempts to resolve the plume contribution above the background atmospheric concentrations of the species of interest, integrated over the whole atmospheric height; in the case of CO2, the very high ambient levels simply drown out the volcanic input. Of course this task could be achieved in principle with active spectroscopy, by employing a laser light source, e.g., LIDAR; such systems are likely to be very expensive, however (€100,000s). A less expensive, recently proposed quasi-remote sensing alternative is to fly an unmanned aerial vehicle (UAV), carrying an infrared CO2 analyser and an electrochemical SO2 sensor, into the plume, to make in-situ CO2/SO2 observations (instrumentation described in [Aiuppa et al., 2005c; Shinohara et al., 2005]). The UAV then traverses beneath the plume to determine the SO2 flux; multiplying these data together yields the CO2 emission rate. This concept has been proven with a relatively modest manually flown helicopter [McGonigle et al., 2008] (Figure 7); in order to become a routinely useful tool, however, larger UAVs with greater ranges, and autonomous flight capability, would be required, to enable achievement of take off and landing at far safer (10s of km) distances from the source.
4. Concluding remarks
Ultraviolet spectroscopic observations of volcanic SO2 fluxes have formed the mainstay of remotely sensed volcanic gas geochemistry over the last decades. This approach benefits greatly from the use of scattered skylight as the radiation source, making alignment trivial; by contrast FTIR spectroscopy requires a direct IR illumination source, such as the sun, an artificial lamp or a hot rock/lava source. The equipment is inexpensive, in addition, with the UV spectrometer and all required auxiliary components costing only ≈ €6,000, in contrast to the FTIR instrumentation (> €40,000) which is also considerably bulkier, and whose retrievals are more complex. Notwithstanding the utility of these data in better understanding volcanoes and their impacts upon the atmosphere, this approach is not a panacea, however. For instance, SO2 can be dissolved in underground ground waters, masking the true magmatic source signatures, in which case additional geophysical or geochemical (e.g., FTIR) data are required for correct interpretations of activity, pointing to the importance of multi-parameter analysis in volcanology.
Whilst some progress has been made in tackling the major source of error in the SO2 flux measurements, namely the plume transport speed determination, there remain two other, potentially significant uncertainties which have received relatively little attention, hitherto. The first of these concerns scatter, which can result in light from outside the spectrometer's field of view being deflected into it between the plume and the sensor, resulting in concentration under-measurement, or multiple scattering within the plume, which defies the assumption implicit in traverse based measurements, that the light passes straight through the plume in a single downward vector, resulting in concentration overestimation. Whilst large ash particles appear to have little impact upon retrieved SO2 concentrations up to a degree of optical extinction [Andres and Schmit, 2001], the scattering due to plume aerosols and atmospheric constituents introduces presently poorly quantified, but potentially large errors into the measurements [Weibring et al., 1998; Mori et al., 2006]. The second issue concerns the possibility of a significant proportion of SO2 in the volcanic plume oxidising to form sulphate aerosol, in which case data collected multiple kms from the source will constitute underestimates of the true source strength. Previous attempts to constrain this loss rate by measuring, for instance SO2 fluxes at different distances downwind of the source, have resulted in markedly differing results ranging between <1% and >99% per hour [Oppenheimer et al., 1996; McGonigle et al., 2004], over a variety of volcanic settings, leaving considerable uncertainty concerning the magnitude of this error and how it can be quantified as a function of meteorological conditions.
Acknowledgments
AM is supported by a RCUK Academic Fellowship. We thank Nicole Bobrowski, and an anonymous referee for their helpful reviews of this paper.
References and Notes
- Aiuppa, A.; Federico, C.; Giudice, G.; Gurrieri, S. Anomalous magmatic degassing prior to the 5th April 2003 paroxysm on Stromboli. Geophys. Res. Lett. 2004, 31, L14607. [Google Scholar]
- Aiuppa, A.; Federico, C.; Franco, A.; Giudice, G.; Gurrieri, S.; Inguaggiato, S.; Liuzzo, M.; McGonigle, A.J.S.; Valenza, M. Emission of bromine and iodine from Mount Etna volcano. Geochem. Geophys. Geosyst. 2005a, 6, Q08008. [Google Scholar]
- Aiuppa, A.; Inguaggiato, S.; McGonigle, A.J.S.; O'Dwyer, M.; Oppenheimer, C.; Padgett, M.J.; Rouwet, D.; Valenza, M. H2S fluxes from Mt. Etna, Stromboli, and Vulcano (Italy) and implications for the sulfur budget at volcanoes. Geochim. Cosmochim. Acta 2005b, 69, 1861–1871. [Google Scholar]
- Aiuppa, A.; Federico, C.; Giudice, G.; Gurrieri, S. Chemical mapping of a fumarolic field: La Fossa Crater, Vulcano Island (Aeolian Islands, Italy). Geophys. Res. Lett. 2005c, 32, L13309. [Google Scholar]
- Aiuppa, A.; Federico, C.; Giudice, G.; Gurrieri, S.; Liuzzo, M.; Shinohara, H.; Favara, R.; Valenza, M. Rates of carbon dioxide plume degassing from Mount Etna volcano. J. Geophys. Res. 2006, 111, B09207. [Google Scholar]
- Aiuppa, A.; Moretti, R.; Federico, C.; Giudice, G.; Gurrieri, S.; Liuzzo, M.; Papale, P.; Shinohara, H.; Valenza, M. Forecasting Etna eruptions by real-time observation of volcanic gas composition. Geology 2007, 35, 1115–1118. [Google Scholar]
- Allard, P.; Burton, M.; Muré, F. Spectroscopic evidence for a lava fountain driven by previously accumulated magmatic gas. Nature 2005, 433, 407–410. [Google Scholar]
- Andres, R.J.; Kasgnoc, A.D. A time averaged inventory of subaerial volcanic sulfur emissions. J. Geophys. Res. 1998, 103(D19), 25251–25261. [Google Scholar]
- Andres, R.J.; Schmid, J.W. The effects of volcanic ash on COSPEC measurements. J. Volcanol. Geotherm Res. 2001, 108, 237–244. [Google Scholar]
- Bagnato, E.; Aiuppa, A.; Parello, F.; Calabrese, C.; D'Alessandro, W.; Mather, T.A.; McGonigle, A.J.S.; Pyle, D.M.; Wängberg, I. Degassing of gaseous (elemental and reactive) and particulate mercury from Mount Etna volcano (Southern Italy). Atmos. Environ. 2007, 41, 7377–7388. [Google Scholar]
- Bluth, G.J.S.; Schnetzler, C.C.; Krueger, A.J.; Walter, L.S. The contribution of explosive volcanism to global atmospheric sulfur-dioxide concentrations. Nature 1993, 366, 327–329. [Google Scholar]
- Bluth, G.J.S.; Shannon, J.M.; Watson, I.M.; Prata, A.J.; Realmuto, V.J. Development of an ultraviolet digital camera for volcanic SO2 imaging. J. Volcanol. Geotherm. Res. 2007, 161, 47–56. [Google Scholar]
- Bobrowski, N.; Hönninger, G.; Galle, B.; Platt, U. Detection of bromine monoxide in a volcanic plume. Nature 2003, 423, 273–276. [Google Scholar]
- Bobrowski, N.; Hönninger; Lohberger, F.; Platt, U. IDOAS: A new monitoring technique to study the 2D distribution of volcanic gas emissions. J. Volcanol. Geotherm. Res. 2006, 150, 329–338. [Google Scholar]
- Bobrowski, N.; von Glasow, R.; Aiuppa, A.; Inguaggiato, S.; Louban, I.; Ibrahim, O.W.; Platt, U. Reactive halogen chemistry in volcanic plumes. J. Geophys. Res. 2007, 112, D06311. [Google Scholar]
- Burton, M.; Allard, P.; Muré, F.; La Spina, A. Magmatic gas composition reveals the source depth of slug-driven strombolian explosive activity. Science 2007, 317, 227–230. [Google Scholar]
- Caltabiano, T.; Romano, R.; Budetta, G. SO2 flux measurements at Mount Etna (Sicily). J. Geophys. Res. 1984, 99. [Google Scholar]
- Casadevall, T.J. The 1989– 1990 eruption of Redoubt Volcano, Alaska, impacts on aircraft operations. J. Volcanol. Geotherm. Res. 1994, 62, 301–316. [Google Scholar]
- Courtillot, V.; Olson, P. Mantle plumes link magnetic superchrons to phanerozoic mass depletion events. Earth Planet Sci. Lett. 2007, 260, 495–504. [Google Scholar]
- Daag, A.S.; Tubianosa, B.S.; Newhall, C.G.; Tuňgol, N.M.; Javier, D.; Dolan, M.T.; Reyes, P.J.D.; Arboleda, R.A.; Martinez, M.L.; Regalado, T.M. Monitoring sulphur dioxide emission at Mount Pinatubo. In Fire and mud: eruptions and lahars of Mount Pinatubo Philippines; Newhall, C.G., Punongbayan, R.S., Eds.; University of Washington Press: Seattle, 1996; pp. 409–414. [Google Scholar]
- Delgado-Granados, H.; Cárdenas González, L.; Piedad Sánchez, N. Sulphur dioxide emissions from Popocatépetl volcano (Mexico): case study of a high-emission rate, passively degassing erupting volcano. J. Volcanol. Geotherm. Res. 2001, 108, 107–120. [Google Scholar]
- Delmelle, P.; Stix, J.; Baxter, P.J.; Garcia-Alvarez, J.; Barquero, J. Atmospheric dispersion, environmental effects and potential health hazard associated with the low-altitude gas plume of Masaya volcano, Nicaragua. Bull. Volcanol. 2002, 64, 423–434. [Google Scholar]
- Edmonds, M.; Oppenheimer, C.; Pyle, D.M.; Herd, R.A.; Thompson, G. SO2 emissions from Soufrière Hills volcano and their relationship to conduit permeability, hydrothermal interaction and degassing regime. J. Volcanol. Geotherm. Res. 2003a, 124, 23–43. [Google Scholar]
- Edmonds, M.; Herd, R.A.; Galle, B.; Oppenheimer, C.M. Automated, high time-resolution measurements of SO2 flux at Soufrière Hills Volcano, Montserrat. Bull. Volcanol. 2003b, 65, 578–586. [Google Scholar]
- Edmonds, M.; Herd, R.A. A volcanic degassing event at the explosive-effusive transition. Geophys. Res. Lett. 2007, 34, L21310. [Google Scholar]
- Farrar, C.D.; Sorey, M.L.; Evans, W.C.; Howle, J.F.; Kerr, B.D.; Kennedy, B.M.; King, C.Y.; Southon, J.R. Forest-killing diffuse CO2 emission at Mammoth Mountain as a sign of magmatic unrest. Nature 1995, 376, 675–678. [Google Scholar]
- Fischer, T.P.; Morrissey, M.M.; Calvache, V.M.L.; Gòmez, M.D.; Torres, C.R.; Stix, J.; Williams, S.N. Correlations between SO2 flux and long period seismicity at Galeras volcano. Nature 1994, 368, 135–137. [Google Scholar]
- Francis, P.; Burton, M.R.; Oppenheimer, C. Remote measurements of volcanic gas compositions by solar occultation spectroscopy. Nature 1998, 396, 567–570. [Google Scholar]
- Galle, B.; Oppenheimer, C.; Geyer, A.; McGonigle, A.J.S.; Edmonds, M.; Horrocks, L.A. A miniaturised UV spectrometer for remote sensing of SO2 fluxes: a new tool for volcano surveillance. J. Volcanol. Geotherm. Res. 2003, 119, 241–254. [Google Scholar]
- Gerlach, T.M. Volcanic sources of tropospheric ozone-depleting trace gases. Geochem. Geophys. Geosyst. 2004, 5, Q09007. [Google Scholar]
- Graf, H.F.; Feichter, J.; Langmann, B. Volcanic sulfur emissions: estimates of source strength and its contribution to the global sulfate distribution. J. Geophys. Res. 1997, 102(D9), 10727–10738. [Google Scholar]
- Halmer, M.M.; Schmincke, H.U.; Graf, H.F. The annual volcanic as input to the atmosphere, in particular into the stratosphere: a global data set for the past 100 years. 2002, 115, 511–528. [Google Scholar]
- Hernández, P.A.; Notsu, K.; Salazar, J.M.; Mori, T.; Natale, G.; Okada, H.; Virgili, G.; Shimoike, Y.; Sato, M.; Pérez, N.M. Carbon dioxide degassing by advective flow from Usu volcano, Japan. Science 2001, 292, 83–86. [Google Scholar]
- Horton, K.A.; Williams-Jones, G.; Garbeil, H.; Elias, T.; Sutton, A.J.; Mouginis-Mark, P.; Porter, J.N.; Clegg, S. Real-time measurement of volcanic SO2 emissions: validation of a new UV correlation spectrometer (FLYSPEC). Bull. Volcanol. 2006, 68, 323–327. [Google Scholar]
- Iwashita, K.; Asaka, T.; Nishikawa, H.; Kondoh, T.; Tahara, T. Vegetation biomass change of the Bosoh Peninsula Impacted by the volcano fumes from the Miyakejima. Advances in Space Research 2006, 37, 734–740. [Google Scholar]
- Kazahaya, K.; Shinohara, H.; Uto, K.; Odai, M.; Nalkahori, Y.; Mori, H.; Iino, H.; Miyashita, M.; Hirabayashi, J. Gigantic SO2 emission from Miyakejima volcano, Japan, caused by caldera collapse. Geology 2004, 32, 425–428. [Google Scholar]
- Krotkov, N.A.; Carn, S.A.; Krueger, A.J.; Bhartia, P.K.; Yang, K. Band residual difference algorithm for retrieval of SO2 from the aura Ozone Monitoring Instrument (OMI). IEEE Trans. Geosci. Remote Sens. 2006, 44, 1259–1266. [Google Scholar]
- Krueger, A.J. Sighting of El Chichón sulphur dioxide clouds with the Nimbus 7 Total Ozone Mapping Spectrometer Science. Science 1983, 220, 1377–1379. [Google Scholar]
- Lee, C.; Kim, Y.J.; Tanimoto, H.; Bobrowski, N.; Platt, U.; Mori, T.; Yamamoto, K.; Hong, C.S. High ClO and ozone depletion observed in the plume of Sakurajima volcano, Japan. Geophys. Res. Lett. 2005, 32, L21809. [Google Scholar]
- Leonardi, S.; Gresta, S.; Mulargia, F. Searching for a significant correlation between volcanic tremor amplitude and SO2 emissions at Mount Etna volcano, Sicily. Geophys. J. Int. 2000, 141, 832–834. [Google Scholar]
- Malinconico, L.L. Fluctuations in SO2 emission during recent eruptions of Etna. Nature 1979, 278, 43–45. [Google Scholar]
- Mather, T.A.; Pyle, D.M.; Tsanev, V.I.; McGonigle, A.J.S.; Oppenheimer, C.; Allen, A.G. A reassessment of current volcanic emissions from the Central American arc with specific examples from Nicaragua. J. Volcanol. Geotherm. Res. 2006, 149, 297–311. [Google Scholar]
- McCormick, M.P.; Thomason, L.W.; Trepte, C.R. Atmospheric effects of the Mt. Pinatubo eruption. Nature 1995, 373, 399–404. [Google Scholar]
- McGee, K.A. The structure, dynamics and chemical composition of non-eruptive plumes from Mt. St. Helens, 1980-88. J. Volcanol. Geotherm. Res. 1992, 51, 269–282. [Google Scholar]
- McGonigle, A.J.S.; Oppenheimer, C.; Galle, B.; Mather, T.A.; Pyle, D.M. Walking traverse and scanning DOAS measurements of volcanic gas emission rates. Geophys. Res. Lett. 2002, 29(20), 1985. [Google Scholar]
- McGonigle, A.J.S.; Oppenheimer, C.; Hayes, A.R.; Galle, B.; Edmonds, M.; Caltabiano, T.; Salerno, G.; Burton, M.; Mather, T. A. Sulphur dioxide flux measurements at Mount Etna, Vulcano and Stromboli measured with an automated scanning static ultraviolet spectrometer. J. Geophys. Res. 2003, 108(B9), 2455. [Google Scholar]
- McGonigle, A.J.S.; Delmelle, P.; Oppenheimer, C.; Tsanev, V.I.; Delfosse, T.; Williams-Jones, G.; Horton, K.; Mather, T.A. SO2 depletion in tropospheric volcanic plumes. Geophys. Res. Lett. 2004, 31, L13201. [Google Scholar]
- McGonigle, A.J.S.; Hilton, D.R.; Fischer, T.P.; Oppenheimer, C. Plume velocity determination for volcanic SO2 flux measurements. Geophys. Res. Lett. 2005, 32, L11302. [Google Scholar]
- McGonigle, A.J.S. Measurement of volcanic SO2 fluxes with differential optical absorption spectroscopy. J. Volcanol. Geotherm. Res. 2007, 162, 111–122. [Google Scholar]
- McGonigle, A.J.S.; Aiuppa, A.; Giudice, G.; Tamburello, G.; Hodson, A.J.; Gurrieri, S. Unmanned aerial vehicle measurements of volcanic carbon dioxide fluxes. Geophys. Res. Lett. 2008, in press. [Google Scholar] [CrossRef]
- Mori, T.; Mori, T.; Kazahaya, K.; Ohwada, M.; Hirabayashi, J.; Yoshikawa, S. Effect of UV scattering on SO2 emission rate measurements. Geophys. Res. Lett. 2006, 33, L17315. [Google Scholar]
- Mori, T.; Burton, M. The SO2 camera: A simple, fast and cheap method for ground-based imaging of SO2 in volcanic plumes. Geophys. Res. Lett. 2006, 33, L24804. [Google Scholar]
- Notsu, K.; Mori, T.; Igarashi, G.; Tohjima, Y.; Wakita, H. Infrared spectral radiometer: A new tool for remote measurement of SO2 of volcanic gas. Geochemical Journal 1993, 27, 361–366. [Google Scholar]
- O'Dwyer, M.; Padgett, M.J.; McGonigle, A.J.S.; Oppenheimer, C.; Inguaggiato, S. Real-time measurement of volcanic H2S and SO2 concentrations by UV spectroscopy. Geophys. Res. Lett. 2003, 30(12), 1652. [Google Scholar]
- Oppenheimer, C.; Francis, P.; Stix, J. Depletion rates of sulfur dioxide in tropospheric volcanic plumes. Geophys. Res. Lett. 1998, 25, 2671–2674. [Google Scholar]
- Oppenheimer, C. Climatic, environmental and human consequences of the largest known historic eruption: Tambora volcano (Indonesia) 1815. Prog. Phys. Geogr. 2003, 27, 230–259. [Google Scholar]
- Oppenheimer, C.; Kyle, P.R.; Tsanev, V.I.; McGonigle, A.J.S.; Mather, T.A.; Sweeney, D. Mt. Erebus, the largest point source of NO2 in Antarctica. Atmos. Environ. 2005, 39, 6000–6006. [Google Scholar]
- Oppenheimer, C.; Tsanev, V.I.; Braban, C.F.; Cox, R.A.; Adams, J.W.; Aiuppa, A.; Bobrowski, N.; Delmelle, P.; Barclay, J.; McGonigle, A.J.S. BrO formation in volcanic plumes. Geochim. Cosmochim. Acta 2006a, 70, 2935–2941. [Google Scholar]
- Oppenheimer, C.; Bani, P.; Calkins, J.A.; Burton, M.R.; Sawyer, G.M. Rapid FTIR sensing of volcanic gases released by Strombolian explosions at Yasur volcano, Vanuatu. Appl. Phys. B 2006b, 85, 453–460. [Google Scholar]
- Robock, A. Volcanic eruptions and climate. Rev. Geophys. 2000, 38, 191–219. [Google Scholar]
- Shinohara, H. A new technique to estimate volcanic gas composition: plume measurements with a portable multi-sensor system. J. Volcanol. Geotherm. Res. 2005, 143, 319–333. [Google Scholar]
- Small, C.; Naumann, T. The global distribution of human population and recent volcanism. Environ. Hazards 2001, 3, 93–109. [Google Scholar]
- Stoiber, R.E.; Malinconico, L.L.; Williams, S.N. Use of the correlation spectrometer at volcanoes. In Forecasting Volcanic Events; Tazieff, H., Sabroux, J.C., Eds.; Elsevier: Amsterdam, 1983; pp. 425–444. [Google Scholar]
- Stoiber, R.E.; Williams, S.N.; Huebert, B. Annual contribution of sulfur-dioxide to the atmosphere by volcanos. J. Volcanol Geotherm. Res. 1987, 33, 1–8. [Google Scholar]
- Sutton, A.J.; Elias, T.; Gerlach, T.M.; Stokes, J.B. Implications for eruptive processes as indicated by sulfur dioxide emissions from Kilauea Volcano, Hawaii, 1979-1997. J. Volcanol. Geotherm. Res. 2001, 108, 283–302. [Google Scholar]
- Symonds, R.B.; Rose, W.I.; Bluth, G.J.S.; Gerlach, T.M. Volcanic gas studies—Methods, results, and applications. Rev. Mineral. 1994, 30, 1–66. [Google Scholar]
- Thordarson, T.; Self, S.; Oskarsson, N.; Hulsebosch, T. Sulfur, chlorine, and fluorine degassing and atmospheric loading by the 1783-1784 AD Laki (Skaftár fires) eruption in Iceland. Bull. Volcanol. 1996, 58, 205–225. [Google Scholar]
- Wallace, P.J. Volcanic SO2 emissions and the abundance and distribution of exsolved gas in magma bodies. J. Volcanol. Geotherm Res. 2001, 108, 85–106. [Google Scholar]
- Watson, I.M.; Oppenheimer, C.; Voight, B.; Francis, P.W.; Clarke, A.; Stix, J.; Miller, A.; Pyle, D.M.; Burton, M.R.; Young, S.R.; Norton, G.; Loughlin, S.; Darroux, B. MVO Staff The relationship between degassing and ground deformation at Soufrière Hills Volcano, Montserrat. J. Volcanol. Geotherm. Res. 2000, 98, 117–126. [Google Scholar]
- Weibring, P.; Edner, H.; Svanberg, S.; Cecchi, G.; Pantani, L.; Ferrara, R.; Caltabiano, T. Monitoring of volcanic sulphur dioxide emissions using differential absorption lidar (DIAL), differential optical absorption spectroscopy (DOAS) and correlation spectroscopy (COSPEC). Appl. Phys. B 1998, 67, 419–426. [Google Scholar]
- Williams-Jones, G.; Horton, K.; Elias, T.; Garbeil, H.; Mouginis-Mark, P.J.; Sutton, A.J.; Harris, A.J.L. Accurately measuring volcanic plume velocity with multiple UV spectrometers. Bull. Volcanol. 2006, 68, 328–332. [Google Scholar]
- Witham, C.S. Volcanic disasters and incidents: A new database. J. Volcanol. Geotherm. Res. 2005, 148, 191–233. [Google Scholar]
Figure 1.
Mt. Etna's gas plume.

Figure 2.
Principle of spectroscopic remote sensing. Spectra are collected both with and without the volcanic gas plume in the optical path. Identification of the wavelengths at which absorption occurs, and the depths of these features, provides information on which plume gases are present, and in what abundances, respectively.
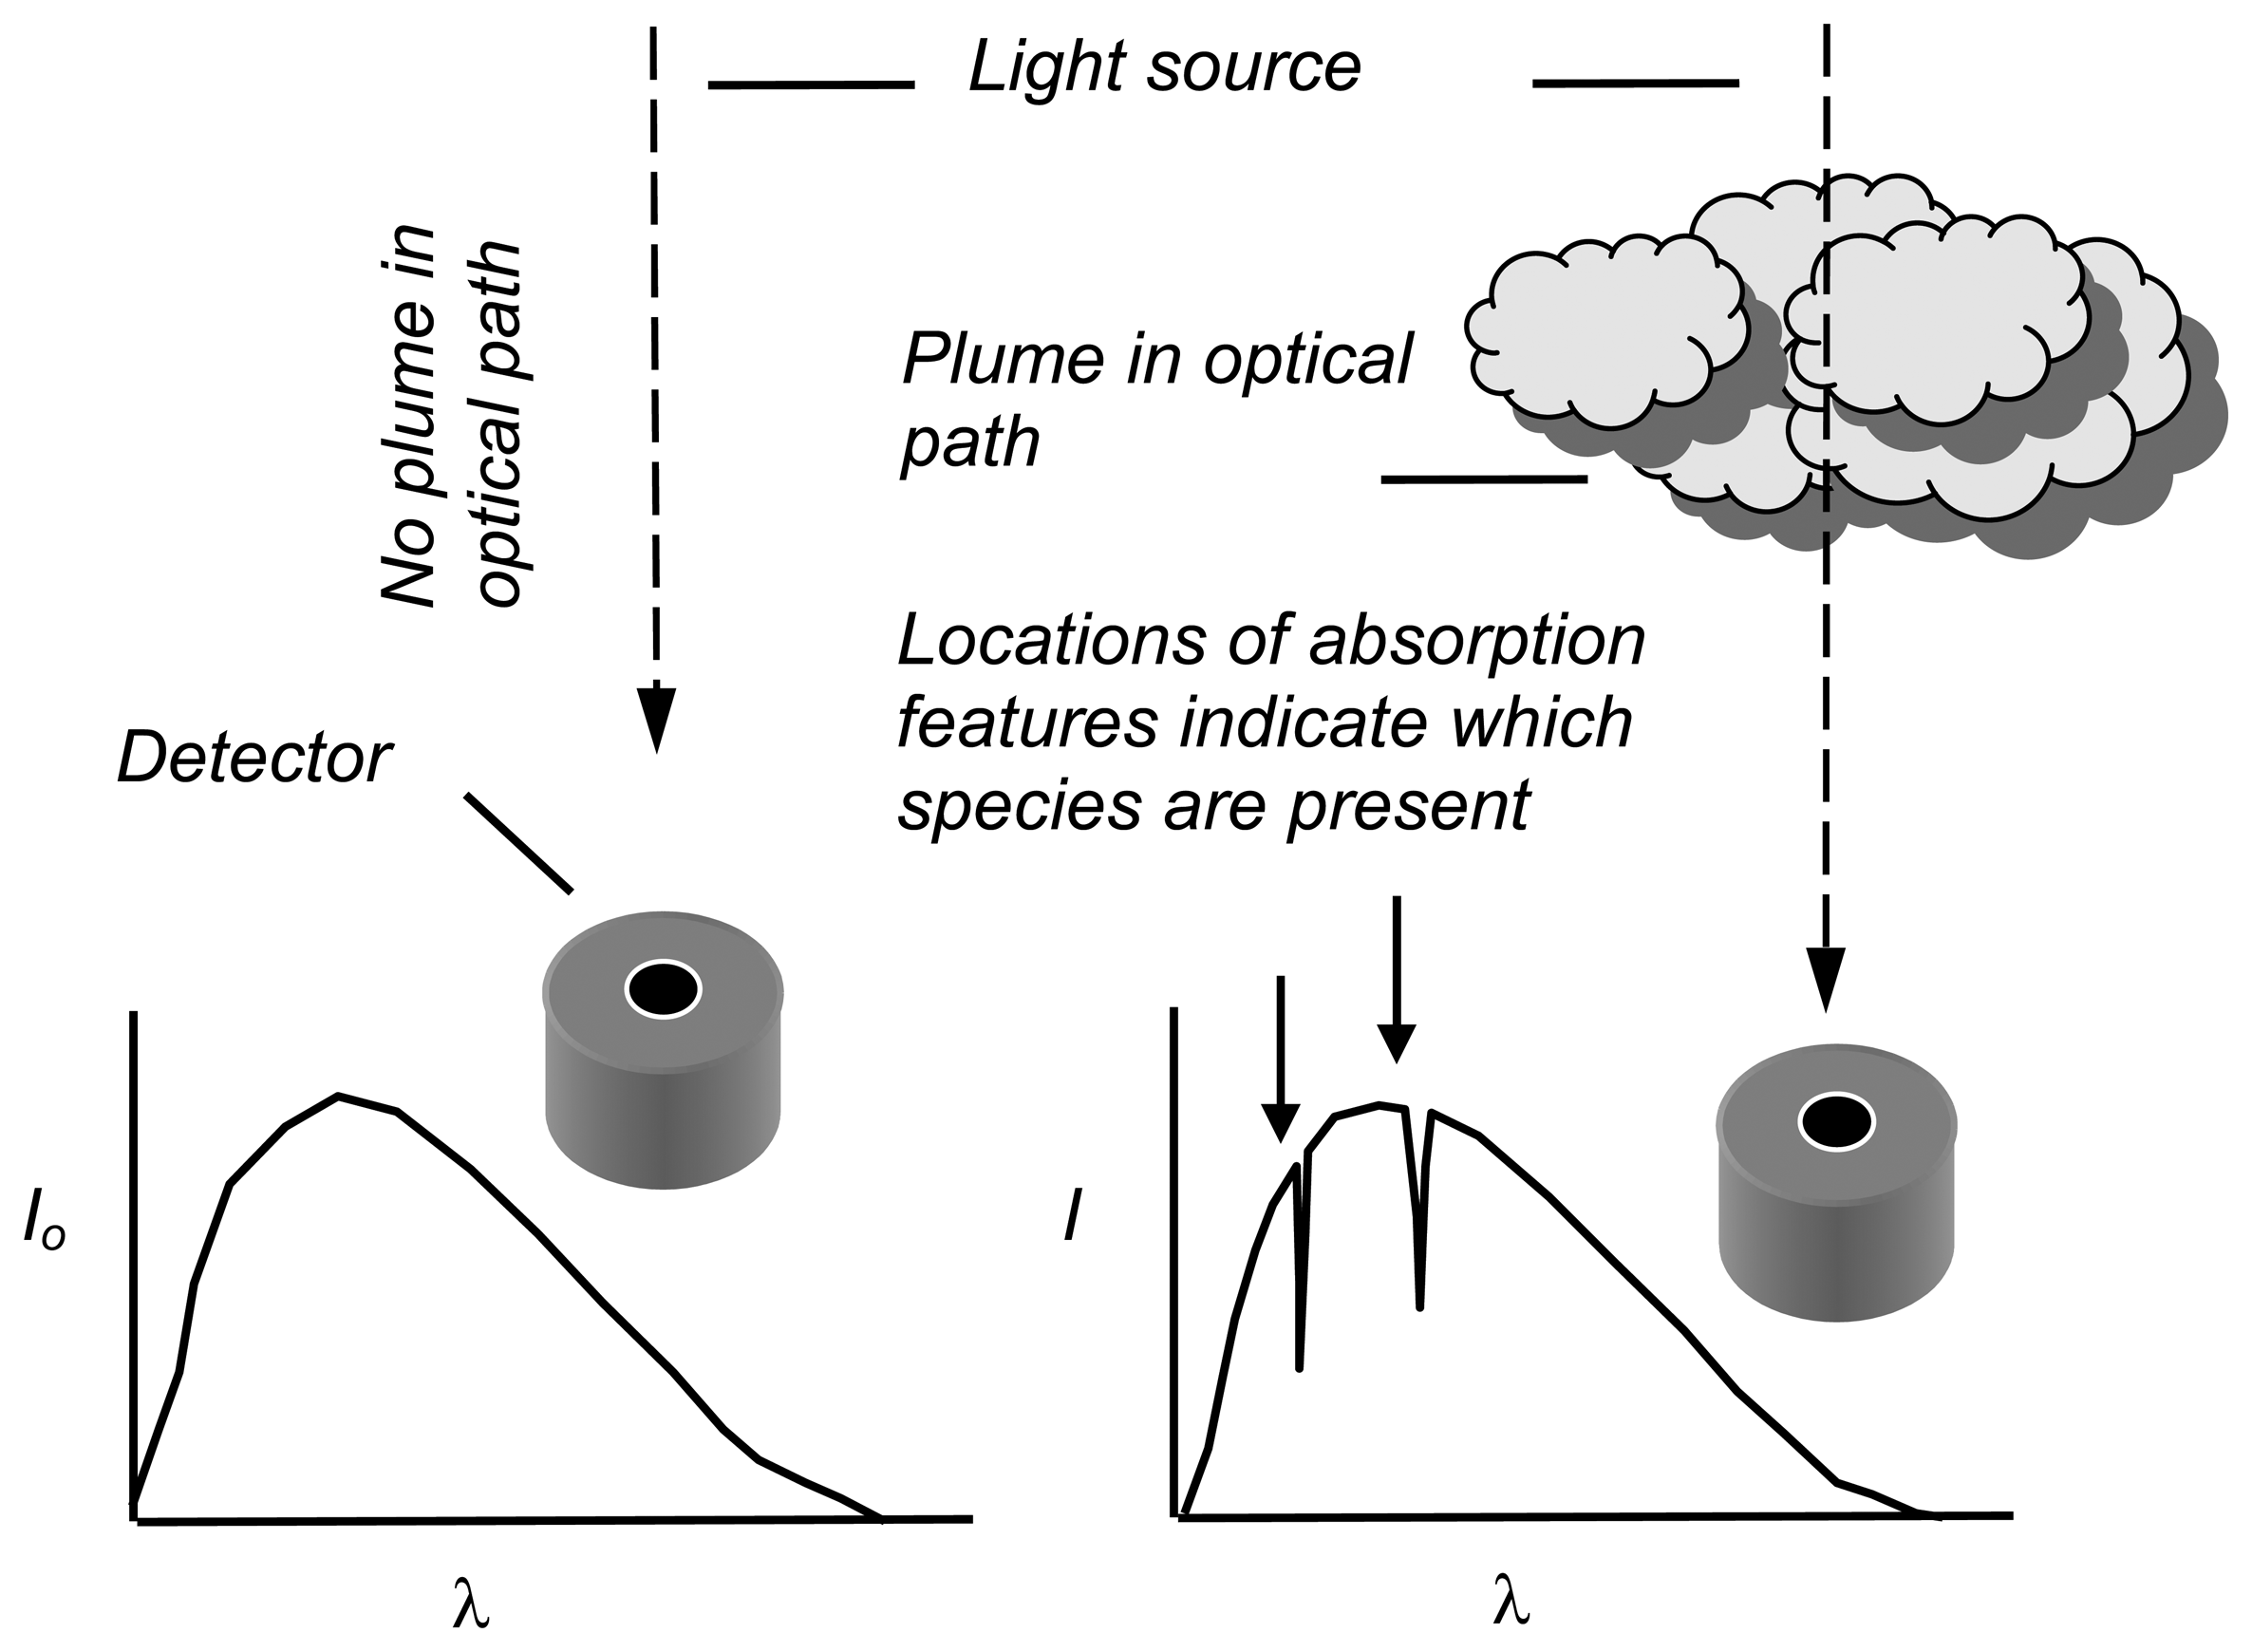
Figure 3.
a) Under plume traverse configuration for UV spectroscopic volcanic SO2 flux measurements; b) the instrumental payload: zenith skylight is captured to the spectrometer via an optical fibre and telescope; spectra are saved to the computer and georeferenced using contemporaneous data from a hand held GPS receiver.
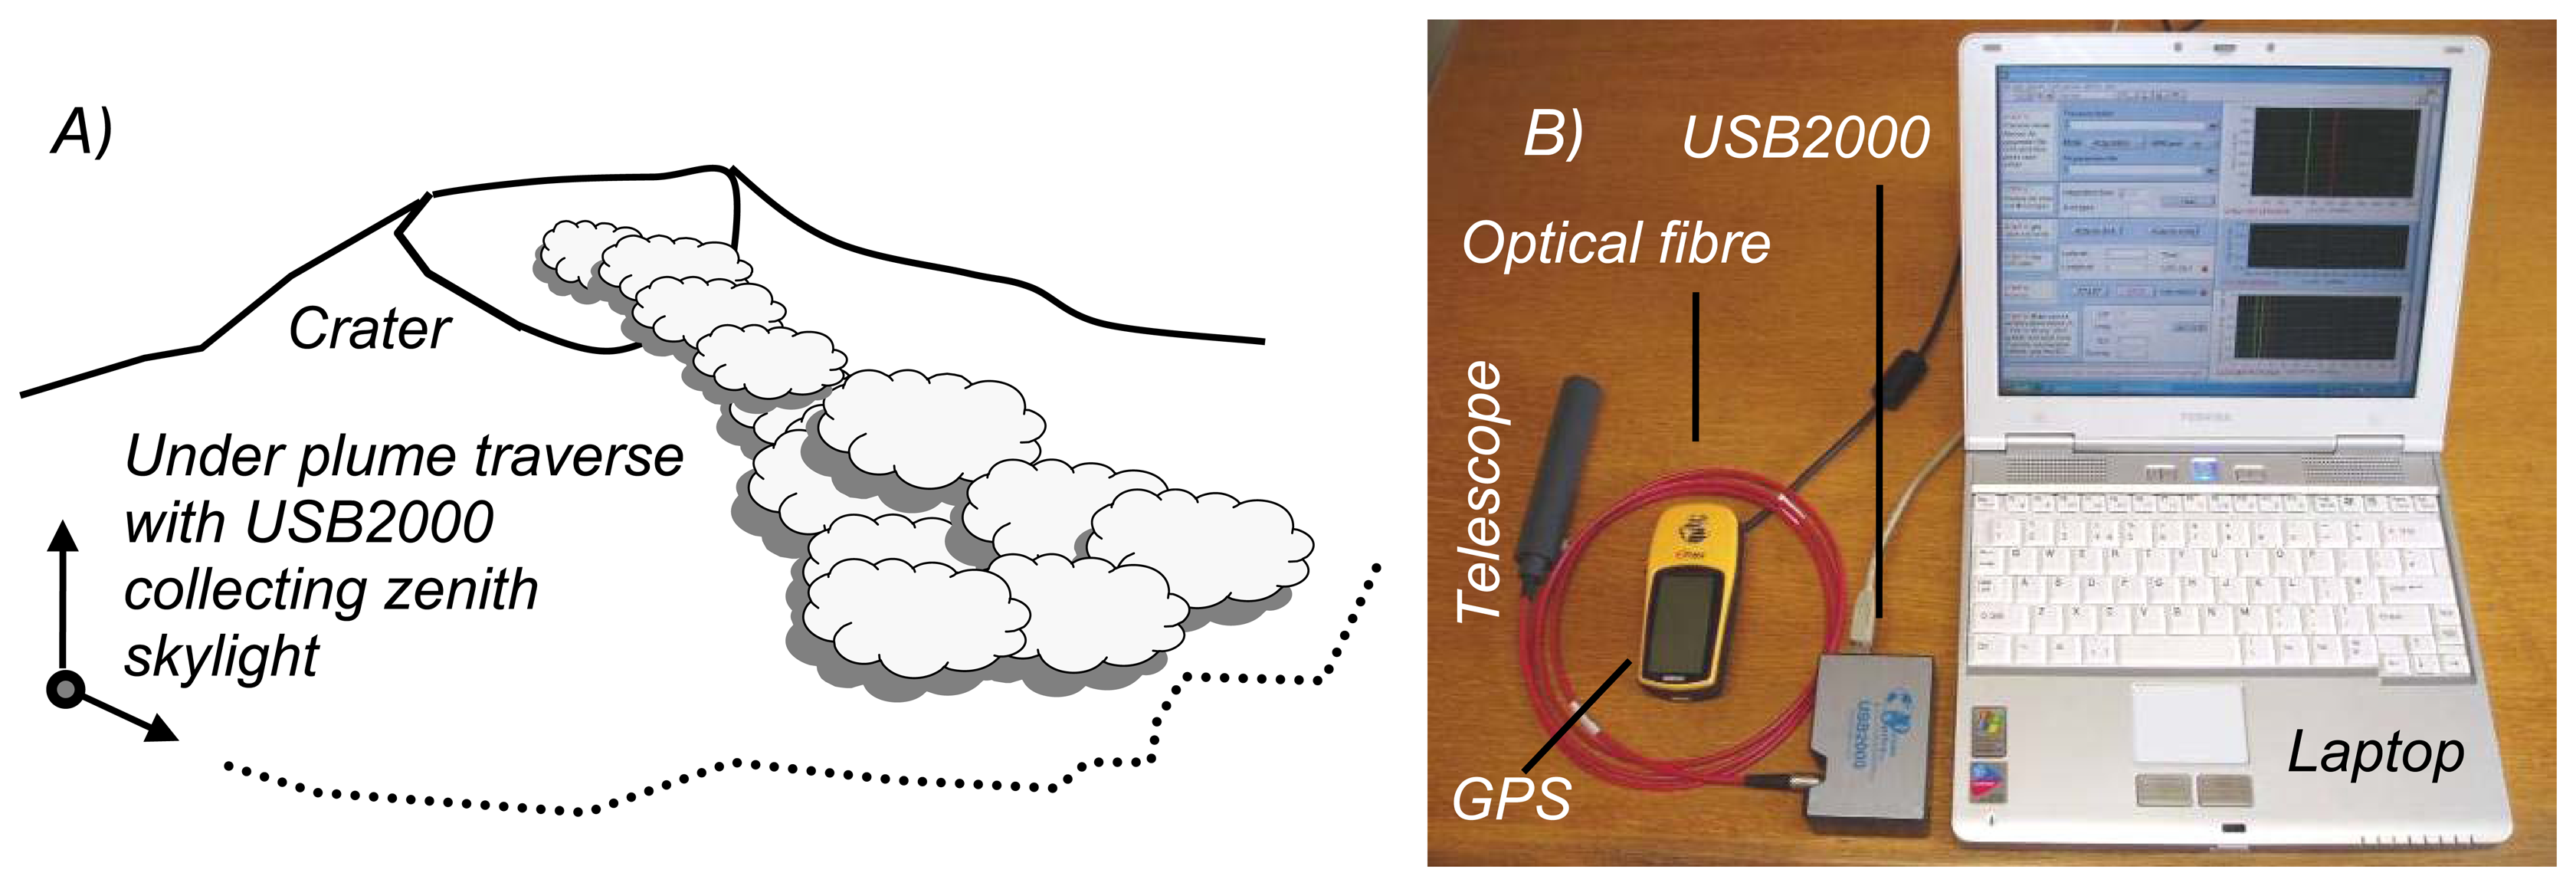
Figure 4.
volcanoSO2.exe software for capturing and analysing GPS and USB2000 spectral data in order to compute SO2 fluxes. Here the code is looping through spectra from a previous traverse (e.g., that shown in the spectra window). The corresponding differential absorption spectrum, showing the fine spectral resolution SO2 absorption structure is shown in the fitting window, and the resulting plume SO2 cross sectional profile in the concentrations field.
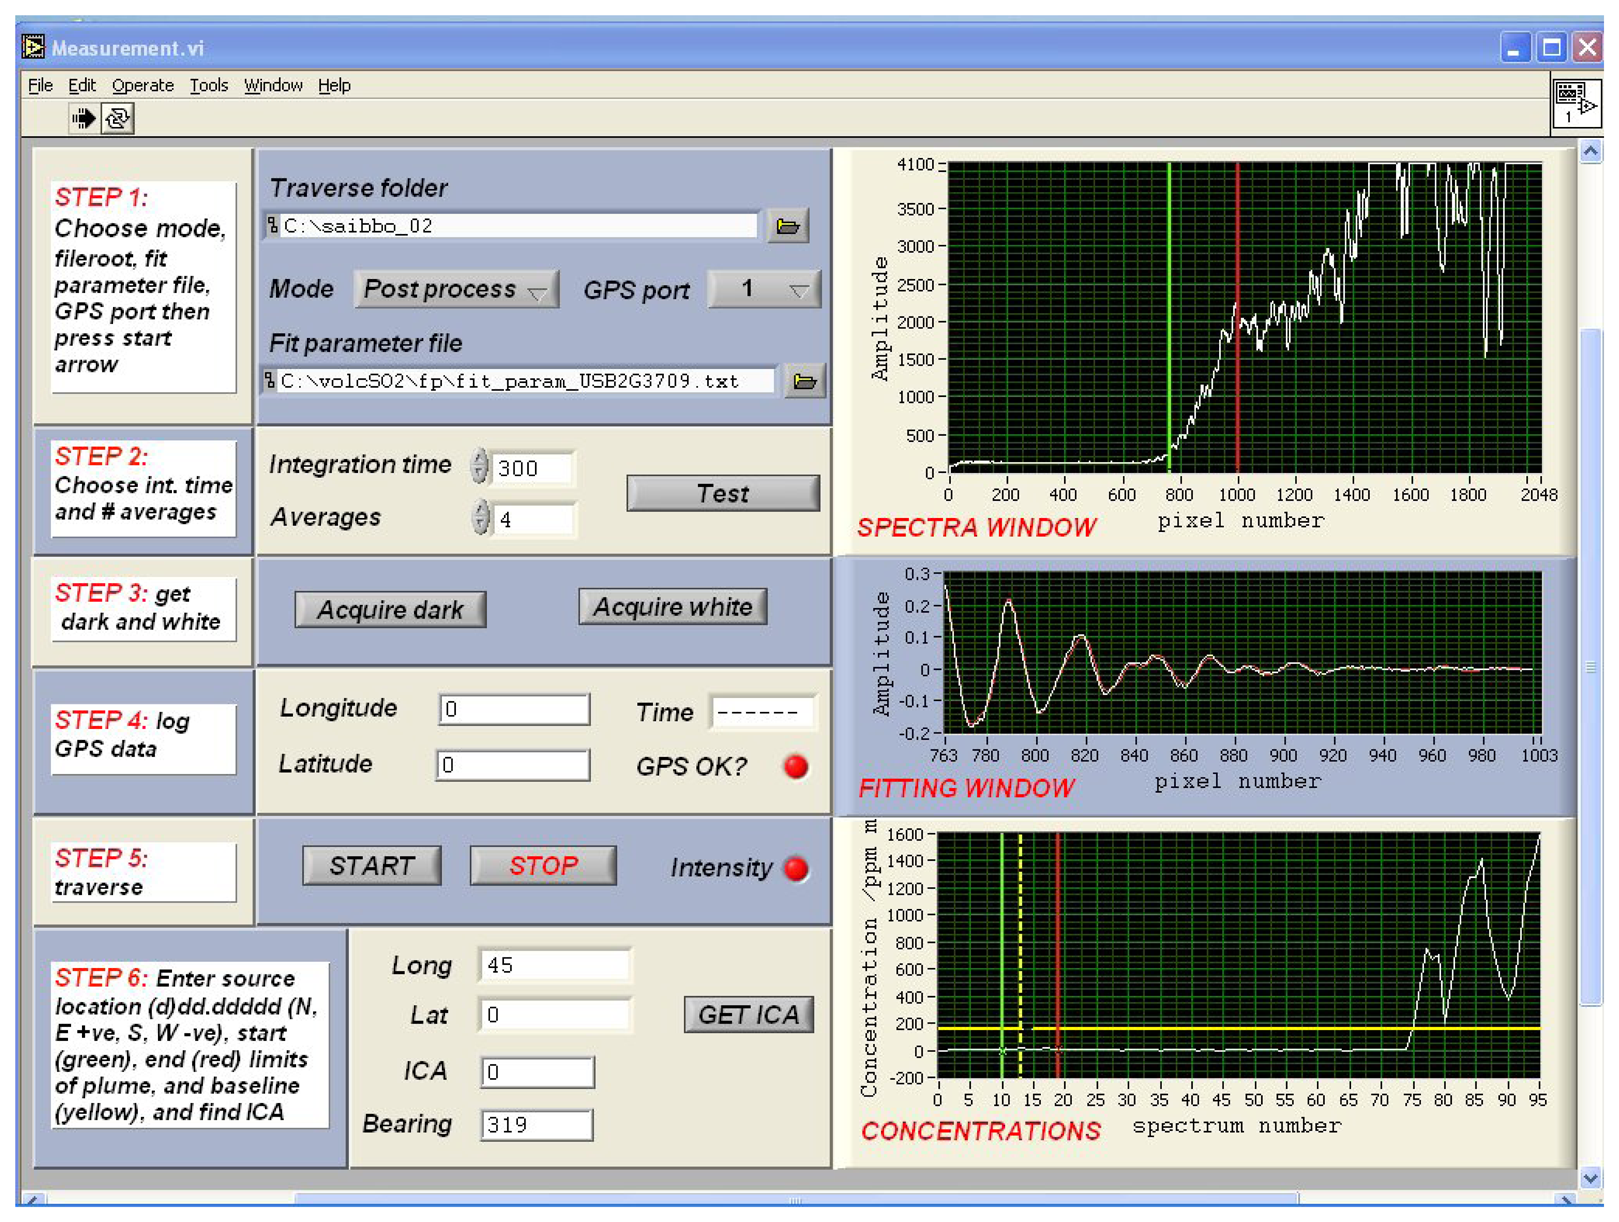
Figure 5.
a) Configuration for using three vertically pointing USB2000s to measure overhead SO2 concentration time series; b) sample data, where the traces (above) from spectrometers a, b and c are temporally offset relative to one another owing to the units' different distances from the source. The series are then cross-correlated to determine the time shift at which they best overlap (e.g., lag time), as applied in the lower plot, from which plume speed can be calculated.

Figure 6.
Configuration of a two UV scanning spectrometer network.

Figure 7.
Under plume UAV traverse at La Fossa crater, Vulcano Island, Italy, with the 1.5 kg SO2 flux measurement UV spectroscopic payload. The USB2000 and miniature laptop computer are in the vibrationally damped instrument tray, the GPS is mounted to the fore, and the fibre and vertical telescope to the reverse of the base. The helicopter fuselage is 141 cm long.
© 2008 by MDPI Reproduction is permitted for noncommercial purposes.
Share and Cite
MDPI and ACS Style
Kantzas, E.P.; McGonigle, A.J.S. Ground Based Ultraviolet Remote Sensing of Volcanic Gas Plumes. Sensors 2008, 8, 1559-1574. https://doi.org/10.3390/s8031559
AMA Style
Kantzas EP, McGonigle AJS. Ground Based Ultraviolet Remote Sensing of Volcanic Gas Plumes. Sensors. 2008; 8(3):1559-1574. https://doi.org/10.3390/s8031559
Chicago/Turabian StyleKantzas, Euripides P., and Andrew J. S. McGonigle. 2008. "Ground Based Ultraviolet Remote Sensing of Volcanic Gas Plumes" Sensors 8, no. 3: 1559-1574. https://doi.org/10.3390/s8031559