Multiscale Unsupervised Segmentation of SAR Imagery Using the Genetic Algorithm

1
School of Computer Science and Technology, Tianjin University of Technology, Tianjin 300191, P.R. China
2
Tianjin Key Laboratory of Intelligence Computing and Novel Software Technology, Tianjin, 300191, China
3
Nanchang Hangkong University, Nanchang, 330034, China
*
Author to whom correspondence should be addressed.
Sensors 2008, 8(3), 1704-1711; https://doi.org/10.3390/s8031704
Submission received: 17 January 2008
/
Accepted: 25 February 2008
/
Published: 12 March 2008
(This article belongs to the Special Issue Synthetic Aperture Radar (SAR))
Abstract
:A valid unsupervised and multiscale segmentation of synthetic aperture radar (SAR) imagery is proposed by a combination GA-EM of the Expectation Maximization (EM) algorith with the genetic algorithm (GA). The mixture multiscale autoregressive (MMAR) model is introduced to characterize and exploit the scale-to-scale statistical variations and statistical variations in the same scale in SAR imagery due to radar speckle, and a segmentation method is given by combining the GA algorithm with the EM algorithm. This algorithm is capable of selecting the number of components of the model using the minimum description length (MDL) criterion. Our approach benefits from the properties of the Genetic and the EM algorithm by combination of both into a single procedure. The population-based stochastic search of the genetic algorithm (GA) explores the search space more thoroughly than the EM method. Therefore, our algorithm enables escaping from local optimal solutions since the algorithm becomes less sensitive to its initialization. Some experiment results are given based on our proposed approach, and compared to that of the EM algorithms. The experiments on the SAR images show that the GA-EM outperforms the EM method.
1. Introduction
In recent years, SAR imaging has been rapidly gaining prominence in applications such as remote sensing, surface surveillance and automatic target recognition. For these applications, the segmentation of various categories of clutter is quite important, and this segmentation can play a key role in the subsequent analysis for target detection, recognition and image compression. Because of the nature of the SAR instrument, SAR images contain speckle noise, complicating the segmentation of SAR images. Several different segmentation methods especially designed for SAR data have been proposed. One approach to deal with the speckle is to use a multiscale approach, which exploits the coherent nature of SAR imagery formation. In particular, we build on the idea of characterizing and exploiting the scale-to-scale statistical variations and statistical variations in the same scale in SAR imagery due to radar speckle [1-3]. To fully exploit this phenomenon and its complexity, we recently introduced the mixture multiscale autoregressive (MMAR) model [4], and proposed the EM algorithm and the Bootstrap stochastic annealing EM algorithm for learning the parameters of the model, respectively. However, those EM algorithms converge to a local optimum and the result is sensitive to initialization. Additionally, the EM algorithm assumes that the number of components for modeling the distributions is known. This is not the case for many applications. In this paper, we propose an algorithm for finding the optimal number of components as well as the parameters determining the components of the MMAR model. The minimum description length (MDL) criterion is used for selecting the number of components of the model. Our approach embeds the EM algorithm and the deterministic annealing approach in the framework of the genetic algorithm (GA) so that the properties of three algorithms are utilized. The population-based stochastic search of the GA explores the search space more thoroughly than the EM method. Therefore, our algorithm enables escaping from local optimal solutions since the algorithm becomes less sensitive to its initialization. Our algorithm also enables the selection of the number of classifications using the MDL principle.
This paper is organized as follows. In the next section, we will describe quadtree interpretation of SAR imagery and its MMAR Modeling. In Section 3, we will propose a hybrid method based on the GA algorithm and EM algorithm for MMAR model. In Section 4, we will present the experimental results. In Section 5, we will present a short conclusion concerning our algorithm.
2. Quadtree Interpretation of SAR Imagery and Its MMAR Model
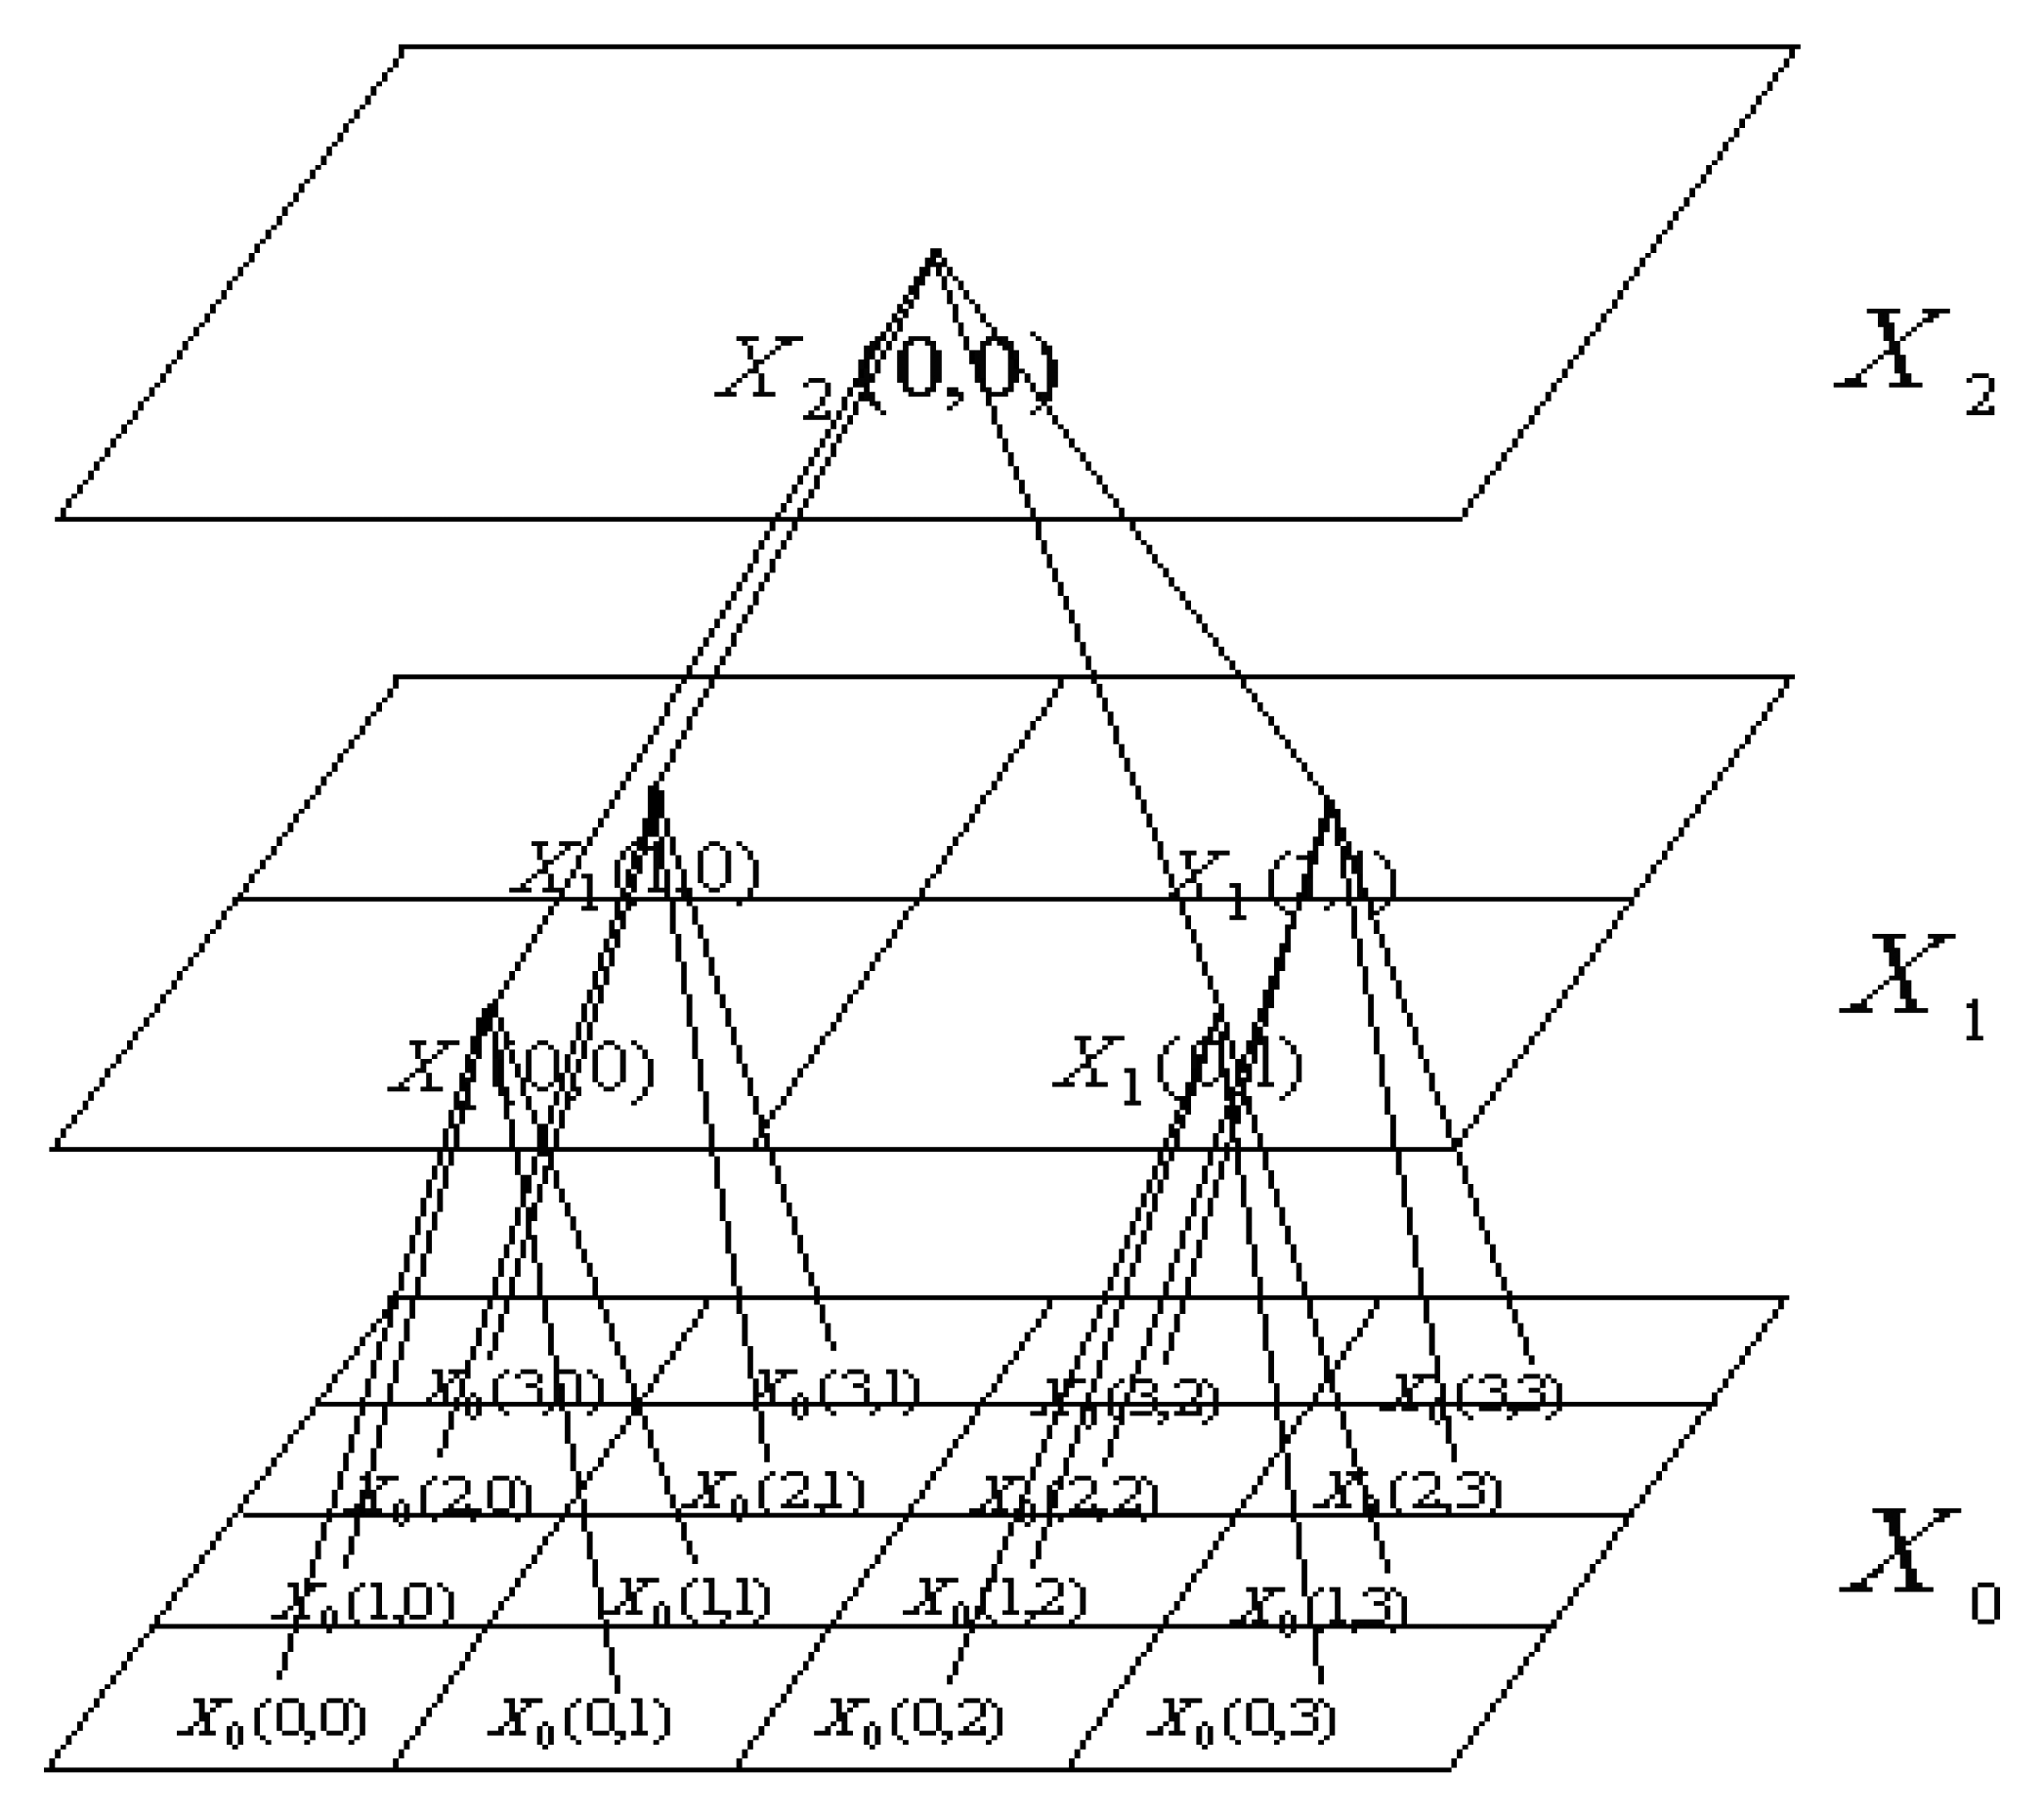
The starting point for our model development is a multiscale sequence XL, XL−1, …, X0 of SAR images, where XL and X0 correspond to the coarsest and finest resolution images, respectively. The resolution varies dyadically between images at successive scales. More precisely, we assume that the finest scale image X0 has a resolution of δ×δ and consists of anN×N array of pixels (with N = 2M for some M). Hence, each coarser resolution image Xm has 2−m× 2−mN pixels and resolution 2mδ × 2mδ. Each pixel Xm (k, l) is obtained by taking the coherent sum of complex fine-scale imagery over 2m × 2m blocks, performing log-detection (computing 20 times the log-magnitude), and correcting for zero frequency gain variations by subtracting the mean value. According, each pixel in image Xm corresponds to four “child” pixels in image Xm−1. This indicates that quadtree is natural for the mapping. Each node s on the tree is associated with one of the pixels Xm(k,l) corresponding to pixel (k,l) of SAR image Xm. As an example, Figure 1 illustrates a multiscale sequence of three SAR images, together with the quadtree mapping. Here the finest-scale SAR imagery is mapped to the finest level of the tree, and each coarse scale representation is mapped to successively higher levels. We use the notation X(s) to indicate the pixel mapped to node s. The scale of node s is denoted by m(s).
In this paper, we focus on a specific class of multiscale models, namely mixture multiscale autoregressive models [4] of the form:
where γ̅ is defined to reference the parent of node s. pk is order of the regression, Moreover the coefficients ai(s) and variance σi depend only on m(s). F is distribution function, K is number of classes, ℑs is set of
, Φ(.) is the standard normal distribution function and
, πk > 0. φ(.) is the probability density function of a standard normal distribution.
In Bayesian unsupervised segmentation using parametric estimation, the problem of segmentation is based on the model identification. The most commonly used estimator is the ML estimator, which is solved by the classical EM algorithms [4]. The details are as follows:
A. Expectation Step
The posterior probability for a pixel X(s) ∈ X0 to belong to class k at the iteration is given by
where es,k = X(s) − ak,0 − ak,1X(sγ̅) −⋯− ak,pX(sγ̅p), X(sγ̅) is parent of X(s).
B. Maximization Step
In this step, ws,k is considered artificially as the a posterior probability of X(s), so that, in the next iteration, we have
where (âk,0, âk,1, ⋯,âk,p) satisfy the system of equations
where μ(X(s),i) = 1 for i = 0 and μ(X(s),i) = X(sγ̅i) for i > 0.
The estimates of the parameters are then obtained by iterating the four steps until convergence. Parameters K, pk can be selected by minimum description length criterion. That is
where L(K,Θ) is likelihood function.
3. Hybrid method of GA and EM Algorithm
The main goal of interweaving GA with the EM algorithm is to utilize the properties of both algorithms. Similar to the method in [5], each individual in the population represents a possible solution of the MMAR model in the GA-EM algorithm. The MDL criterion is used as a fitness function for model selection. The best individual is the one that has the lowest MDL value. The evaluation of the individuals in the population is two-fold. First, R cycles of the EM algorithm are performed on each individual which results in an update of the set of parameters and consequently of the individual which encodes these parameters. In cases where the relative log likelihood drops below a threshold, we terminate the EM and, consequently, do not perform all R cycles. This might be the case for a large value of R. Second, the MDL value is determined for each updated individual to judge the model. Hence, the evaluation process of the individual provides both, a fitness value and an update of the parameters encoded by the individual.
In the following section, the framework of the GA-EM algorithm is presented:
| procedure GA-EM |
| begin |
| t ← 0 |
| Oldsize ← 0 |
| cend ← 0 |
| initialize P(t) |
| while (cend ≠ 5) |
| P′(t) ← perform R EM steps on P(t) |
| MDL′ ← evaluate P′(t) |
| P′(t) ← recombine P′(t) |
| P‴(t) ← perform R EM steps on P′(t) |
| MDL′ ← evaluate P‴(t) |
| [P″(t),MDL] ← select{[P‴(t),MDL′ ] ∪ [P′(t),MDL′ ] |
| MDLmin ← min(MDL) |
| amin ← argminMDL (P″(t)) |
| if (|amin| ≠ Oldsize) then |
| cend ← 0 |
| Oldsize ←| amin| |
| else |
| cend ← cend + 1 |
| end |
| P″‴(t) ← enforce mutation P‴(t) |
| P(t +1) ← mutate (P″‴(t)) |
| t ← t + 1 |
| end |
| EM(amin) until convergence of the log likelihood is reached |
| end |
The best evaluation value achieved during the evolution process is stored in MDLmin and the corresponding individual in amin, where |amin|denotes the number of components used for this model. p(t) denotes a population of M individuals at generation t and p′(t) the resulting population after performing the EM steps. p″(t) is an offspring population of p′(t) with size H. Performing the EM steps and evaluation of the offspring population delivers p‴(t) and MDL″. In the following, the parameters and operators of the GA-EM are discussed in more detail.
Encoding
Each individual is composed of two parts. The first part uses binary encoding, where the length of this part is determined by the maximal number of allowed components Mmax Each of these bits is related to a particular component. If a bit is set to zero, then its associated component is omitted for modeling the mixture, while setting the bit to one includes the component. The second part uses floating point value encoding to encode the ak,j and covariance σk parameters of Mmax components. Due to the switching mechanism of the components among the individuals during evolution of the GA, the components weight πk cannot be encoded. Except for the best individual, these weights are assumed to be uniformly distributed.
Recombination
The crossover operator selects two parent individuals randomly from the population p′(t) and recombines them to form two offsprings. The crossover probability pc determines the number of offspring individuals H (H = pcM). We use the single-point crossover [6] which randomly chooses a crossover position χ ∈{1,…,Mmax} within the first part of the individual and exchanges the value of the genes to the right of this position between both individuals for the first part with its associated parameters in the second part.
Selection
For selection, the (M,H)-strategy [7] is used. This approach refers to both the parent population p′(t) and the offspring population pm(t) containing M and H individuals, respectively. After both populations have been evaluated, the M best individuals are selected to form the population p″″(t) for the next generation.
Enforced Mutation
If more components model the data points in a similar manner, some of their parameters are forced to mutate. This similarity is measured using the correlation coefficient. If the correlation coefficient is above the threshold, one of both components is randomly selected and added to the candidate set for mutation. Once the candidate set for enforced mutation is complete, a binary value is sampled from a uniform distribution for each candidate. According to this value, either the candidate component is removed by resetting the corresponding bit in the first part of the individual.
Mutation
The mutation operator inverts the binary value of each gene in the first part of the individuals with the mutation probability pm. For the second part of the individual, a uniform distributed random number sampled within an upper and lower bound is assigned to genes that are mutated. These bounds were determined from the data set. The mutation rate for value encoding is scaled down by a factor of number of parameter for each component. The mutation for the value encoded part of the individual is restricted to the parameters values. Since our GA-EM is elitist, there are no mutations performed on the best individual.
After the number of SAR imagery regions is detected and the model parameters are estimated, SAR image segmentation is performed by classifying pixels. The Bayesian classifier is utilized for implementing classification. That is to say, to attribute at each X(s) a class k with the following way:
4. Experiments
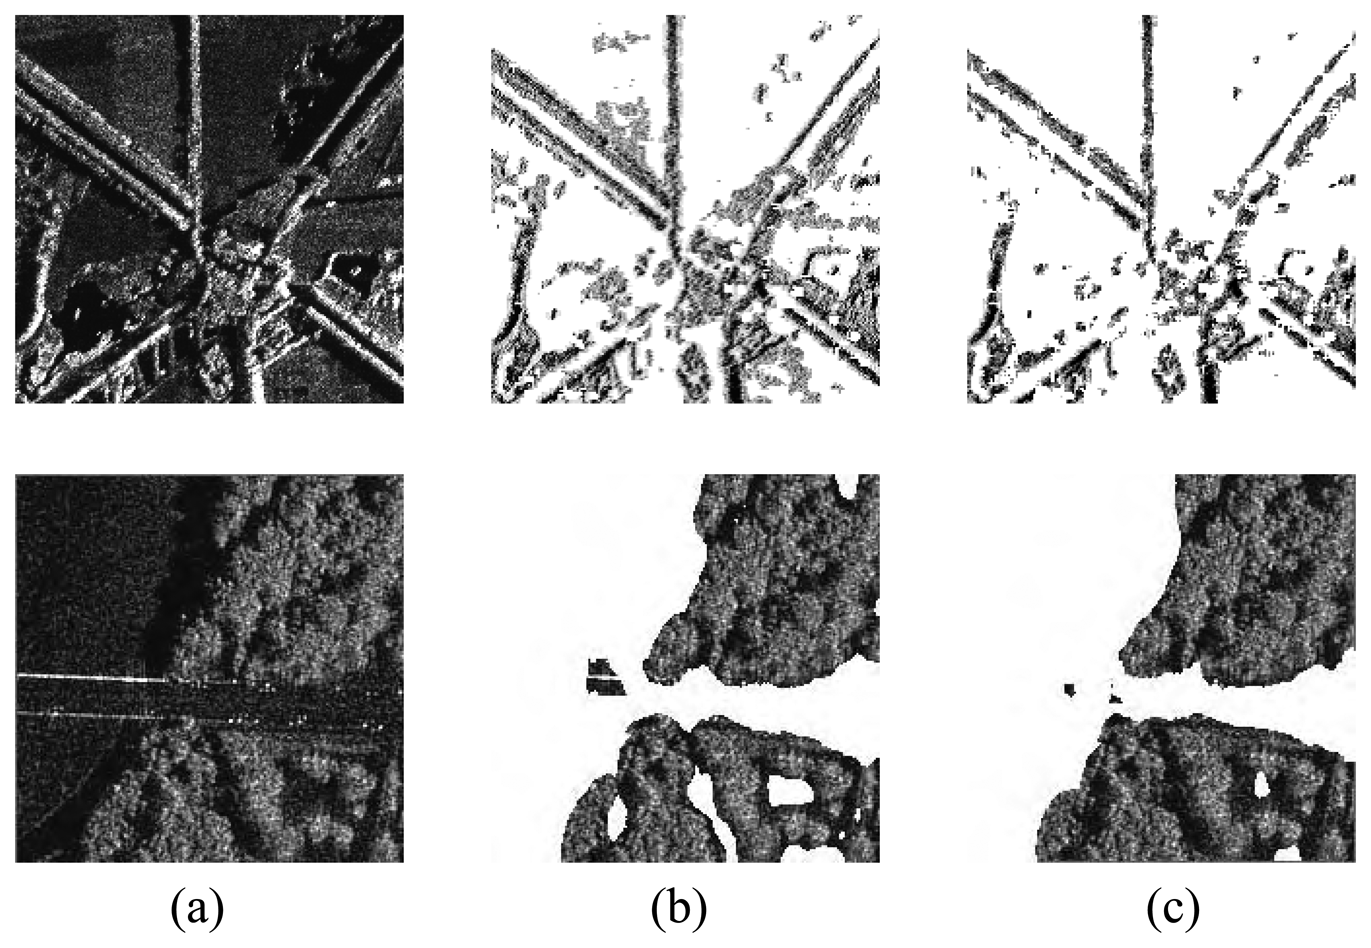
To demonstrate the segmentation performance of our proposed algorithm, we applied it to two complex SAR images of 200×200 pixel resolution size, consisting of woodlands and cornfields [see Figure 2(a)]. From the complex images, we generated an above-mentioned quadtree representation consisting of L = 3 levels and used a second-order regression. The weight of each component πi is selected randomly. The maximum number of Gaussian components in the data is assumed to be Mmax =15 for the EM and the GA-EM algorithm. The parameter setting for the GA-EM is pm =0.02 for the mutation probability, pc =0.8 for the recombination probability, K =6 for the population size, R =3 for the number of EM steps within one GA iteration, and 0.95 for the component correlation threshold. The EM algorithm is executed from 2 to Mmax components. The selected model is the one that achieves the lowest MDL value within the set of obtained candidate models. The termination condition of both algorithms is reached when the relative log likelihood drops below 0.001. Figure 2(c) shows the results from applying GA-EM approach to two SAR images, as well as the results [see Figure 2(b)] from EM algorithm for comparison. Table 1 compares the EM and the GA-EM. We present the percentage of pixels (%) that are correctly segmented using the best model. The results we obtain show that the GA-EM slightly outperforms the EM algorithm.
5. Conclusions
We combine the GA algorithm with the EM algorithm (denoted as GA-EM) and apply it to the segmentation of SAR image based on the MMAR model of SAR imagery. This kind of algorithm leads to a great improvement in ML parameter estimation and is less sensitive to initialization compared to the standard EM algorithm. Experimental results show that the GA-EM algorithm gives better results than the classical EM algorithm in the quality of the segmented image.
Acknowledgments
This work is supported in part by the National Natural Science Foundation of China (No. 60375003), the Aeronautics and Astronautics Basal Science Foundation of China (No. 03I53059), the Tianjin Natural Science Foundation, the Science Foundation of Tianjin University of Technology (2006BA15).
References and Notes
- Fosgate, C.; Irving, W.W.; Karl, W.; Willsky, A.S. Multiscale segmentation and anomaly enhancement of SAR imagery. IEEE Trans. Image Process. 1997, 6, 7–20. [Google Scholar]
- Irving, W.W.; Novak, L.M.; Willsky, A.S. A multiresolution approach to discrimination in SAR imagery. IEEE Tran. Aerosp. Electron. Syst. 1997, 33, 1157–1169. [Google Scholar]
- Kim, A.; Kim, H. Hierarchical stochastic modeling of SAR imagery for segmentation/compression. IEEE Trans. Signal Process. 1999, 47, 458–468. [Google Scholar]
- Wen, X.B.; Tian, Z. Mixture multiscale autoregressive modeling of SAR imagery for segmentation. Electron. Lett. 2003, 39, 1272–1274. [Google Scholar]
- Pernkopf, F.; Bouchaffra, D. Genetic-based EM algorithm for learning Gaussian mixture model. IEEE Trans. Pattern Anal. Machine Intel. 2005, 27, 1344–1348. [Google Scholar]
- Back, T. Evolutionary algorithma in theory and practice; Oxford Univ. Press: Oxford, UK, 1996. [Google Scholar]
- Back, T.; Schwefel, H. Evolutionary computation: an overview. Proc. IEEE Conf. Evolut. Comput. 1996, 20–29. [Google Scholar]
Figure 1.
Sequence of three multiresolution SAR images mapped onto a quadtree.

Figure 2.
(a) Original SAR image. (b) Segmented image from EM algorithm. (c) Segmented image from GA-EM algorithm.
Figure 2.
(a) Original SAR image. (b) Segmented image from EM algorithm. (c) Segmented image from GA-EM algorithm.

© 2008 by MDPI Reproduction is permitted for noncommercial purposes.
Share and Cite
MDPI and ACS Style
Wen, X.-B.; Zhang, H.; Jiang, Z.-T. Multiscale Unsupervised Segmentation of SAR Imagery Using the Genetic Algorithm. Sensors 2008, 8, 1704-1711. https://doi.org/10.3390/s8031704
AMA Style
Wen X-B, Zhang H, Jiang Z-T. Multiscale Unsupervised Segmentation of SAR Imagery Using the Genetic Algorithm. Sensors. 2008; 8(3):1704-1711. https://doi.org/10.3390/s8031704
Chicago/Turabian StyleWen, Xian-Bin, Hua Zhang, and Ze-Tao Jiang. 2008. "Multiscale Unsupervised Segmentation of SAR Imagery Using the Genetic Algorithm" Sensors 8, no. 3: 1704-1711. https://doi.org/10.3390/s8031704