Amperometric Determination of Sulfite by Gas Diffusion- Sequential Injection with Boron-Doped Diamond Electrode

Abstract
:1. Introduction
2. Experimental Section
2.1. Reagents
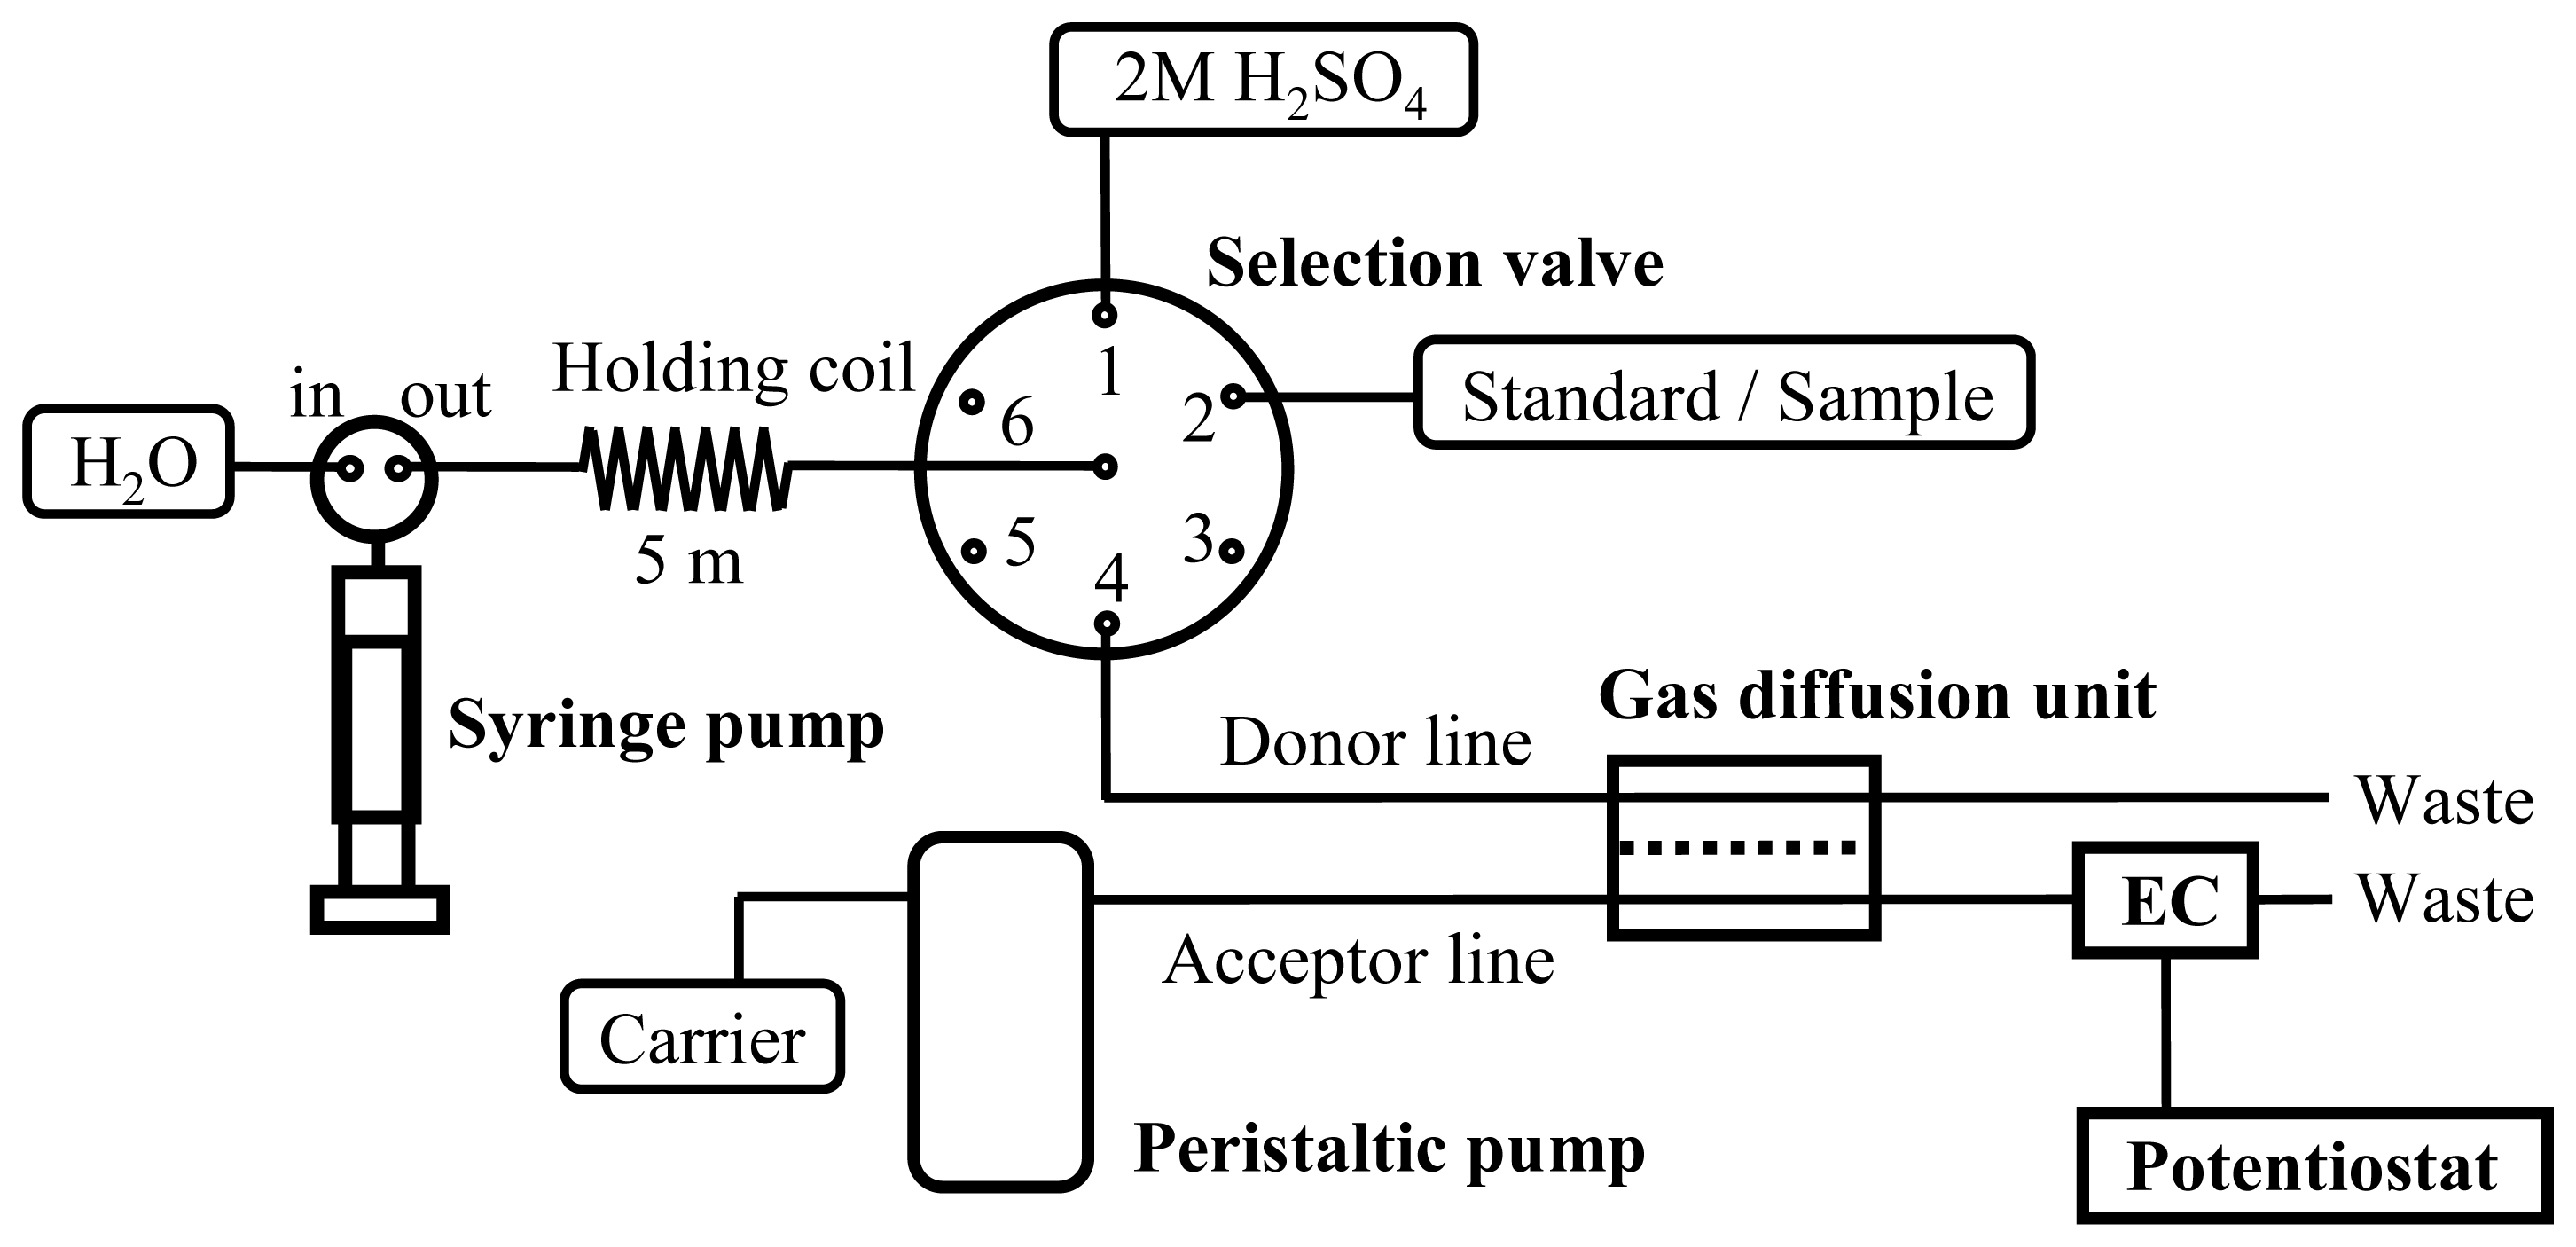
2.2. Apparatus
2.3. Sequential injection procedure
3. Results and discussion
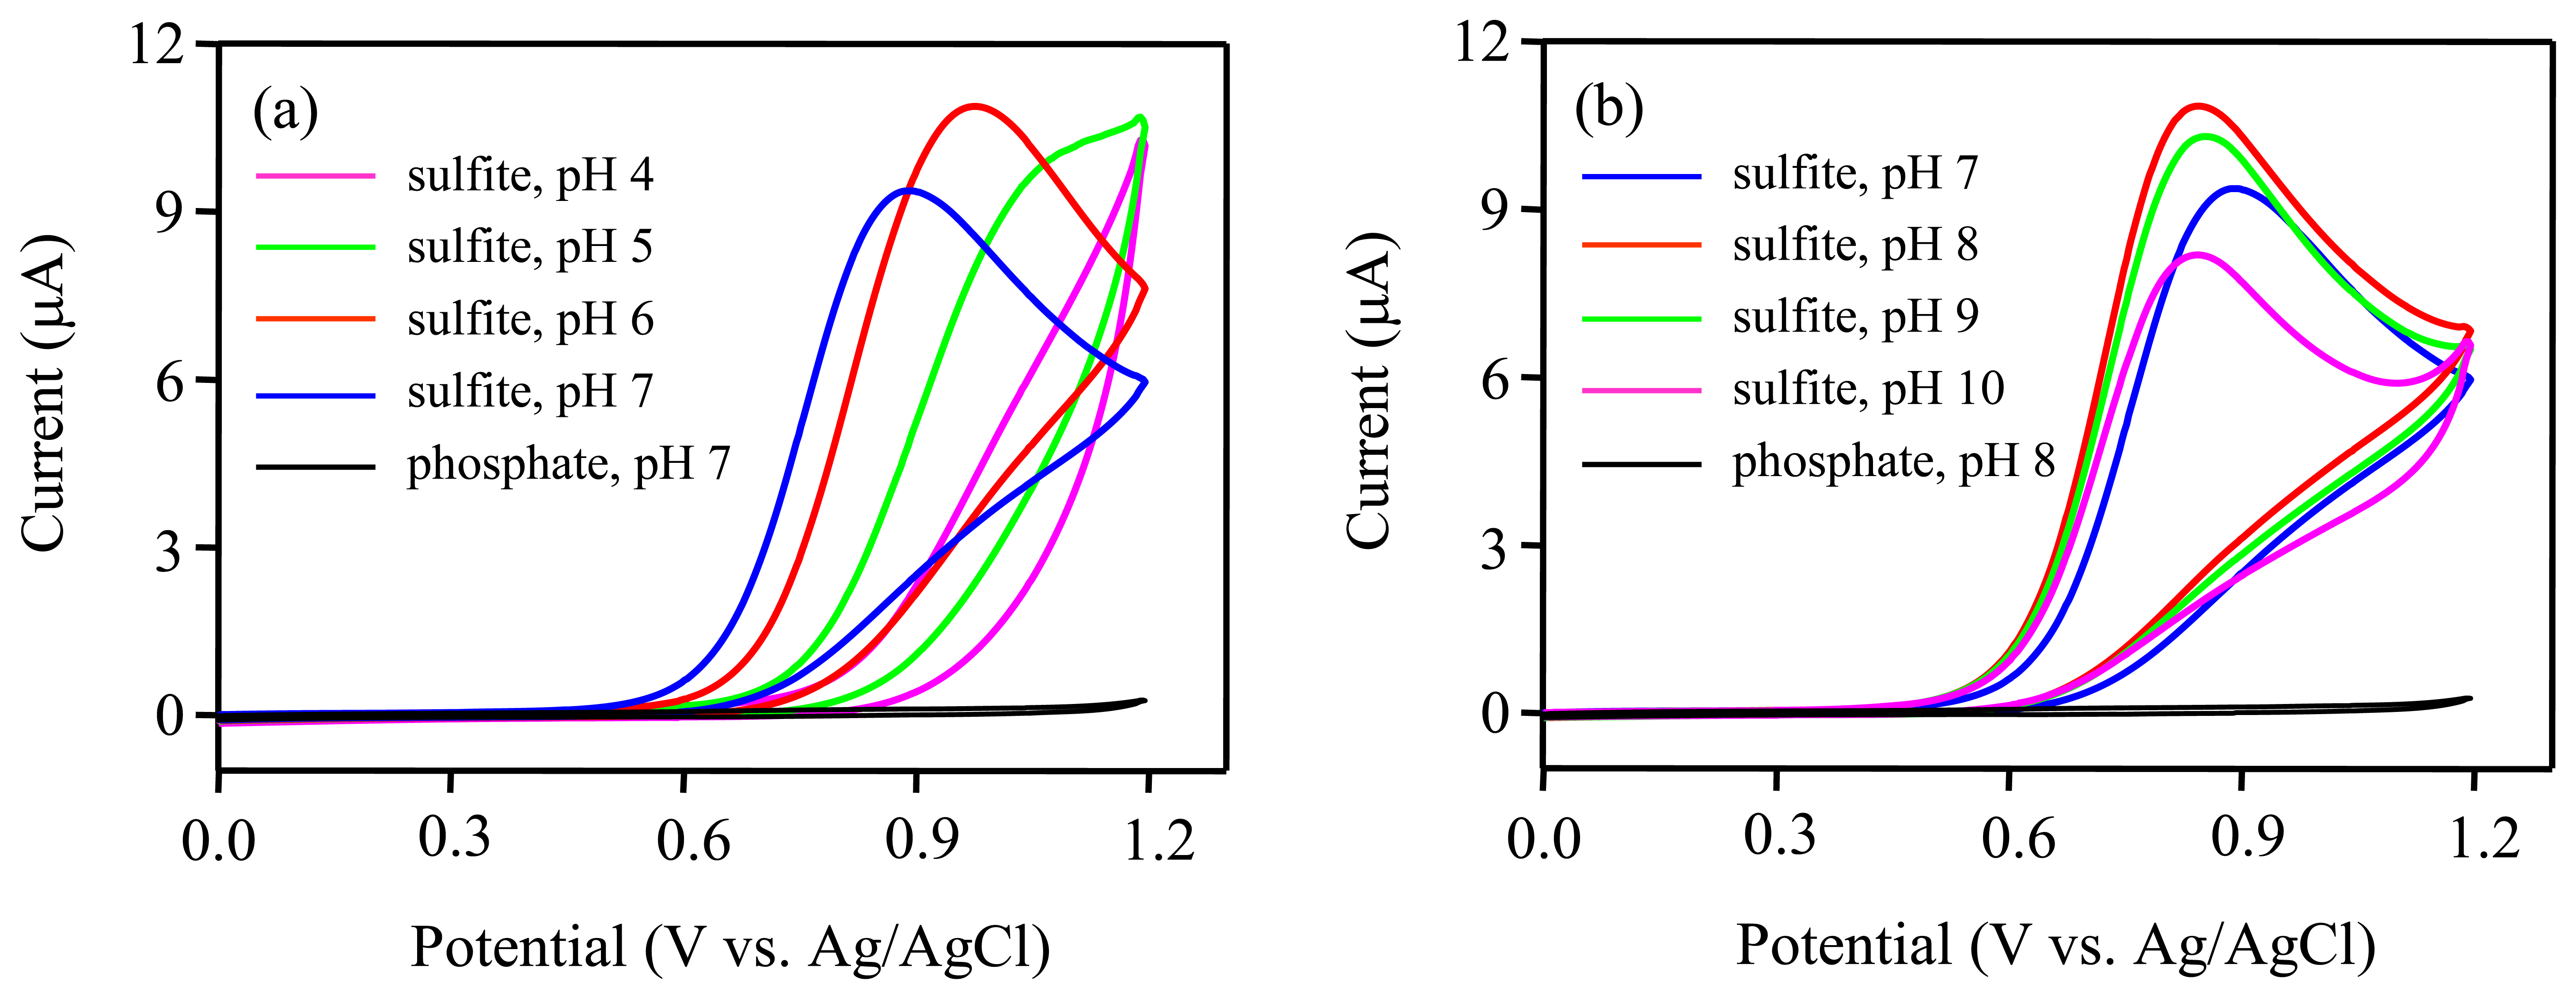
3.1. Optimization of pH
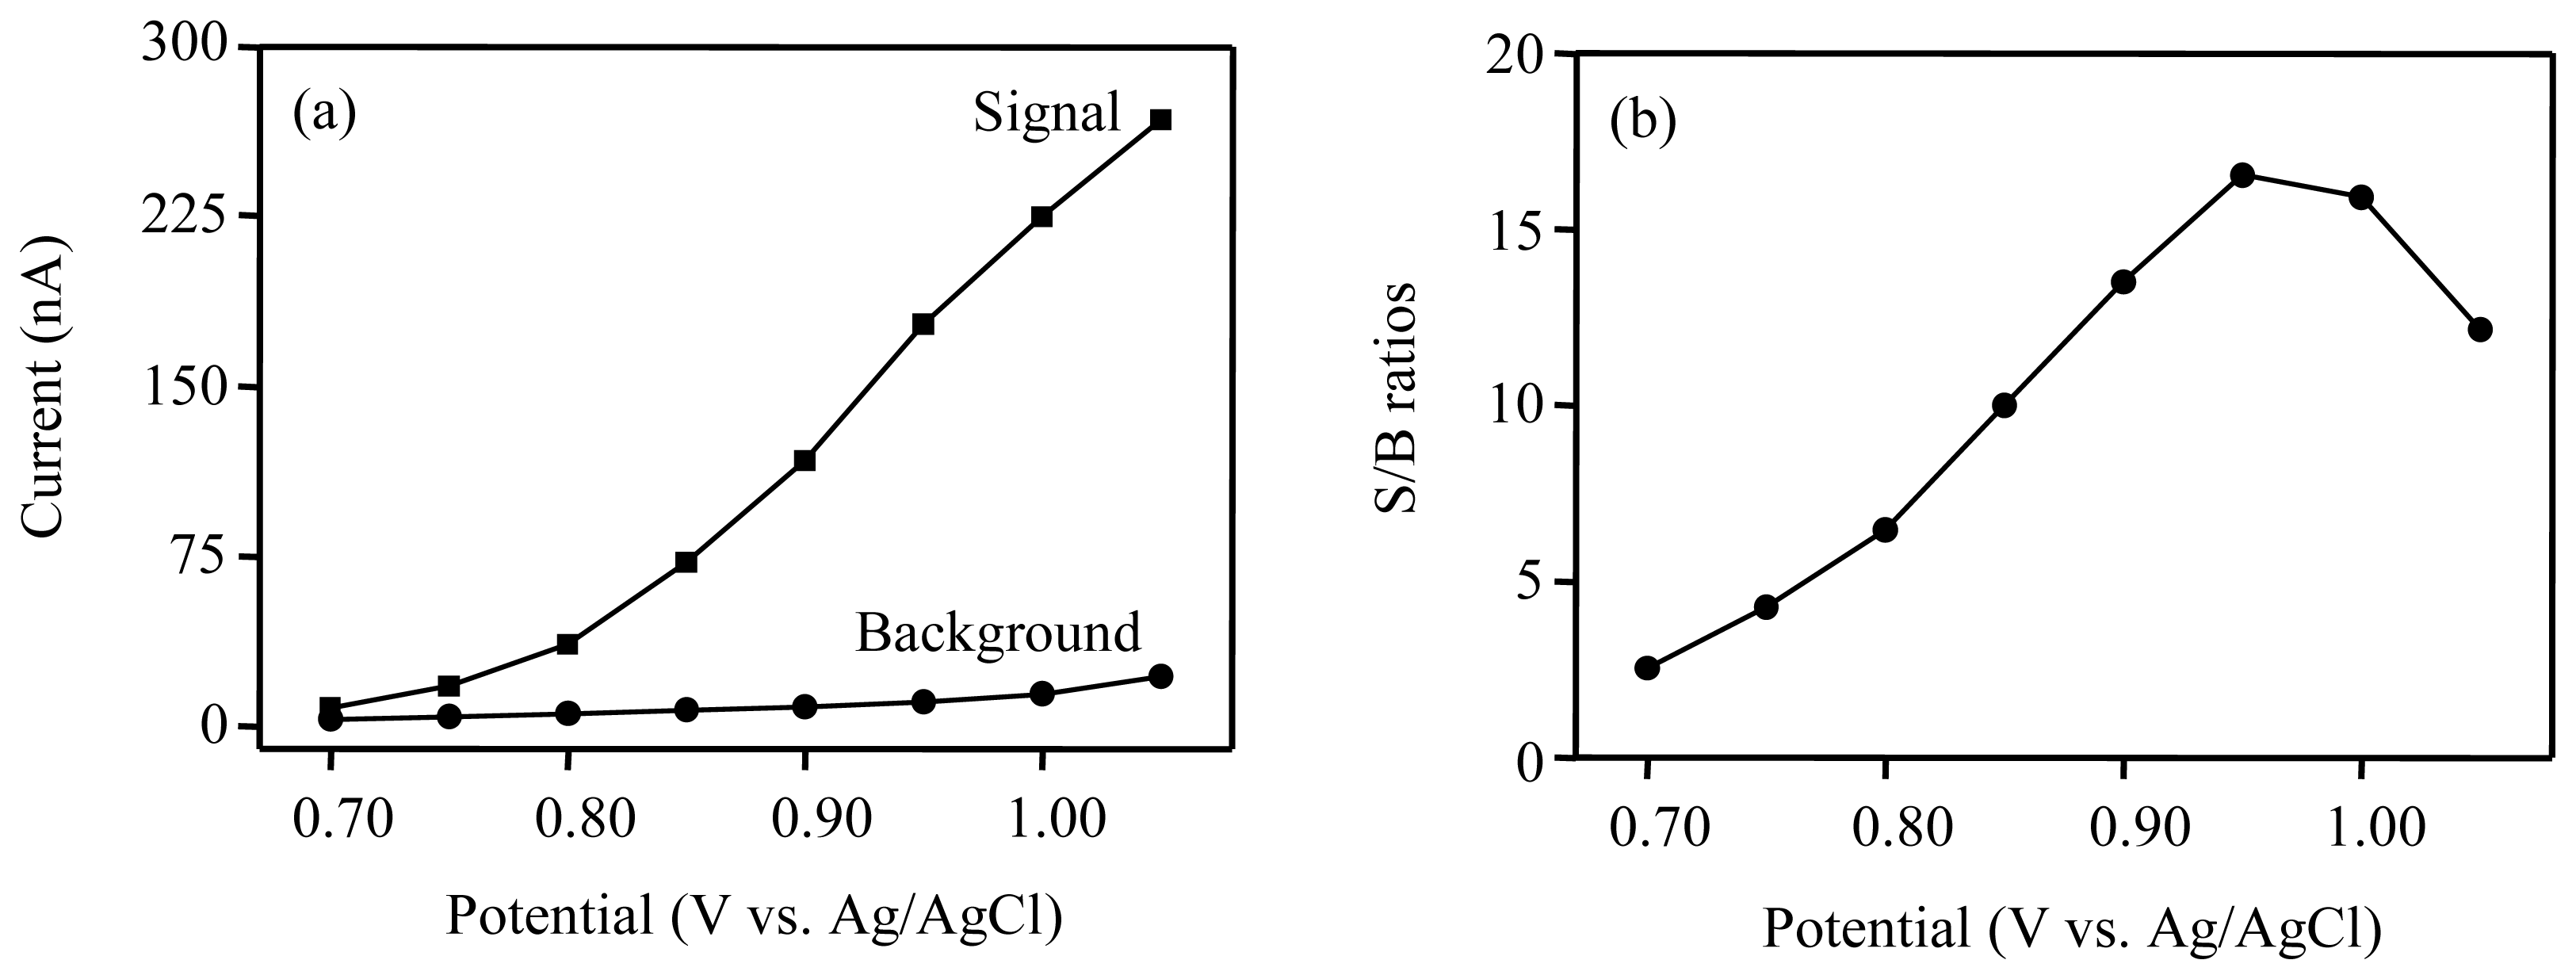
3.2. Optimum potential for amperometric detection
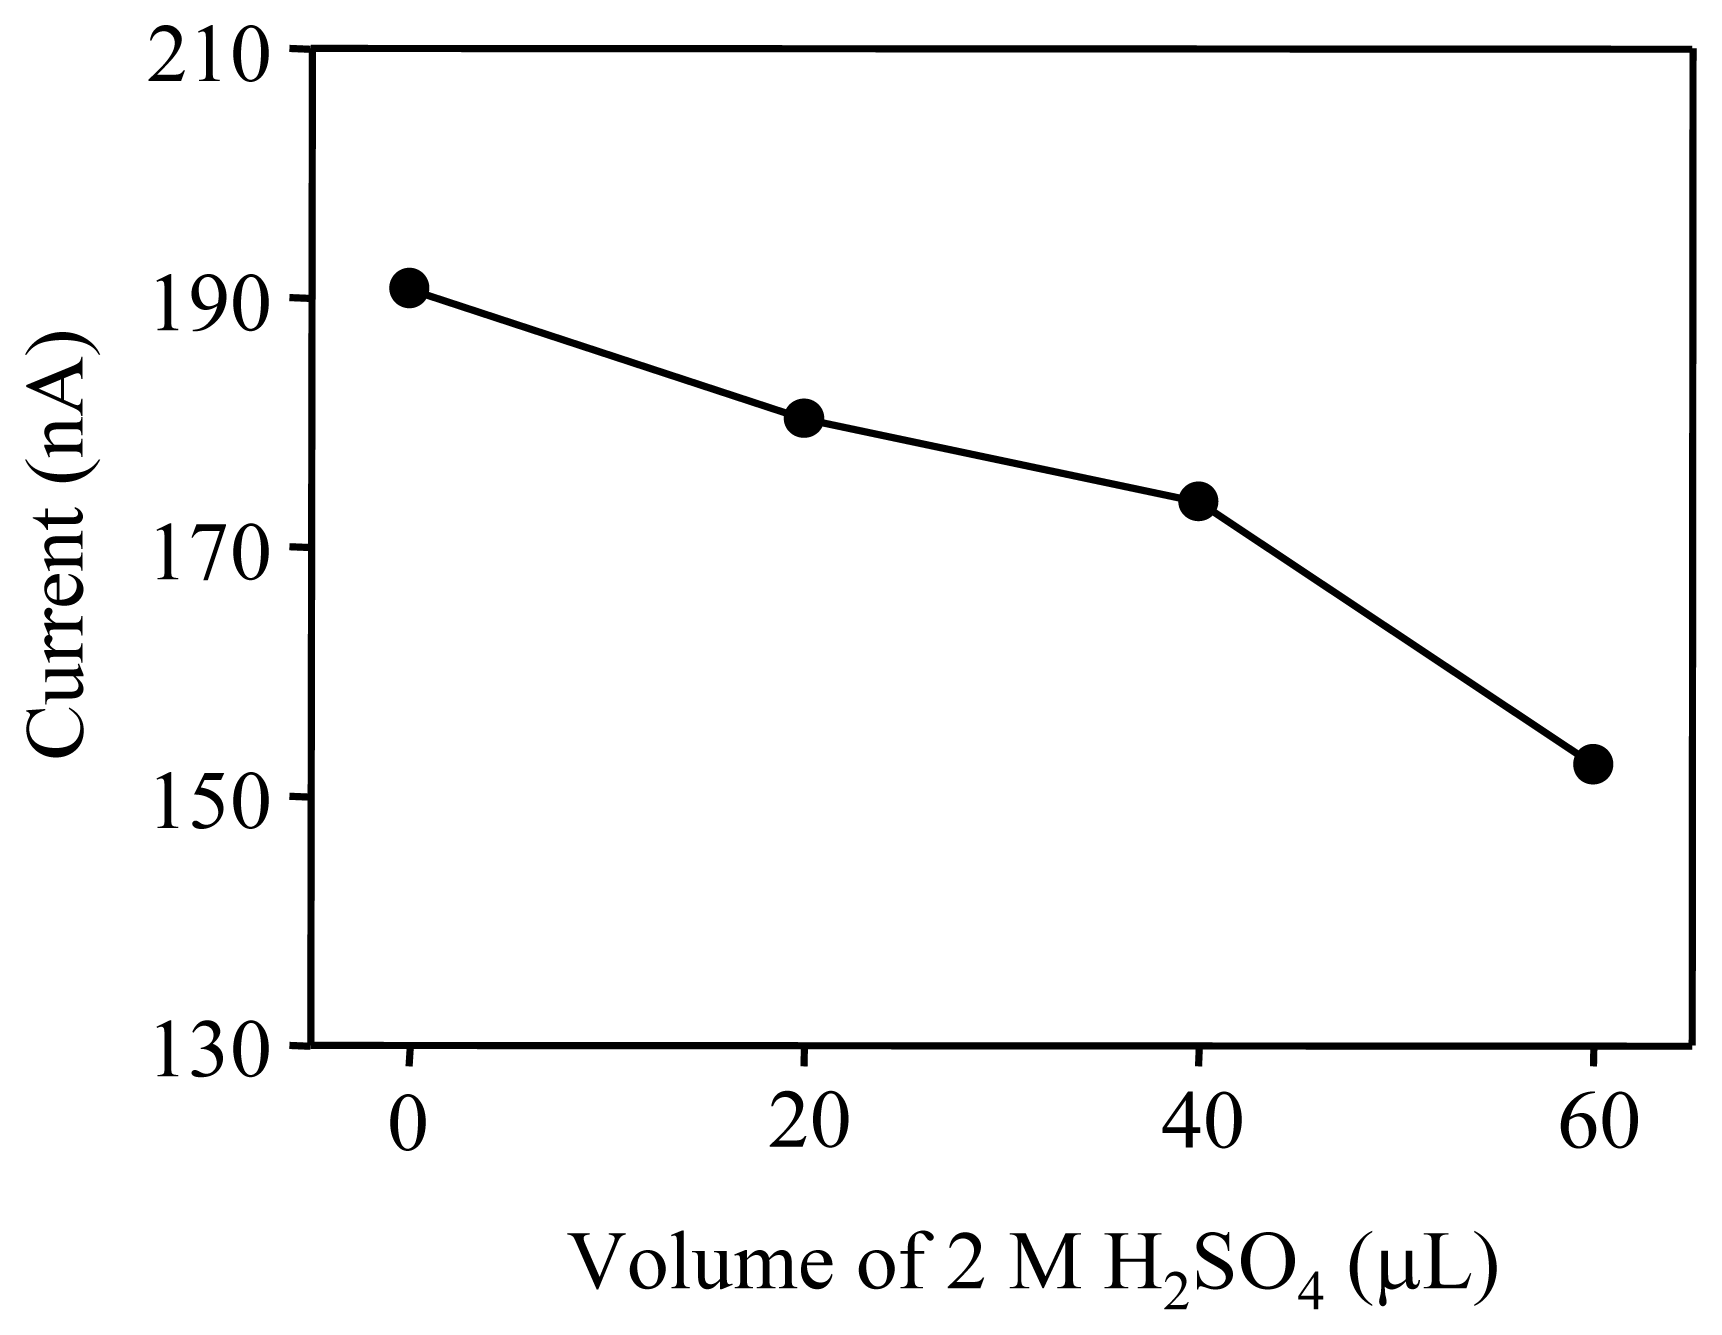
3.3. Effect of sodium dodecyl sulfate (SDS)
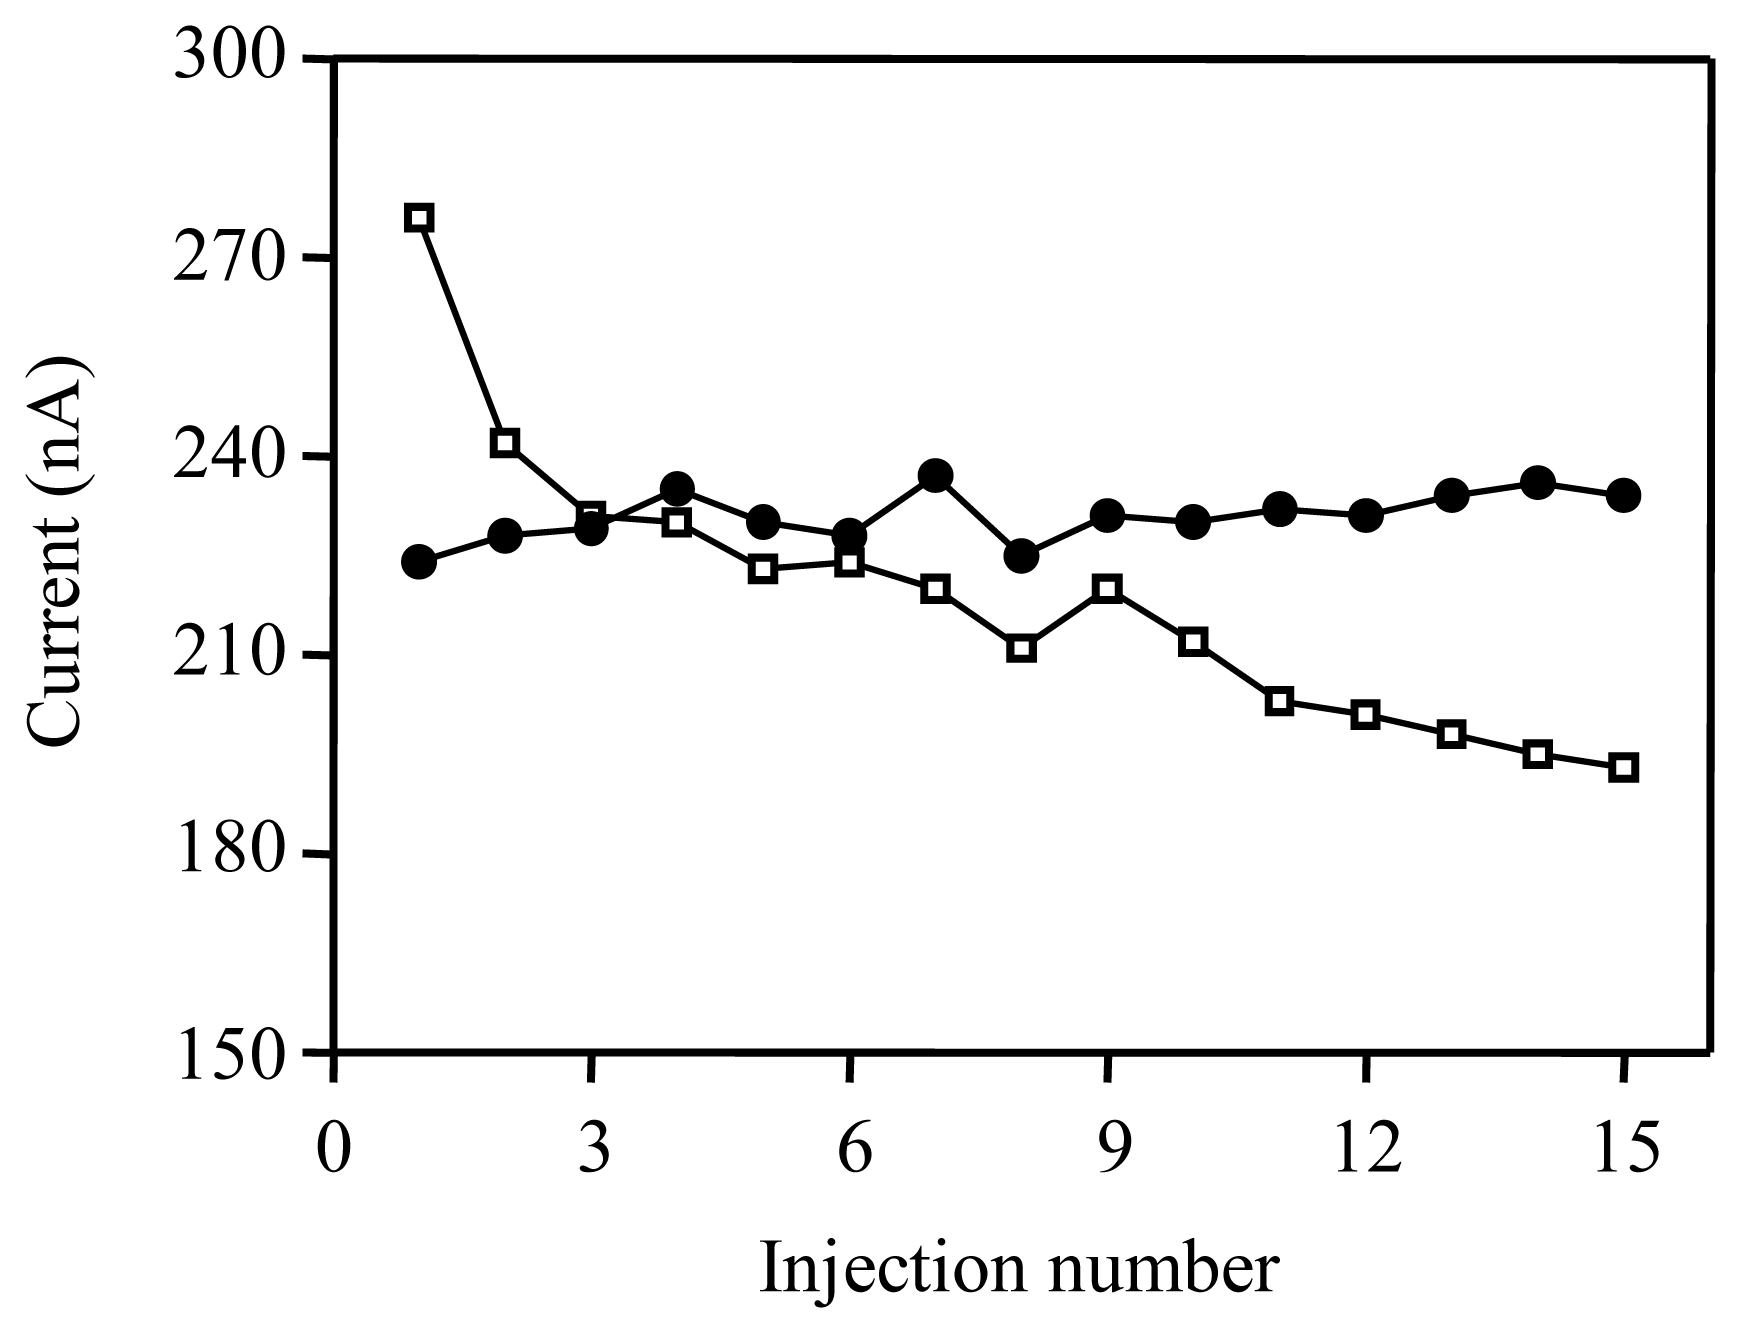
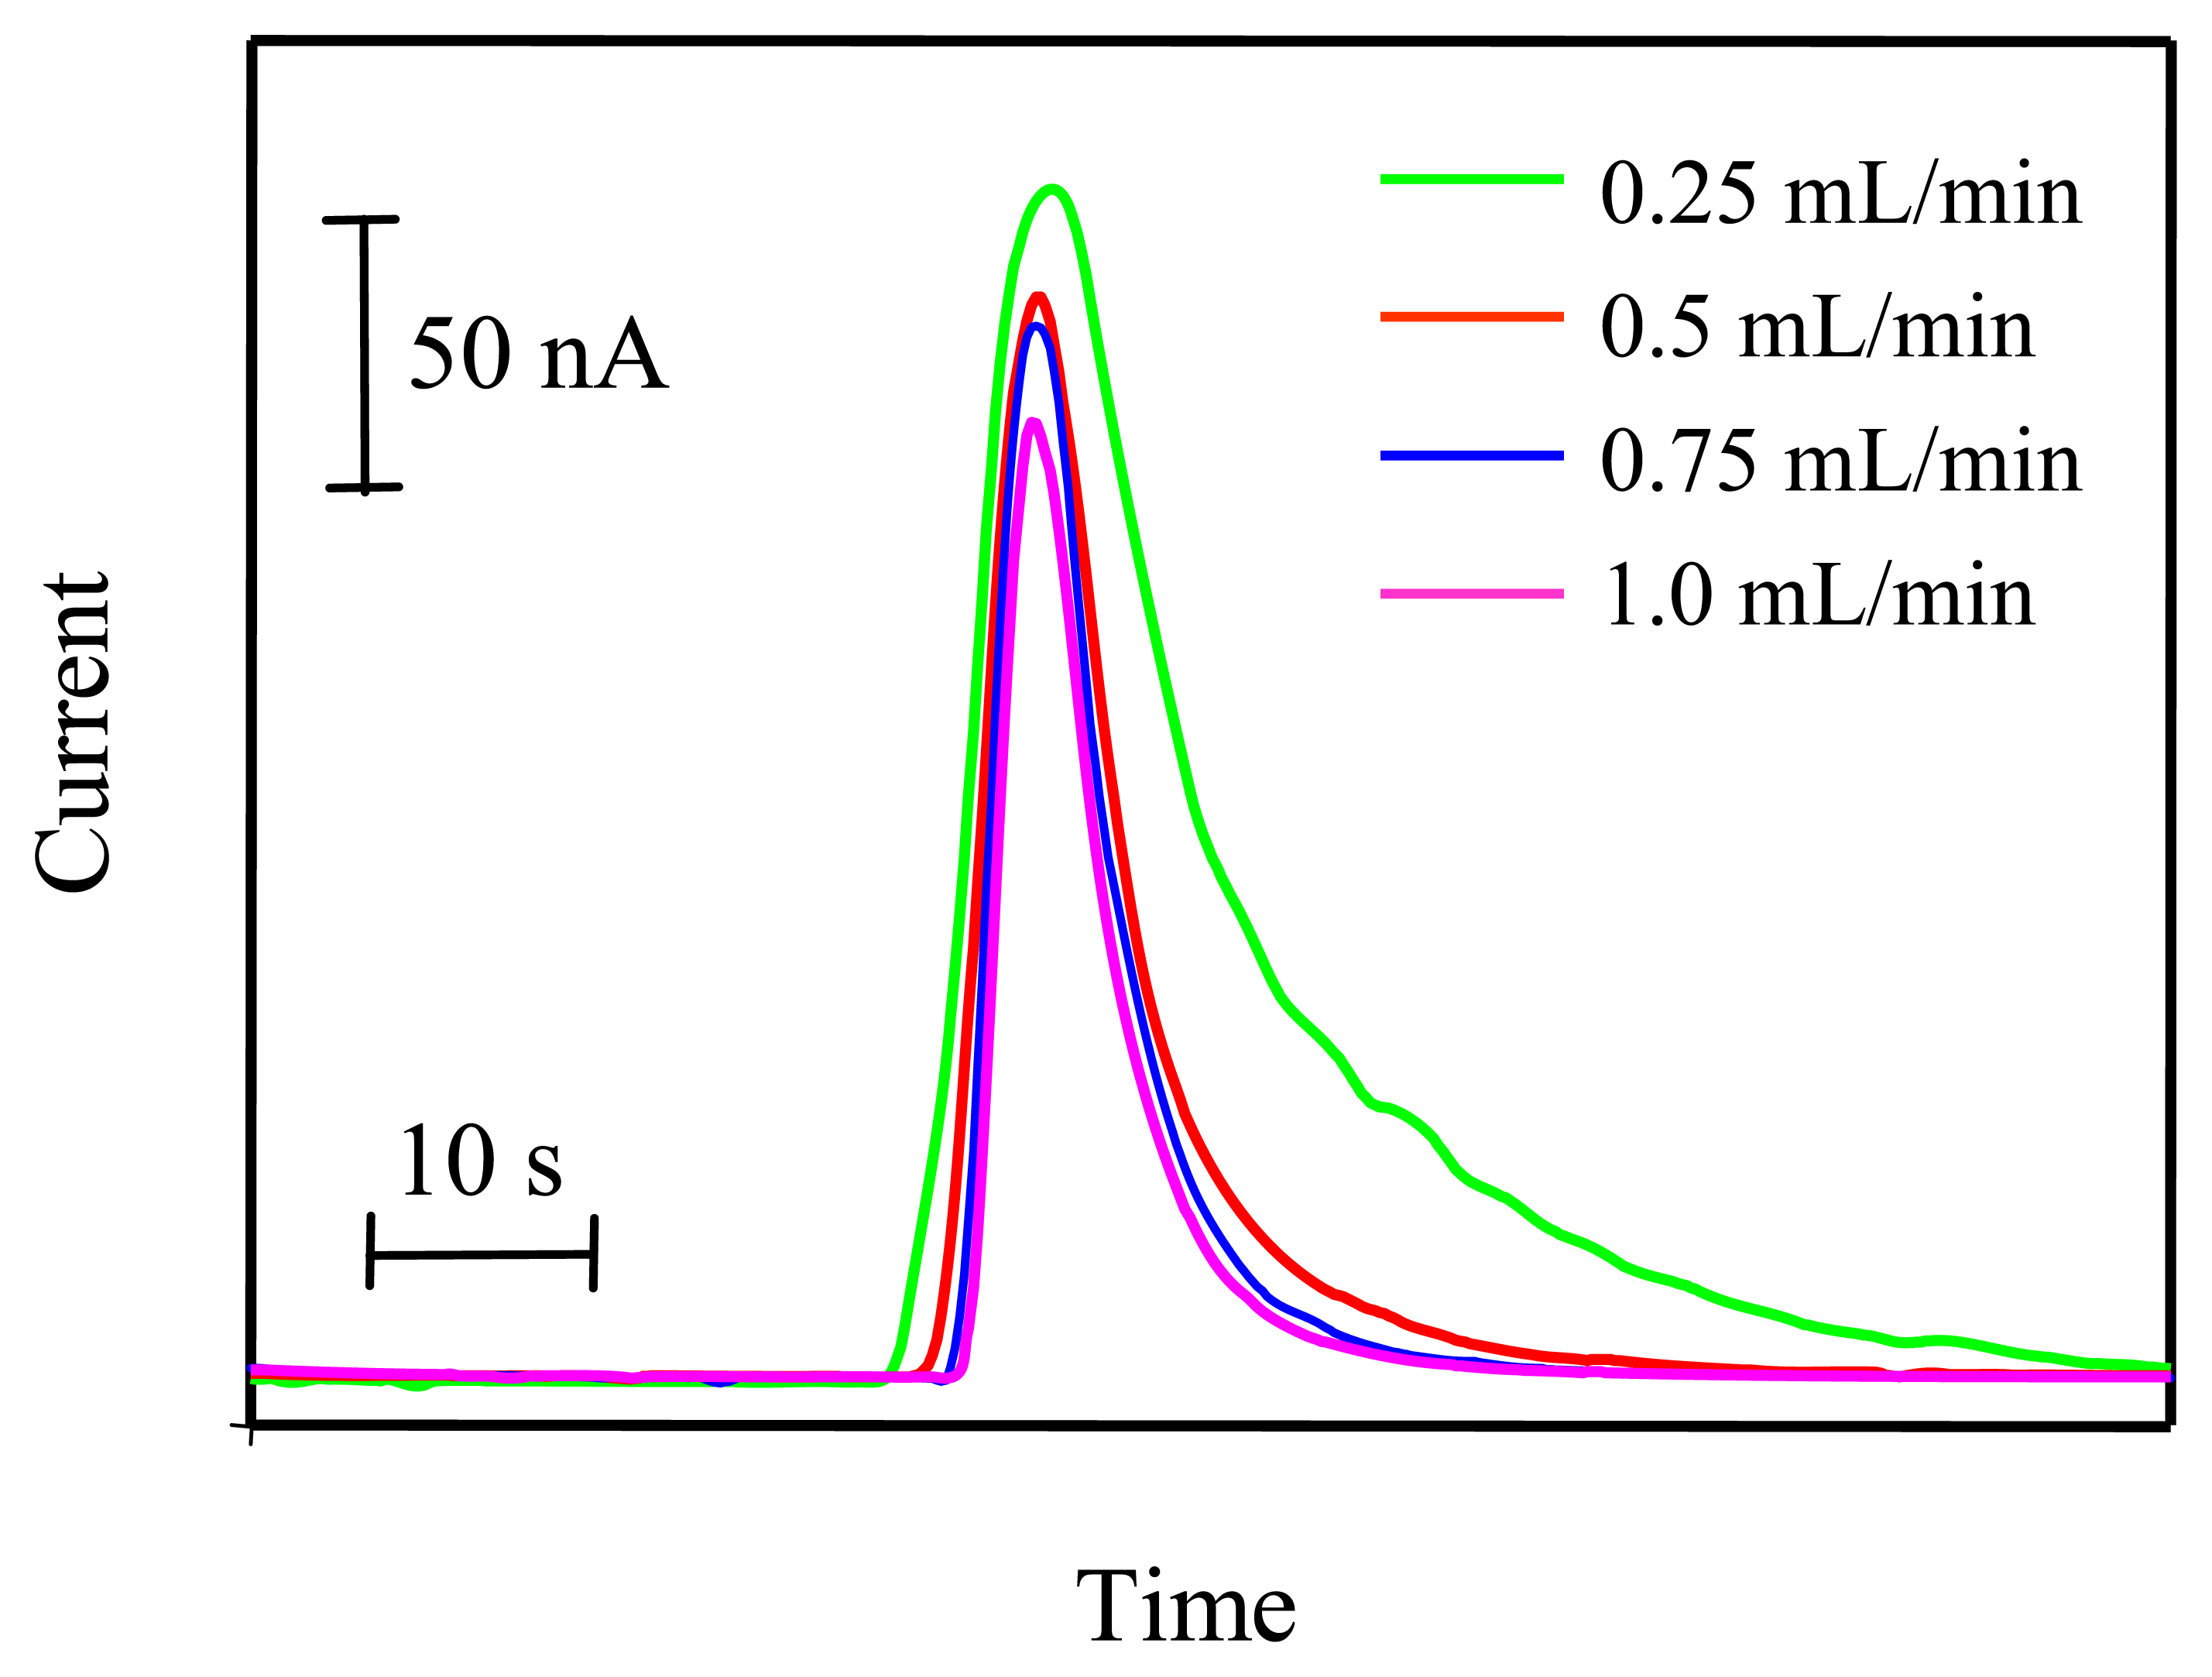
3.4. Optimization of SIA parameters
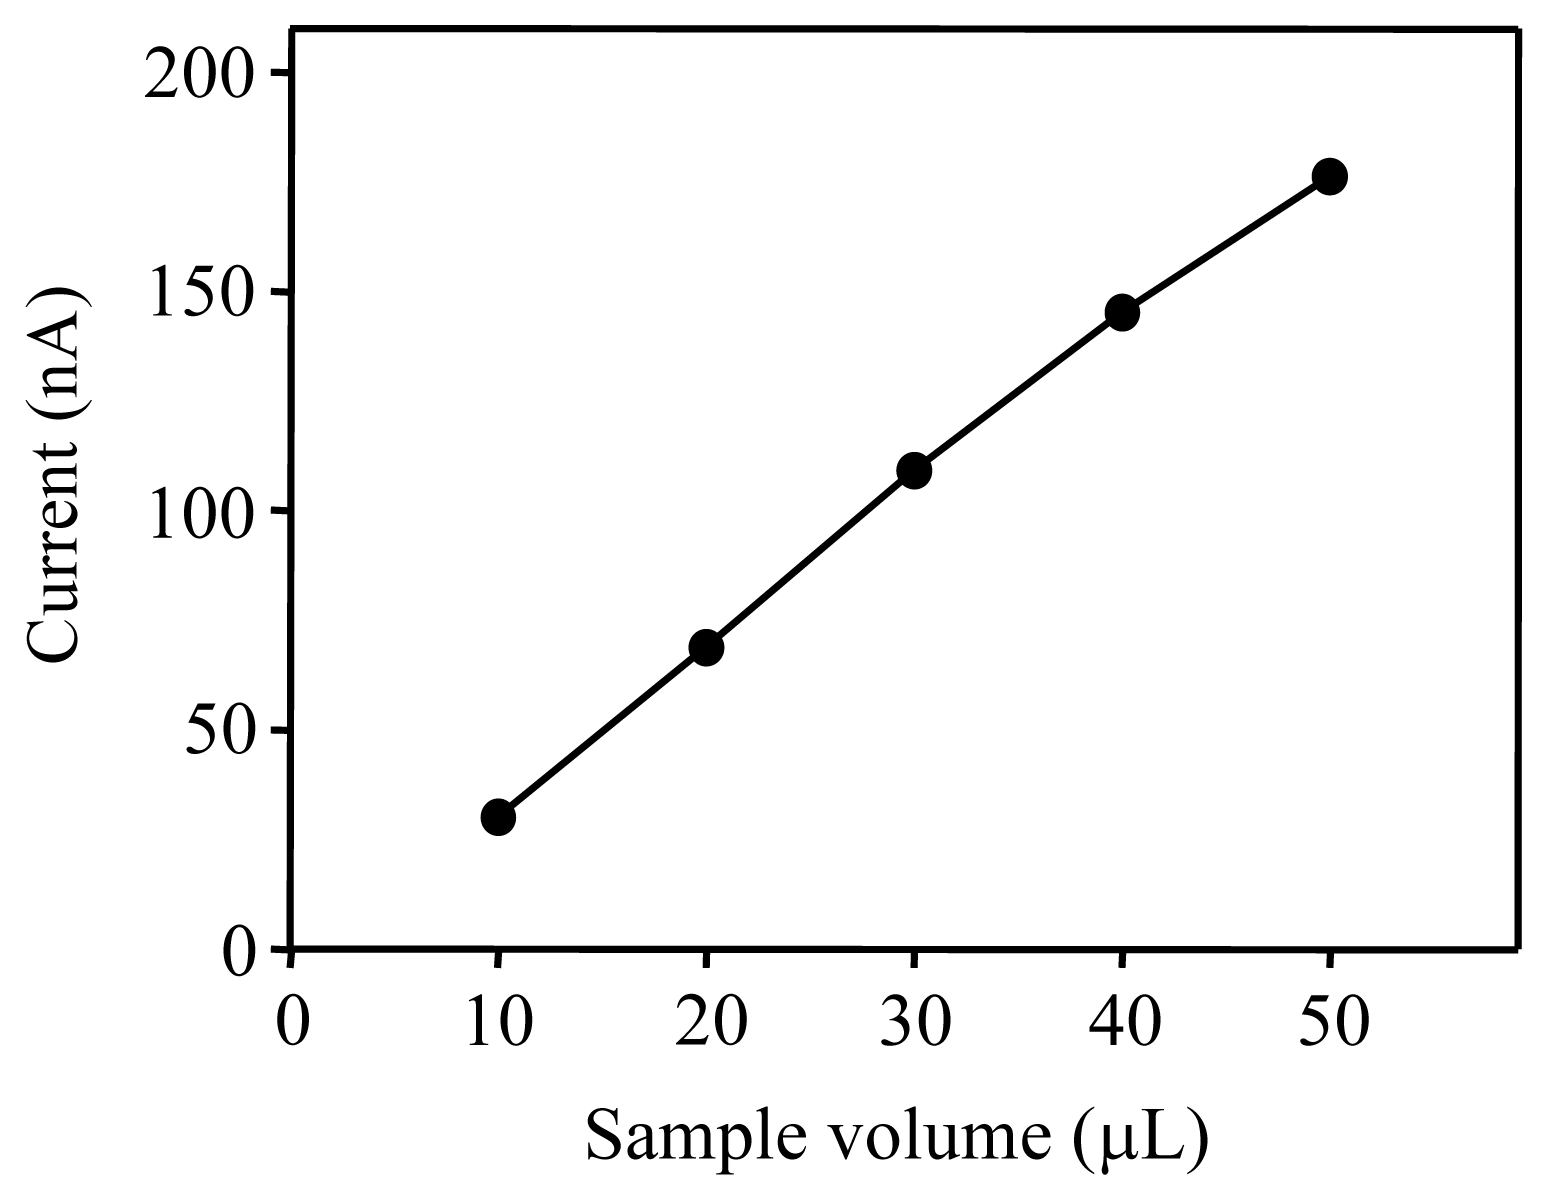
3.5. Influence of sample volume
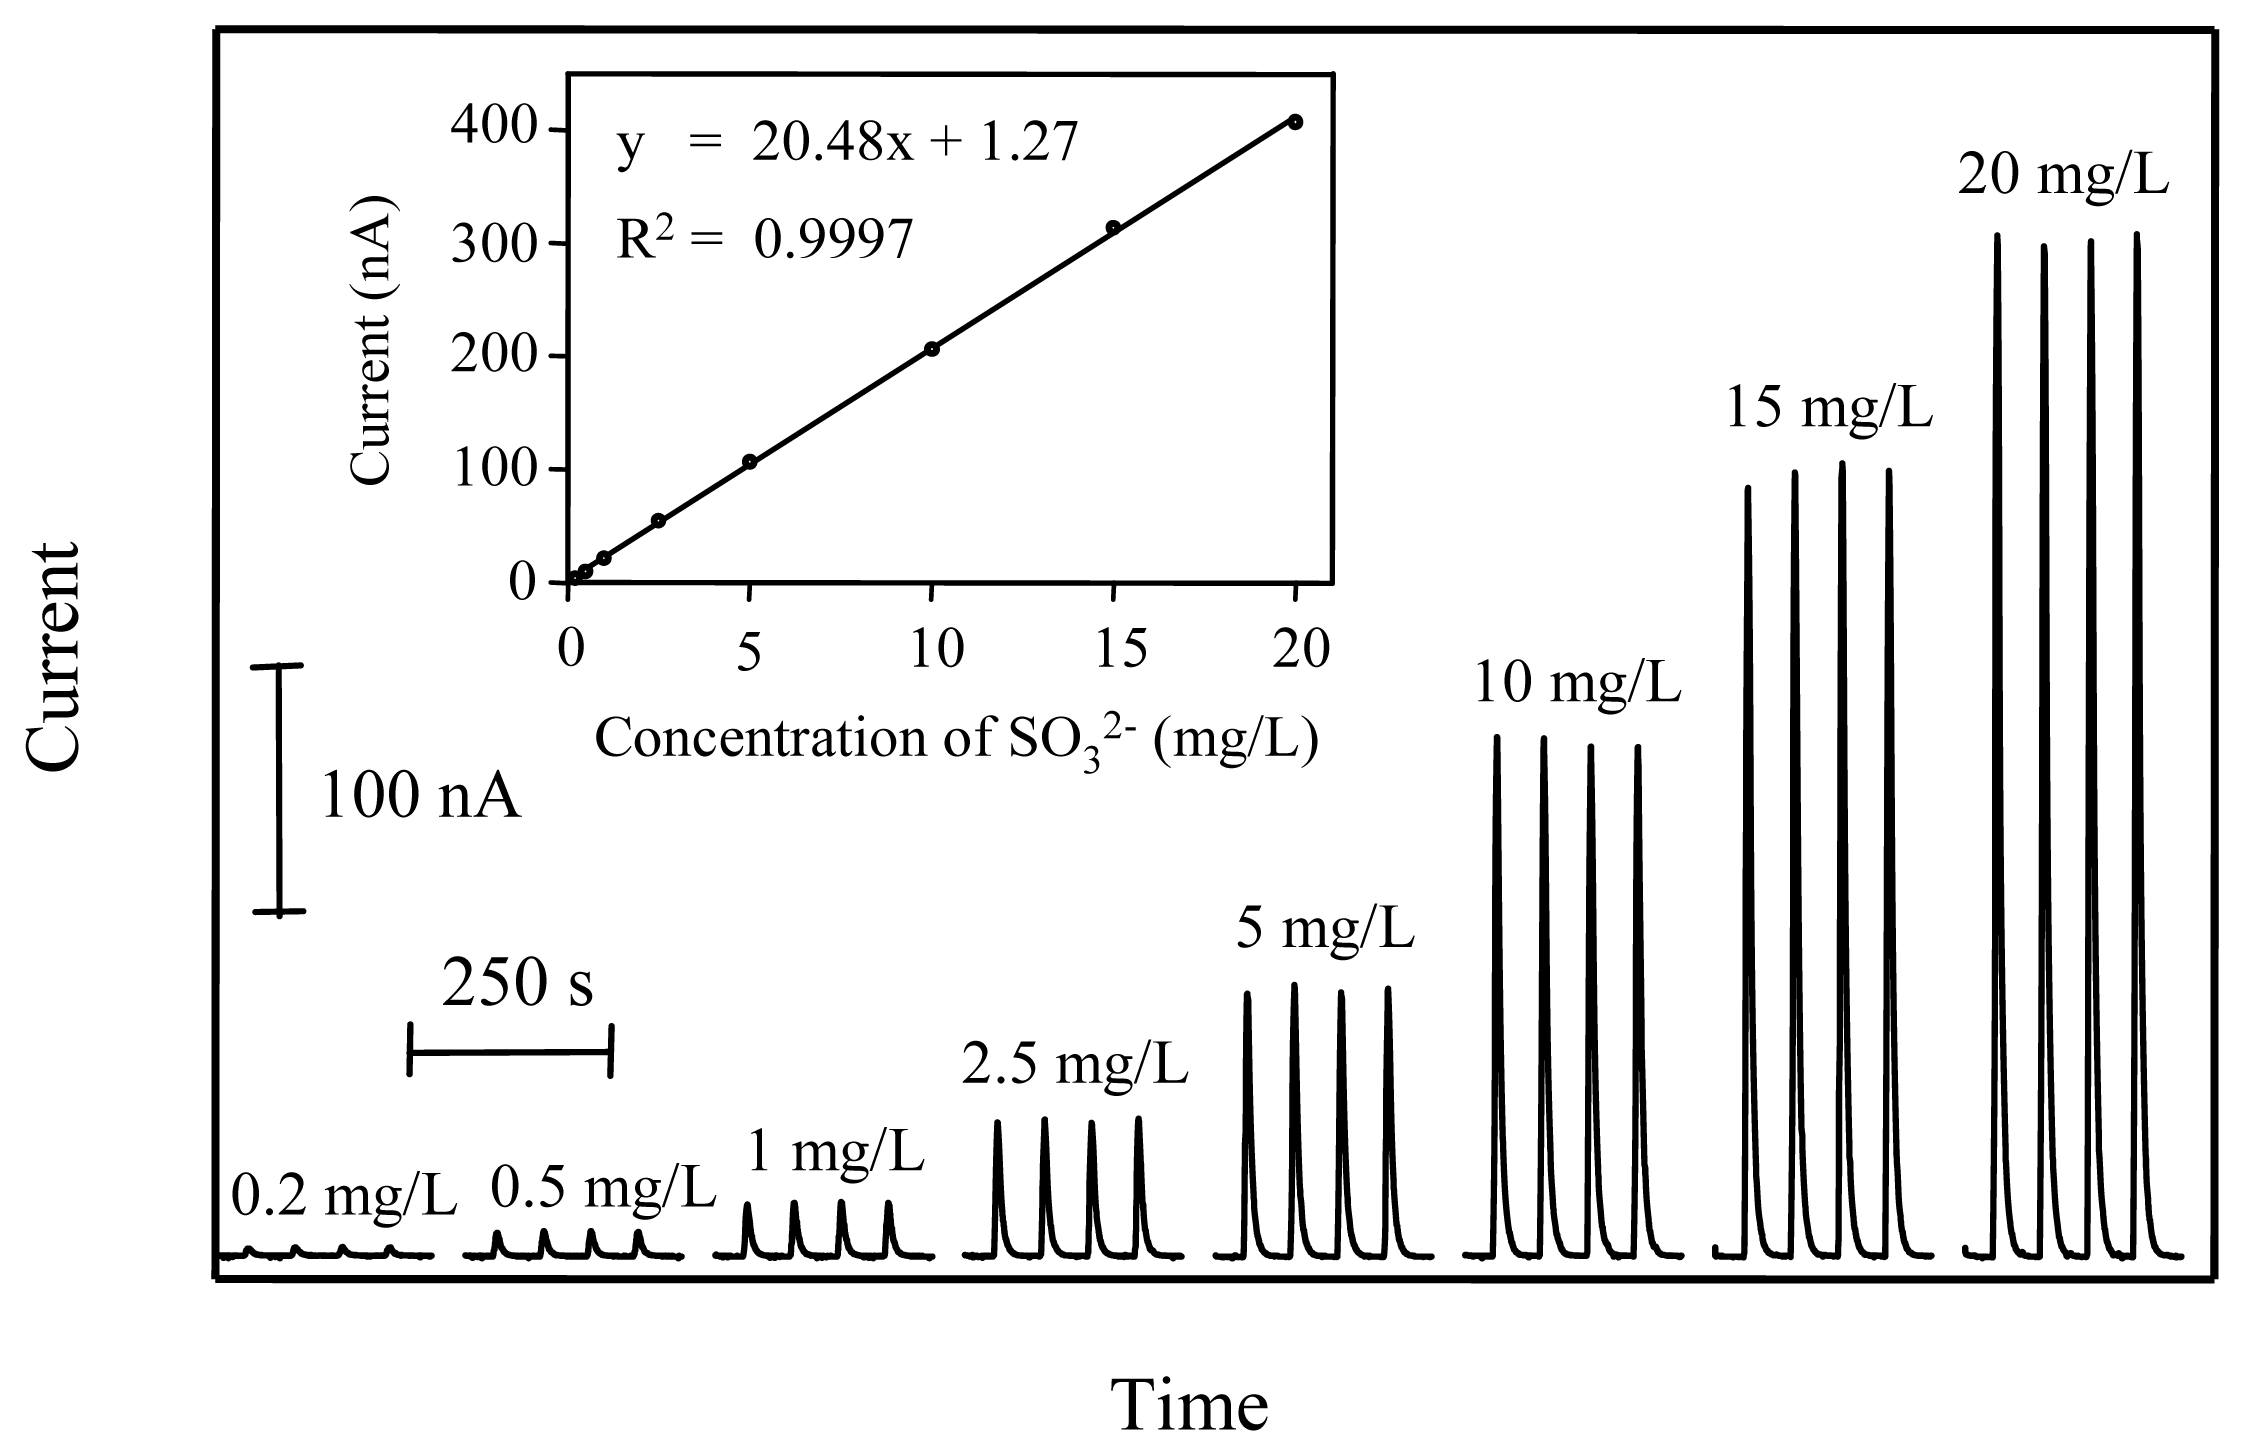
3.6. Standard curve and detection limit
3.7. Determination of sulfite in wine samples
4. Conclusions
Acknowledgments
References
- Iland, P.; Ewart, A.; Sitters, J. Techniques for Chemical Analysis and Stability Tests of Grape Juice and Wine; Patrick Iland Wine Promotions: South Australia, 1993; p. 28. [Google Scholar]
- Official Method 990.28. Official Methods of Analysis of AOAC International; AOAC International: Gaithersburg, MD, 2000; Chapter 47; pp. 29–30. [Google Scholar]
- Li, Y.; Zhao, M. Simple methods for rapid determination of sulfite in food products. Food Control 2006, 17, 975–980. [Google Scholar]
- Yang, X.F.; Guo, X.Q.; Zhao, Y.B. Novel spectrofluorimetric method for the determination of sulfite with rhodamine B hydrazide in a micellar medium. Anal. Chim. Acta 2002, 456, 121–128. [Google Scholar]
- Meng, H.; Wu, F.; He, Z.; Zeng, Y. Chemiluminescence determination of sulfite in sugar and sulfur dioxide in air using Tris(2,2′-bipyridyl)ruthenium(II)-permanganate system. Talanta 1999, 48, 571–577. [Google Scholar]
- Pournaghi-Azar, M.H.; Hydarpour, M.; Dastangoo, H. Voltammetric and amperometric determination of sulfite using an aluminum electrode modified by nickel pentacyanonitrosylferrate film: Application to the analysis of some real samples. Anal. Chim. Acta 2003, 497, 133–141. [Google Scholar]
- Garcia, T.; Casero, E.; Lorenzo, E.; Pariente, F. Electrochemical sensor for sulfite determination based on iron hexacyanoferrate film modified electrodes. Sens. Actuat. B 2005, 106, 803–809. [Google Scholar]
- Pizzoferrato, L.; Di Lullo, G.; Quattrucci, E. Determination of free, bound and total sulphites in foods by indirect photometry-HPLC. Food Chem. 1998, 63, 275–279. [Google Scholar]
- Jankovskiene, G.; Daunoravicius, Z.; Padarauskas, A. Capillary electrophoretic determination of sulfite using the zone-passing technique of in-capillary derivatization. J. Chromatogr. A 2001, 934, 67–73. [Google Scholar]
- Adeloju, S.B.; Barisci, J.N.; Wallace, G.G. Electroimmobilisation of sulphite oxidase into a polypyrrole film and its utilisation for flow amperometric detection of sulphite. Anal. Chim. Acta 1996, 332, 145–153. [Google Scholar]
- Wu, F.W.; He, Z.K.; Meng, H.; Zeng, Y. Determination of sulfite in sugar and sulfur dioxide in air by chemiluminescence using the Ru(bipy)3(2+)-KBrO3 system. Analyst 1998, 123, 2109–2112. [Google Scholar]
- Zheng, X.; Zhang, Z. Flow-injection chemiluminescence detecting sulfite with in situ electrogenerated Mn3+ as the oxidant. Sens. Actuat. B 2002, 84, 142–147. [Google Scholar]
- Segundo, M.A.; Rangel, A.O.S.S. A gas diffusion sequential injection system for the determination of sulphur dioxide in wines. Anal. Chim. Acta 2001, 427, 279–286. [Google Scholar]
- Kass, M.; Ivaska, A. Spectrophotometric determination of sulphur dioxide and hydrogen sulphide in gas phase by sequential injection analysis technique. Anal. Chim. Acta 2001, 449, 189–197. [Google Scholar]
- Lin, J.M.; Hobo, T. Flow-injection analysis with chemiluminescent detection of sulphite using Na2CO3---NaHCO3-Cu2+ system. Anal. Chim. Acta 1996, 323, 69–74. [Google Scholar]
- Decnop-Weever, L.G.; Kraak, J.C. Determination of sulphite in wines by gas-diffusion flow injection analysis utilizing spectrophotometric pH-detection. Anal. Chim. Acta 1997, 337, 125–131. [Google Scholar]
- Cardwell, T.J.; Christophersen, M.J. Determination of sulfur dioxide and ascorbic acid in beverages using a dual channel flow injection electrochemical detection system. Anal. Chim. Acta 2000, 416, 105–110. [Google Scholar]
- Bonifacio, R.L.; Coichev, N. Chemiluminescent determination of sulfite traces based on the induced oxidation of Ni(II)/tetraglycine complex by oxygen in the presence of luminol: mechanistic considerations. Anal. Chim. Acta 2004, 517, 125–130. [Google Scholar]
- Araujo, C.S.T.; de Carvalho, J.L.; Mota, D.R.; de Araujo, C.L.; Coelho, N.M.M. Determination of sulphite and acetic acid in foods by gas permeation flow injection analysis. Food Chem. 2005, 92, 765–770. [Google Scholar]
- Fatibello-Filho, O.; da Cruz Vieira, I. Flow injection spectrophotometric determination of sulfite using a crude extract of sweet potato root (Ipomoea batatas (L.) Lam.) as a source of polyphenol oxidase. Anal. Chim. Acta 1997, 354, 51–57. [Google Scholar]
- Safavi, A.; Haghighi, B. Flow injection analysis of sulphite by gas-phase molecular absorption UV/VIS spectrophotometry. Talanta 1997, 44, 1009–1016. [Google Scholar]
- Mana, H.; Spohn, U. Sensitive and selective flow injection analysis of hydrogen sulfite/sulfur dioxide by fluorescence detection with and without membrane separation by gas diffusion. Anal. Chem. 2001, 73, 3187–3192. [Google Scholar]
- Huang, Y.; Zhang, C.; Zhang, X.; Zhang, Z. Chemiluminescence of sulfite based on auto-oxidation sensitized by rhodamine 6G. Anal. Chim. Acta 1999, 391, 95–100. [Google Scholar]
- Li, B.; Zhang, Z.; Wu, M. Flow-injection chemiluminescence determination of sulfite using online electrogenerated silver(II) as the oxidant. Anal. Chim. Acta 2001, 432, 311–316. [Google Scholar]
- Azevedo, C.M.N.; Araki, K.; Toma, H.E.; Angnes, L. Determination of sulfur dioxide in wines by gas-diffusion flow injection analysis utilizing modified electrodes with electrostatically assembled films of tetraruthenated porphyrin. Anal. Chim. Acta 1999, 387, 175–180. [Google Scholar]
- Carballo, R.; Dall'Orto, V.C.; Lo Balbo, A.; Rezzano, I. Determination of sulfite by flow injection analysis using a poly[Ni-(protoporphyrin IX)] chemically modified electrode. Sens. Actuat. B 2003, 88, 155–161. [Google Scholar]
- Spataru, N.; Sarada, B.V.; Tryk, D.A.; Fujishima, A. Anodic voltammetry of xanthine, theophylline, theobromine and caffeine at conductive diamond electrodes and its analytical application. Electroanalysis 2002, 14, 721–728. [Google Scholar]
- Rao, T.N.; Loo, B.H.; Sarada, B.V.; Terashima, C.; Fujishima, A. Electrochemical detection of carbamate pesticides at conductive diamond electrodes. Anal. Chem. 2002, 74, 1578–1583. [Google Scholar]
- Tsai, Y.C.; Coles, B.A.; Holt, K.; Foord, J.S.; Marken, F.; Compton, R.G. Microwave-enhanced anodic stripping detection of lead in a river sediment sample. A mercury-free procedure employing a boron-doped diamond electrode. Electroanalysis 2001, 13, 831–835. [Google Scholar]


| Step | Operation | Valve of pump | Port of selection valve | Volume (μL) | Flow rate (μL/s) |
|---|---|---|---|---|---|
| 1 | Aspirate water to syringe pump | in | – | 600 | 100 |
| 2 | Aspirate 2 M H2SO4 to holding coil | out | 1 | 100 | 50 |
| 3 | Aspirate standard/sample to holding coil | out | 2 | 50 | 50 |
| 4 | Dispense mixture to donor channel of GDU | out | 4 | 750 | 25 |
| Sample | Free SO2(mg/L)a | Total SO2(mg/L)a | ||
|---|---|---|---|---|
| SIA method | Titration method | SIA method | Titration method | |
| White wine 1 | 11.2 ± 0.3 | 11.9 ± 0.4 | 48.7 ± 0.9 | 47.5 ± 1.9 |
| White wine 2 | 24.1 ± 0.3 | 22.2 ± 0.4 | 102.4 ± 1.1 | 105.8 ± 0.9 |
| Red wine 1 | 11.9 ± 0.2 | 11.7 ± 0.4 | 55.2 ± 0.8 | 58.3 ± 0.9 |
| Red wine 2 | 5.1 ± 0.1 | 5.3 ± 0.4 | 32.6 ± 1.3 | 31.8 ± 1.6 |
© 2008 by MDPI Reproduction is permitted for noncommercial purposes.
Share and Cite
Chinvongamorn, C.; Pinwattana, K.; Praphairaksit, N.; Imato, T.; Chailapakul, O. Amperometric Determination of Sulfite by Gas Diffusion- Sequential Injection with Boron-Doped Diamond Electrode. Sensors 2008, 8, 1846-1857. https://doi.org/10.3390/s8031846
Chinvongamorn C, Pinwattana K, Praphairaksit N, Imato T, Chailapakul O. Amperometric Determination of Sulfite by Gas Diffusion- Sequential Injection with Boron-Doped Diamond Electrode. Sensors. 2008; 8(3):1846-1857. https://doi.org/10.3390/s8031846
Chicago/Turabian StyleChinvongamorn, Chakorn, Kulwadee Pinwattana, Narong Praphairaksit, Toshihiko Imato, and Orawon Chailapakul. 2008. "Amperometric Determination of Sulfite by Gas Diffusion- Sequential Injection with Boron-Doped Diamond Electrode" Sensors 8, no. 3: 1846-1857. https://doi.org/10.3390/s8031846