Heavy Metal Concentrations in Soils and Factors Affecting Metal Uptake by Plants in the Vicinity of a Korean Cu-W Mine

Department of Earth and Environmental Sciences, College of Natural Sciences, Sejong University, Seoul, 143-747, Korea
Sensors 2008, 8(4), 2413-2423; https://doi.org/10.3390/s8042413
Submission received: 11 March 2008
/
Accepted: 1 April 2008
/
Published: 4 April 2008
Abstract
:Heavy metal concentrations were measured in soils and plants in and around a copper-tungsten mine in southeast Korea to investigate the influence of past base metal mining on the surface environment. The results of chemical analysis indicate that the heavy metals in soils decreased with distance from the source, controlled mainly by water movement and topography. The metal concentrations measured in plant species generally decreased in the order; spring onions > soybean leaves > perilla leaves ≈ red pepper > corn grains ≈ jujube grains, although this pattern varied moderately between different elements. The results agree with other reports that metal concentrations in leaves are usually much higher than those in grain. Factors influencing the bioavailability of metals and their occurrences in crops were found as soil pH, cation exchange capacity, organic matter content, soil texture, and interaction among the target elements. It is concluded that total metal concentrations in soils are the main controls on their contents in plants. Soil pH was also an important factor. A stepwise linear multiple regression analysis was also conducted to identify the dominant factors influencing metal uptake by plants. Metal concentrations in plants were also estimated by computer-aided statistical methods.
1. Introduction
Heavy metals are released into the environment by both natural and anthropogenic sources. With the exception of soils derived from the physical and chemical weathering of parent materials containing elevated levels of trace elements (e.g. black shales and basic igneous rocks), the presence of elevated metal concentrations in the environment is related to man's activities [1-4].
Mining, smelting, and the associated activities are one of important sources by which soils, plants, and surface waters are contaminated. In addition, there may also be safety risks for people working in mines and smelters or for those living close by with the risk of habitat destruction. For example, soils totalling 4,000 km2 or more have been contaminated by heavy metals in the vicinity of mining and smelting areas in England and Wales, [5]. It is estimated that the median values of worldwide emissions of Cd, Cu, Pb, and Zn into soils were 22, 954, 796 and 1,372 106 kg yr−1, respectively; more than half of those metals were associated with base metal mining and smelting activities [6].
Numerous studies regarding metal contamination in metalliferous mining and smelting areas have been carried out in the United Kingdom [7-9], in the United States [10] and in other countries. Although there is a long history of mining in Korea, limited studies have been undertaken to deal with heavy metal contamination from mining [2, 4, 11-12].
The present study focuses on metal dispersion and environmental impacts of heavy metals in soils and plants in the vicinity of the Dalsung copper-tungsten mine located in southeast Korea. The site is one of the biggest Cu mines in Korea with a maximum production in the 1960s. During the period of active operation, the mine produced 5 to 10 % of the total Cu output of Korea. The geology of the site is greatly influenced by volcanic activities; as a consequence, it is composed of quartz-monzonite, andesitic breccia, andesite porphyry and partly volcanic rocks (such as rhyolite, volcanic ashes and tuff) [13]. The ore minerals of the mine, classified as a hydrothermal replacement type embedded in breccia pipe consist of chalcopyrite (CuFeS2) and wolframite ((Fe.Mn)WO4) associated with bismuthinite (Bi2S3) and pyrite (FeS2). The mine stopped its production in 1973. It was suggested to construct concrete bays to reduce the discharge of heavy metals downstream from the mine dump; mine reclamation work with soil-topping method was adapted in 2002 [12]. Nevertheless, the mine dump with enhanced metal contents has been discharged downstream which may adversely influence crops growing on the surrounding land. As local residents consume these crop plants continuously, this may possibly have adverse impacts on human health.
The objective of this study is to investigate the influence of this base metal mining and associated waste materials on heavy metal contamination of soils and crop plants. This study will contribute to the knowledge required to resolve practically environmental problems in mining areas, where metal contamination may adversely influence crops, animal and human health.
2. Methodology
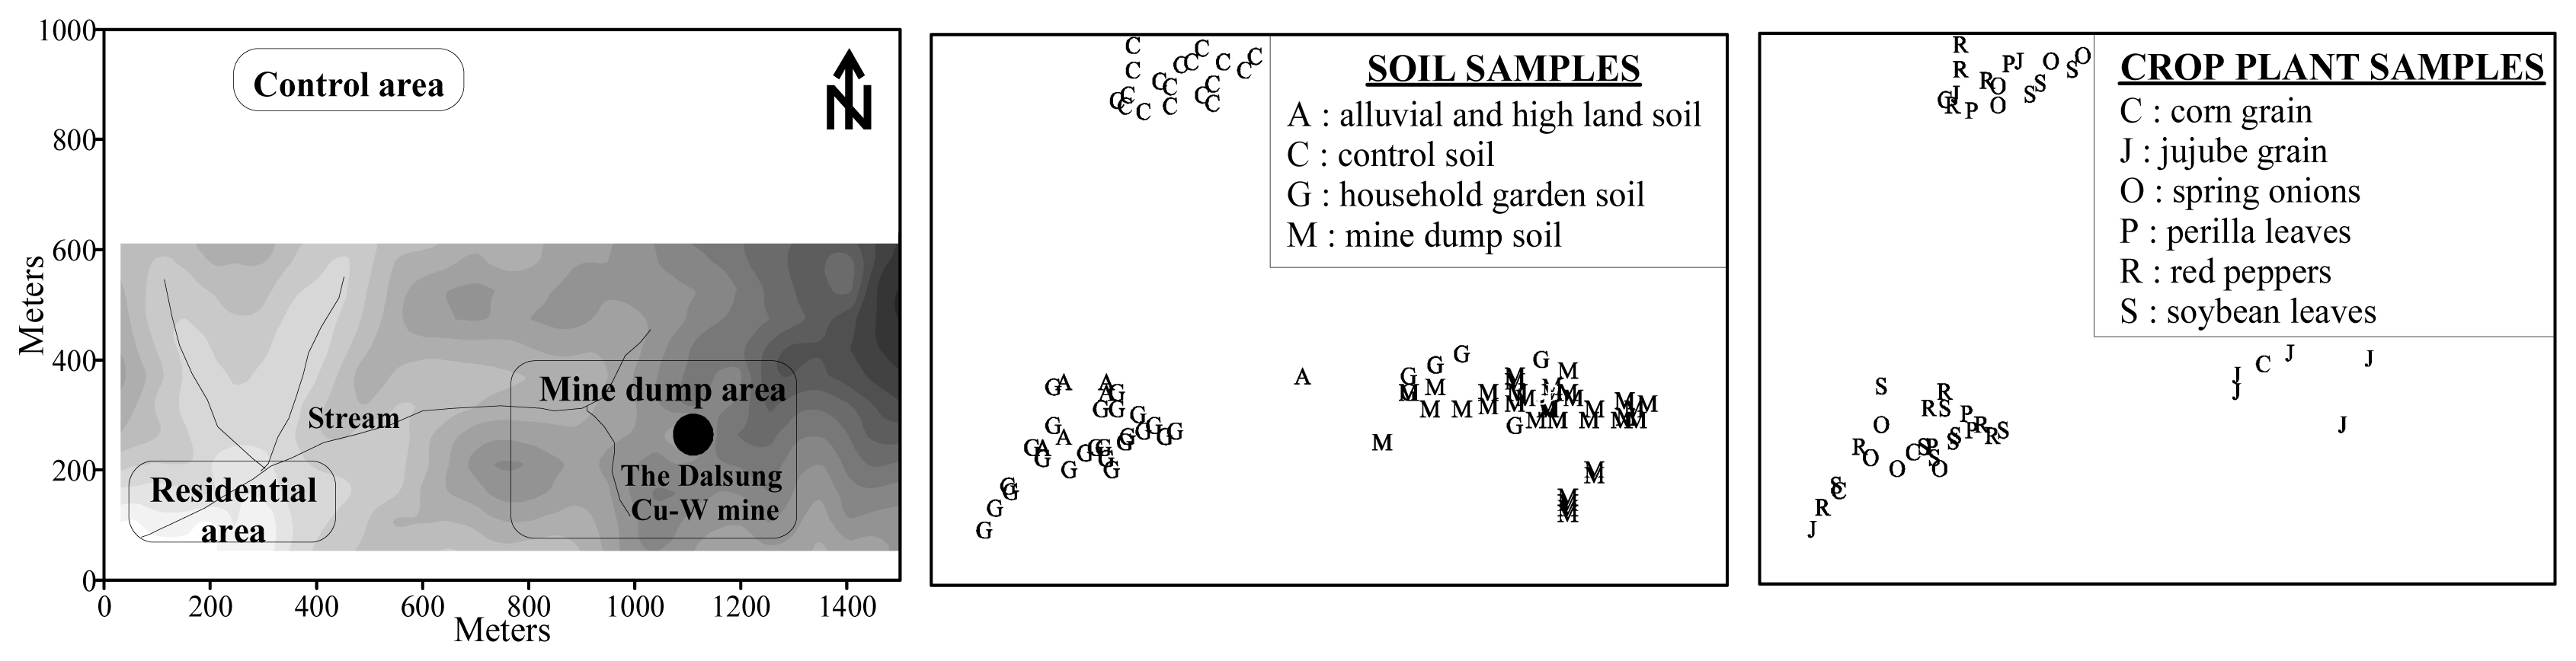
Surface soil samples (0-15 cm depth) were taken by hand auger (2.5 cm diameter) from the mine dump, uncultivated upland and alluvial soils, household gardens, and a nearby control area (Figure 1). Each surface soil sample comprised a composite of nine subsamples collected from a 1 × 1 metre square. Random samples of plants were taken from each site growing within the mine dump areas and household gardens including corn grain (Zea mays), jujube grain (Zizyphus jujuba), perilla leaves (P. frutescens var. japonica), red pepper (Capsicum annuum), soybean leaves (Glycine max) and spring onions (Allium cepa). Soils were dried in an air-circulating oven at 25 °C and sieved to 10 mesh (< 2 mm). After quartering, the samples were ground to 80 mesh (< 180 μm) in a mortar. Plant samples were washed in tap water and deionised water vigorously, dried in an air-circulating oven at 25°C, milled in a herbage mill, and repackaged in sealed plastic bags.
After this preparation stage, soils were digested in 4:1 ratio of concentrated nitric and perchloric acids and taken to dryness. The residue was then leached with 5M hydrochloric acid and finally diluted to 1M HCl. The samples were analysed for a multi-element suite including Cd, Cu, Pb and Zn by Inductively Coupled Plasma Atomic Emission Spectrometry [14]. Plant samples were digested in fuming nitric acid followed by concentrated perchloric acid, leached with the same procedure as that used for soil and analysed by ICP-AES [14].
The soil pH was measured using a 2.5:1 ratio of deionised water to soil sample. In addition, loss-on-ignition [15] and cation exchange capacity [16] were measured. For statistical examination of the data, the “MINITAB” statistics package was used. A rigorous quality control programme assesses the accuracy and precision of the chemical data. This programme included reagent blanks, duplicate samples, certified reference materials and in-house reference materials [17]. Comparisons of Cd, Cu, Pb and Zn concentrations in reagent blanks with their instrumental and analytical detection limit for soils and plants are shown in Table 1. In addition, comparisons between observed and recommended concentrations of metals in international certified materials are summarized in Table 2.
3. Results
3.1. Heavy metal concentrations in surface soils and their characteristics
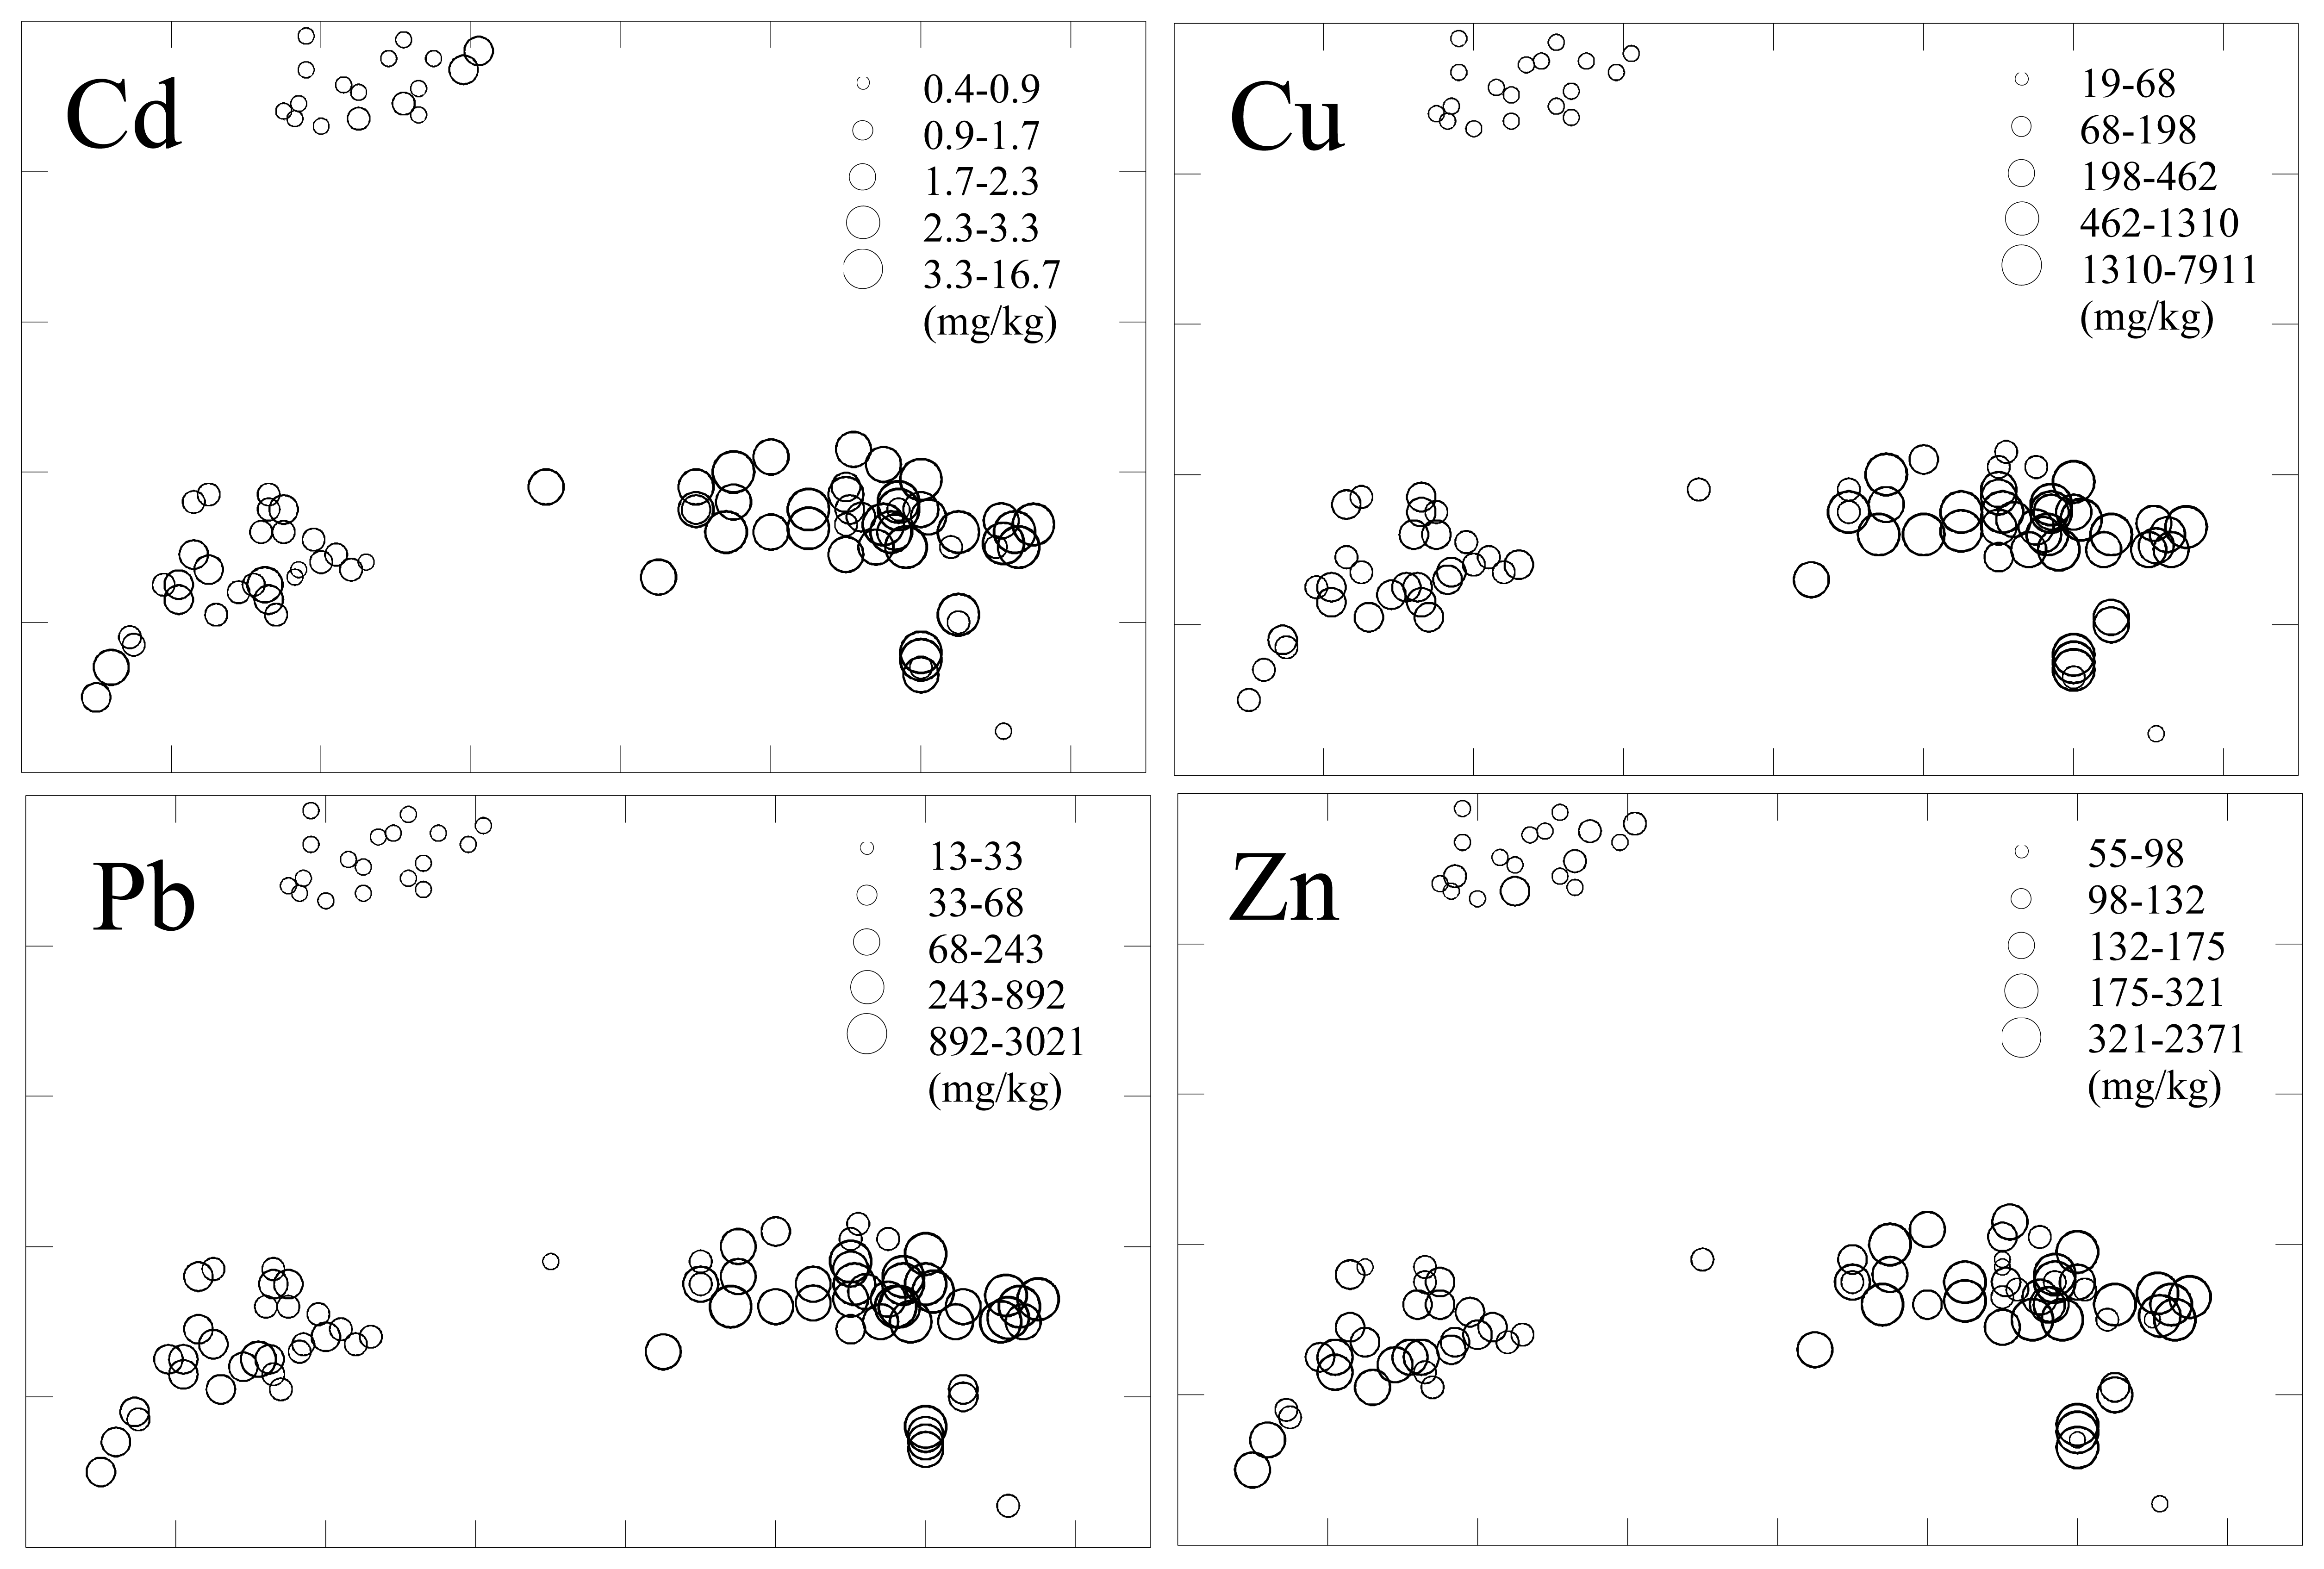
The range and mean concentrations of Cd, Cu, Pb and Zn in surface soils sampled in and around the mine are summarized in Table 3. The mean value for Cd in surface soils taken in the mine dump sites is 4.4 μg g−1 with a range from 1.0 to 16.7 μg g−1. Cadmium concentrations in soils sampled from other sites are slightly lower than the dump site, ranging from 0.4 to 5.1 μg g−1. The Cu in surface soils of the mine dump sites ranges from 111 to 7,910 μg g−1 with a mean value of 1,953 μg g−1. Soils samples of both uncultivated and household garden sites (within 1.2 km of the mine) contain similar levels of Cu with mean values of 183 and 269 μg g−1, respectively. However, the concentrations of Cu in the control soils, not influenced by mining, ranged from 19 to 49 μg g−1 which s close to the world average of 30 μg g−1 [18]. The mean value for Pb in the mine dump sites is 1,030 μg g−1 with a range of 146 to 3,020 μg g−1, compared to the mean value for the control counterpart (18 μg g−1), which is similar to the world average of 15 μg g−1 [19]. The mean value for Zn in the mine dump sites (419 μg g−1) with a range from 55-2,370 μg g−1 was significantly higher than that in the control area (97 μg g−1). However, some mine dump soils showed highly elevated levels of Zn with a maximum of 2,370 μg g−1.
The general properties of surface soils in the study area are also described in Table 3. Soil pH in mine dump samples ranged from 3.0 to 5.7 with an average of 4.1. Soil pH sampled from the other sites was around 5.6. Most soils had very low organic matter content, less than 10 % loss-on-ignition. In addition, soils in the mine dump sites had a relatively low cation exchange capacity of 11.5 meq/100g, whilst cultivated soils, including household garden soils and control soils, exhibited a high capacity for cation exchange (23.2 and 30.1 meq/100g, respectively). Most mine dump soils had a sandy texture with small amounts of silt and clay.
3.2. Heavy metal concentrations in plants
The concentrations of Cd, Cu, Pb and Zn in plants grown on soils in and around the mine are summarized in Table 4. The average Cd concentrations in spring onions and some soybean leaves exceeded 1 μg g−1 (DW: dry weight), but those of others were less than 0.5 μg g−1 (DW). In addition, metal concentrations varied with each plant type. Mean Cu levels ranged from 8.9 μg g−1 (DW) in corn grain to 26.4 μg g−1 (DW) in spring onions. Average Pb concentration in plants varied from 0.19 in jujube grain to 4.23 μg g−1 (DW) in spring onions. Soybean leaves and spring onions exhibited elevated Zn levels, with averages of 163 and 256 μg g−1 (DW), respectively. Other plants sampled contain less than 120 μg g−1(DW) of Zn. Heavy metal concentrations of plant samples from a nearby control area were slightly lower than those surrounding the mining area (see also Table 4). For instance, Zn concentrations of spring onions in the household garden near the mine area are 5 times higher than those of the control area.
4. Discussion
4.1. Heavy metals in surface soils
The area covered with mine waste materials including tailings in the study area is approximately 0.1 km2 (85 m × 120 m) with elevated levels of heavy metals. In addition, these materials have a low sorption capacity for metal ions due to their sandy texture, low pH and organic matter content. Thus, heavy metals leaching from the mine dump have been continuously dispersed downstream by water and wind. The peak concentrations of metals were found within 100∼300 metres and decreased with distance from the mine (Figure 2). Alluvial and garden soils downstream of the mine wastes contain more silt and clay sized particles than the wastes with a higher pH, cation exchange capacity and loss-on-ignition. Therefore, metals dispersed from mine wastes are likely to be retained in the lower areas which have usually been used for agriculture or the production of garden crops. In the mine dump materials, it can be expected that the concentrations of Cd, Cu, Pb and Zn increase with depth, possibly due to leaching from the surface under acidic conditions (pH < 4). Thus, mobilization of materials at the surface would also favor downslope dispersion of materials in solution.
4.2. Heavy metals in plants and factors affecting metal uptake by plants
It is well known that concentrations of Cd in edible vegetables range from 0.05 to 0.9 μg g−1 (DW: dry weight) and leafy plants such as lettuce, cabbage, spinach contain relatively higher Cd than grain or fruit plants such as apple, barley, corn, oat and rice [20]. Although Cd concentrations in plants grown on uncontaminated or unmineralized soils generally do not exceed 1.0 μg g−1 (DW) [18, 20], over 1 μg g−1 (DW) has been found in some plant leaves grown on contaminated soils from mining activities [11]. In the study area, the maximum Cd levels of 2.2 μg g−1 (DW) was found in spring onion. Grain samples (corn and jujube), however, contained relatively lower Cd concentrations than leafy samples (spybean and spring onion) (p < 0.05). In addition, ratios of average Cd contents in plants sampled in the mining area to those in the control area ranged from 1.1 in jujube grain to 4.2 in spring onion. Thus, plants grown in the mining area contained high Cd concentrations compared to those in the control area, especially in red peppers, soybean leaves and spring onions (p < 0.05).
Although Cu is essential for plant growth, a very small amount of Cu is required by plants, for example, 5 to 20 μg g−1 (DW) in plant tissue [18]. However, over 20 μg g−1 (DW) can be found in plants from contaminated area, especially plant roots grown in mining and smelting sites [11, 18, 20]. In the study area, average Cu concentrations in plants grown in the mining area ranged from 8.95 μg g−1 (DW) in corn grain to 26.4 μg g−1 (DW) in spring onion. Although no Cu toxicity was found, most plant samples exceeded 20 μg g−1 (DW), with the exception of grain samples.
Plant Pb content is generally very low due to its low bioavailability. Lead concentrations in various plants range from 0.01 to 3.85 μg g−1 (DW), with an average value of 0.05 μg g−1 (DW) [21]. Average concentrations of Pb in plant samples from the mining area ranged from 0.19 μg g−1 (DW) in corn grain to 4.23 μg g−1 (DW) in spring onions. In addition, ratios of mean Pb concentrations in plants sampled in the mining area to those in the control area ranged from 1.2 in jujube grain to 3.2 in red peppers.
Zinc is also one of micronutrients essential for normal plant growth, but only a small amount of Zn is required (25∼150 μg g−1 in dry tissue) [18]. In the study area, the maximum Zn content was found in spring onion with 383 μg g−1 (DW). In comparison with the normal amount of Zn for plant growth (25∼150 μg g−1), soybean leaves and spring onions have concentrations exceeding the range. Other plants, however, usually approximated to normal plant growth. In conclusion, this study confirms that soybean and perilla leaves have more metals than corn and jujube grains. Metal concentrations determined from plant samples of the study area decreased in the order spring onions > soybean leaves > perilla leaves > red pepper > corn grain ≈ jujube grain.
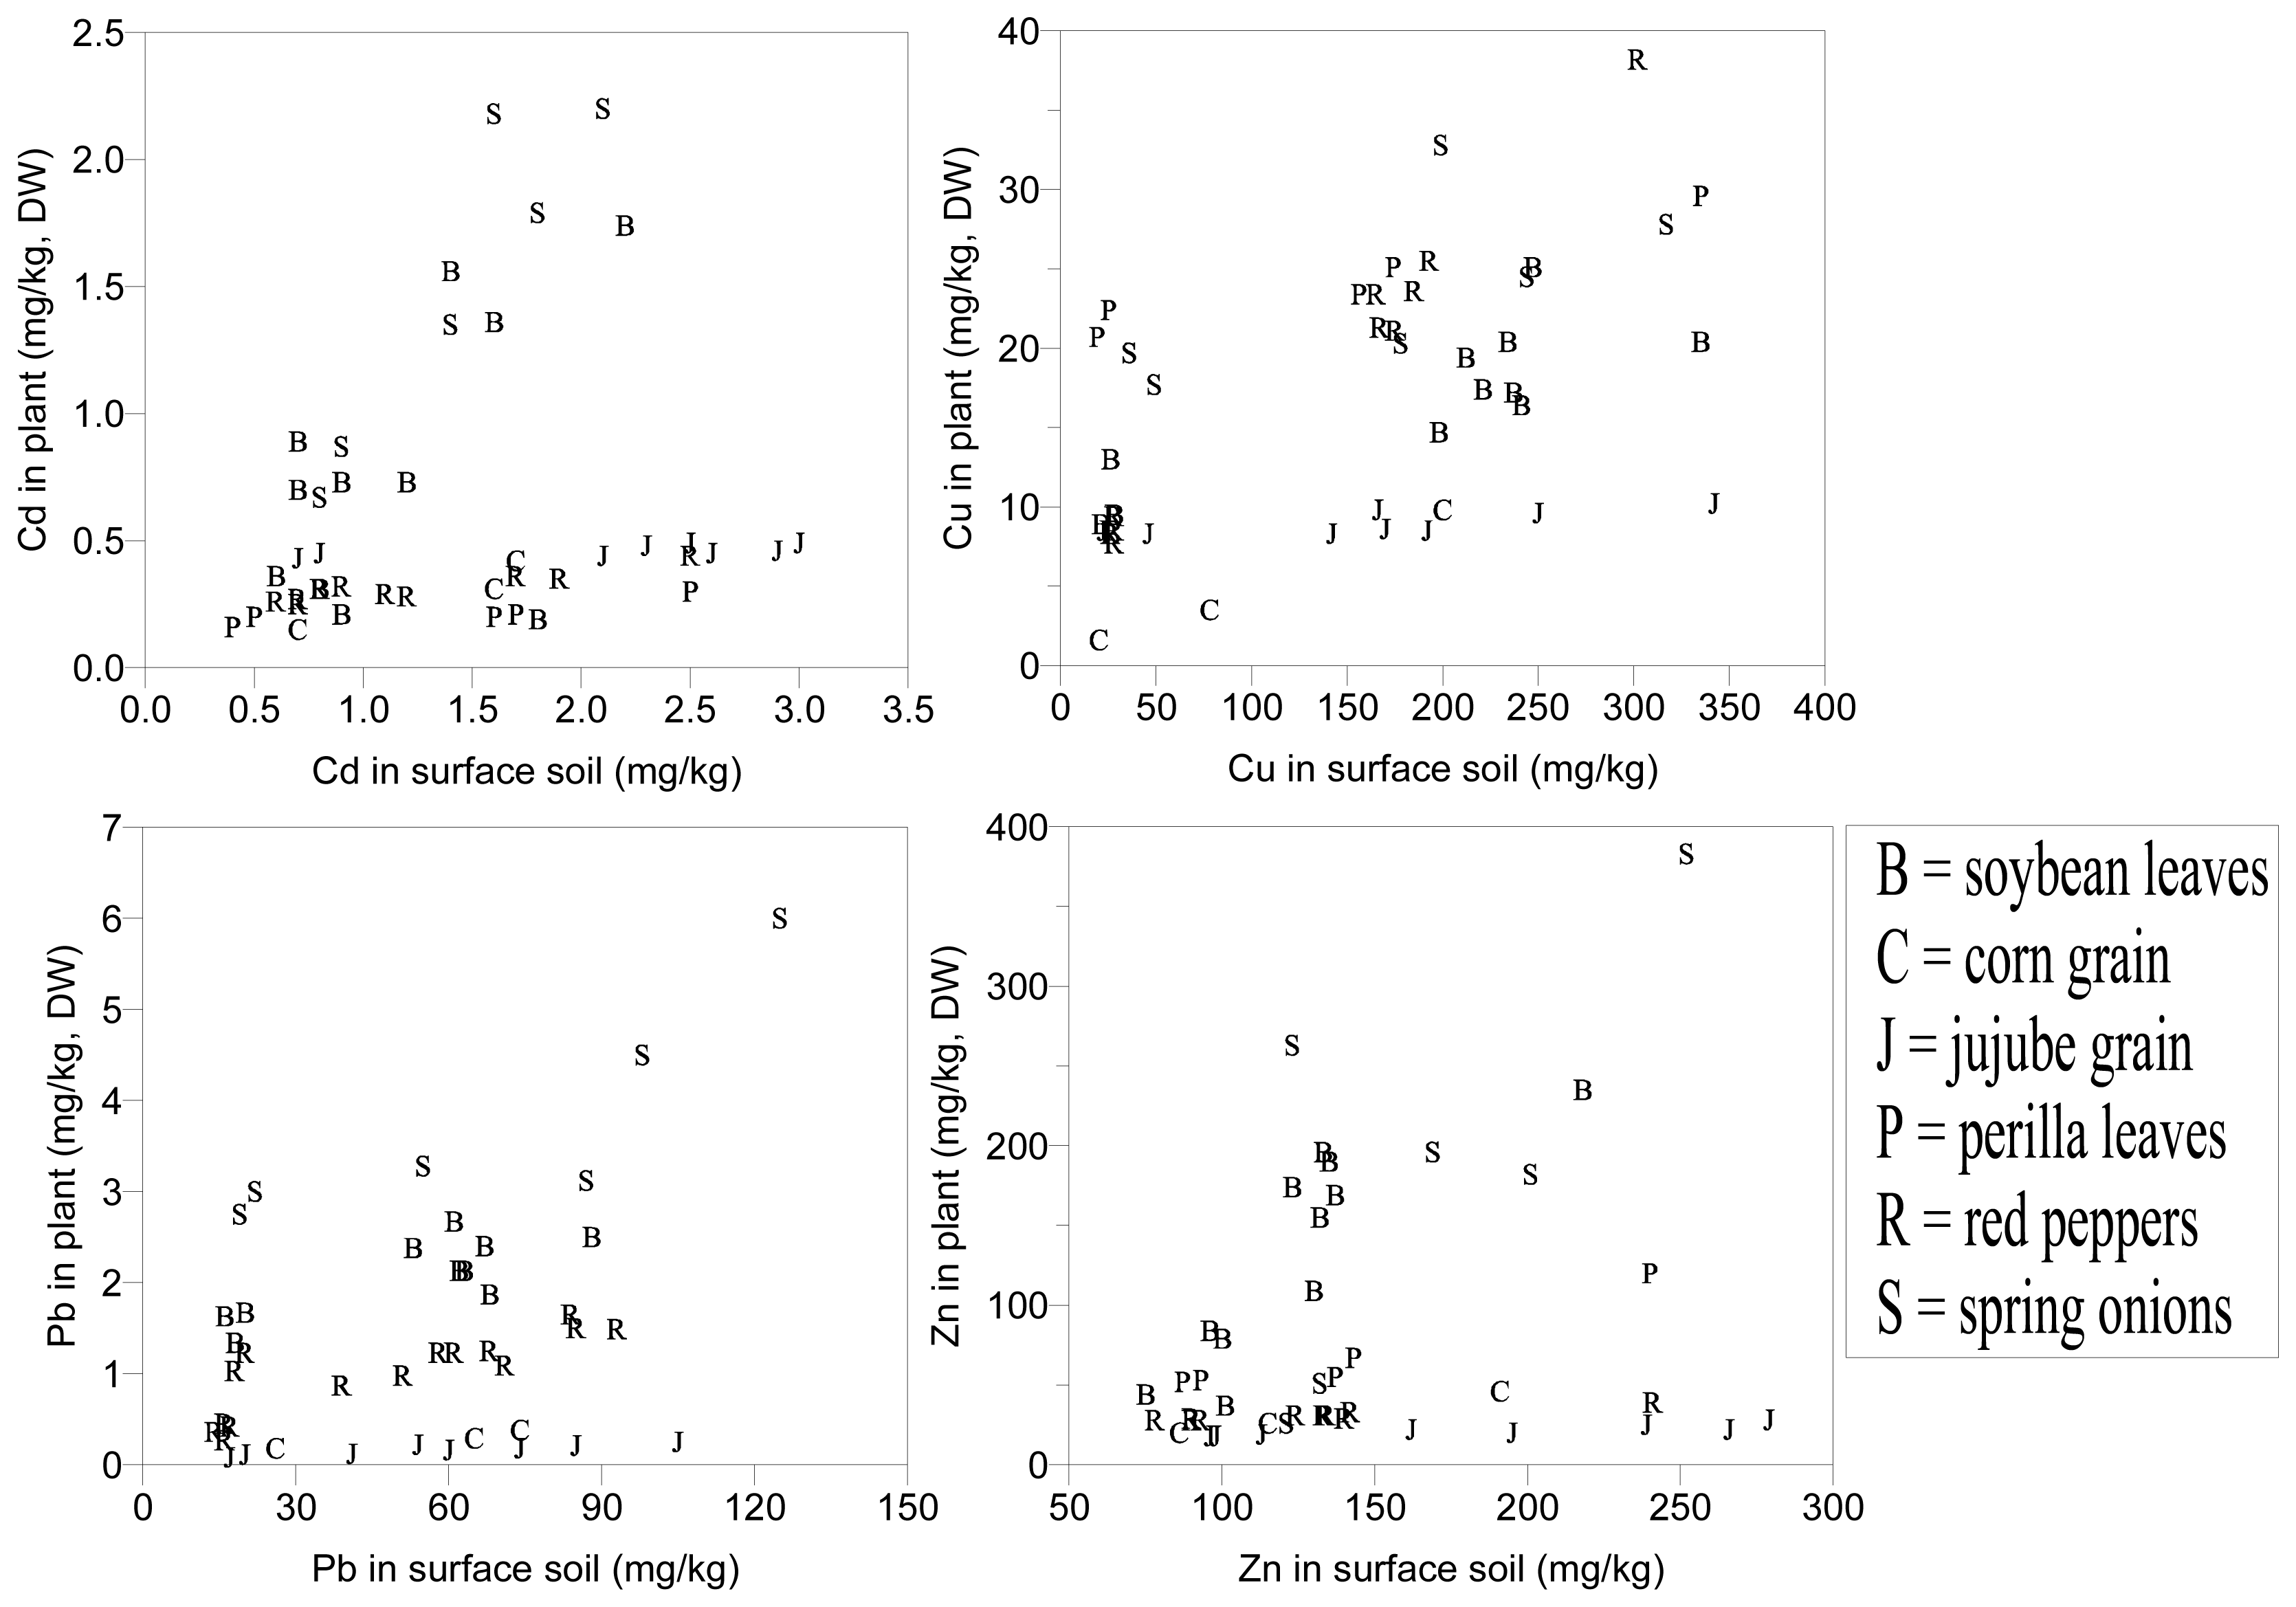
Metal uptake by plants can be affected by several factors including metal concentrations in soils, soil pH, cation exchange capacity, organic matter content, types and varieties of plants, and plant age. It is generally accepted that the metal concentration in soil is the dominant factor [7, 18]. Relationships between total metal contents in plants and surface soils are shown in Figure 3. Levels of most metals in plants were highly comparable with those of soil counterparts, although the gradient can differ between plant species. Metals in corn and jujube grains, however, did not show any significant correlations with those of soils.
As mentioned above, there is a combination of factors affecting metal uptake by plants. Thus, stepwise linear multiple regression method was applied to find the dominant factors influencing metal uptake by plants, such application was extended further to predict metal concentrations in plants under these specific soils and climatic conditions. Obtaining a best fit regression equation is undertaken by a step-by-step procedure. The first independent variable was always total metal content in surface soils. From the correlation matrix, the second major factor was found, and the regression equation was calculated using a statistical package. At every stage, the significance of the equation was tested by the coefficient of determination (r2) and probability (P). If the equation was not significant, i.e., a low r-squared value or high probability, other factors were used to obtain the best fit regression equation for predicting metal concentrations in plants.
The results of linear multiple regressions are presented in Table 5. Total metal concentrations in soil are the main factor, being correlated positively with metals in plants on each occasion. In addition, soil pH, correlated negatively with metals in plants, played an important role in governing metal uptake by plants. Other factors such as cation exchange capacity, loss-on-ignition and soil texture also contributed to the prediction of metal concentrations in plants in some cases.
5. Conclusions
Both soils and plants have been contaminated by previous mining in this study area. The most elevated concentrations of metals were found in soils in the mine dump sites, with average of 1,953, 419, 4.4, and 1,030 of μg g−1 for Cu, Zn, Cd and Pb, respectively. Household gardens and uncultivated areas downstream had moderately elevated soil metal concentrations and exceeded those at a nearby control site. Metal concentrations in plants varied with the plant species, higher levels were found in plant leaves and lower levels in grain. In particular, Thus, metal concentrations in sampled plants decreased in the order spring onion > soybean leaves > perilla leaves ≈ red pepper > corn grain ≈ jujube grain. In the same plant species, metal concentrations decreased in the order Zn > Cu > Pb > Cd due to mainly to differences in the total metal concentrations in soils and their bioavailability. Thus, long-term metal exposure by regular consumption of locally grown vegetables poses potentially health problems to animal and residents in the vicinity of the mine, although no adverse health effects have as yet been observed. Metal levels in plants sampled in the control area were within normal ranges. This study also examined the use of a linear multiple regression method as a technique for finding the dominant factors affecting metal uptake by plants, and for predicting metal concentrations in plants. The results showed total metal content in surface soils to be the dominant factor influencing metals in plants; soil pH was also a major factor. In addition, some soil factors including cation exchange capacity, loss-on-ignition and soil texture also influenced metal uptake.
Acknowledgments
This research was supported by the Mine Reclamation Corporation (MIRECO) in Korea.
References and Notes
- Jung, M.C. Heavy metal contamination of soils and waters in and around the Imcheon Au-Ag mine, Korea. Applied Geochem. 2001, 16, 1369–1375. [Google Scholar]
- Lee, C.K.; Chon, H.-T; Jung, M.C. Heavy metal contamination in the vicinity of the Daduk Au-Ag-Pb-Zn mine in Korea. Applied Geochem. 2001, 16, 1377–1386. [Google Scholar]
- Lee, J.-S.; Chon, H.-T.; Jung, M.C. Toxic risk assessment and environmental contamination of heavy metals around abandoned metal mine sites in Korea. Key Eng. Materials 2005, 277-279, 542–547. [Google Scholar]
- Park, J.-M.; Lee, J.-S.; Lee, J.-U.; Chon, H.-T.; Jung, M.C. Microbial effects on geochemcal behavior of arsenic in As-contaminated sediments. J. Geochem. Explo. 2006, 88, 134–138. [Google Scholar]
- Thornton, I. Geochemical aspects of heavy metal pollution and agriculture in England and Wales. In Proceedings of a Conference organised by the Agricultural Development and Advisory Service, April 1977; MAFF: London, 1980; pp. 105–125. [Google Scholar]
- Nriagu, J.O.; Pacyna, J.M. Quantitative assessment of worldwide contamination of air, water and soils by trace metals. Nature 1988, 333, 134–139. [Google Scholar]
- Alloway, B.J.; Davies, B.E. Trace element content of soils affected by base metal mining in Wales. Geoderma 1971, 5, 197–208. [Google Scholar]
- Thornton, I. Metal content of soils and dust. Special issue: the Shipham report: an investigation into cadmium contamination and its implications for human health. Sci. Tot. Environ. 1988, 75, 21–39. [Google Scholar]
- Fuge, R.; Paveley, C.F.; Holdham, M.T. Heavy metal contamination in the Tanant Valley, North Wales. Environ. Geochem. Health 1989, 11, 127–135. [Google Scholar]
- Levy, D.B.; Barbarick, K.A.; Siemer, E.G.; Sommers, L.E. Distribution and partitioning of trace metals in contaminated soils near Leadville, Colorado. J. Environ. Qual. 1992, 21, 185–195. [Google Scholar]
- Jung, M.C.; Thornton, I. Heavy metal contamination and seasonal variation of metals in soils, plants and waters in the paddy fields around a Pb-Zn mine, Korea. Sci. Tot. Environ. 1997, 198, 105–121. [Google Scholar]
- Jung, M.C.; Thornton, I.; Chon, H.-T. 2002. Arsenic, Sb and Bi contamination of soils, plants, waters and sediments in the vicinity of the Dalsung Cu-W mine in Korea. Sci. Tot. Environ. 2002, 295, 81–89. [Google Scholar]
- Won, C.K.; Ko, C.B.; Hong, S.H. Explanatory text of the geological map of Gyeongsan Sheet.; Geological Survey of Korea: Seoul, 1971; pp. 45–61. [Google Scholar]
- Thompson, M.; Wood, S. Atomic Absorption Spectrometry; Cantle, E.J., Ed.; Elsevier: Amsterdam, 1982; Chapter 4; pp. 261–284. [Google Scholar]
- Ball, D.F. Loss-on-ignition as an estimate of organic matter and organic carbon in non-calcareous soil. Soil Sci. 1964, 15, 84–92. [Google Scholar]
- Smith, R.T.; Atkinson, K. Technique of Pedology; Elek Sci. Pub.: London, 1975; pp. 125–137. [Google Scholar]
- Ramsey, M.H.; Thompson, M.; Banerjee, E.K. Realistic assessment of analytical data quality from inductively coupled plasma atomic emission spectrometry. Anal. Proc. 1987, 24, 260–265. [Google Scholar]
- Adriano, D.C. Trace Elements in the Terrestrial Environment.; Springer-Verlag Inc.: New York, 1986; pp. 1–45. [Google Scholar]
- Berrow, M.L.; Reaves, G.A. Background levels of trace elements in soils. In Proc. Int. Conf. Environ. Contamination; Perry, R., Ed.; CEC Consultants Ltd.: Edinburgh, 1984; pp. 333–340. [Google Scholar]
- Alloway, B.J. Heavy Metals in Soils.; Blackie Academic and Professional: London, 1995; pp. 7–39. [Google Scholar]
- Fergusson, J.E. The Heavy Elements: Chemistry, Environmental Impacts and Health Effects.; Pergamon Press: Oxford, 1990; pp. 377–405. [Google Scholar]
Figure 1.
Site description and sampling locations of soils and crop plants.

Figure 2.
Diagrams showing concentrations of Cd, Cu, Pb and Zn in surface soils.

Figure 3.
Relationships between Cd, Cu, Pb and Zn concentrations in soil and crop plants.


| Reagent blank meana) | IDLb) | ADLc) | ||||
|---|---|---|---|---|---|---|
| soil | plant | soil | plant | soil | plant | |
| Cd | 0.009 | 0.008 | 0.200 | 0.025 | 0.125 | 0.014 |
| Cu | 0.039 | 0.054 | 0.200 | 0.025 | 0.776 | 0.019 |
| Pb | 0.728 | 0.131 | 2.000 | 0.250 | 1.849 | 0.111 |
| Zn | 0.865 | 0.831 | 0.400 | 0.050 | 0.839 | 0.312 |
a)Mean of 8 values
b)Instrumental detection limit was converted from μg mL−1 to μg g−1 using factors of 40 for soils and 5 for plants
c)Analytical detection limit was calculated by multiplying the standard deviation of the mean reagent blank value by 2.365: this value derived from t-table using degree of freedom 7 (95% confidence limit)
Table 2.
Comparison between observed and recommended concentrations of metals in international certified materials (Units: μg g−1).
| Reference materials | Metals (numbers) | Observed value | Recommended value | Bias (%)c) | ||
|---|---|---|---|---|---|---|
| m±2stda) | RSD(%)b) | m±2std | RSD(%) | |||
| SRM2711 | Cd(Nd)=8) | 40.7±2.33 | 2.92 | 41.7±0.25 | 3.00 | −2.40 |
| (soil) | Cu(N=8) | 112±11.4 | 5.20 | 114±2.0 | 0.90 | −1.75 |
| Pb(N=8) | 1,059±23.9 | 1.15 | 1,162±31 | 1.36 | −8.86 | |
| Zn(N=8) | 346±22.9 | 3.38 | 350±4.8 | 0.70 | −1.26 | |
| CRM281 | Cd(N=8) | 0.14±0.02 | 6.58 | 0.12±0.00 | 1.28 | +16.7 |
| (rye grass) | Cu(N=8) | 9.24±0.45 | 2.49 | 9.65±0.38 | 2.00 | −4.25 |
| Pb(N=8) | 2.45±0.47 | 9.82 | 2.38±0.11 | 2.36 | +2.94 | |
| Zn(N=8) | 26.9±2.69 | 5.09 | 31.5±1.4 | 2.27 | −14.6 | |
a)Mean value ± 2 × standard deviation (95% confidence limit)
b)RSD(%) (residual standard deviation) = (standard deviation / observed mean) × 100
c)Bias (%) = {(observed mean – recommended mean) / recommended mean{ × 100
d)Number of samples
| Mine dump (Na)=36) | Uncultivated (N=6) | Household garden (N=30) | Control (N=18) | |
|---|---|---|---|---|
| Cd (mg/kg) | 4.4±3.6b) | 1.8±0.5 | 1.8±0.9 | 0.9±0.4 |
| Cu (mg/kg) | 1,953±1,811 | 183±92 | 269±299 | 29±9 |
| Pb (mg/kg) | 1,028±616 | 63±26 | 84±54 | 18±3 |
| Zn (mg/kg) | 419±462 | 136±30 | 175±68 | 97±14 |
| pH | 4.1±0.7 | 5.3±0.8 | 5.6±0.9 | 5.6±0.5 |
| LOI (%) | 3.2±1.4 | 7.9±0.9 | 7.7±1.7 | 6.6±1.0 |
| CEC (meq/100g) | 11.4±3.4 | 17.5±1.9 | 23.2±10.5 | 30.1±14.7 |
| Sand (%) | 86±7 | 66±2 | 70±6 | 65±4 |
| Silt (%) | 8±3 | 22±1 | 20±5 | 23±6 |
| Clay (%) | 6±4 | 12±1 | 10±4 | 12±4 |
a)Number of samples;
b)Mean ± standard deviation
| Site | Na) | Cd | Cu | Pb | Zn | |
|---|---|---|---|---|---|---|
| Corn grain | Mining area | 3 | 0.41±0.07b) | 8.95±4.12 | 0.41±0.11 | 40.7±10.3 |
| Control area | 1 | 0.15 | 1.60 | 0.18 | 20.0 | |
| Ratioc) | 2.7 | 5.6 | 2.3 | 2.1 | ||
| Jujube grain | Mining area | 6 | 0.47±0.02 | 9.17±0.72 | 1.19±0.04 | 22.5±2.80 |
| Control area | 2 | 0.44±0.01 | 8.43±0.09 | 0.10±0.02 | 18.0±0.40 | |
| Ratio | 1.1 | 1.1 | 1.9d) | 1.3d) | ||
| Perilla leaves | Mining area | 3 | 0.24±0.04 | 26.0±2.62 | 1.33±0.12 | 80.7±28.2 |
| Control area | 2 | 0.18±0.02 | 21.6±0.85 | 1.13±0.10 | 52.8±0.60 | |
| Ratio | 1.3 | 1.2 | 1.2 | 1.5 | ||
| Red pepper | Mining area | 6 | 0.34±0.05 | 25.5±5.86 | 1.22±0.28 | 32.2±3.29 |
| Control area | 4 | 0.27±0.02 | 8.45±0.62 | 0.38±0.07 | 28.1±0.56 | |
| Ratio | 1.3d) | 3.0d) | 32d) | 1.1d) | ||
| Soybean leaves | Mining area | 8 | 1.01±0.45 | 18.9±3.00 | 2.41±0.39 | 163±46.4 |
| Control area | 3 | 0.24±0.05 | 10.5±1.81 | 1.55±0.15 | 54.9±20.9 | |
| Ratio | 4.2d) | 1.8d) | 1.6d) | 3.0d) | ||
| Spring onion | Mining area | 4 | 1.88±0.35 | 26.4±4.58 | 4.23±1.16 | 256±79.5 |
| Control area | 4 | 0.77±0.10 | 18.3±1.72 | 3.02±0.18 | 47.4±13.6 | |
| Ratio | 24d) | 1.4 | 1.4 | 5.3d) | ||
a)Number of samples
b)Mean ± standard deviation
c)Calculated by mean concentrations in plants grown in the mining area divided by that in the control area
d)Significant difference in mean concentrations in plants sampled between in the mining area and control area at p < 0.05
| Plant type | Multiple regression equation* | r2(%) |
|---|---|---|
| Corn grain (N=4) | (Zn)s = 47.113 + 0.251 (Zn)s - 7.102 LOI | 98.84 |
| Jujube grain (N=8) | (Cu)p = 10.3012 + 0.0068 (Cu)s - 0.3892 pH | 83.78 |
| (Zn)p = 18.12 + 0.05 (Zn)s - 0.78 LOI | 90.04 | |
| (Pb)p = 0.0687 + 0.0017 (Pb)s | 82.19 | |
| Perilla leaves (N=5) | (Cu)p = 20.655 + 0.0253 (Cu)s | 93.32 |
| (Zn)p = 6.6733 + 0.4495 (Zn)s | 91.58 | |
| Red pepper (N=10) | (Cu)p = 5.0217 + 0.1047 (Cu)s | 98.53 |
| (Zn)p = 21.3541 + 0.0718 (Zn)s | 87.84 | |
| (Cd)p = 0.289 + 0.093 (Cd)s - 0.015 pH | 87.69 | |
| (Pb)p = 0.1623 + 0.0157 (Pb)s | 94.79 | |
| Soybean leaves (N=11) | (Cu)p = 81.916 + 0.318 (Cu)s - 4.012 pH - 0.722 sand | 96.24 |
| (Zn)p = -34.261 + 1.369 (Zn)s | 70.89 | |
| (Pb)p = 3.614 + 0.006 (Pb)s - 0.341 pH | 86.94 | |
| Spring onions (N=8) | (Cu)p = 17.916 + 0.067 (Cu)s - 3.601 pH - 0.853 silt | 94.35 |
| (Zn)p = 516 + 2.28 (Zn)s - 124 pH | 94.17 | |
| (Cd)p = -0.291 + 0.347 (Cd)s - 0.477 pH + 0.532 LOI | 96.31 | |
| (Pb)p = 14.143 + 0.051 (Pb)s - 0.186 sand | 90.18 |
Note : (Cu)p = Cu in plant (μg g−1, dry weight); (Cu)s = Cu in surface soil (μg g−1);
*P < 0.01
© 2008 by MDPI (http://www.mdpi.org). Reproduction is permitted for noncommercial purposes.
Share and Cite
MDPI and ACS Style
Jung, M.C. Heavy Metal Concentrations in Soils and Factors Affecting Metal Uptake by Plants in the Vicinity of a Korean Cu-W Mine. Sensors 2008, 8, 2413-2423. https://doi.org/10.3390/s8042413
AMA Style
Jung MC. Heavy Metal Concentrations in Soils and Factors Affecting Metal Uptake by Plants in the Vicinity of a Korean Cu-W Mine. Sensors. 2008; 8(4):2413-2423. https://doi.org/10.3390/s8042413
Chicago/Turabian StyleJung, Myung Chae. 2008. "Heavy Metal Concentrations in Soils and Factors Affecting Metal Uptake by Plants in the Vicinity of a Korean Cu-W Mine" Sensors 8, no. 4: 2413-2423. https://doi.org/10.3390/s8042413