Absorbance Based Light Emitting Diode Optical Sensors and Sensing Devices


Adaptive Sensors Group, National Centre for Sensor Research, School of Chemical Sciences, Dublin City University, Dublin 9, Ireland
*
Author to whom correspondence should be addressed.
Sensors 2008, 8(4), 2453-2479; https://doi.org/10.3390/s8042453
Submission received: 11 October 2007
/
Accepted: 31 March 2008
/
Published: 7 April 2008
(This article belongs to the Special Issue Photonic Sensors for Chemical, Biological, and Nuclear Agent Detection)
Abstract
:The ever increasing demand for in situ monitoring of health, environment and security has created a need for reliable, miniaturised sensing devices. To achieve this, appropriate analytical devices are required that possess operating characteristics of reliability, low power consumption, low cost, autonomous operation capability and compatibility with wireless communications systems. The use of light emitting diodes (LEDs) as light sources is one strategy, which has been successfully applied in chemical sensing. This paper summarises the development and advancement of LED based chemical sensors and sensing devices in terms of their configuration and application, with the focus on transmittance and reflectance absorptiometric measurements.
1. Introduction
The importance of health, environment and security monitoring has increased dramatically within the past decade. This is in part due to our awareness of the effects and long term consequences of polluting the environment, the need for point of care health monitoring and also the increased possibility of chemical warfare. Typical sampling methods employ manual grab samples that are collected on site and then transported to a laboratory for analysis. These sampling methods can be very costly, time consuming and can compromise the integrity of the sample during sample collection, transport, storage and analysis [1]. Portable, robust, accurate methods of analysis are needed to achieve monitoring such that the samples can be analysed in the field. These enable results to be available faster, at low cost and they minimise the risk of contamination by eliminating the transport of the samples [2].
The miniaturisation of analytical instruments using microfluidics is one strategy to move this concept forward [3-5]. The possibility of manipulating smaller amounts of sample volume combined with the need for faster response times has placed great demands on the corresponding detection systems [6]. The advancement in LED sources and photodetector technologies provide a solution to these issues as they are compact, low power and low cost detectors for incorporating colorimetric analytical methods into remotely deployable devices [7, 8].
Holonyak et al. developed the first LED in 1962 based on GaAsP layers, which emitted red light [9]. Since then LEDs have played a prominent role in optical sensors which has been reflected in the numerous review articles published to date [2, 10-15]. Significant advances in III-V nitride manufacturing processes have resulted in high power commercially available LEDs in the region of 247-1550 nm [16-20].
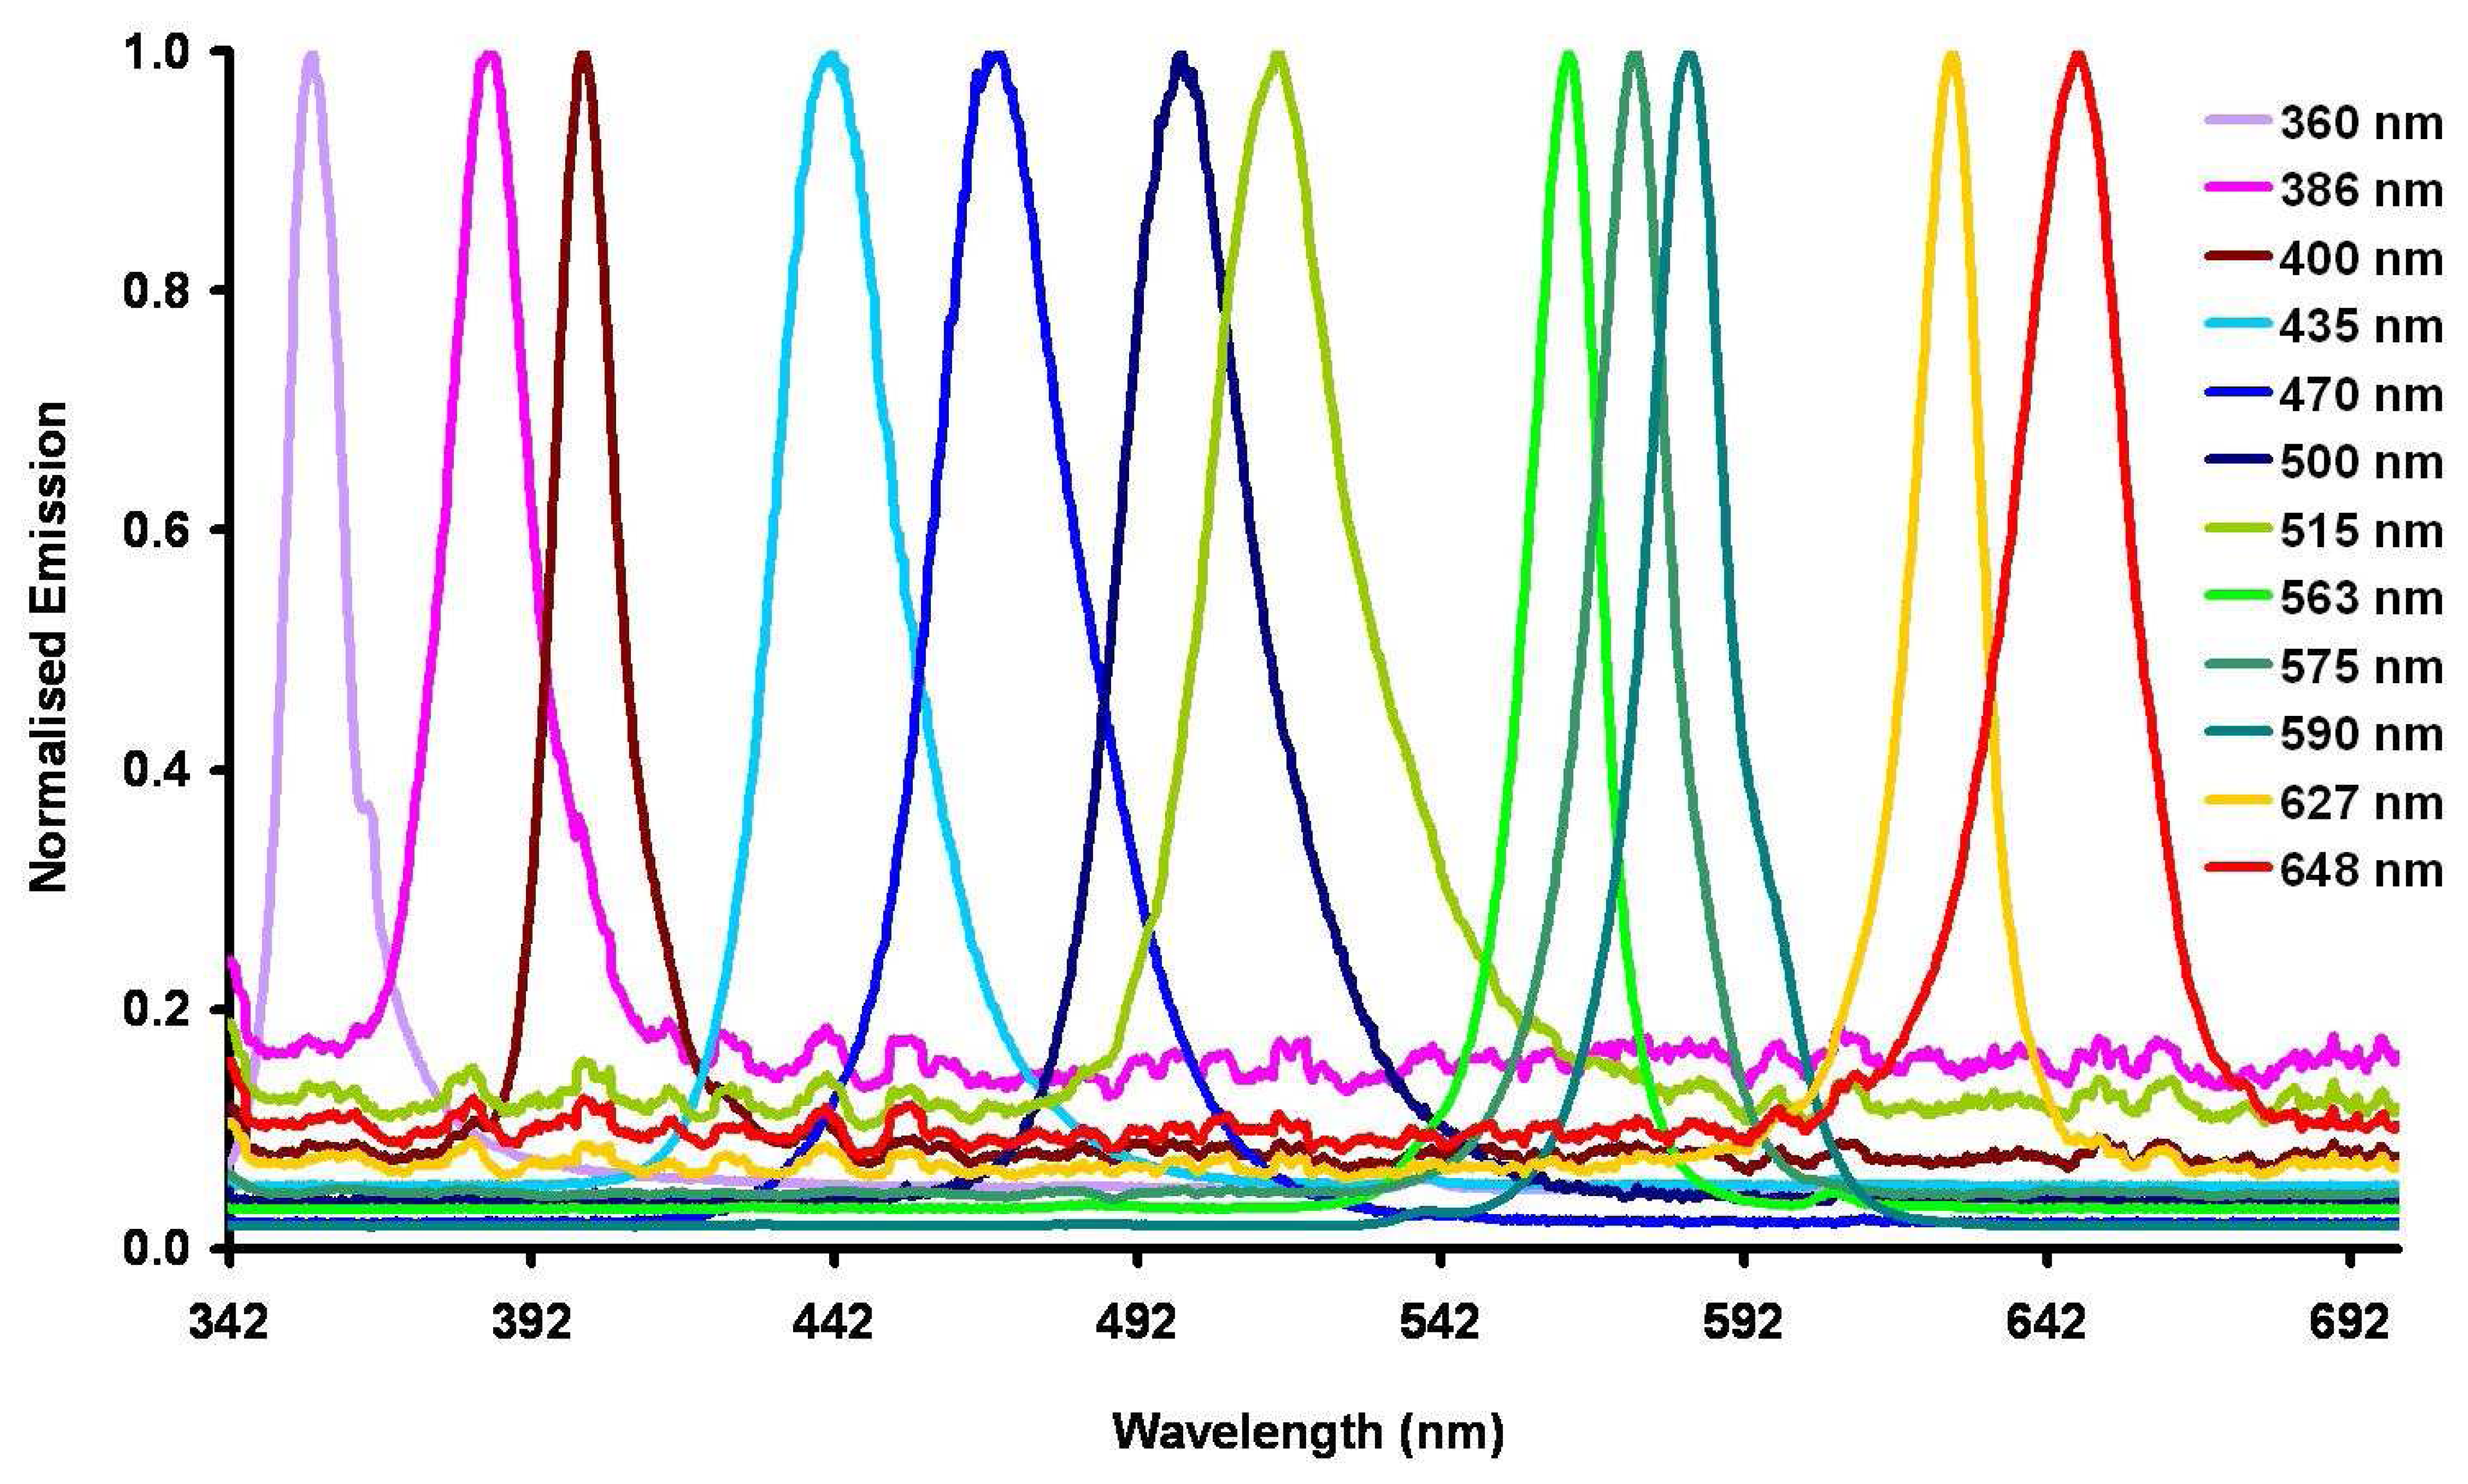
Figure 1 illustrates some of the UV-vis spectral region covered by commercially available light emitting diodes. LEDs were first applied to chemical analysis three decades ago [14]. LEDs offer a number of advantages compared to existing light sources in optoelectronic applications. These include increased lifetime, low cost, reduced power consumption, higher brightness, rugged construction, flexible configuration, enhanced spectral purity, small size, and breadth of spectral range (LEDs in the spectral range ca. 247-1550 nm are commercially available) [15].
The development of LEDs resulted in the appearance of new optical light source instrumentation such as that presented by Flaschka et al. (1973) [21], Anfält et al. (1978) [22] and Betteridge et al. (1978) [23]. In this paper, we review the design and development of LED based chemical sensors and their applications in health, environment and security monitoring.
2. Detectors commonly employed with LEDs
Following the trend of miniaturisation, detectors must provide high sensitivity for small detection volumes (ca. 10 nL-10 pL) and low analyte concentrations [24], in addition they must be affordable, versatile, reliable, accurate and small in size. LEDs have the ability to be coupled (for example, with waveguides or optical fibers [13, 25-28]) to a wide variety of detectors such as, photodiode-arrays (PDA) [3, 5, 29-34], photomultiplier tubes (PMT) [35-41], light dependent resistors (LDR) [42-47], phototransistors (PT) [21, 23, 48-53], photodiodes (PD) [11, 12, 54-73] and LEDs [74-85]. By far, the most common detector used in LED based chemical sensors is the photodiode.
2.1 LEDs coupled with Phototransistors as a detector
The first LED based photometer was proposed by Barnes in 1970 (as stated by Flaschka et al. [21]) and the concept of an LED-phototransistor (PT) photometer with a 30 cm pathlength flow through cell was realised in 1973 [11]. The PT provides current gain for the photodiode junction and thus greatly increases sensitivity [21].
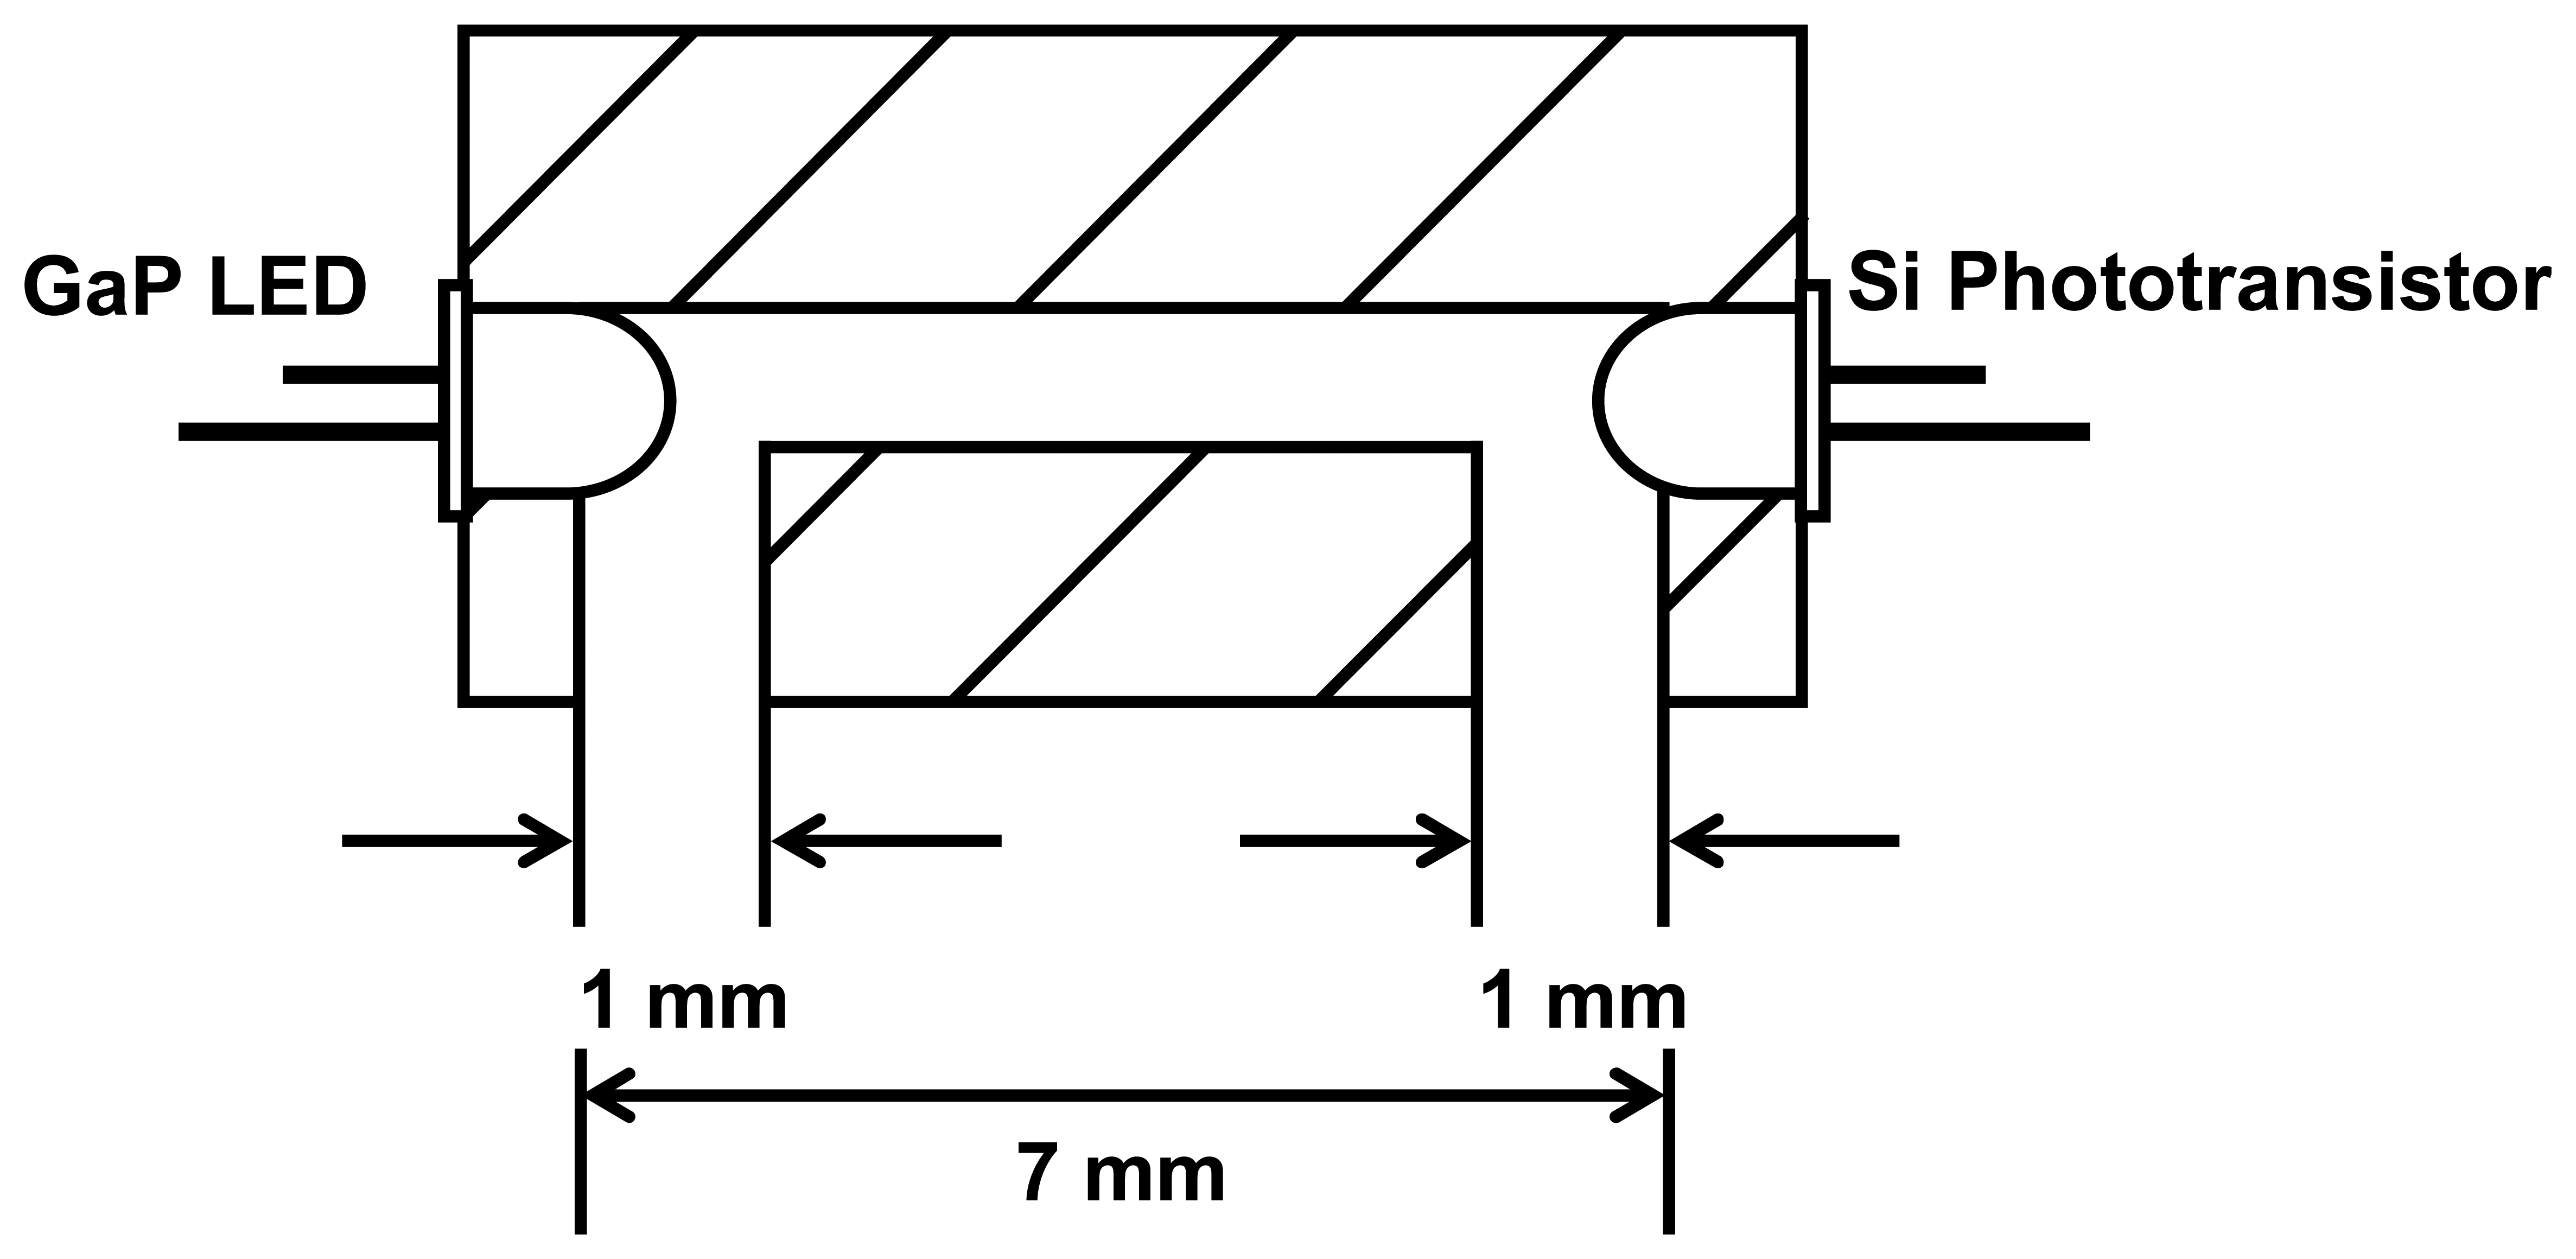
Betteridge et al. developed the first practical LED based flow through photodetector [23]. The simple photometric detector shown in Figure 2 consisted of a gallium phosphide LED as the light source and a silicon phototransistor as the sensor. Determinations of metal ions at the part per billion levels were achieved using PAR reagent. A R.S.D. of 1.5% was obtained which was further reduced to less than 1% with lower flow rates.
The development of this detector was applied to flow injection analysis (FIA) [86, 87]. Phototransistors typically provide 1.5-2 orders of magnitude greater current output than photodiodes albeit with a higher cost [11, 88]. Disadvantages of phototransistors include their slow response time. Most phototransistors will have response times measured in tens of microseconds, which is approximately 100 times slower than photodiodes. They also have the disadvantage of having small active areas and high noise levels.
2.2 LEDs coupled with Photodiodes as a detector
Anfält et al. reported the first LED coupled with a photodiode in 1976 [22]. They constructed a photometric probe instrument to determine the total alkalinity of seawater. The results obtained were found to be in good agreement with the reported potentiometric method with the added advantage of faster measurements.
To date one of the most commonly used detectors in photometry is the photodiode [24, 58, 61-63, 88-91]. Dasgupta et al. have published numerous papers on the variations and applications of this system [11, 12, 24, 64, 65, 67, 68, 88, 92-94].
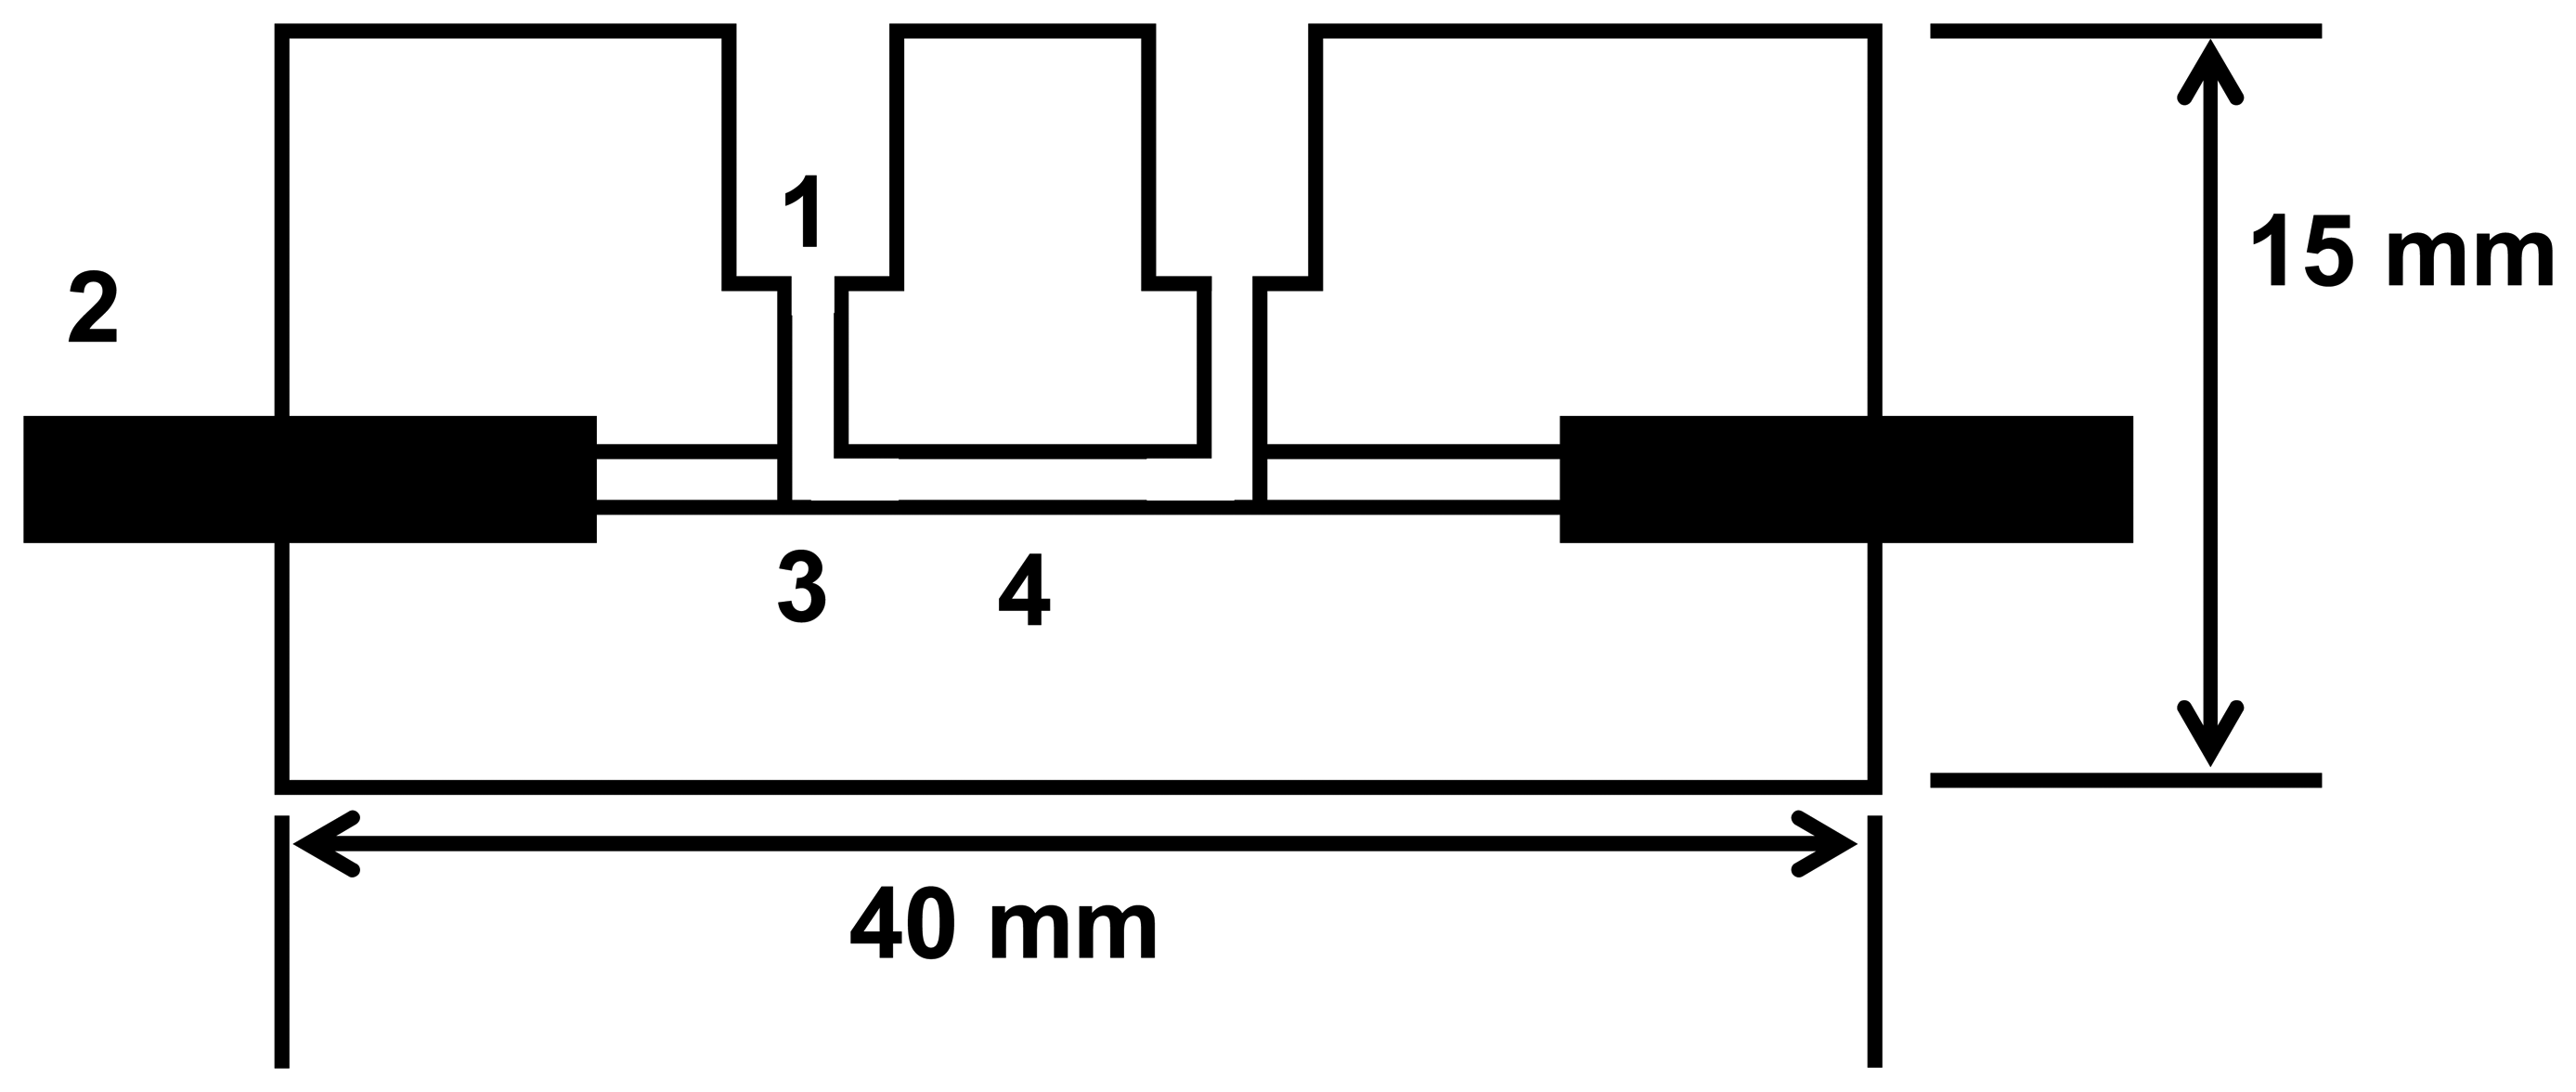
Hauser et al. [4, 56-58, 71] have also contributed significantly to the advancement of LEDs as a light source for analytical measurements and were the first to report the use of a blue LED as a spectroscopic source [57] coupled with a photodiode as a detector. The performance of the device was tested for commonly used spectrophotometric-based analytical methods for Cr, Mn, Zn, Fe and Cl and compared with conventional molecular absorption spectroscopy. The transducer was also investigated as a detector in flow-injection analysis. Light was coupled into the flow system using a 1 mm plastic optical fiber, allowing the opto-electronic components to be located remotely from the wet chemical part as shown in Figure 3 [57]
PDs are extremely versatile and have been employed in various configurations, such as flow through detectors in flow injection analysis (FIA) [55, 58, 86], separation systems [35, 40, 54, 95, 96] and probe photometers [22, 97-99]. PDs are popular because of their rapid response and wide linear range, which is typically three and four orders of magnitude better than PTs [10].
2.3 LEDs coupled with Light Dependent Resistors as a detector
Matias et al. [42] developed a simple low cost reflectometer for colorimetric diffuse reflectance measurements using a green LED as the light source and an LDR as a detector. The quantitative analysis of nickel, in a catalyst, using dimethylghyoxime as a colorimetric reagent, was used to test the device. An RSD% of ∼ 6% was achieved.
The LED and LDR were positioned in the same plane at 45° with respect to the reflecting surface at an angel of 90° between them (Figure 4). The reflectance was measured for Ni(DMG)2 precipitate obtained from the nickel solution. A linear range from 0-1.25 x 10⁻³ mol L-1 was achieved. Tubino et al. also adopted this configuration for the determination of diclofenac in pharmaceutical preparations [46] and nickel [47].
LDRs while inexpensive and small in size are not commonly employed in optical sensors as they possess disadvantages of slow response times in comparison to photodiodes and they are nonlinear devices. LDRs are more ideally employed for light presence/absence detection than for accurate measurements of light intensity.
2.4 LEDs coupled with photodiode arrays as a detector
LEDs are ideal substitutes for replacing bulky, high power consuming light sources such as tungsten-halogen or deuterium lamps, which are commonly used in conjunction with photodiode array detectors in spectroscopic instrumentation. LED sources can be easily integrated with PDA detectors through fiber optics [3, 5, 29, 31, 33], waveguides [32, 100, 101] and microscope objectives [30, 34, 37].
Simplicity of use and low power consumption make LEDs a much more attractive option than tungsten lamps in microfluidic devices. With the introduction of commercially available ultraviolet (UV) LEDs in ca. 2002, Sequeira et al. incorporated a UV (λmax 390 nm) LED as the light source and a photodiode array (Ocean Optics 2000) as the detector into a microfluidic manifold for the detection of phosphate [3, 5] using the vanadomolybdophosphoric acid method. The UV LED was selected in preference to the tungsten lamp sources typically used due to the larger power consumption, need for filters, and bulkiness of the latter [3]. Sequeira et al. achieved a linear range of 0-50 mg L-1 PO43- with an R2 value of 0.9958 while employing the UV LED as the light source.
The use of a PDA detector in combination with a single LED could be considered superfluous to the general requirements of small, simple, low cost, optical devices. However, there are many advantages that a multiwavelength detector can offer, even when coupled with a single LED source. For example, simultaneous reference measurements can be performed at regions of the spectrum where there is no change in absorbance to reduce effects such as drift, turbidity, baseline noise, changes in refractive index etc. In addition, the signal can be measured over a range of wavelengths where changes in absorbance are occurring. For example, in cases where two absorbing species are at equilibrium, with the equilibrium position affected by the analyte, this often manifests as two regions, one increasing while the other decreases, pivoted around an isosbestic point. For systems like this, measurements at the isosbestic point allow correction for drift, while measurements either side of the isosbestic point enable true analytical events to be validated and distinguished from artifacts. The incorporation of these additional features must always be balanced with the fact that a more complex multiwavelength detector is required along with more sophisticated software. In practice, the solution employed must be fit for purpose, but there is no doubt that the price-performance index is continuously improving, as technologies for producing fluidic manifolds with integrated computational and communications capabilities become more ubiquitous.
Collins et al. [30, 34] employed an LED in combination with a PDA as the detection method for a capillary electrophoresis microchip. The colorimetric, metal complexation dye, Arsenazo III, was selected for the detection of uranium (VI). A red LED (λmax 660 nm) was oriented directly above the separation microchannel. Light passing through the microchannel was collected using a microscope objective, and directed through a perpendicularly oriented rectangular slit onto a 35-element PDA. One section of the PDA monitored the sample through the microchannel, while the reference measurement was taken by monitoring the light transmission through the clear glass of the microchip adjacent to the microchannel. Collins et al. obtained a rapid separation of UO22+ and three metal-ion interferents in less than 125 seconds. Similarly, the use of (A) a bi-colour LED coupled with a single photodiode [68], (B) two LEDs coupled with a single photodiode [73], and (C) two LEDs coupled with two photodiodes [67] have been reported. Each of these configurations have disadvantages and associated errors. Devices (A) and (B) are not feasible in fast separations such as that carried out by Collins et al. [30] as the two wavelengths are pulsed on/off alternatively. The fastest eluting peak in the separation was approximately 4 seconds, which would not be fully captured if pulsing on/off the LED. While device (C) addresses the issue of monitoring continuously at both the sample wavelength and the reference wavelength, error is introducing by having two separate photodiode detectors, as each detector varies and can be subject to different interferences.
The integration of low power detectors based on LEDs with microfluidic platforms that employ low-power fluidic transport strategies (e.g. using biomimetic approaches [102]) raises the prospect of small, low-cost, autonomous analytical devices that provide spatially distributed real or near real-time data for applications in environmental monitoring or emergency-disaster scenarios [103]. These devices offer many of the advantages of conventional chemo/biosensors such as fast response, with enhanced reliability through data validation operations (as described above) coupled with the ability to correct for drift and loss of sensitivity through regular calibration. Due to the inherently small dead volumes of microfluidic manifolds (typically nL) and the use of low flow rates (low or sub μL/min), reagent consumption (and therefore waste generation) is typically very small. While these devices are not ideal in that they do require the use of reagents and flow systems, they have the potential to integrate the reliability of laboratory instruments with the fast response of conventional sensors, and increasing evidence of their use can be expected in the coming years [104].
3. Configurations of LED Sensing Devices
3.1 Double Beam LED Optical Sensors
In FIA applications, a difference of refractive index (RI) between the sample and the carrier is common, which can lead to an artefact often referred to as the Schlieren effect [67]. An additional problem with detection in FIA occurs when samples exhibit turbidity. Hooley et al. proposed the use of an LED combined with a beam splitter and two photodiodes for the correction of drift from the light source [105]. The use of two LEDs, however, allowing for the correction of colour change, RI or turbidity [67, 68, 73, 106, 107], was first introduced by Worsfold et al. [66].
A flow injection manifold based on reagent injection into the sample stream was described for the determination of phosphate in natural waters. A double-beam photometric detector incorporating two LEDs at 660 nm and photodiodes enclosed in a 20 cm3 box was employed as shown in Figure 5. The response was linear over the range 0-2000 μgl-1 phosphate-phosphorus (R2 = 0.9992) and a limit of detection (σ) of 12 μgl-1 phosphorus was achieved.
The sample was pumped through the reference channel prior to the injection of reagent in order to compensate for physical changes in the sample stream (e.g. colour or turbidity). The method of monitoring two separate channels for compensation can lead to inaccuracies if the reference solution environment is not identical to the sample solution environment, for example the presence of bubbles in one channel or fluctuations in the individual LEDs.
3.2 Multi - LEDs as a light source
A significant number of LED photometers are based on the use of a fixed wavelength for a predetermined application that focuses on a narrow region of the spectrum for absorbance measurements. With these devices, a change of wavelength often has to be effected by physically changing the light source. This limitation is typically caused by the difficulty in coupling light from more than one source into a single detector cell [71].
The use of a multi-LED photometers [71, 72, 108-113] allows a wide range of the electromagnetic spectrum to be covered simultaneously or individually without manually changing the LEDs.
Hauser et al. [71] employed a fiber optic coupler to guide the light from up to 7 LEDs into a single measuring cell. This photometer could be configured to detect Al, Cu, NH3, Cu, Ca, chromium, phosphate and nitrite using colorimetric methods. A coupler was used to merge the light from one of the 7 input channels into 2 output fibers. One was brought to the measuring photodiode and the other was brought to the reference photodiode as shown in Figure 6.
3.3 Bi- / Tri- colour LEDs as a light source
The most popular type of tri-colour LED has a red and a green LED combined in one package with three leads. When both the red and green LEDs are turned on, the LED appears to be yellow.
Figure 7 shows the construction of a tri-colour LED. The centre lead (K) is the common cathode for both LED diodes, the outer leads (A1 and A2) are the anodes to the LEDs allowing each one to be lit separately, or both together to give the third colour. The use of bi- / tri- colour LEDs can provide a compact rugged multi-wavelength spectrophotometer source that can facilitate multi-component analysis or detect sample artifacts such as the presence of turbidity [68-70, 114-116].
Huang et al. [68] investigated the use of a bi-colour LED as a light source coupled with a photodiode as a detector and calibrated the system using a series of bromothymol blue solutions. A red/green dual wavelength LED with emission maxima at 630 nm and 565 nm were used. The R2 values of 0.9994 and 0.9999 were achieved respectively with overall R.S.D. values of 0.25% and 0.24% for red and green colours. A red/yellow bi-colour LED coupled with a FIA technique for the determination of 10-6 M levels of Co2+ was also carried out.
4. LEDs as Light Detectors
The concept of employing an LED as a light detector was first proposed by Mims III [82, 117]. Using a simple circuit that contained an operational amplifier to measure the photocurrent obtained by a reversed biased LED, the LED sensor was applied to the detection of sunlight.
Berry et al. applied the use of LED detectors for pH determination and heavy metal analysis. A tungsten halogen lamp was used as the light source coupled with an array of various coloured LEDs as light detectors [84]. Each LED was assembled with a separate amplifier, however Berry et al. determined that the blue LED required a two-stage gain to compensate for its significantly lower sensitivity. Few have adopted the use of LEDs operating as photodiodes due to the lack of sensitivity with regard to the photocurrent generated [12].
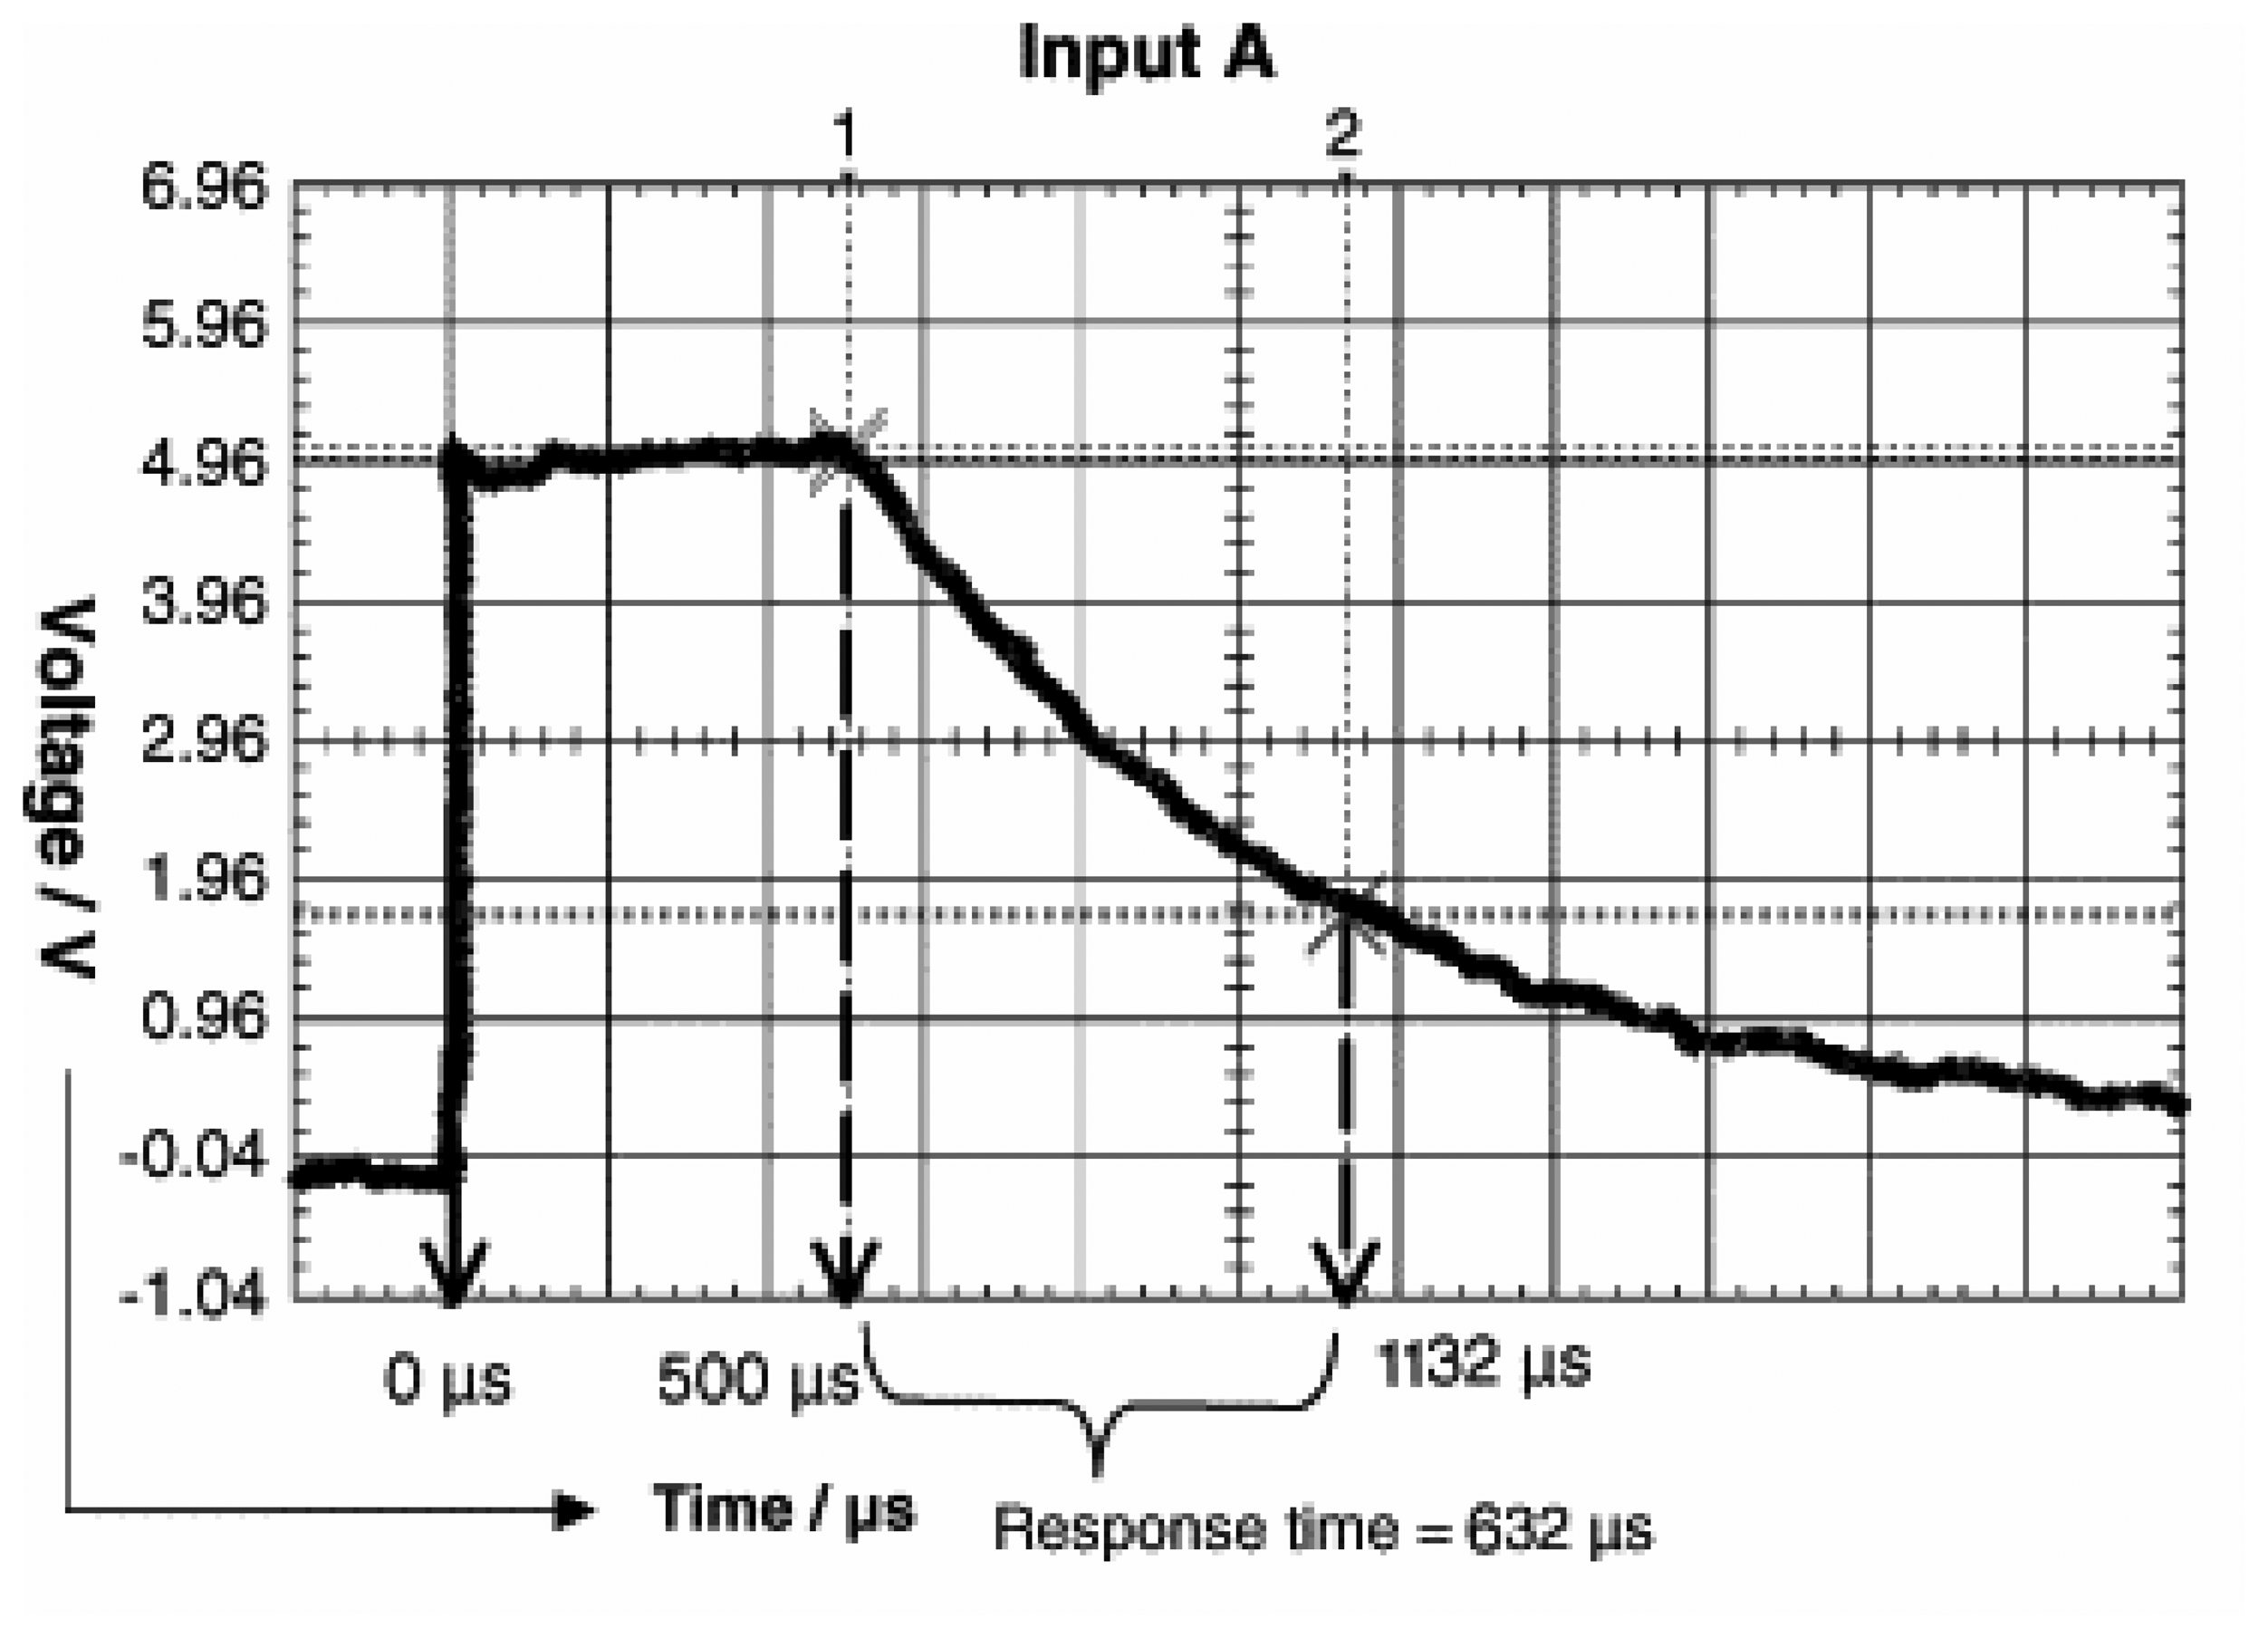
The novel use of an LED as both light source and detector for analytical applications has been developed by Lau et al. [74, 75]. The emitter LED is forward biased while the detector LED is reverse biased. Instead of measuring the photocurrent directly as performed by Mims III [82] and Berry [84], a simple timer circuit is used to measure the time taken for the photocurrent generated by the emitter LED to discharge the detector LED from 5 V (logic 1) to 1.7 V (logic 0) to give digital output directly without using an A/D converter or operation amplifier. This method achieves excellent sensitivity in comparison to the method of operating an LED as a photodiode (i.e. to measure directly photocurrent) [81]. A typical discharge profile of an LED with an emission λmax of 610 nm was obtained using a Fluke Scopmeter® (Fluke Corporation, WA, USA). As shown in Figure 8 the LED was charged up to 5 V for 500 μs before being switched to discharge mode.
In this example, the time taken for the capacitor voltage to decay from 5 V (logic 1) to a preset voltage of 1.7 V (logic 0) is ca. 632 μs. In practice, a voltage comparator is used to check whether the actual capacitive voltage is greater than or less than a preset threshold. Comparisons are made at fast time intervals and the number of values for which the voltage is greater than the set value is integrated over a fixed time interval (e.g. 100 μs). This integrated number will decrease if the light density (and hence the photo-discharge current) increases, and vice-versa.
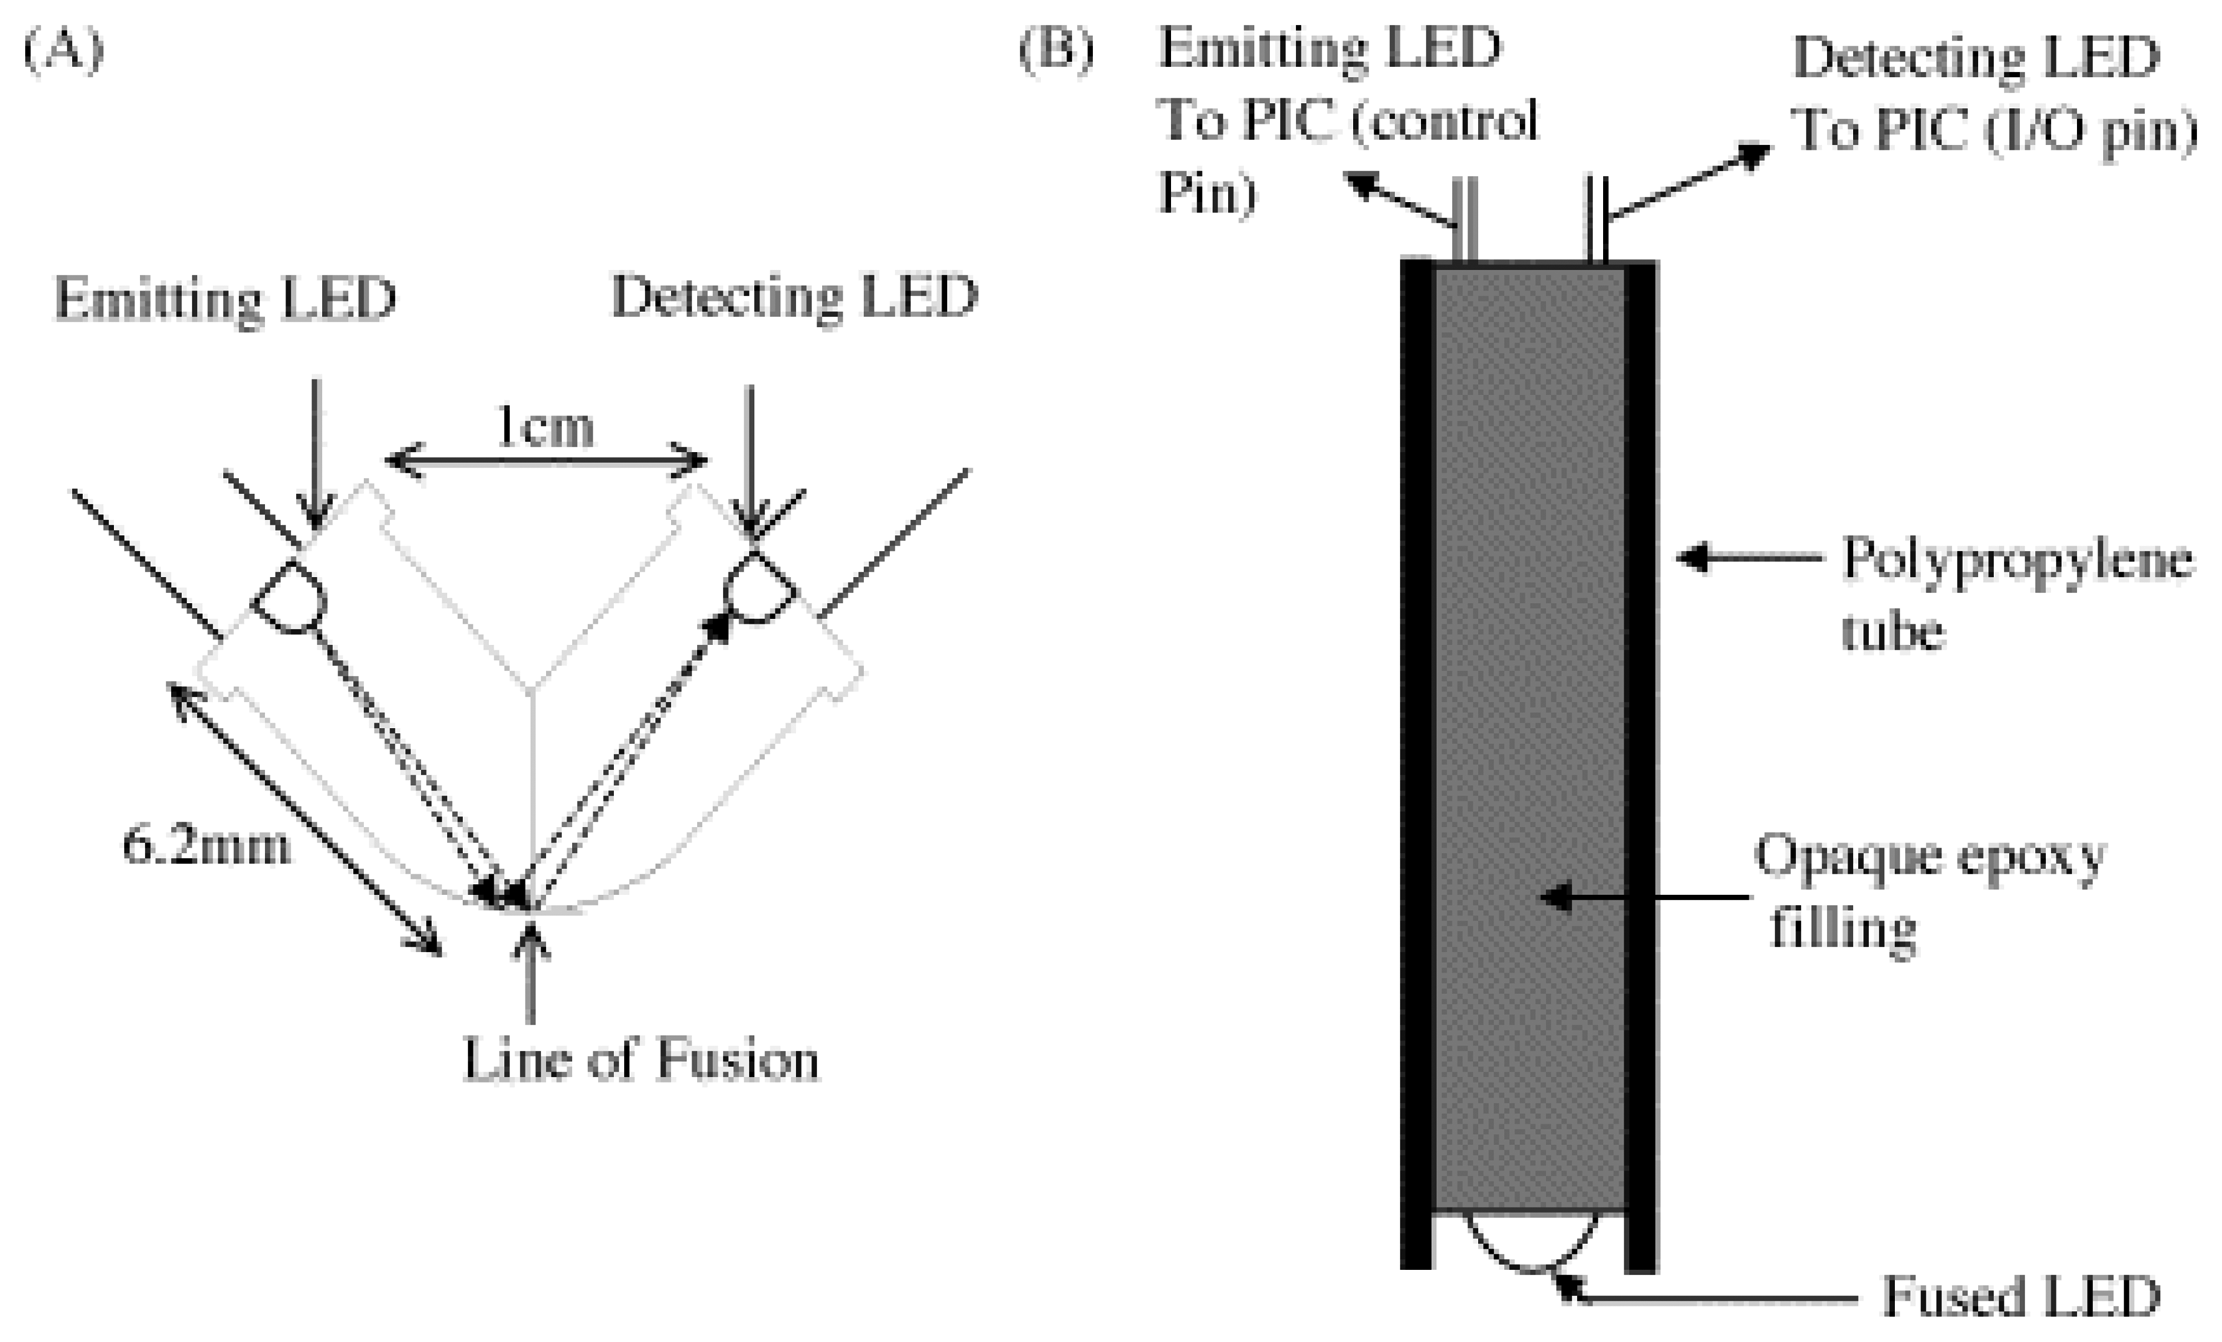
Lau et al. constructed a pair of fused LEDs at a 90° angle with respect to each other to form an optical probe used for colour and colour based pH measurements as shown in Figure 9. The PEDD device was used in reflectance mode and placed directly into the sample of interest. Sensor function is based on the level of light received by the detector diode, which varies with the reflectance of the interface between the device and its environment, or the chemochromic membrane that covers the LEDs [74, 78]. The sensor was successfully applied for colour based pH measurements and also colour detection of dyes.
Lau et al. also developed a multi-LED photometer as an alternative reflectance based optical sensor configuration [78]. The sensor employs an array of LEDs as the light sources, which surround the centre detector LED. This approach allowed the analysis of multiple dyes separately and as dye mixtures.
O'Toole et al. developed a paired emitter detector-diode (PEDD) flow cell [75, 81, 118] and applied the device as a detector in liquid chromatography [77, 80]. Under optimised conditions the PEDD detector achieved a linear range of 0.9–100 μM and an LOD of 90 nM for Mn–PAR complex. A linear range of 0.2–100 μM and an LOD of 90 nM for Co–PAR complex were achieved. All optical measurements were taken by using both the HPLC variable wavelength detector and the PEDD optical detector for data comparison. The PEDD flow cell could detect lower concentration levels of Co–PAR than that of an expensive, commercially available bench top instrument.
A distinct advantage of using the PEDD optical sensor in comparison with widely used LED-photodiode system is that the LED–LED combination is less expensive in both the cost of components (35 US cents per sensor) and the cost of the signal transduction circuitry [74]. The measuring technique employed by the PEDD device does not require a relatively expensive A/D converter as the output seen by the microprocessor is a direct pulse-duration-modulated signal. Additional advantages to the PEDD device is the size, low power consumption (can operate in microwatts range), can detect low absolute light levels, responds to a broad spectral range (247 to >900 nm) and can achieve good S/N ratio.
5. Applications of LED based chemical sensors
5.1 Health
LED based chemical sensors employed in healthcare are increasingly popular as they can be non-invasive, simple, low cost, fabricated in a variety of configurations and easy to use. They can be utilised to monitor our environment for sources of health risks, such as inhalation of air pollutants (examples include: particulate matter (PM) [119], pesticides [119] and volatile organic compounds (VOCs) [120]).
Sick building syndrome (SBS) is a health issue of significant importance, in which occupants of a building experience acute health effects, that seem to be related to the time spent in a building but no specific illness or cause can be identified [120]. Toluene is associated with indoor air pollutants which can cause SBS. Kawamura et al. developed a sensor which utilises a filter containing iodine pentoxide reagent solution which reacts with toluene gas producing a brown-coloured iodine solution. The iodine is detected by a photodetector which comprises of a light emitting diode (λmax 460 nm) and a photodiode. The photodetector could detect toluene gas in the air to a concentration of 0.05 ppm, which was below the guideline concentration value of 0.07 ppm stipulated by the WHO.
Due to outbreaks such as foot and mouth disease, chicken flu virus and bovine spongiform encephalopathy (BSE) food safety assurance is of utmost importance. LED based chemical sensors have also been applied to the monitoring of food products [97, 121, 122].
Pacquit et al. employed an LED based detector to monitor fish spoilage [97, 123]. The on package sensor contains the pH sensitive bromocresol green, which responds through visible change to basic volatile spoilage compounds such as trimethylamine (TMA), ammonia (NH3) and dimethylamine (DMA) collectively referred to as Total Volatile Basic Nitrogen (TVB-N).
The LED reflectance colorimeter employed two LEDs as the light source and a photodiode as the detector as shown in Figure 10. A linear concentration range of 0-15 ppm was achieved for the sensors response to ammonia gas.
LEDs have long been employed in non-invasive medical diagnosis [124, 125]. In 1990 Ichikawa et al. developed an optical system to observe tongue movements in speech production. The easily constructed photodetector consisted of two LEDs and a phototransistor [124]. In 1991 Mitrani et al. investigated the use of an LED detector to perform light reflection rheography (LRR), which allows the diagnosis of deep vein thrombosis (DVT) [125].
Teshima et al. employed an LED based liquid core waveguide (LCW) absorbance detector for the measurement of gaseous acetone in human breath. Monitoring breath acetone can be useful to follow patients on a prescribed diet regimen as well as to monitor diabetic patients. The detection chemistry was based on the reaction of acetone with alkaline salicylaldehyde to form a coloured product, which absorbs in the blue and can be monitored with GaN based LEDs (λmax 465 nm) [126].
5.2 Security
The detection of explosives and explosive related illicit materials is an important area for preventing terrorist activities and for monitoring their adverse effects on health [127]. Continuous monitoring of explosives is preferred as it offers rapid warning. Identification and quantification of explosives is of utmost importance in forensics, antiterrorist activities and the detection of mines [127, 128].
2,4,6-trinitrotoluene (TNT) explosive can readily enter groundwater supplies and poses a health risk to humans even at very low concentrations of parts per billion in groundwater. Pamula et al. employed a droplet based microfluidic lab-on-a-chip utilising electrowetting for the detection of TNT [129]. The colorimetric reaction between nitroaromatics and a strong base which formed a highly coloured Jackson-Meisenheimer complex was detected using an LED-PD system. A linear range of 4-20 μg mL-1 for the detection of TNT was achieved using this method.
Lu et al. [40] demonstrated a capillary electrophoresis (CE) microchip for the separation and colorimetric detection of three trinitroaromatic explosives (1,3,5-trinitrotoluene (TNT), 1,3,5-trinitrobenzene (TNB) and 2,4,6-trinitrophenyl-N-methylnitramine (tetryl)) in seawater. Detection was based on the chemical reaction of bases, such as hydroxide or methoxide ions with trinitroaromatic compounds to form red derivatives, which have a strong absorption band in the region of 500 nm. The sensor employed for the detection of the trinitroaromatic explosives consisted of a green LED (λmax 505 nm) as the light source and a miniature, red-shifted photomultiplier tube as the detector. By coupling the microchip separation with solid phase extraction (SPE) LODs of 0.34, 0.25 and 0.19 μg L-1 were achieved for TNT, TNB and tetryl respectively.
Biological warfare agents require rapid and very sensitive virus detection and identification, if a biosensor is to provide protection [130]. LEDs have allowed the development of highly sensitive, portable instruments such as that designed by Higgins et al. [131]. The handheld advanced nucleic acid analyser (HANAA), which utilised two LEDs, successfully detected DNA extracted from colonies of B. anthracis, cultured from spores obtained from mail rooms contaminated during the anthrax bioterror event in Washington, DC area in 2001.
5.3 Environment
LEDs have been employed in a wide variety of chemical sensors for environmental monitoring, due to their many advantageous characteristics, as previously mentioned. Common analytes of interest for these LED based chemical sensors are nitrate/nitrite, ammonia, phosphorus, cations/metals and anions (Table 1). Worsfold et al. have successfully employed LED based chemical sensors for in situ monitoring of a variety of analytes with particular focus on phosphate [10, 66, 132-134] and nitrate/nitrite/ammonia [55, 134-137].
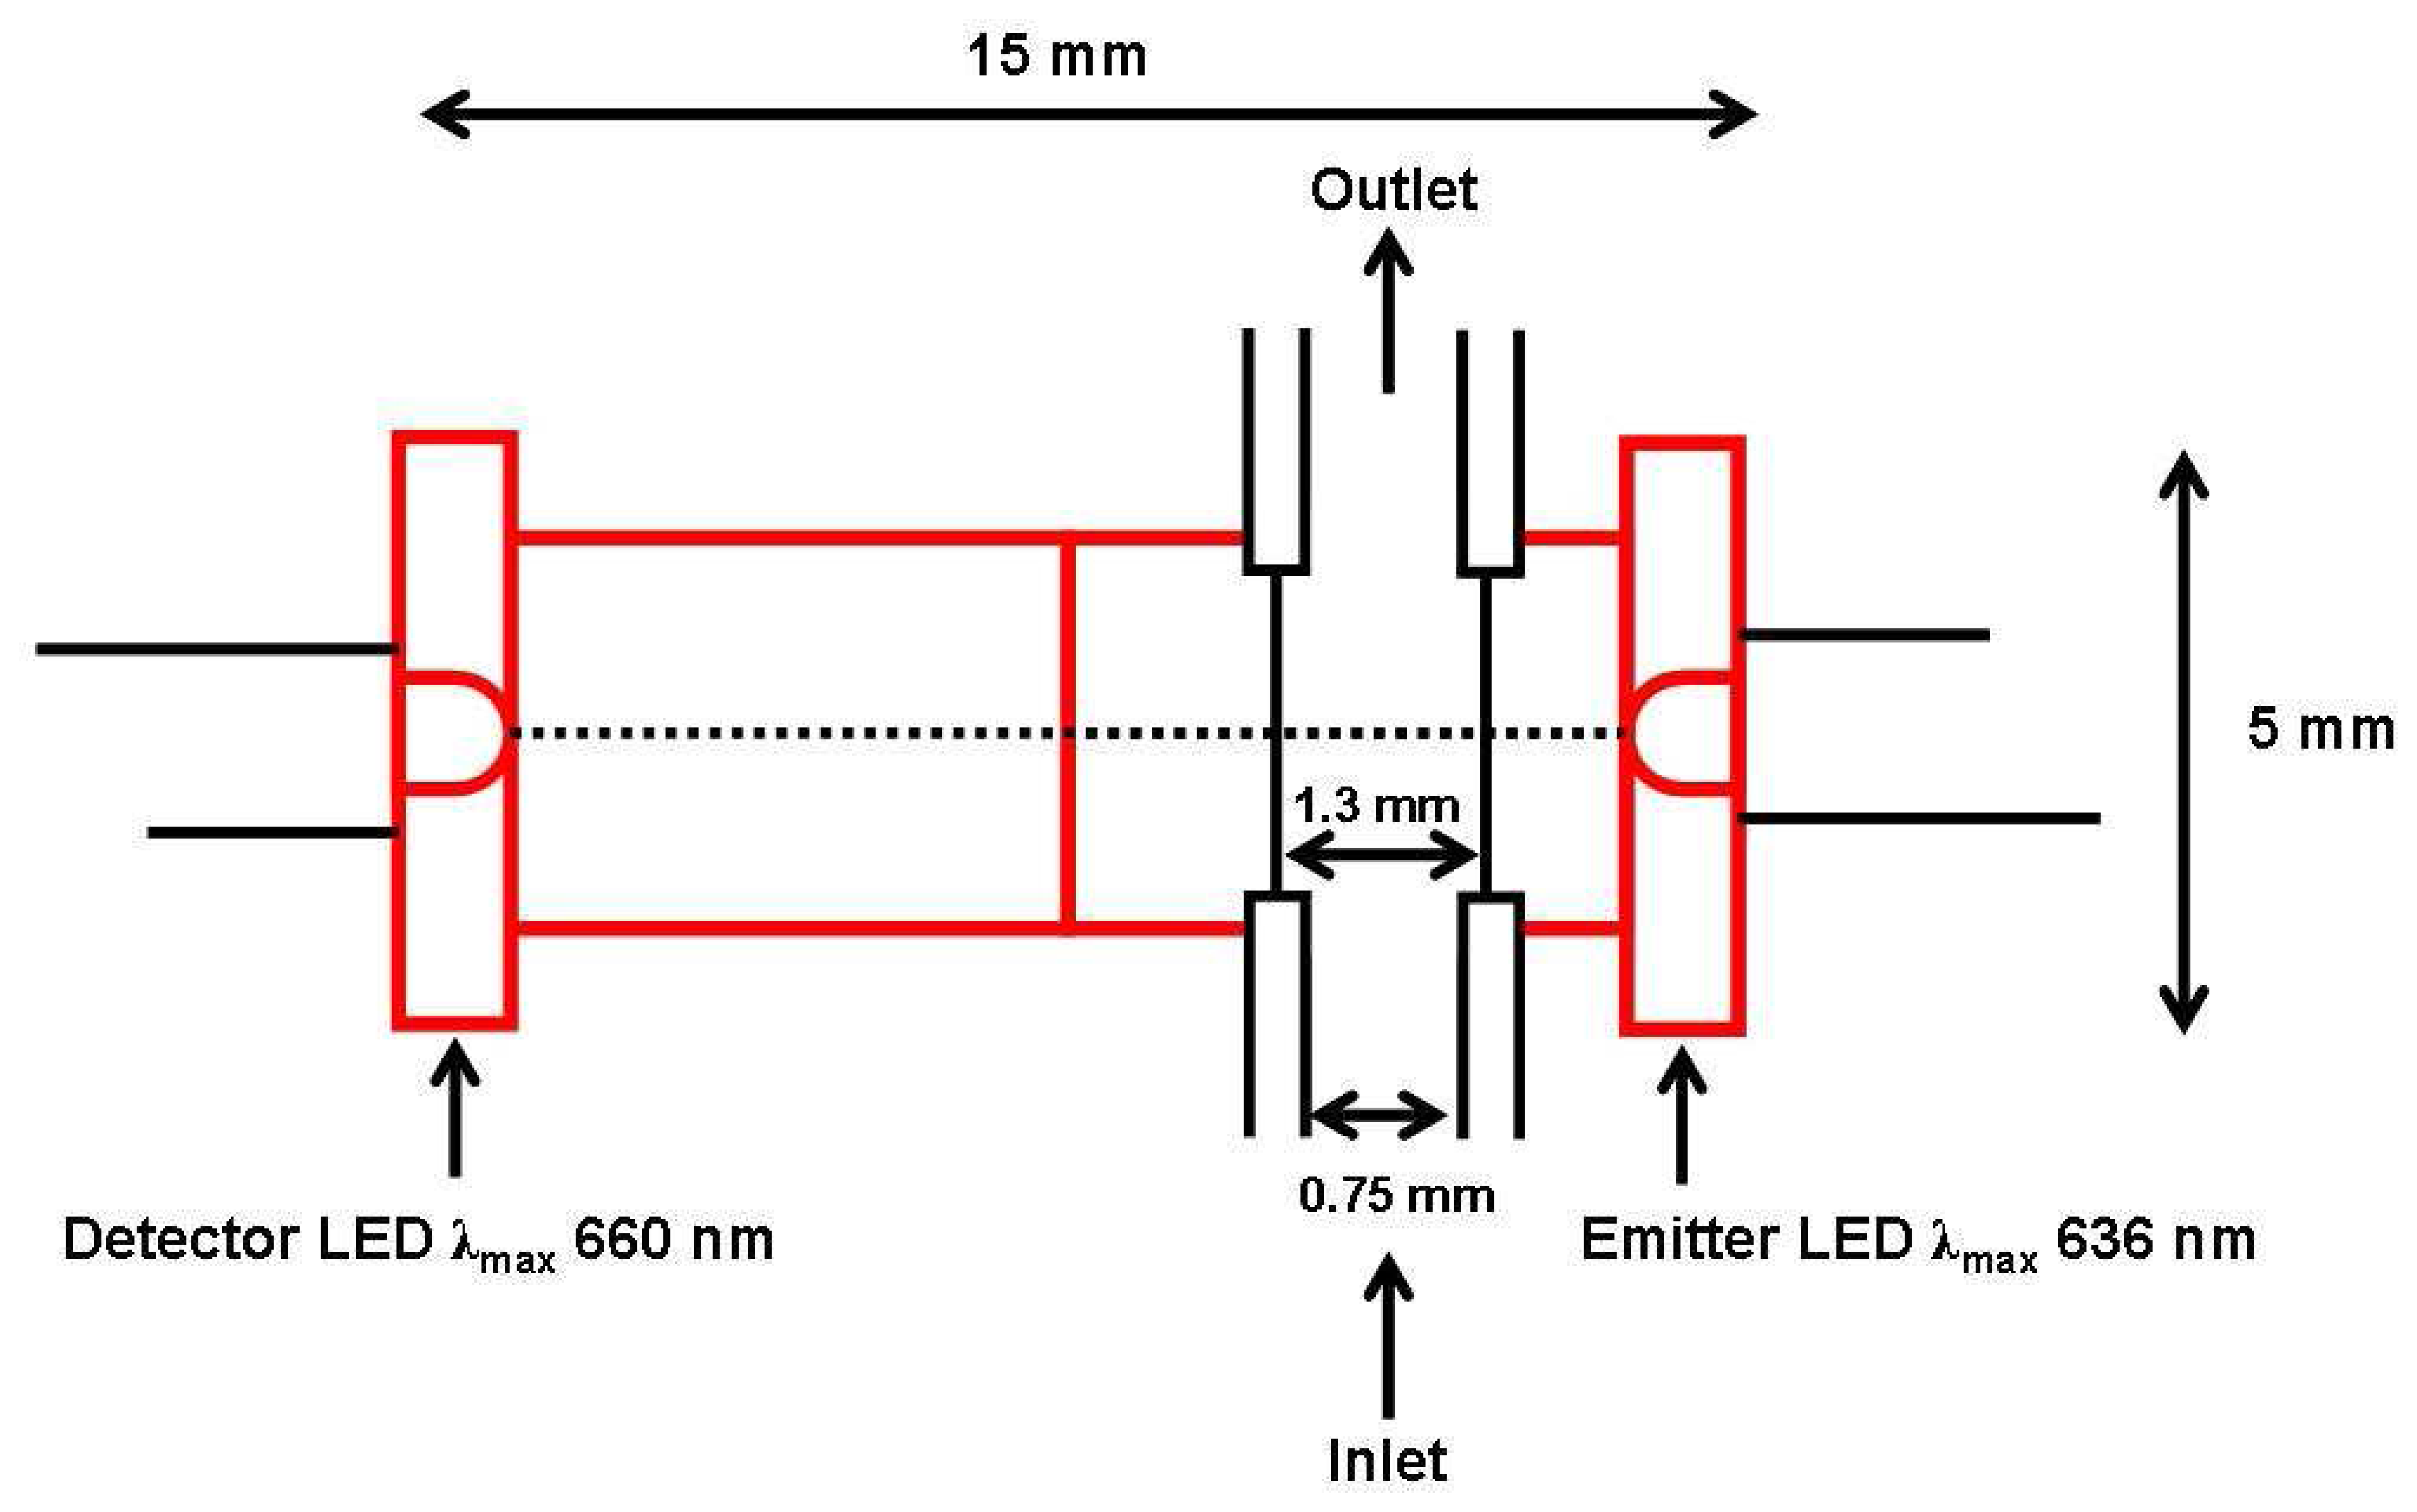
O'Toole et al. applied a paired emitter-detector diode (PEDD) to the detection of phosphate using the malachite green spectrophotometric method [81]. A red LED (λmax at 636 nm) was used as the emitter as the emission spectrum of the LED efficiently overlapped with the absorbance spectra of phosphate malachite green complex. A red LED (λmax at 660 nm) was employed as the detector. Under optimised conditions the PEDD detector obtained a linear range of 0.02–2 μM PO4 and an LOD of 2 nM PO4. A low cost LED-photodiode detector was investigated to compare its performance with that of the PEDD. A linear range of 2–10 μM PO4 and a significantly higher LOD of 2 μM PO4 was determined using this comparative LED-photodiode detector.
6. Conclusions
From this review, it is clear that LED based chemical sensors and sensing devices have a broad range of applicability within the areas of health, security and environment. Even though it might appear that LED based chemical sensors have reached a plateau with regard to their novelty and use this is not the case. LED based chemical sensors have not yet been used and exploited to anything like their full capacity. In addition to the advantages mentioned previously, LEDs are increasingly available in smaller packages (e.g. surface mount), lower cost, high efficiency, and availability at increasingly lower wavelengths (now available down to 210 nm). This latter characteristic is important for opening up analytical applications in spectral regions that currently require the use of deuterium lamps, such as the direct detection of many organic species.
These continuing improvements will in turn facilitate the development of portable, autonomous, low-cost analytical devices and optical sensors that will open up new applications, for example, in environmental monitoring, where, for the first time, it will become feasible to consider the dense deployment of large numbers of sensors to monitor a wide variety of important analytical targets over a large spatial area. Clearly LEDs will continue to be an increasingly important building block for future analytical devices and optical sensors.
Acknowledgments
The Authors wish to thank Science Foundation Ireland SFI for grant support under the Adaptive Information Cluster Award (SFI 03/IN3/1361).
References
- Ho, C.K.; Robinson, A.; Miller, D.R.; Davis, M.J. Overview of sensors and needs for environmental monitoring. Sensors 2005, 5, 4–37. [Google Scholar]
- Marle, L.; Greenway, G.M. Microfluidic devices for environmental monitoring. Trends in Analytical Chemistry 2005, 24, 795–802. [Google Scholar]
- Sequeira, M.; Bowden, M.; Minogue, E.; Diamond, D. Towards autonomous environmental monitoring systems. Talanta 2002, 56, 355–363. [Google Scholar]
- Schawarz, M.A.; Hauser, P.C. Recent developments in detection methods for microfabricated analytical devices. Lab on a chip 2001, 1, 1–6. [Google Scholar]
- Bowden, M.; Diamond, D. The determination of phosphorus in a microfluidic manifold demonstrating long-term reagent lifetime and chemical stability utilising a colorimetric method. Sensors and Actuators B: Chemical 2003, 90, 170–174. [Google Scholar]
- Gotz, S.; Karst, U. Recent developments in optical detection methods for microchip separations. Analytical Bioanalytical Chemistry 2007, 387, 183–192. [Google Scholar]
- Sequeira, M.; Diamond, D.; Daridon, A.; Lichtenberg, J.; Verpoorte, S.; Rooij, N.F.D. Progress in the realisation of an autonomous environmental monitoring device for ammonia. Trends in Analytical Chemistry 2002, 21, 816–827. [Google Scholar]
- Diamond, D. Internet-Scale Sensing. Analytical Chemistry 2004, 76, 279A–286A. [Google Scholar]
- Holonyak, N., Jr.; Bevaqua, S.F. Coherent (visible) light emission from Ga(As1-xPx) junctions. Applied Physics Letters 1962, 1, 82–83. [Google Scholar]
- Trojanowicz, M.; Worsfold, P.J.; Clinch, J.R. Solid-state photometric detectors for flow injection analysis. Trends in Analytical Chemistry 1988, 7, 301–305. [Google Scholar]
- Liu, H.; Dasgupta, P.K.; Zheng, H.J. High performance optical absorbance detectors based on low noise switched integrators. Talanta 1993, 40, 1331–1338. [Google Scholar]
- Dasgupta, P.K.; Bellamy, H.S.; Liu, H.; Lopez, J.L.; Loree, E.L.; Morris, K.; Petersen, K.; Mir, K.A. Light emitting diode based flow-through optical absorption detectors. Talanta 1993, 40, 53–74. [Google Scholar]
- Taib, M.N.; Narayanaswamy, R. Solid-state Instruments for Optical Fibre Chemical Sensors. The Analyst 1995, 120, 1617–1625. [Google Scholar]
- Dasgupta, P.K.; Eom, I.-Y.; Morris, K.J.; Li, J. Light emitting diode-based detectors: Absorbance, fluorescence and spectroelectrochemical measurements in a planar flow-through cell. Analytica Chimica Acta 2003, 500, 337–364. [Google Scholar]
- Kovac, J.; Peternai, L.; Lengyel, O. Advanced light emitting diodes structures for optoelectronic applications. Thin Solid Films 2003, 433, 22–26. [Google Scholar]
- Zukauskas, A.; Shur, M.S.; Gaska, R. Introduction to Solid-State Lighting; John Wiley & Sons, Inc., 2002. [Google Scholar]
- Taniyasu, Y.; Kasu, M.; Makimoto, T. An aluminium nitride light-emitting diode with a wavelength of 210 nanometres. Nature 2006, 441, 325–328. [Google Scholar]
- Kuo, J.S.; Kuyper, C.L.; Allen, P.B.; Fiorini, G.S.; Chiu, D.T. High-power blue/UV light-emitting diodes as excitation sources for sensitive detection. Electrophoresis 2004, 25, 3796–3804. [Google Scholar]
- http://www.roithner-laser.com/
- http://www.s-et.com/
- Flaschka, H.; McKeithan, C.; Barnes, R. Light emitting diodes and phototransistors in photometric modules. Analytical Letters 1973, 6, 585–594. [Google Scholar]
- Anfalt, T.; Graneli, A.; Strandberg, M. Probe photometer based on optoelectronic components for the determination of total alkalinity in seawater. Analytical Chemistry 1976, 48, 357–360. [Google Scholar]
- Betteridge, D.; Dagless, E.L.; Fields, B.; Graves, N.F. A highly sensitive flow-through phototransducer for unsegmented continuous-flow analysis demonstrating high-speed spectrophotometry at the parts per 109 level and a new method of refractometric determinations. The Analyst 1978, 103, 897–908. [Google Scholar]
- Boring, C.B.; Dasgupta, P.K. An affordable high-performance optical absorbance detector for capillary systems. Analytica Chimica Acta 1997, 342, 123–132. [Google Scholar]
- Dasgupta, P.K.; Genfa, Z.; Poruthoor, S.K.; Caldwell, S.; Dong, S.; Liu, S.-Y. High-Sensitivity Gas Sensors Based on Gas-Permeable Liquid Core Waveguides and Long-Path Absorbance Detection. Analytical Chemistry 1998, 70, 4661–4669. [Google Scholar]
- Toda, K.; Yoshioka, K.-I.; Ohira, S.-I.; Li, J.; Dasgupta, P.K. Trace Gas Measurement with an Integrated Porous Tube Collector/Long-Path Absorbance Detector. Analytical Chemistry 2003, 75, 4050–4056. [Google Scholar]
- Galanis, S.; Dasgupta, P.K. Measurement of parts per million levels of potassium hydroxide in polyether polyol streams. Analytica Chimica Acta 2001, 429, 101–110. [Google Scholar]
- Samanta, G.; Boring, C.B.; Dasgupta, P.K. Continuous Automated Measurement of Hexavalent Chromium in Airborne Particulate Matter. Analytical Chemistry 2001, 73, 2034–2040. [Google Scholar]
- Greenway, G.M.; Haswell, S.J.; Petsul, P.H. Characterisation of a micro-total analytical system for the determination of nitrite with spectrophotometric detection. Analytica Chimica Acta 1999, 387, 1–10. [Google Scholar]
- Collins, G.E.; Lu, Q. Radionuclide and metal ion detection on a capillary electrophoresis microchip using LED absorbance detection. Sensors and Actuators B: Chemical 2001, 76, 244–249. [Google Scholar]
- Petsul, P.H.; Greenway, G.M.; Haswell, S.J. The development of an on-chip micro-flow injection analysis of nitrate with a cadmium reductor. Analytica Chimica Acta 2001, 428, 155–161. [Google Scholar]
- White, B.J.; Harmon, H.J. Optical solid-state detection of organophosphates using organophosphorus hydrolase. Biosensors and Bioelectronics 2005, 20, 1977–1983. [Google Scholar]
- Ferrer, L.; de Armas, G.; Miro, M.; Estela, J.M.; Cerda, V. A multisyringe flow injection method for the automated determination of sulfide in waters using a miniaturised optical fiber spectrophotometer. Talanta 2004, 64, 1119–1126. [Google Scholar]
- Collins, G.E.; Lu, Q. Microfabricated capillary electrophoresis sensor for uranium (VI). Analytica Chimica Acta 2001, 436, 181–189. [Google Scholar]
- Lu, Q.; Collins, G.E. Microchip separations of transition metal ions via LED absorbance detection of their PAR complexes. The Analyst 2001, 126, 429–432. [Google Scholar]
- Chen, S-J.; Chen, M.-J.; Chang, H.-T. Light-emitting diode-based indirect fluorescence detection for simultaneous determination of anions and cations in capillary electrophoresis. Journal of Chromatography A 2003, 1017, 215–224. [Google Scholar]
- Collins, G.E.; Lu, Q.; Pereira, N.; Wu, P. Long pathlength, three-dimensional absorbance microchip. Talanta 2007, 72, 301–304. [Google Scholar]
- Schmidt, W. A high performance micro-dual-wavelength-spectrophotometer (MDWS). Journal of biochemical and biophysical methods 2004, 58, 15–24. [Google Scholar]
- Zhang, T.; Fang, Q.; Wang, S.-L.; Qin, L.-F.; Wang, P.; Wu, Z.-Y.; Fang, Z.-L. Enhancement of signal-to-noise level by synchronized dual wavelength modulation for light emitting diode fluorimetry in a liquid-core-waveguide microfluidic capillary electrophoresis system. Talanta 2005, 68, 19–24. [Google Scholar]
- Lu, Q.; Collins, G.E.; Smith, M.; Wang, J. Sensitive capillary electrophoresis microchip determination of trinitroaromatic explosives in nonaqueous electrolyte following solid phase extraction. Analytica Chimica Acta 2002, 469, 253–260. [Google Scholar]
- Deng, G.; Collins, G.E. Nonaqueous based microchip separation of toxic metal ions using 2-(5-bromo-2-pyridylazo)-5-(N-propyl-N-sulfopropylamino)phenol. Journal of Chromatography A 2003, 989, 311–316. [Google Scholar]
- Matias, F.A.A.; Vila, M.M.D.C.; Tubino, M. A simple device for quantitative colorimetric diffuse reflectance measurements. Sensors and Actuators B: Chemical 2003, 88, 60–66. [Google Scholar]
- Sombatsompop, N.; Intawong, N.-S.; Intawong, N.-T. Design and construction of photo-conductive light pressure sensor for highly viscous fluids. Sensors and Actuators A: Physical 2002, 102, 76–82. [Google Scholar]
- Schrodle, S.; Buchner, R.; Kunz, W. Automated apparatus for the rapid determination of liquid-liquid and solid-liquid phase transitions. Fluid Phase Equilibria 2004, 216, 175–182. [Google Scholar]
- Lau, K.-T.; Shepherd, R.; Diamond, D.; Diamond, D. Solid State pH Sensor Based on Light Emitting Diodes (LED) As Detector Platform. Sensors 2006, 6, 848–859. [Google Scholar]
- Tubino, M.; de Souza, R.L. Determination of diclofenac in pharmaceutical preparations by diffuse reflectance photometry. Talanta 2006, 68, 776–780. [Google Scholar]
- Tubino, M.; Queiroz, C.A.R. Flow injection visible diffuse reflectance quantitative analysis of nickel. Analytica Chimica Acta 2006. In Press. [Google Scholar]
- Johnson, K.S.; Beehler, C.L.; Sakamoto-Arnold, C.M. A submersible flow analysis system. Analytica Chimica Acta 1986, 179, 245–257. [Google Scholar]
- Betteridge, D.; Cheng, W.C.; Dagless, E.L.; David, P.; Goad, T.B.; Deans, D.R.; Newton, D.A.; Pierce, T.B. An automated viscometer based on high-precision flow injection analysis. The Analyst 1983, 108, 1–16. [Google Scholar]
- Feres, M.A.; Reis, B.F. A downsized flow set up based on multicommutation for the sequential photometric determination of iron(II)/iron(III) and nitrite/nitrate in surface water. Talanta 2005, 68, 422–428. [Google Scholar]
- Tan, A.; Huang, J.; Geng, L.; Xu, J.; Zhao, X. A multi-channel photometric detector for multi-component analysis in flow injection analysis. Journal of Automatic Chemistry 1994, 16, 71–73. [Google Scholar]
- Trojanowicz, M.; Augustyniak, W.; Hulanicki, A. Photometric flow-injection measurements with flow-cell employing light emitting diodes. Microchimica Acta 1984, 83, 17–25. [Google Scholar]
- Santos, S.R.B.D.; Araujo, M.C.U.D.; Barbosa, R.A. An automated FIA system to determine alcoholic grade in beverages based on Schlieren effect measurements using an LED-photocolorimeter. The Analyst 2002, 127, 324–327. [Google Scholar]
- Schmidt, G.J.; W. Scott, R.P. Simple and sensitive ion chromatograph for trace metal determination. The Analyst 1984, 109, 997–1002. [Google Scholar]
- Clinch, J.R.; Worsfold, P.J.; Casey, H. An automated spectrophotometric field monitor for water quality parameters: Determination of nitrate. Analytica Chimica Acta 1987, 200, 523–531. [Google Scholar]
- Hauser, P.C.; Tan, S.S.; Cardwell, T.J.; Cattrall, R.W.; Hamilton, I.C. Versatile manifold for the simultaneous determination of ions in flow injection analysis. The Analyst 1988, 113, 1551–1555. [Google Scholar]
- Hauser, P.C.; Chiang, D.W.L. A photometric detector based on a blue light-emitting diode. Talanta 1993, 40, 1193–1200. [Google Scholar]
- Rainelli, A.; Stratz, R.; Schweizer, K.; Hauser, P.C. Miniature flow-injection analysis manifold created by micromilling. Talanta 2003, 61, 659–665. [Google Scholar]
- Trojanowicz, M.; Szpunar-Lobinska, J. Simultaneous flow-injection determination of aluminium and zinc using LED photometric detection. Analytica Chimica Acta 1990, 230, 125–130. [Google Scholar]
- Freeman, P.R.; McKelvie, I.D.; Hart, B.T.; Cardwell, T.J. Flow-injection technique for the determination of low levels of phosphorus in natural waters. Analytica Chimica Acta 1990, 234, 409–416. [Google Scholar]
- Chediak, J.A.; Luo, Z.; Seo, J.; Cheung, N.; Lee, L.P.; Sands, T.D. Heterogeneous integration of CdS filters with GaN LEDs for fluorescence detection microsystems. Sensors and Actuators A: Physical 2004, 111, 1–7. [Google Scholar]
- Yamada, A.; Sakuraba, M.; Murota, J. Integration of Si p-i-n diodes for light emitter and detector with optical waveguides. Materials Science in Semiconductor Processing 2005, 8, 435–438. [Google Scholar]
- Park, J.M.; Shon, O.J.; Hong, H.-G.; Kim, J.S.; Kim, Y.; Lim, H.B. Development of a microchip metal ion sensor using dinitro-azocalix[4]azacrown. Microchemical Journal 2005, 80, 139–144. [Google Scholar]
- Sonne, K.; Dasgupta, P.K. Simultaneous photometric flow-injection determination of sulfide, polysulfide, sulfite, thiosulfate, and sulfate. Analytical Chemistry 1991, 63, 427–432. [Google Scholar]
- Dong, S.; Dasgupta, P.K. Automated determination of total phosphorus in aqueous samples. Talanta 1991, 38, 133–137. [Google Scholar]
- Worsfold, P.J.; Clinch, J.R.; Casey, H. Spectrophotometric field monitor for water quality parameters: The Determination of Phosphate. Analytica Chimica Acta 1987, 197, 43–50. [Google Scholar]
- Liu, H.; Dasgupta, P.K. Dual-wavelength photometry with light emitting diodes. Compensation of refractive index and turbidity effects in flow-injection analysis. Analytica Chimica Acta 1994, 289, 347–353. [Google Scholar]
- Huang, J.; Liu, H.; Tan, A.; Xu, J.; Zhao, X. A dual-wavelength light-emitting diode based detector for flow-injection analysis process analysers. Talanta 1992, 39, 589–592. [Google Scholar]
- Gros, N. Spectrometer with microreaction chamber and tri-colour light emitting diode as a light source. Talanta 2004, 62, 143–150. [Google Scholar]
- Gros, N. A new type of a spectrometric microtitration set up. Talanta 2005, 65, 907–912. [Google Scholar]
- Hauser, P.C.; Rupasinghe, T.W.T.; Cates, N.E. A multi-wavelength photometer based on light-emitting diodes. Talanta 1995, 42, 605–612. [Google Scholar]
- Fonseca, A.; Raimundo, J.; Ivo, M. A multichannel photometer based on an array of light emitting diodes for use in multivariate calibration. Analytica Chimica Acta 2004, 522, 223–229. [Google Scholar]
- Suzuki, A.; Kondoh, J.; Matsui, Y.; Shiokawa, S.; Suzuki, K. Development of novel optical waveguide surface plasmon resonance (SPR) sensor with dual light emitting diodes. Sensors and Actuators B: Chemical 2005, 106, 383–387. [Google Scholar]
- Lau, K.T.; Baldwin, S.; Shepherd, R.L.; Dietz, P.H.; Yerzunis, W.S.; Diamond, D. Novel fused-LEDs devices as optical sensors for colorimetric analysis. Talanta 2004, 63, 167–173. [Google Scholar]
- O'Toole, M.; Lau, K.-T.; Diamond, D. Photometric detection in flow analysis systems using integrated PEDDs. Talanta 2005, 66, 1340–1344. [Google Scholar]
- Lau, K.-T.; Baldwin, S.; O'Toole, M.; Shepherd, R.; Yerazunis, W.J.; Izuo, S.; Ueyama, S.; Diamond, D. A low-cost optical sensing device based on paired emitter-detector light emitting diodes. Analytica Chimica Acta 2006, 557, 111–116. [Google Scholar]
- O'Toole, M.; Lau, K.-T.; Schazmann, B.; Shepherd, R.; Nesterenko, P.N.; Paull, B.; Diamond, D. Novel Integrated Paired Emitter Detector Diode as a Miniaturized Photometric Detector in HPLC. The Analyst 2006, 131, 938–943. [Google Scholar]
- Lau, K.-T.; Yerazunis, W.S.; Shepherd, R.L.; Diamond, D. Quantitative colorimetric analysis of dye mixtures using an optical photometer based on LED array. Sensors and Actuators B: Chemical 2006, 114, 819–825. [Google Scholar]
- Lau, K.T.; McHugh, E.; Baldwin, S.; Diamond, D. Paired emitter-detector light emitting diodes for the measurement of lead(II) and cadmium(II). Analytica Chimica Acta 2006, 569, 221–226. [Google Scholar]
- Barron, L.; Nesterenko, P.N.; Diamond, D.; O'Toole, M.; Lau, K.-T.; Paull, B. Low pressure ion chromatography with a low cost paired emitter-detector diode based detector for the determination of alkaline earth metals in water samples. Analytica Chimica Acta 2006, 577, 32–37. [Google Scholar]
- O'Toole, M.; Lau, K.-T.; Shepherd, R.; Slater, C.; Diamond, D. Determination of Phosphate using a Highly Sensitive Paired Emitter-Detector Diode Photometric Detector. Analytica Chimica Acta 2007, 597, 290–294. [Google Scholar]
- Mims, F.M., III. Sun photometer with light emitting diode as spectrally selective detectors. Applied Optics 1992, 31, 6965–6967. [Google Scholar]
- Acharya, Y.B.; Jayaraman, A.; Ramachandran, S.; Subbaraya, B.H. Compact light-emitting-diode sun photometer for atmospheric optical depth measurements. Applied Optics 1995, 34, 1209–1214. [Google Scholar]
- Berry, R.J.; Harris, J.E.; Williams, R.R. Light-Emitting Diodes as Sensors for Colorimetric Analyses. Applied Spectroscopy 1997, 51, 1521–1524. [Google Scholar]
- Eiichi, M.; Shin, I.; Tsutomu, A. Using a light-emitting diode as a high-speed, wavelength selective photodetector. Review of Scientific Instruments 1998, 69, 3751–3754. [Google Scholar]
- Betteridge, D. Flow Injection Analysis. Analytical Chemistry 1978, 50, 832A–846A. [Google Scholar]
- Betteridge, D.; Sly, T.J.; Wade, A.P.; Porter, D.G. Versatile automatic development system for flow injection analysis. Analytical Chemistry 1986, 58, 2258–2265. [Google Scholar]
- Jambunathan, S.; Dasgupta, P.K.; Wolcott, D.K.; Marshall, G.D.; Olson, D.C. Optical fiber coupled light emitting diode based absorbance detector with a reflective flow cell. Talanta 1999, 50, 481–490. [Google Scholar]
- Daykin, R.N.C.; Haswell, S.J. Development of a micro flow injection manifold for the determination of orthophosphate. Analytica Chimica Acta 1995, 313, 155–159. [Google Scholar]
- Carroll, M.K.; Conboy, M.; Murfin, A.; Tyson, J.F. Solid-state microprocessor-controlled detector for doublet peak measurements in flow-injection analysis. Analytica Chimica Acta 1994, 295, 143–149. [Google Scholar]
- Johns, C.; Macka, M.; Haddad, P.R. Design and performance of a light-emitting diode detector compatible with a commercial capillary electrophoresis instrument. Electrophoresis 2004, 25, 3145–3152. [Google Scholar]
- Liu, S.; Dasgupta, P.K. Liquid Droplet. A Renewable Gas Sampling Interface. Analytical Chemistry 1995, 67, 2042–2049. [Google Scholar]
- Cardoso, A.A.; Dasgupta, P.K. Analytical Chemistry in a Liquid Film/Droplet. Analytical Chemistry 1995, 67, 2562–2566. [Google Scholar]
- Liu, H.; Dasgupta, P.K. A Renewable Liquid Droplet as a Sampler and a Windowless Optical Cell. Automated Sensor for Gaseous Chlorine. Analytical Chemistry 1995, 67, 4221–4228. [Google Scholar]
- King, M.; Paull, B.; Haddad, P.R.; Macka, M. Performance of a simple UV LED light source in the capillary electrophoresis of inorganic anions with indirect detection using a chromate background electrolyte. The Analyst 2002, 127, 1564–1567. [Google Scholar]
- Kuban, P.; Guchardi, R.; Hauser, P.C. Trace-metal analysis with separation methods. Trends in Analytical Chemistry 2005, 24, 192–198. [Google Scholar]
- Pacquit, A.; Lau, K.T.; McLaughlin, H.; Frisby, J.; Quilty, B.; Diamond, D. Development of a volatile amine sensor for the monitoring of fish spoliage. Talanta 2006, 69, 515–520. [Google Scholar]
- Artur, D.; Wojciech, W.; Janusz, M.; Ryszard, S.R.; Zbigniew, B. Fiber optic probe for monitoring of drinking water. presented at Chemical, Biochemical and Environmental Fiber Sensors IX, Munich; 1997. [Google Scholar]
- Dybko, A.; Wroblewski, W.; Rozniecka, E.; Pozniakb, K.; Maciejewski, J.; Romaniuk, R.; Brzozka, Z. Assessment of water quality based on multiparameter fiber optic probe. Sensors and Actuators B: Chemical 1998, 51, 208–213. [Google Scholar]
- Smardzewski, R.R. Multi-element optical waveguide sensor: General concept and design. Talanta 1988, 35, 95–101. [Google Scholar]
- Li, Q.; Morris, K.J.; Dasgupta, P.K.; Raimundo, I.M.; Temkin, H. Portable flow-injection analyzer with liquid-core waveguide based fluorescence, luminescence, and long path length absorbance detector. Analytica Chimica Acta 2003, 479, 151–165. [Google Scholar]
- Ramırez-Garcıa, S.; Diamond, D. Biomimetic, low power pumps based on soft actuators. Sensors and Actuators A 2007, 135, 229–235. [Google Scholar]
- Ramirez-Garcia, S.; Diamond, D. Internet-scale Sensing: Are Biomimetic Approaches the Answer? Journal of Intelligent Material Systems and Structures 2007, 18, 159–164. [Google Scholar]
- Diamond, D.; Lau, K.T.; Brady, S.; Cleary, J. Integration of analytical measurements and wireless communications—Current issues and future strategies. Talanta 2007. In Press, Corrected Proof. [Google Scholar]
- Hooley, D.J.; Dessy, R.E. Continuous flow kinetic techniques in flow injection analysis. Analytical Chemistry 1983, 55, 313–320. [Google Scholar]
- Zagatto, E.A.G.; Arruda, M.A.Z.; Jacintho, A.O.; Mattos, I.L. Compensation of the schlieren effect in flow-injection analysis by using dual-wavelength spectrophotometry. Analytica Chimica Acta 1990, 234, 153–160. [Google Scholar]
- Eom, I.-Y.; Dasgupta, P.K. Frequency-selective absorbance detection: Refractive index and turbidity compensation with dual-wavelength measurement. Talanta 2006, 69, 906–913. [Google Scholar]
- Beach, J.M. A LED light calibration source for dual-wavelength microscopy. Cell Calcium 1997, 21, 63–68. [Google Scholar]
- Schnable, J.G.; Grochowski, P.J.; Wilhelm, L.; Harding, C.; Kiefer, M.; Orr, R.S. Portable LED-array VIS-NIR spectrophotometer/nephelometer. Field Analytical Chemistry and Technology 1998, 2, 21–28. [Google Scholar]
- Suzuki, Y.; Hori, H.; Iwatsuki, M.; Yamane, T. A four-wavelength channel absorbance detector with a light emitting diode-fiber optics assembly for simplifying the flow-injection analysis system. Analytical Sciences 2003, 19, 1025–1028. [Google Scholar]
- Cantrell, K.M.; Ingle, J.D. The SLIM Spectrometer. Analytical Chemistry 2003, 75, 27–35. [Google Scholar]
- Zude, M.; Birlouez-Aragon, I.; Paschold, P.-J.; Rutledge, D.N. Non-invasive spectrophotometric sensing of carrot quality from harvest to consumption. Postharvest Biology and Technology 2007. In Press, Corrected Proof. [Google Scholar]
- Fonseca, A.; Raimundo, I.M., Jr. A simple method for water discrimination based on an light emitting diode (LED) photometer. Analytica Chimica Acta 2007, 596, 66–72. [Google Scholar]
- Gros, N. A novel type of tri-colour light-emitting-diode-based spectrometric detector for low-budget flow-injection analysis. Sensors 2007, 7, 166–184. [Google Scholar]
- Yang, P.K.; Chen, J.C.; Chuang, Y.H. Improvement on reflective color measurement using a tricolor LED by multi-point calibration. Optics Communications 2007, 272, 320–324. [Google Scholar]
- Rocha, F.R.P.; Reis, B.F. A flow system exploiting multicommutation for speciation of inorganic nitrogen in waters. Analytica Chimica Acta 2000, 409, 227–235. [Google Scholar]
- Mims, F.M., III. How to monitor ultraviolet radiation from the sun. Scientific American 1990, 263, 106–109. [Google Scholar]
- Riley, M.R.; Jordan, K.A.; Cox, M.L. Development of a cell-based sensing device to evaluate toxicity of inhaled materials. Biochemical Engineering journal 2004, 19, 95–99. [Google Scholar]
- Kawamura, K.; Vestergaard, M.d.; Ishiyama, M.; Nagatani, N.; Hashiba, T.; Tamiya, E. Development of a novel hand-held toluene gas sensor: Possible use in the prevention and control of sick building syndrome. Measurement 2006, 39, 490–496. [Google Scholar]
- Smiddy, M.; Papkovskaia, N.; Papkovsky, D.B.; Kerry, J.P. Use of oxygen sensors for the nondestructive measurement of the oxygen content in modified atmosphere and vacuum packs of cooked chicken patties; impact of oxygen content on lipid oxidation. Food Research International 2002, 35, 577–584. [Google Scholar]
- Firstenberg-Eden, R.; Shelef, L.A. A new rapid automated method for the detection of Listeria from environmental swabs and sponges. International Journal of Food Microbiology 2000, 56, 231–237. [Google Scholar]
- Pacquit, A.; Frisby, J.; Diamond, D.; Lau, K.T.; Farrell, A.; Quilty, B.; Diamond, D. Development of a smart packaging for the monitoring of fish spoilage. Food Chemistry 2007, 102, 466–470. [Google Scholar]
- Ichikawa, T.; Horiuchi, M.; Ichiba, H.; Matsumoto, N. Trial production and application of an optical system for measuring the movements of organs composed of soft tissue. The Journal of Prosthetic Dentistry 1990, 64, 227–231. [Google Scholar]
- Mitrani, A.A.; Gonzalez, M.L.; O'Connell, M.T.; Guerra, J.; Harwood, R.B.; Gardner, L.B. Detection of clinically suspected deep vein thrombosis using light reflection rheography. The American Journal of Surgery 1991, 161, 646–650. [Google Scholar]
- Teshima, N.; Li, J.; Toda, K.; Dasgupta, P.K. Determination of acetone in breath. Analytica Chimica Acta 2005, 535, 189–199. [Google Scholar]
- Singh, S. Sensors-An effective approach for the detection of explosives. Journal of Hazardous Materials 2007. In Press. [Google Scholar]
- Lee, R.S.; Aldis, D.F.; Garrett, D.W.; Lai, F.S. Improved diagnostics for determination of minimum explosive concentration, ignition energy and ignition temperature of dusts. Powder Technology 1982, 31, 51–62. [Google Scholar]
- Pamula, V.K.; Svinivasan, V.; Chakrapani, H.; Fair, R.B.; Toone, E.J. A droplet-based lab-on-a-chip for coloflumetric detection of nitroaromatic explosives. presented at Micro Electro Mechanical Systems, 2005; 2005. [Google Scholar]
- Koch, S.; Wolf, H.; Danapel, C.; Feller, K.A. Optical flow-cell multichannel immunosensor for the detection of biological warfare agents. Biosensors and Bioelectronics 2000, 14, 779–784. [Google Scholar]
- Higgins, J.A.; Nasarabadi, S.; Karns, J.S.; Shelton, D.R.; Cooper, M.; Gbakima, A.; Koopman, R.P. A handheld real time thermal cycler for bacterial pathogen detection. Biosensors and Bioelectronics 2003, 18, 115–1123. [Google Scholar]
- Lyddy-Meaney, A.J.; Ellis, P.S.; Worsfold, P.J.; Butler, E.C.V.; McKelvie, I.D. A compact flow injection analysis system for surface mapping of phosphate in marine waters. Talanta 2002, 58, 1043–1053. [Google Scholar]
- Ellis, P.S.; Lyddy-Meaney, A.J.; Worsfold, P.J.; McKelvie, I.D. Multi-reflection photometric flow cell for use in flow injection analysis of estuarine waters. Analytica Chimica Acta 2003, 499, 81–89. [Google Scholar]
- Blundell, N.J.; Worsfold, P.J.; Casey, H.; Smith, S. The design and performance of a portable, automated flow injection monitor for the in-situ analysis of nutrients in natural waters. Environmental International 1995, 21, 205–209. [Google Scholar]
- Gardolinski, P.C.F.C.; David, A.R.J.; Worsfold, P.J. Miniature flow injection analyser for laboratory, shipboard and in situ monitoring of nitrate in estuarine and coastal waters. Talanta 2002, 58, 1015–1027. [Google Scholar]
- David, A.R.J.; McCormack, T.; Morris, A.W.; Worsfold, P.J. A submersible flow injection-based sensor for the determination of total oxidised nitrogen in coastal waters. Analytica Chimica Acta 1998, 361, 63–72. [Google Scholar]
- Andrew, K.N.; Worsfold, P.J.; Comber, M. On-line flow injection monitoring of ammonia in industrial liquid effluents. Analytica Chimica Acta 1995, 314, 33–43. [Google Scholar]
- Benson, R.L.; McKelvie, I.D.; Hart, B.T.; Truong, Y.B.; Hamilton, I.C. Determination of total phosphorus in waters and wastewaters by on-line UV/thermal induced digestion and flow injection analysis. Analytica Chimica Acta 1996, 326, 29–39. [Google Scholar]
- Dasgupta, P.K.; Huang, H.; Zhang, G.; Cobb, G.P. Photometric measurement of trace As(III) and As(V) in drinking water. Talanta 2002, 58, 153–164. [Google Scholar]
- Vachirapatama, N.; Macka, M.; Haddad, P.R. Separation and determination of vanadium in fertiliser by capillary electrophoresis with light-emitting diode detector. Analytical Bioanalytical Chemistry 2002, 374, 1082–1085. [Google Scholar]
- Hauser, P.C.; Rupasinghe, T.W.T.; Lucas, C.C.; McClure, A. Process monitor for an ammoniacal nickel solution employing an infrared light-emitting diode and a log-ratio amplifier. The Analyst 1995, 120, 2635–2638. [Google Scholar]
- Chapin, T.P.; Jannasch, H.W.; Johnson, K.S. In situ osmotic analyzer for the year-long continuous determination of Fe in hydrothermal systems. Analytica Chimica Acta 2002, 463, 265–274. [Google Scholar]
Figure 1.
Examples of the UV-vis spectral range covered by a variety of commercially available LEDs.
Figure 1.
Examples of the UV-vis spectral range covered by a variety of commercially available LEDs.

Figure 2.
Sectional view of the transducer cell [23]. Reproduced with permission from The Royal Society of Chemistry.
Figure 2.
Sectional view of the transducer cell [23]. Reproduced with permission from The Royal Society of Chemistry.

Figure 3.
Cross-sectional view of the transducer cell: (1) inlet/outlet, (2) fibre optic cable, (3) stripped section of the fiber optic cable, (4) optical path [57]. Reproduced with permission from Talanta.
Figure 3.
Cross-sectional view of the transducer cell: (1) inlet/outlet, (2) fibre optic cable, (3) stripped section of the fiber optic cable, (4) optical path [57]. Reproduced with permission from Talanta.

Figure 4.
Schematic of the proposed reflectance device. The LED and the LDR are placed, in the same plane, at a 45° angle with respect to the reflecting surface and at an angle of 90° with respect to each other. Adapted from [42].
Figure 4.
Schematic of the proposed reflectance device. The LED and the LDR are placed, in the same plane, at a 45° angle with respect to the reflecting surface and at an angle of 90° with respect to each other. Adapted from [42].
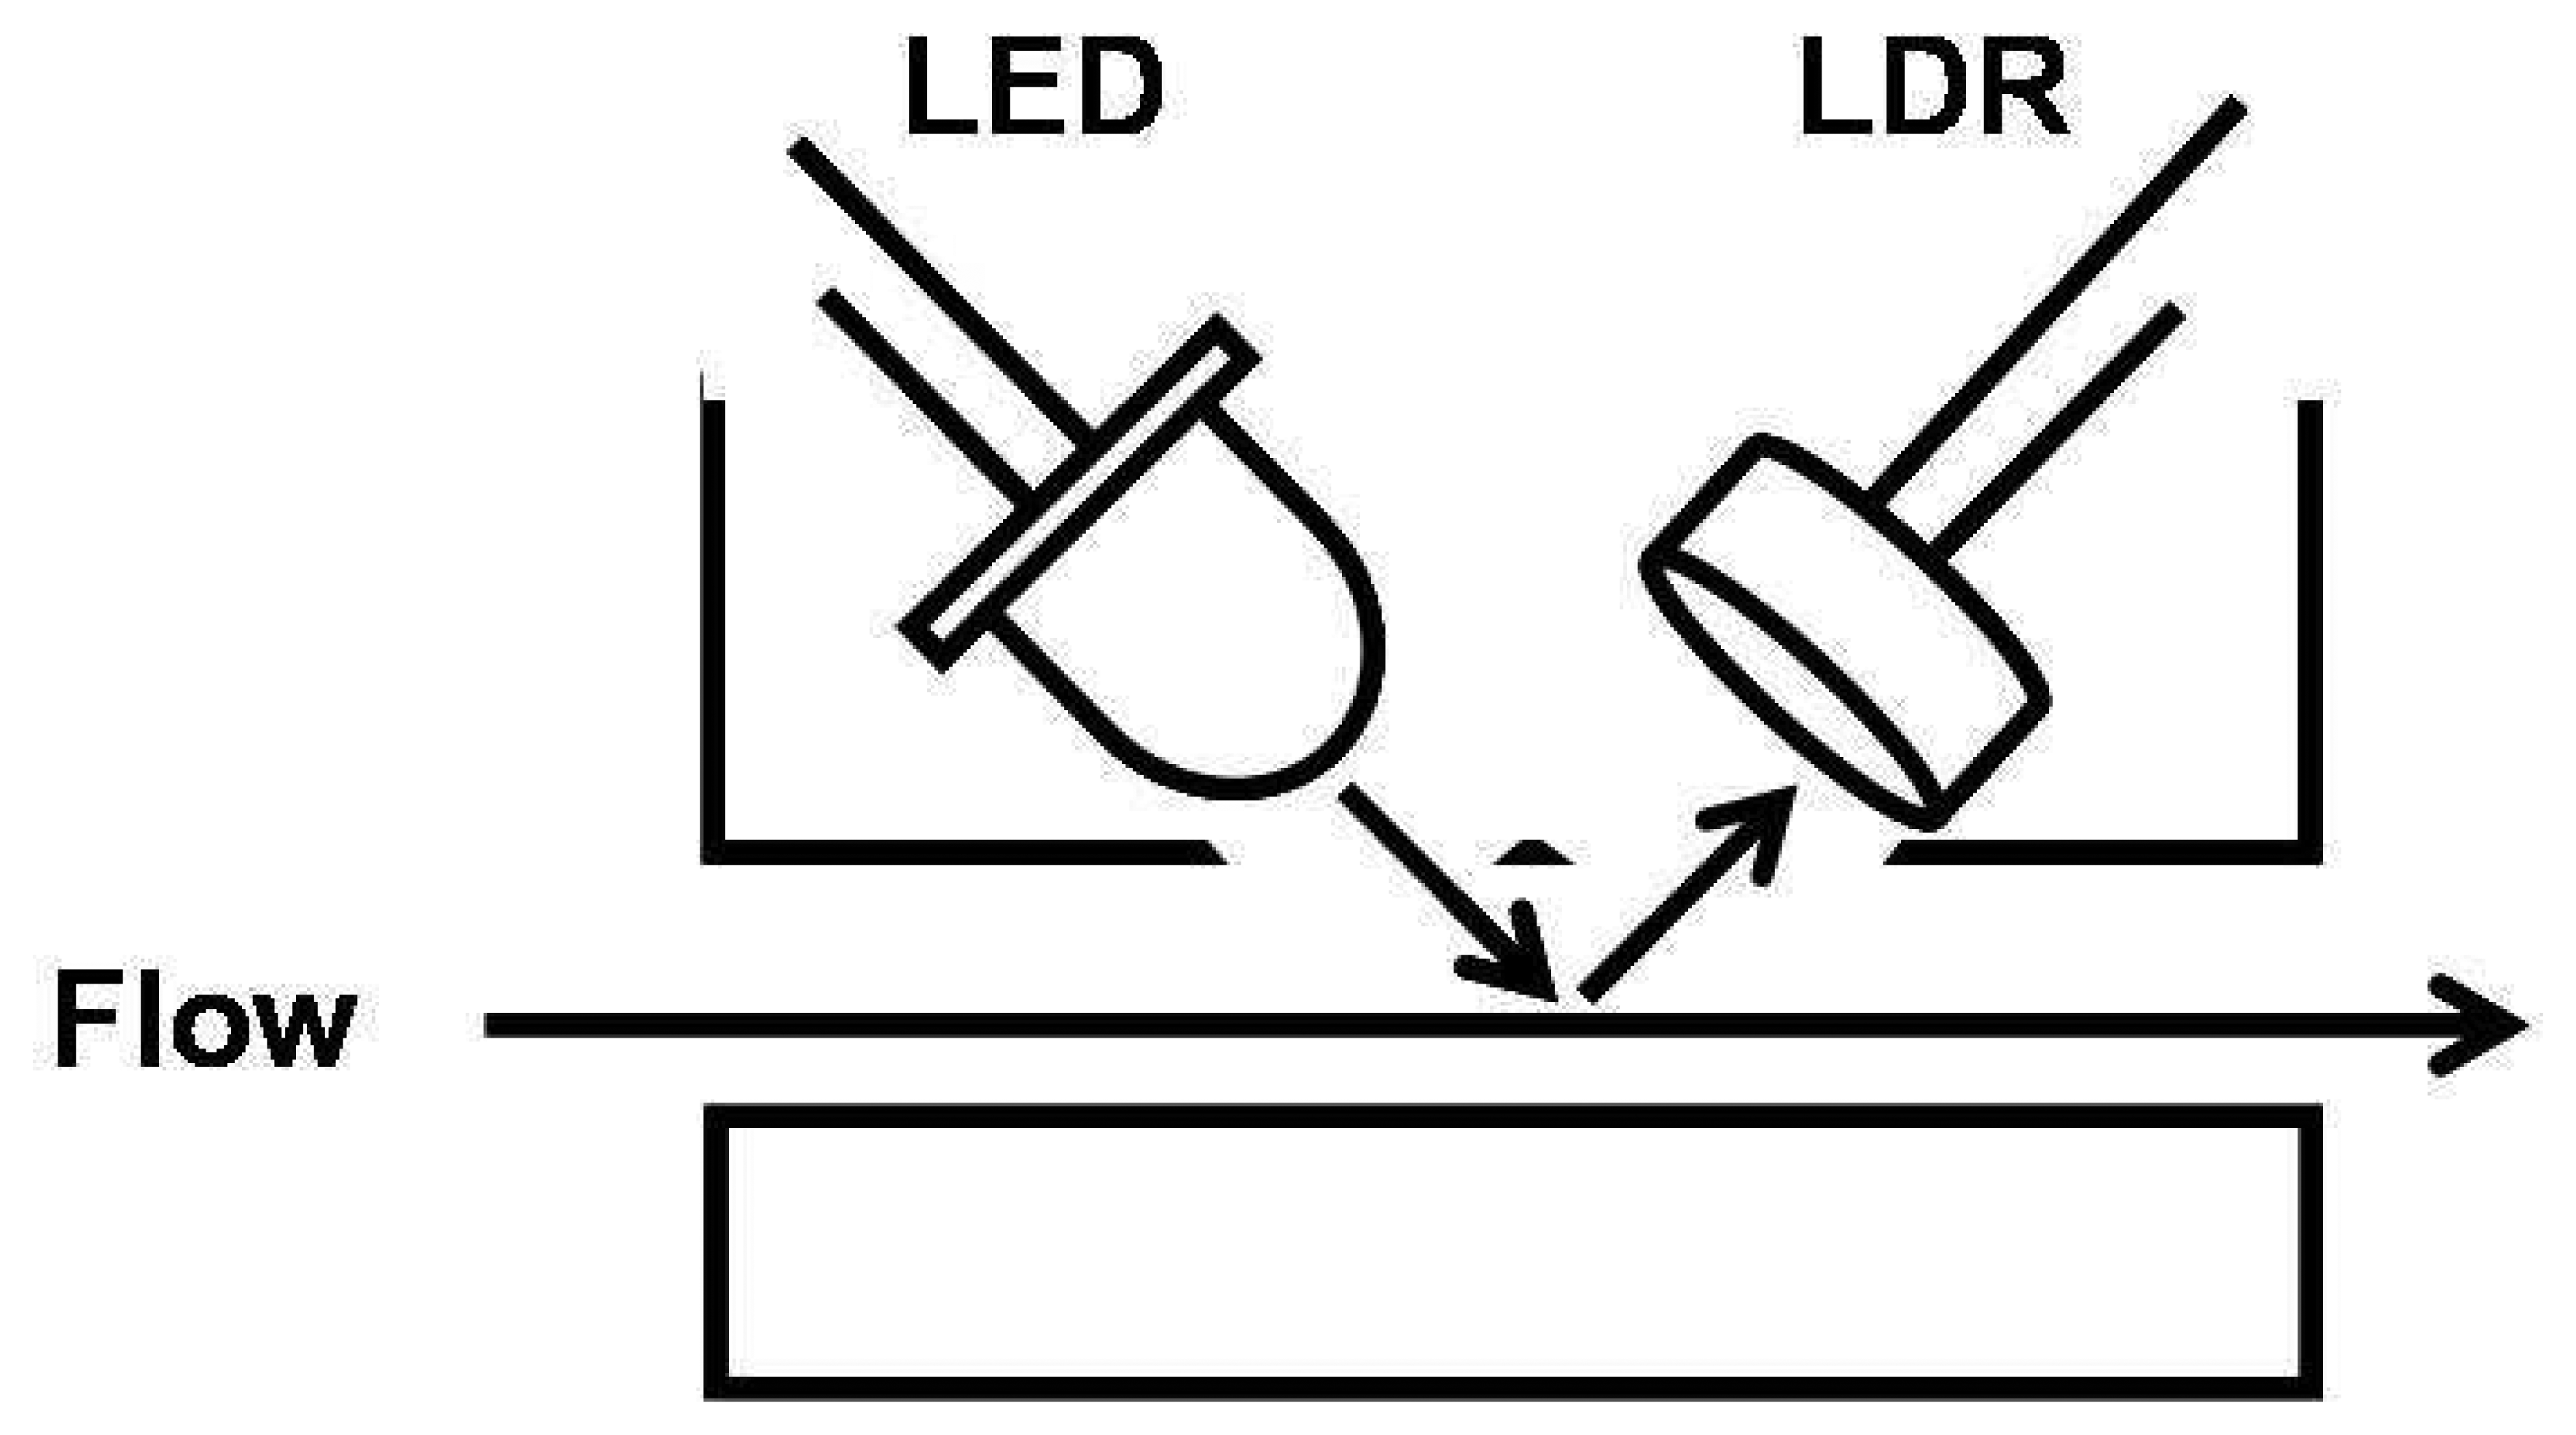
Figure 5.
Schematic of the flow cell housing made of aluminium. Adapted from [66].
Figure 5.
Schematic of the flow cell housing made of aluminium. Adapted from [66].
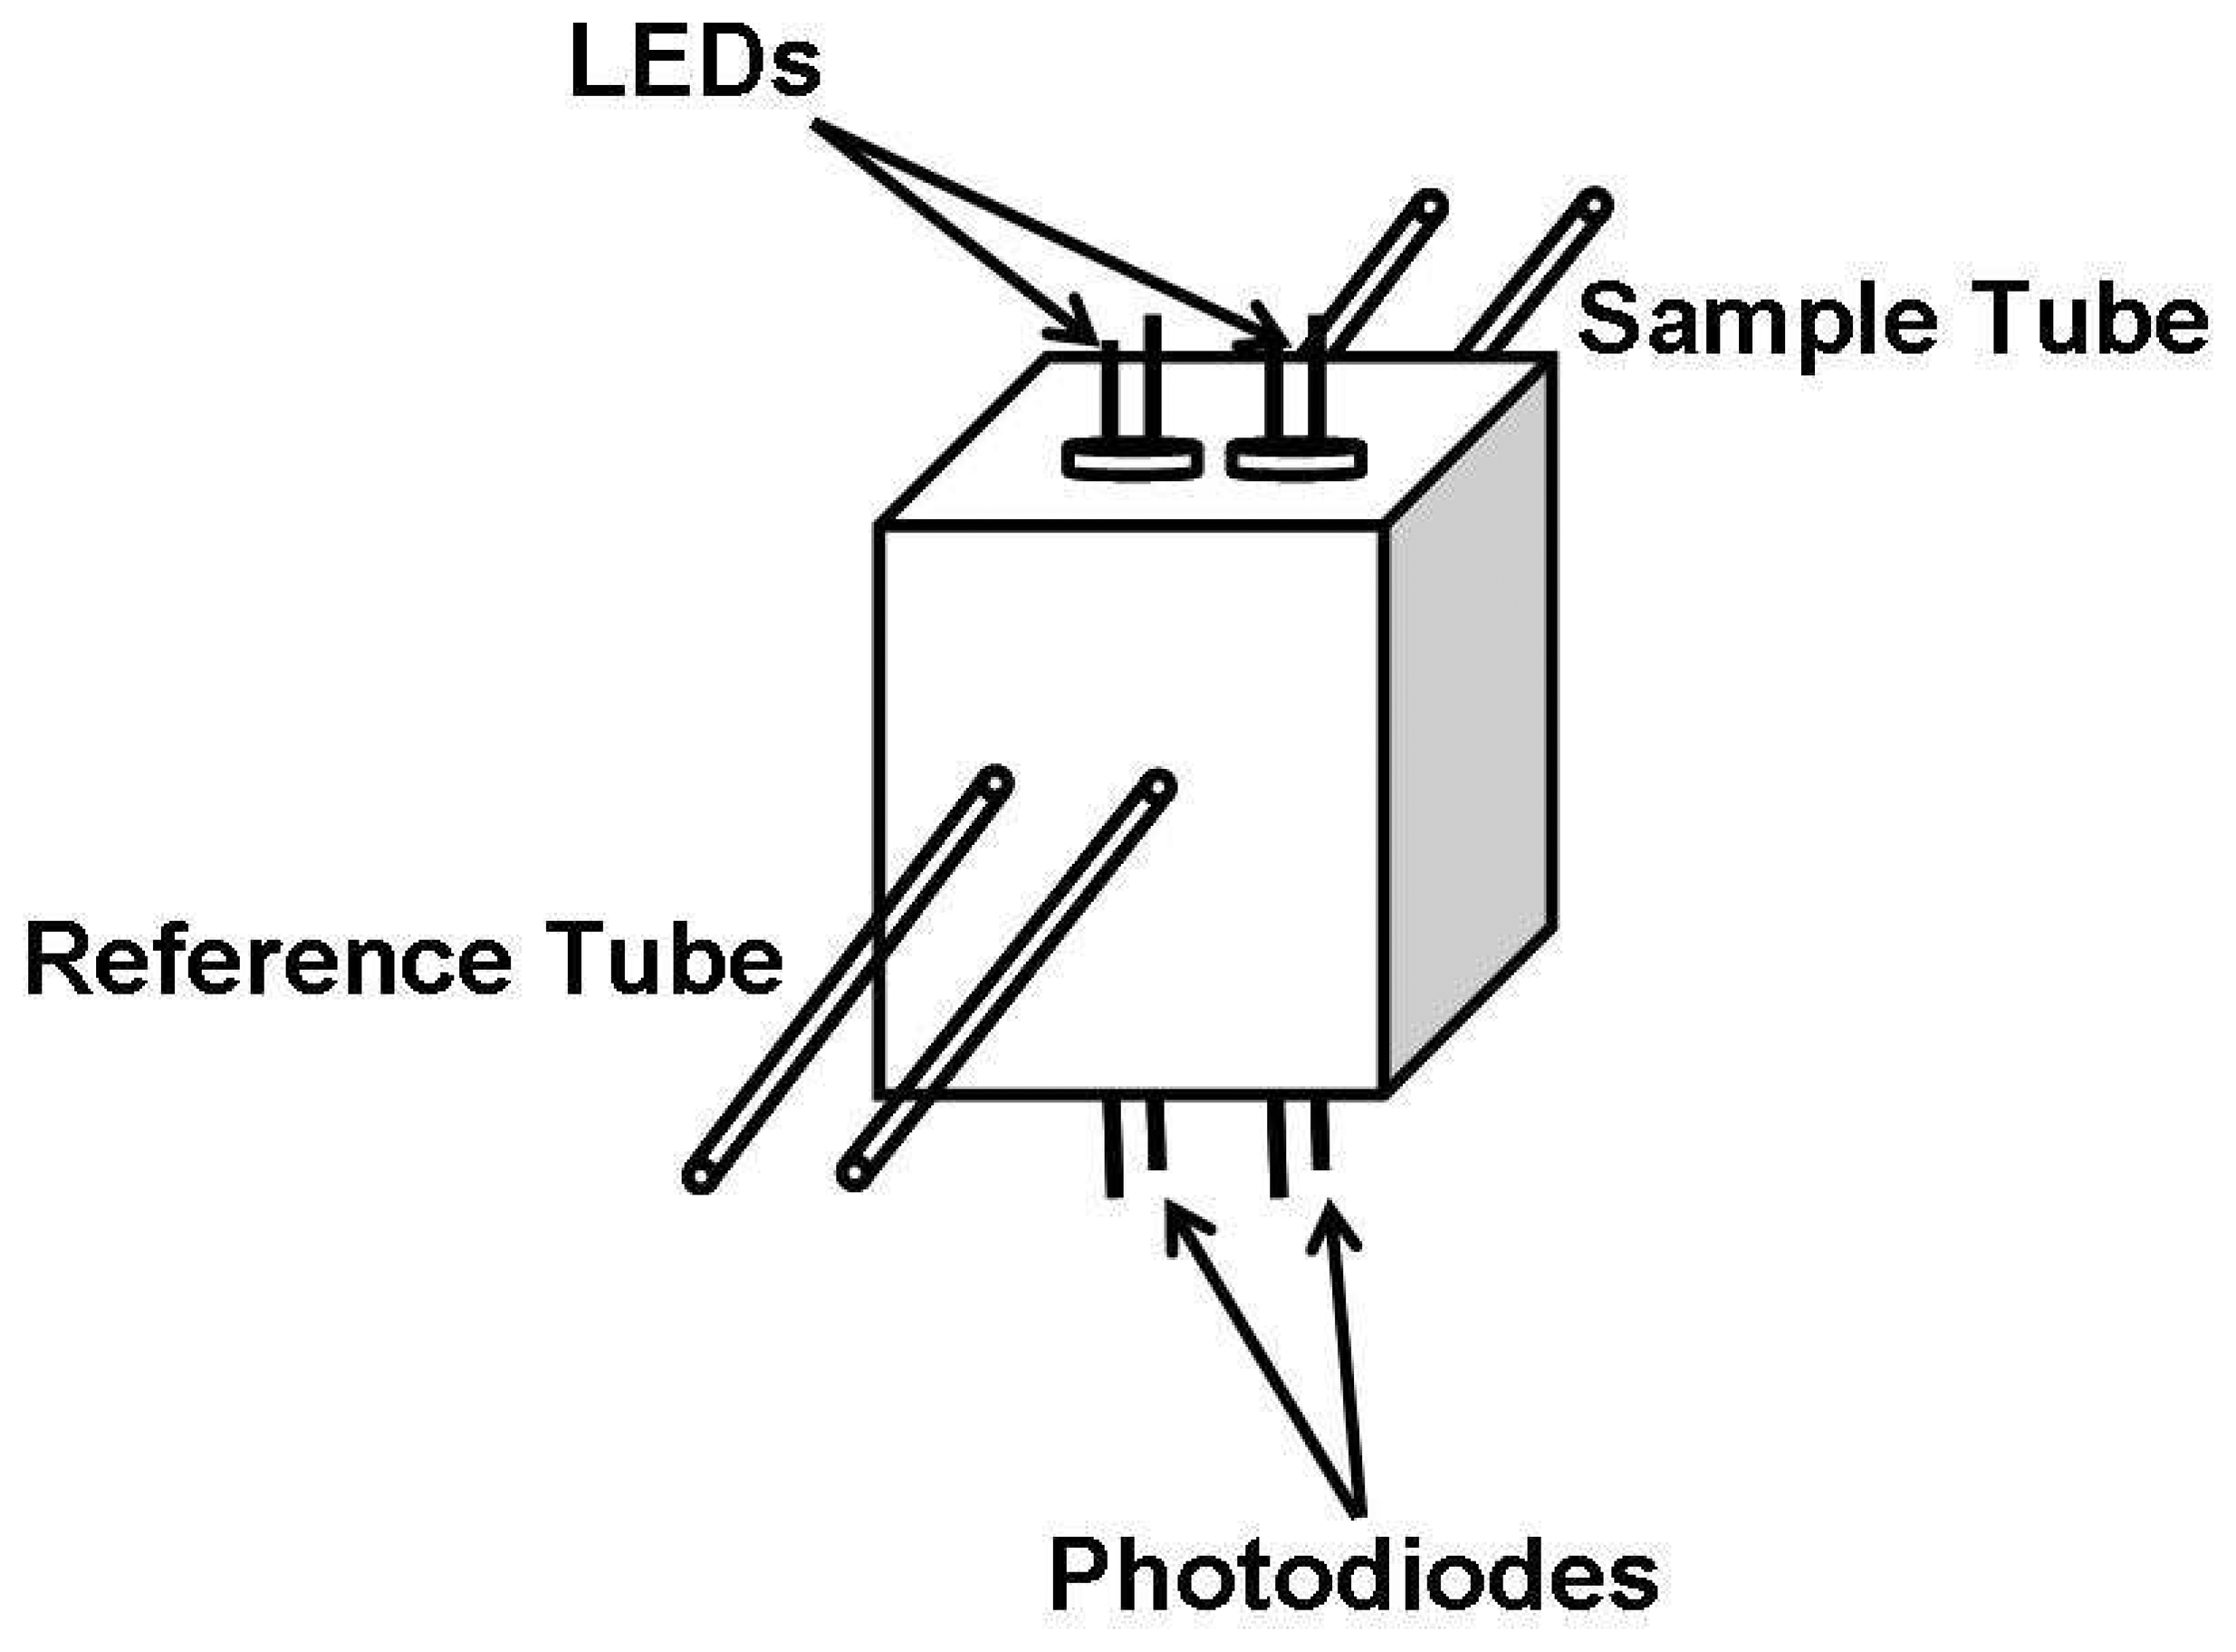
Figure 6.
The circuit diagram for the multi-LED photometer [71]. Reproduced with permission from Talanta.
Figure 6.
The circuit diagram for the multi-LED photometer [71]. Reproduced with permission from Talanta.
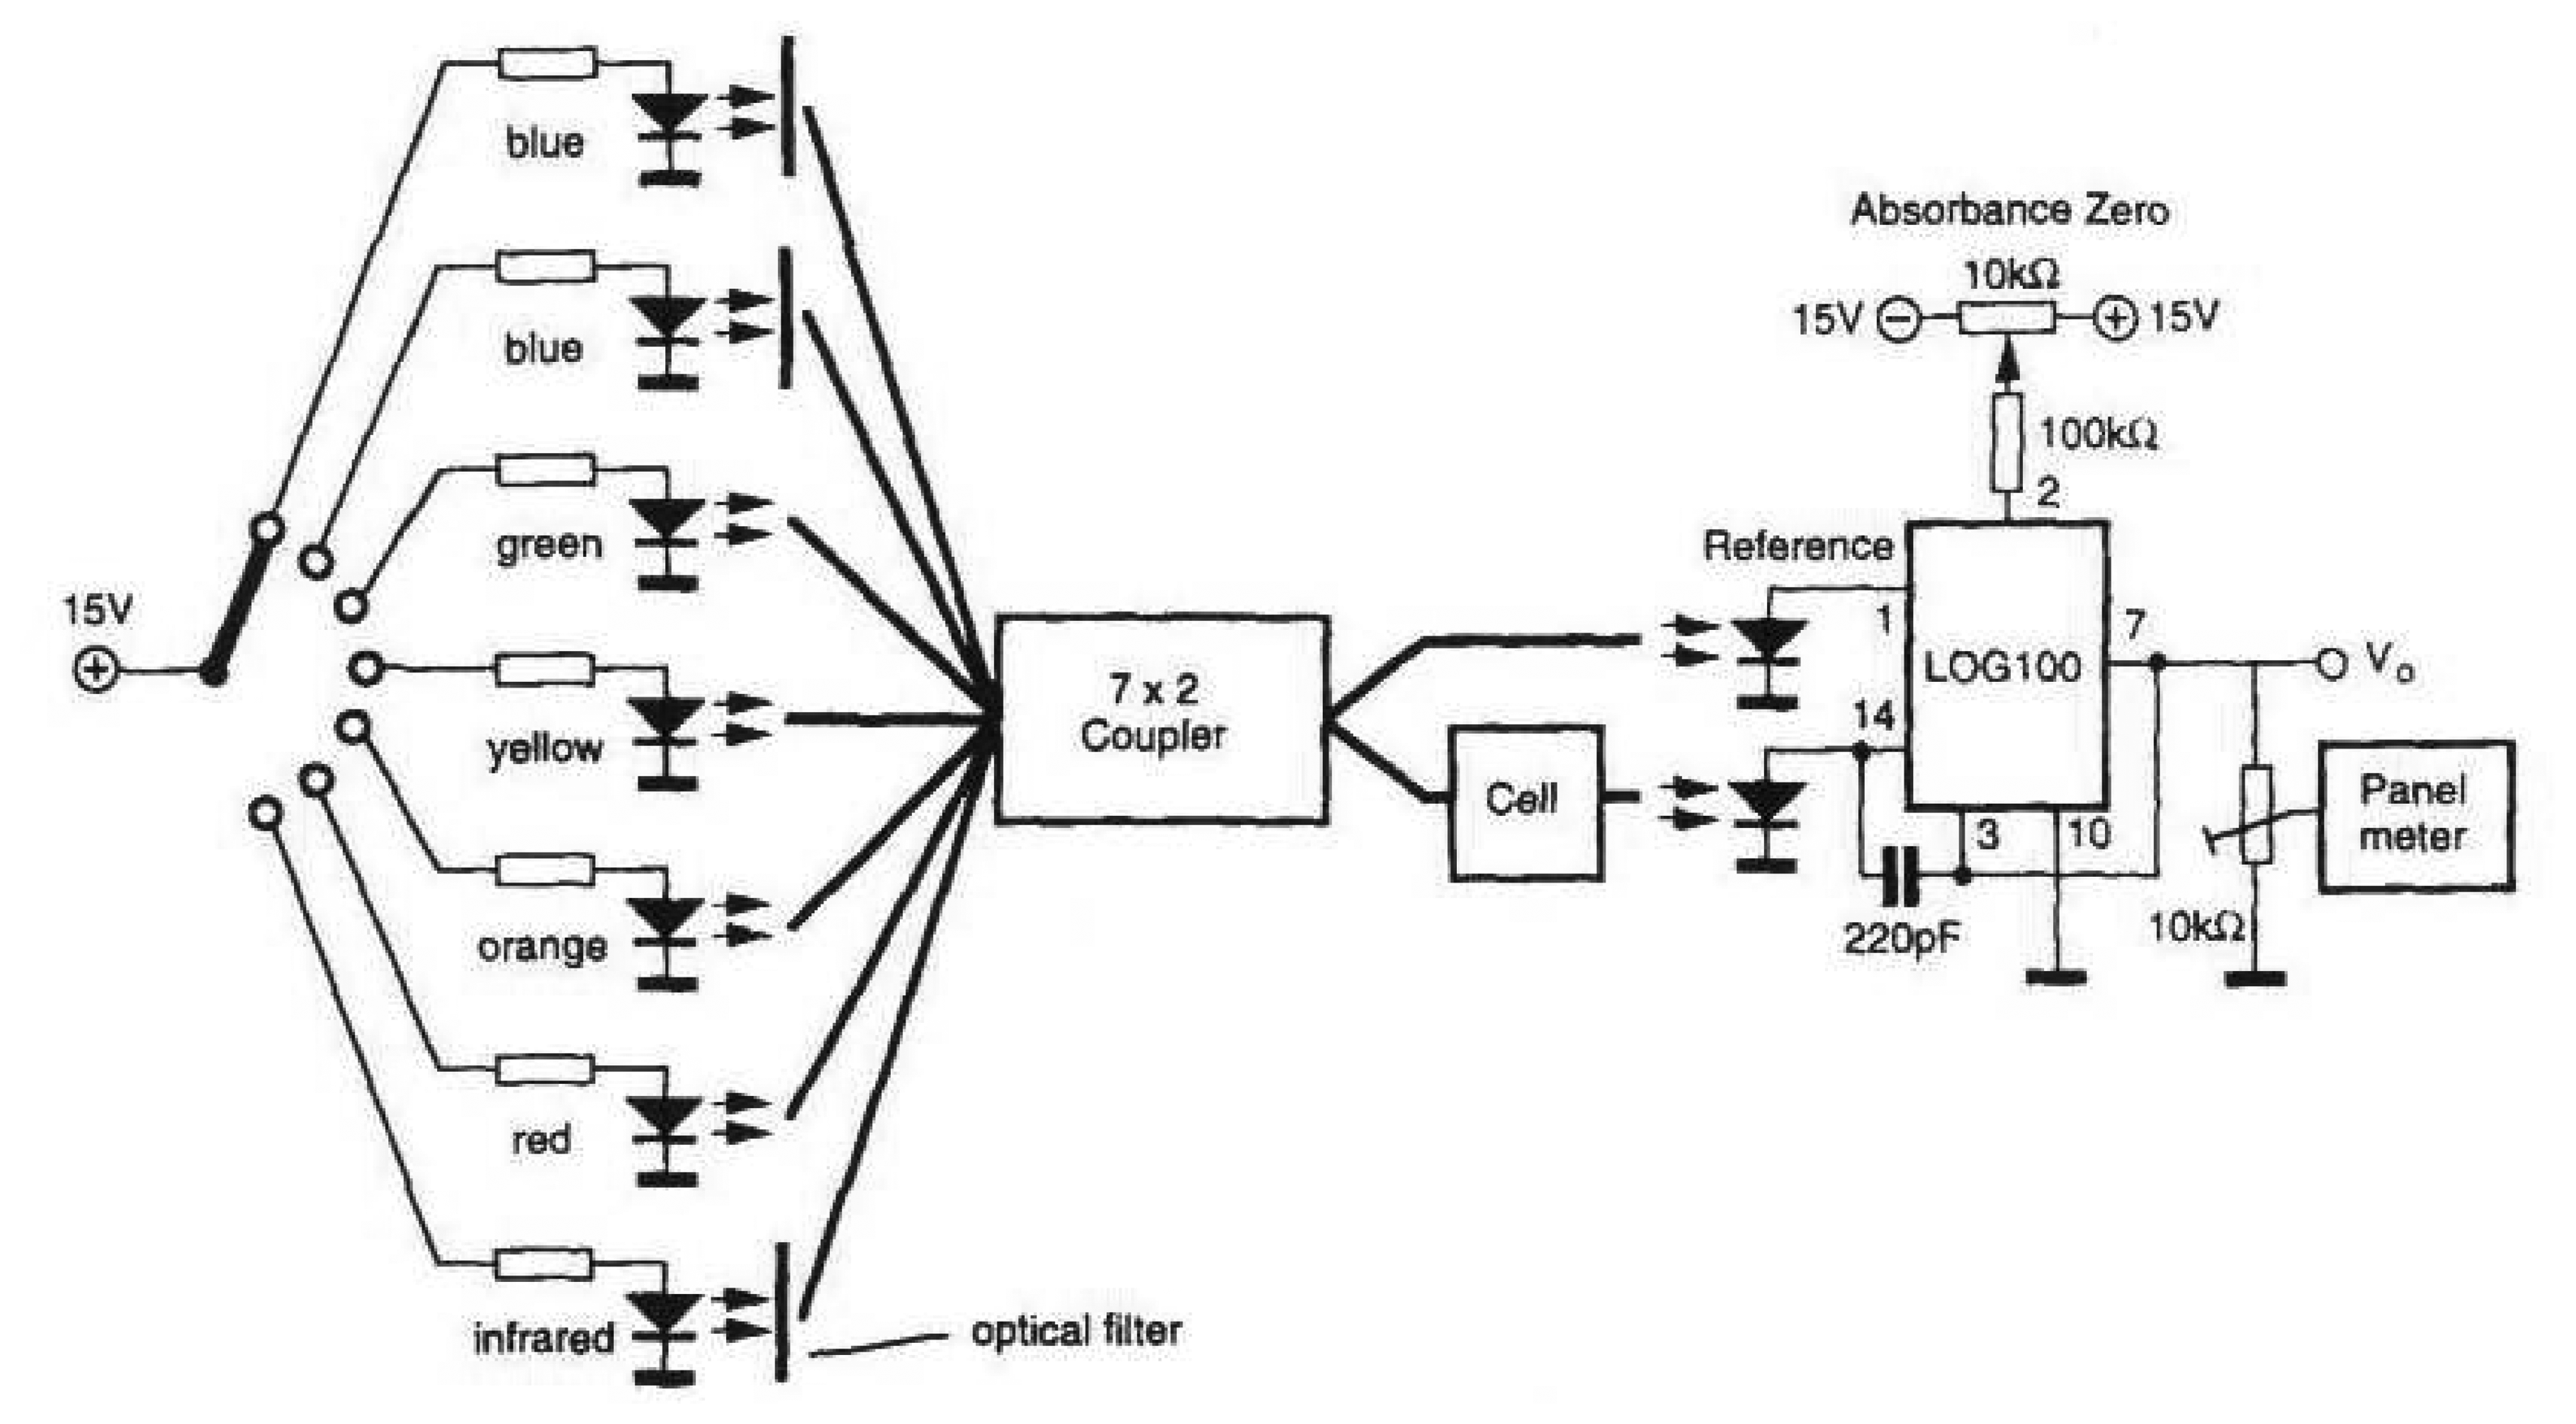
Figure 7.
Schematic of Tri-colour LED.
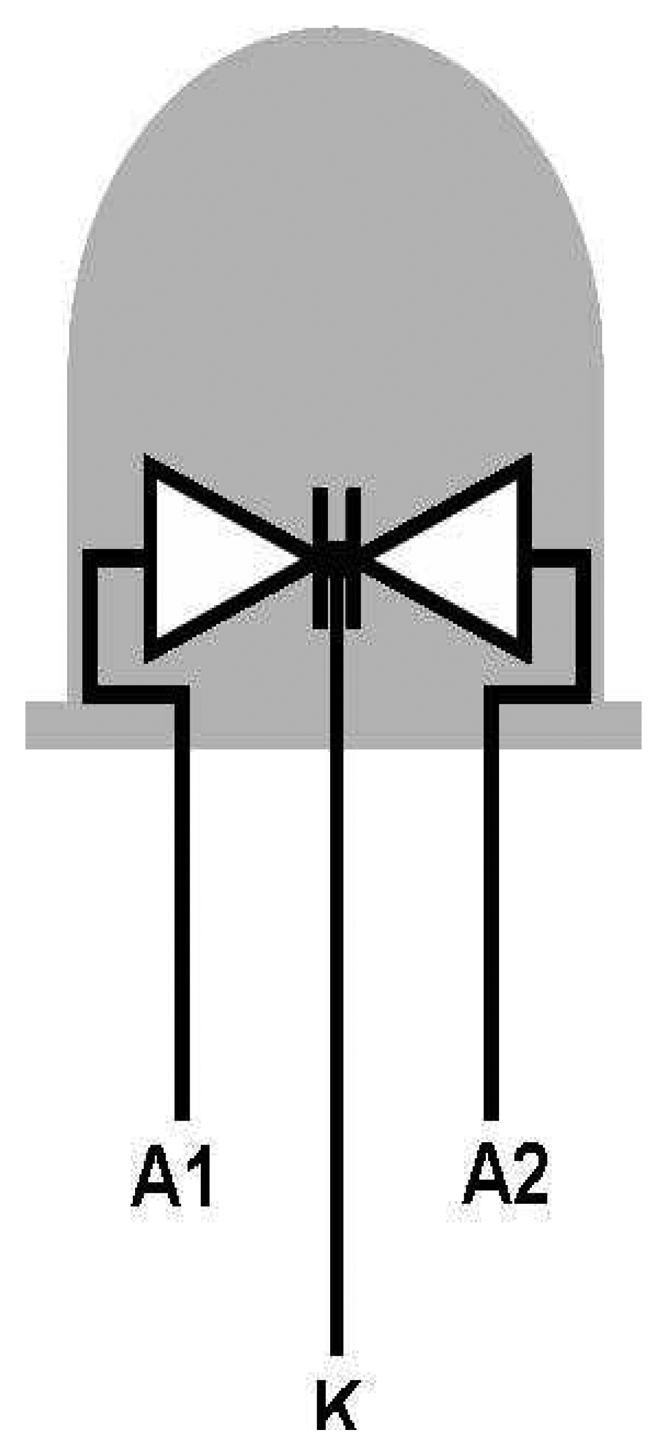
Figure 8.
Typical discharge curve for an LED charged up to 5 V and then discharged to a threshold of 1.7 V under artificial lighting (fluorescent tube).
Figure 8.
Typical discharge curve for an LED charged up to 5 V and then discharged to a threshold of 1.7 V under artificial lighting (fluorescent tube).

Figure 9.
Schematic of (A) fused-LEDs and (B) cross-section of the optical probe [74]. Reproduced with permission from Talanta.
Figure 9.
Schematic of (A) fused-LEDs and (B) cross-section of the optical probe [74]. Reproduced with permission from Talanta.

Figure 10.
Schematic of the ammonia calibration system, MFC: mass flow controller; (*) dreschel bottle; (**) gas disperser (colorimeter: Irish patent No S2004/0542 filed on 13 August 2004) [97]. Reproduced with permission from Talanta.
Figure 10.
Schematic of the ammonia calibration system, MFC: mass flow controller; (*) dreschel bottle; (**) gas disperser (colorimeter: Irish patent No S2004/0542 filed on 13 August 2004) [97]. Reproduced with permission from Talanta.
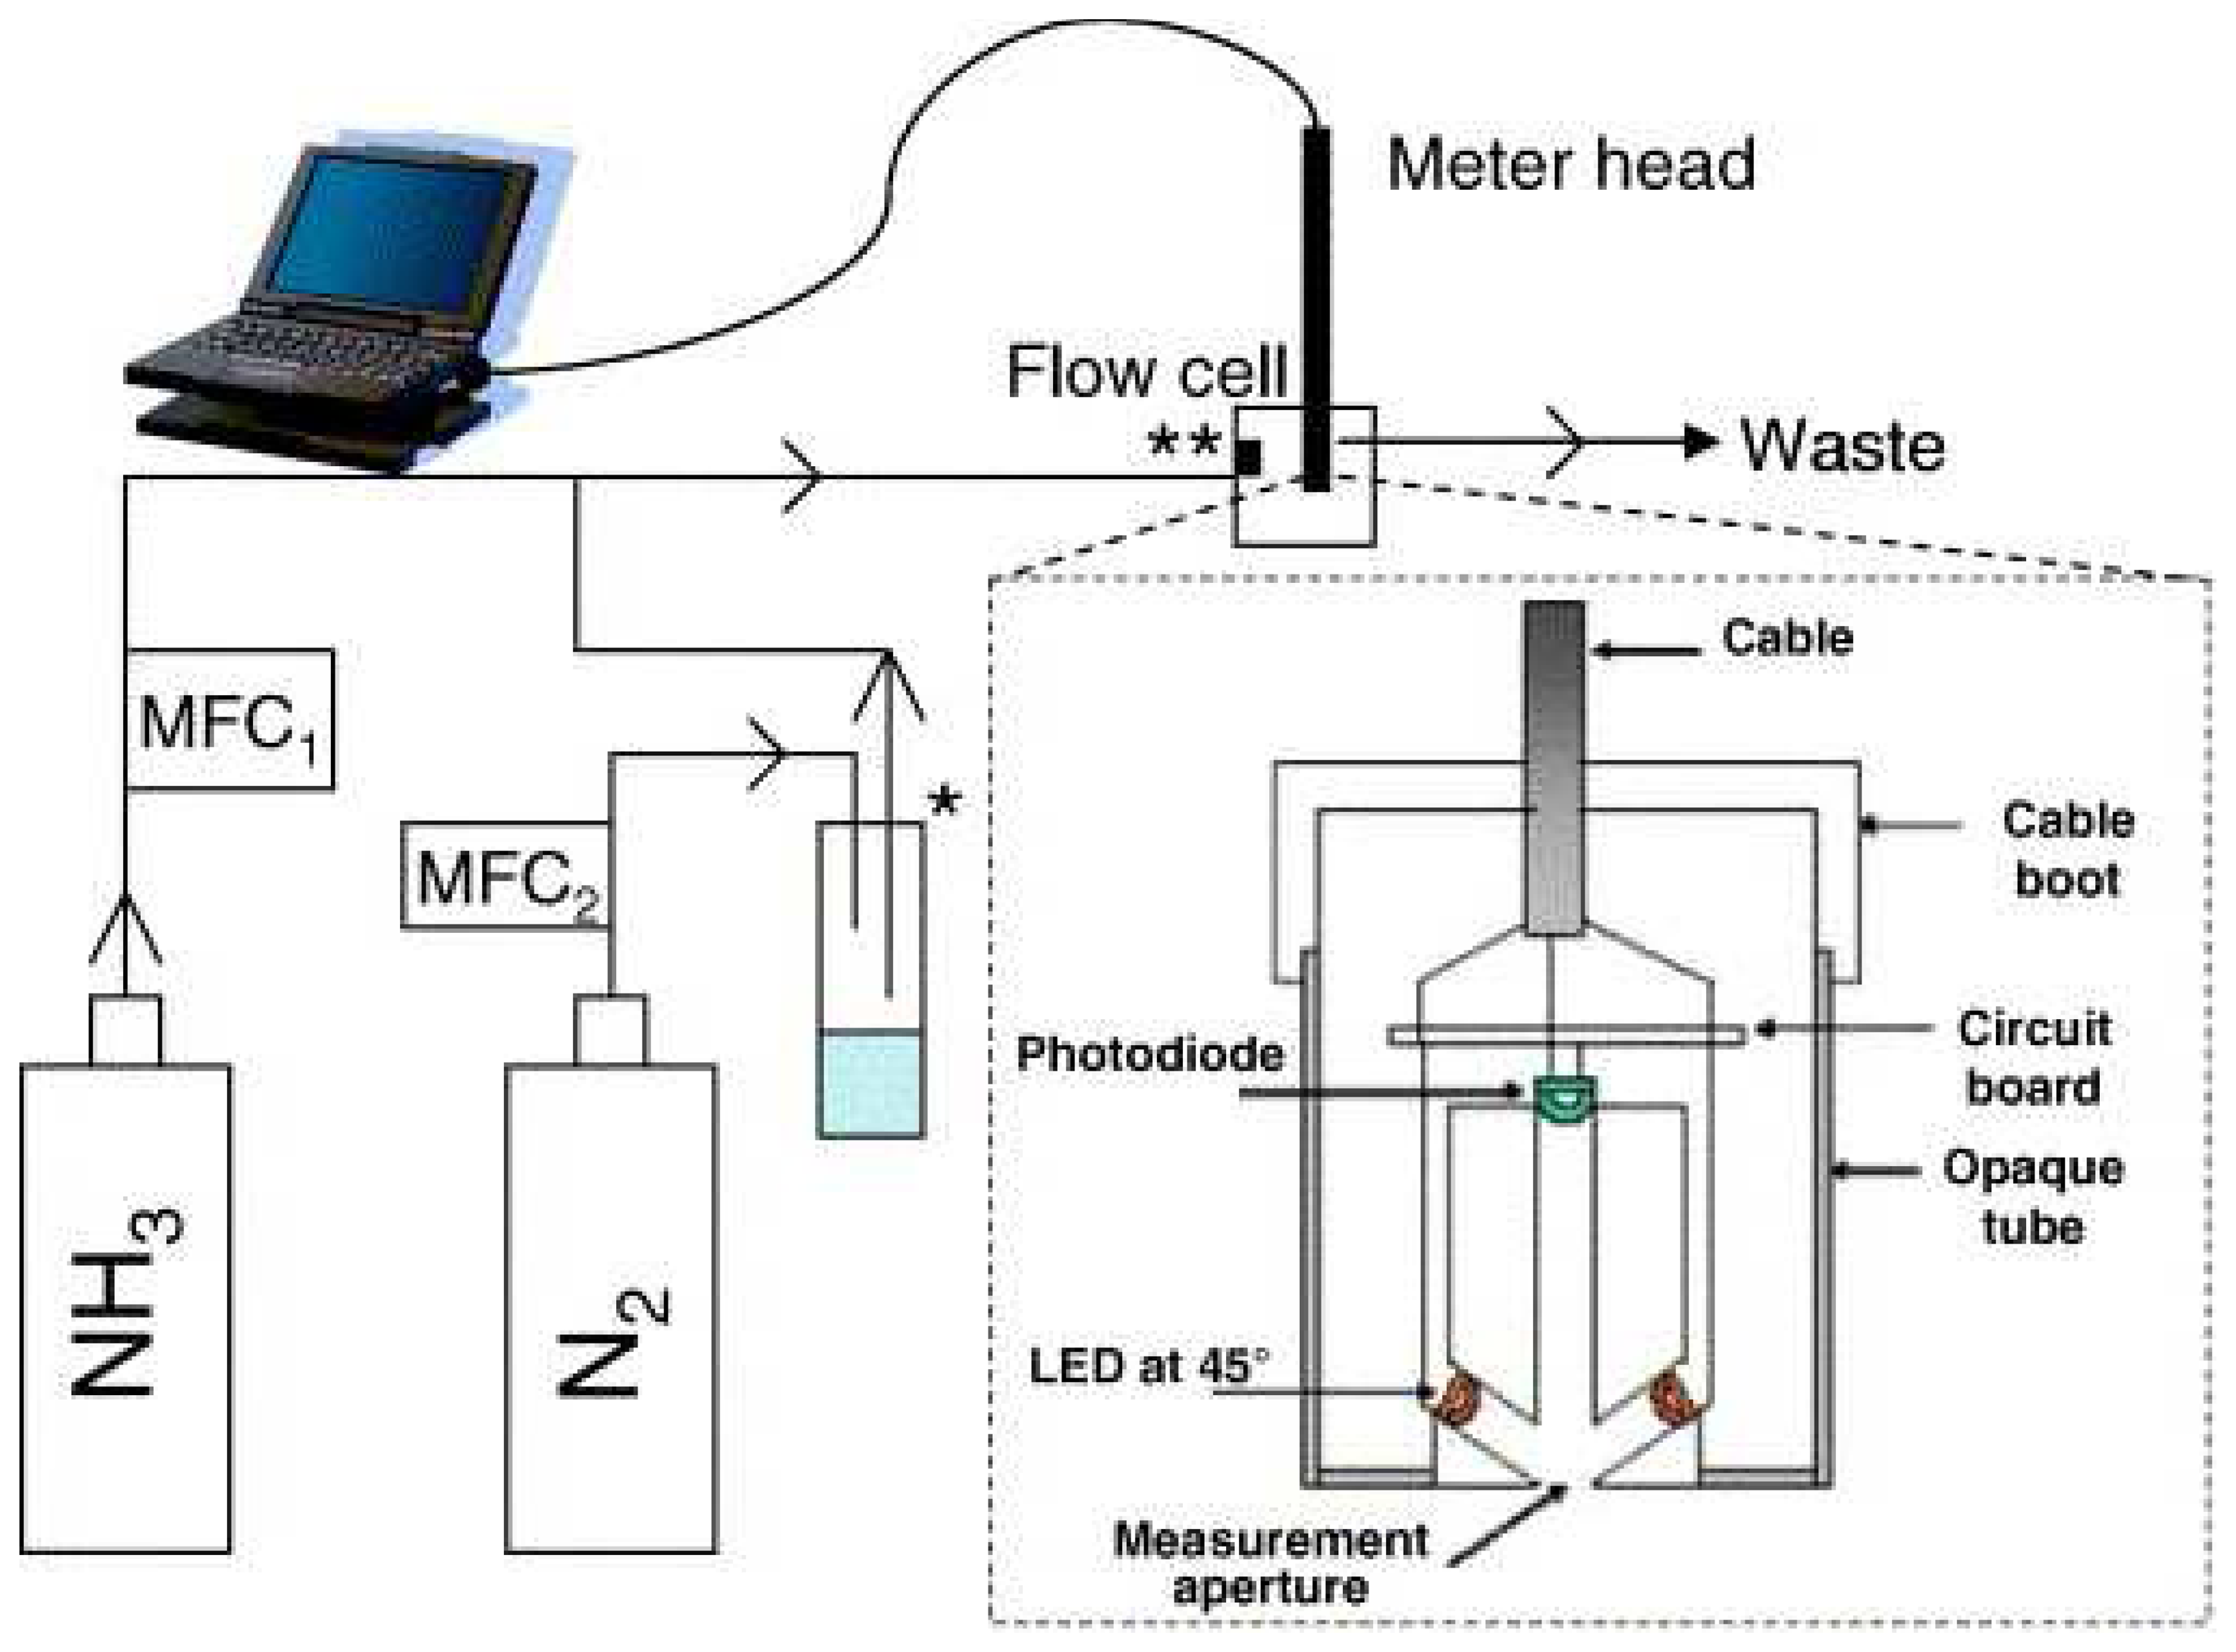
Figure 11.
A schematic of the integrated PEDD flow analysis device used for colorimetric detection.

Table 1.
Examples of LED based chemical sensors applications for environmental monitoring. LED = light emitting diode, PD = photodiode, PT = phototransistor, PMT = photomultiplier tube, PDA = photodiode array.
| Analyte | Chemical Basis for Detection | Detection Sensor | LOD | Reference |
|---|---|---|---|---|
| Phosphorus | ||||
| Total phosphorus | Ascorbic acid reduction of phosphomolybdate | LED (λmax 880 nm)-PD | ≤10 μ g L-1 | [65] |
| Total phosphorus | Phosphomolybdenum blue | LED (λmax 635 nm)-PD | 0.15 mg P L-1 | [138] |
| Dissolved reactive phosphorus | Molybdophosphate blue | LED (Red)-PD | 0.1 μg P L-1 | [60] |
| Filterable reactive phosphate | Phosphomolybdenum blue | LED (λmax 650 nm)-PD | 0.15 μM | [132] |
| Reactive phosphate | Ascorbic acid reduction of phosphomolybdate | LED (λmax 660 nm)-PD | 12 μg L-1 P | [66] |
| Reactive phosphate | Phosphomolybdenum blue | LED (λmax 652 nm)-PD | 3 μg L-1 P | [133] |
| Orthophosphate | Phosphomolybdenum blue | LED (λmax 700 nm)-PD | 0.7 ppb (PO43-) | [89] |
| Orthophosphate | Yellow vanamolybdophosphoric acid | LED (λmax 390 nm)-PDA | 5 ppm (PO43-) | [3] |
| Phosphate | Molybdenum blue | LED (λmax 820 nm)-PT | 0.5 mg L-1 (P) | [56] |
| Orthophosphate | Malachite Green Reaction | LED (λmax 621 nm)- LED (λmax 660 nm) | 2 nM (PO43-) | [81] |
| Nitrate | ||||
| NO3- | Griess reaction | LED (λmax 560 nm)-PD | 15 μg L-1 | [116] |
| NO3- | Griess reaction | LED (λmax 526 nm)-PDA | 0.51μM (NO3-) | [31] |
| NO3- | Griess reaction | LED (λmax 565 nm)-PD | 24 μg L-1 (NO3-N) | [55] |
| NO3- | Griess reaction | LED (λmax 540 nm)-PT | 30 μg L-1 (NO3-) | [50] |
| NO3- | Griess reaction | LED (λmax 540 nm)-PD | 2.8 μg L-1 (N) | [135] |
| Nitrite | ||||
| NO2- | Griess reaction | LED (λmax 560 nm)-PD | 5 μg L-1 | [116] |
| NO2- | Griess reaction | LED (λmax 526 nm)-PDA | 0.2 μM | [29] |
| NO2- | Griess reaction | LED (λmax 525 nm)-PD | 4 μM | [58] |
| NO2- | Griess reaction | LED (λmax 540 nm)-PT | 18 μg L-1 (NO2-) | [50] |
| NOx | Griess reaction | LED (λmax 540 nm)-PD | 1.4 μg L-1 (N) | [136] |
| Ammonia | ||||
| NH4+ | Indophenol blue reaction | LED (λmax 660 nm)-PD | 25 μg L-1 | [116] |
| NH4+ | Reaction with (NaOH, cresol red and thymol blue) | LED (λmax 605 nm)-PT | 0.5 mg L-1 (N) | [56] |
| NH4+ | Bromocresol green | LED (λmax 590 nm)-PD | [97] | |
| Metals/Cations | ||||
| Cd (II) and Pb(II) | Malachite green-iodide method | LED (λmax 621 nm)-LED (λmax 621 nm) | 5 ng mL-1 (Cd2+) 20 ng mL-1 (Pb2+) | [79] |
| Uranium | AIII metal complexes | LED (λmax 660 nm)-PDA | 383 ppb (UO22+) | [30] |
| Co (II) and Mn (II) | PAR complexes | LED (λmax 540 nm)-PMT | 450 ppb (Co2+) 1.3 ppm (Mn2+) | [30] |
| Al and Zn | Xylenol orange | LED (λmax 563 nm)-PD | 0.2 μg L-1 (Al) 0.2 μg L-1 (Zn) | [59] |
| Fe (II) | Phenanthroline in ammonium acetate | LED (λmax 525 nm)-PD | 33 μM | [58] |
| Cr | Oxidation to dichromate with periodate | LED (λmax 460 nm)-PD | 6 ppm | [57] |
| Mn | Formaldoxime method | LED (λmax 460 nm)-PD | 0.2 ppm | [57] |
| Zn | PAR complex | LED (λmax 460 nm)-PD | 0.02 ppm | [57] |
| Fe | Phenanthroline method | LED (λmax 460 nm)-PD | 0.4 ppm | [57] |
| Cu, Pb, Zn, Ni, Co, Cd, Fe and Mn | PAR complexes | LED (λmax 550 nm)-PD | 320, 47, 79, 230, 5.4, 10, 24 and 33 ng mL-1 | [54] |
| Cd, Pb, Co and Ni | 5-Br-PAPS | LED (λmax 570 nm)-PMT | 6, 1.8, 0.15 and 0.48 μg L-1 | [41] |
| Co, V, Ni, Cu, Fe, Mn and Cd | PAR complexes | LED (λmax 540 nm)-PMT | 0.47, 0.97, 0.40, 0.41, 1, 1.15, 0.54 ppm | [35] |
| Co and Cd | PAR complexes | LED (λmax 565 nm)-PT | 0.6 ppb (Co) | [86] |
| Ba, Ca, Mg, Ni and Cu | EDTA metal complexes | LED (λmax 460 nm)-PMT | 11.9, 5.5, 8.3, 3.7 and 6.6 μM | [36] |
| As (III) and As (V) | Arsenomolybdate method | LED (λmax 565 nm)-PD | 4 μg L-1 As(t) | [139] |
| V | PAR | LED (λmax 568 nm)-Waters Quanta 4000 capillary electrophoresis system | 19 ppb | [140] |
| Ni | Hexamine complex | LED (λmax 950 nm)-PD | [141] | |
| Fe (II) | Ferrozine method | LED (λmax 565 nm)-PD | 0.1 μM | [142] |
| Mn and Co | PAR | LED (λmax 500 nm)- LED (λmax 621 nm) | 90 nM Mn and Co | [77] |
| Anions | ||||
| Cl-, NO3-, SO42-, F-, | Chromate-diethanolamine background | LED (λmax 379.5 nm)-Waters | 5, 9, 14, 3 and 5 μg | [95] |
| PO43- | electrolyte | CIA | L-1 | |
| Cl- | Thiocynate method | LED (λmax 525 nm)-PD | 158 μM | [58] |
| Cl- | Thiocynate method | LED (λmax 460 nm)-PD | 0.2 ppm | [57] |
| Lactate, butyrate, salicylate, propionate, acetate, phosphate, formate and citrate | EDTA anion complexes | LED (λmax 460 nm)-PMT | 13.7, 12.1, 14.5, 4.7, 4.7, 12.8, 14.6 and 7.6 μM | [36] |
© 2008 by MDPI (http://www.mdpi.org). Reproduction is permitted for noncommercial purposes.
Share and Cite
MDPI and ACS Style
O’Toole, M.; Diamond, D. Absorbance Based Light Emitting Diode Optical Sensors and Sensing Devices. Sensors 2008, 8, 2453-2479. https://doi.org/10.3390/s8042453
AMA Style
O’Toole M, Diamond D. Absorbance Based Light Emitting Diode Optical Sensors and Sensing Devices. Sensors. 2008; 8(4):2453-2479. https://doi.org/10.3390/s8042453
Chicago/Turabian StyleO’Toole, Martina, and Dermot Diamond. 2008. "Absorbance Based Light Emitting Diode Optical Sensors and Sensing Devices" Sensors 8, no. 4: 2453-2479. https://doi.org/10.3390/s8042453