Estimation of Stand Type Parameters and Land Cover Using Landsat-7 ETM Image: A Case Study from Turkey


Abstract
:1. Introduction
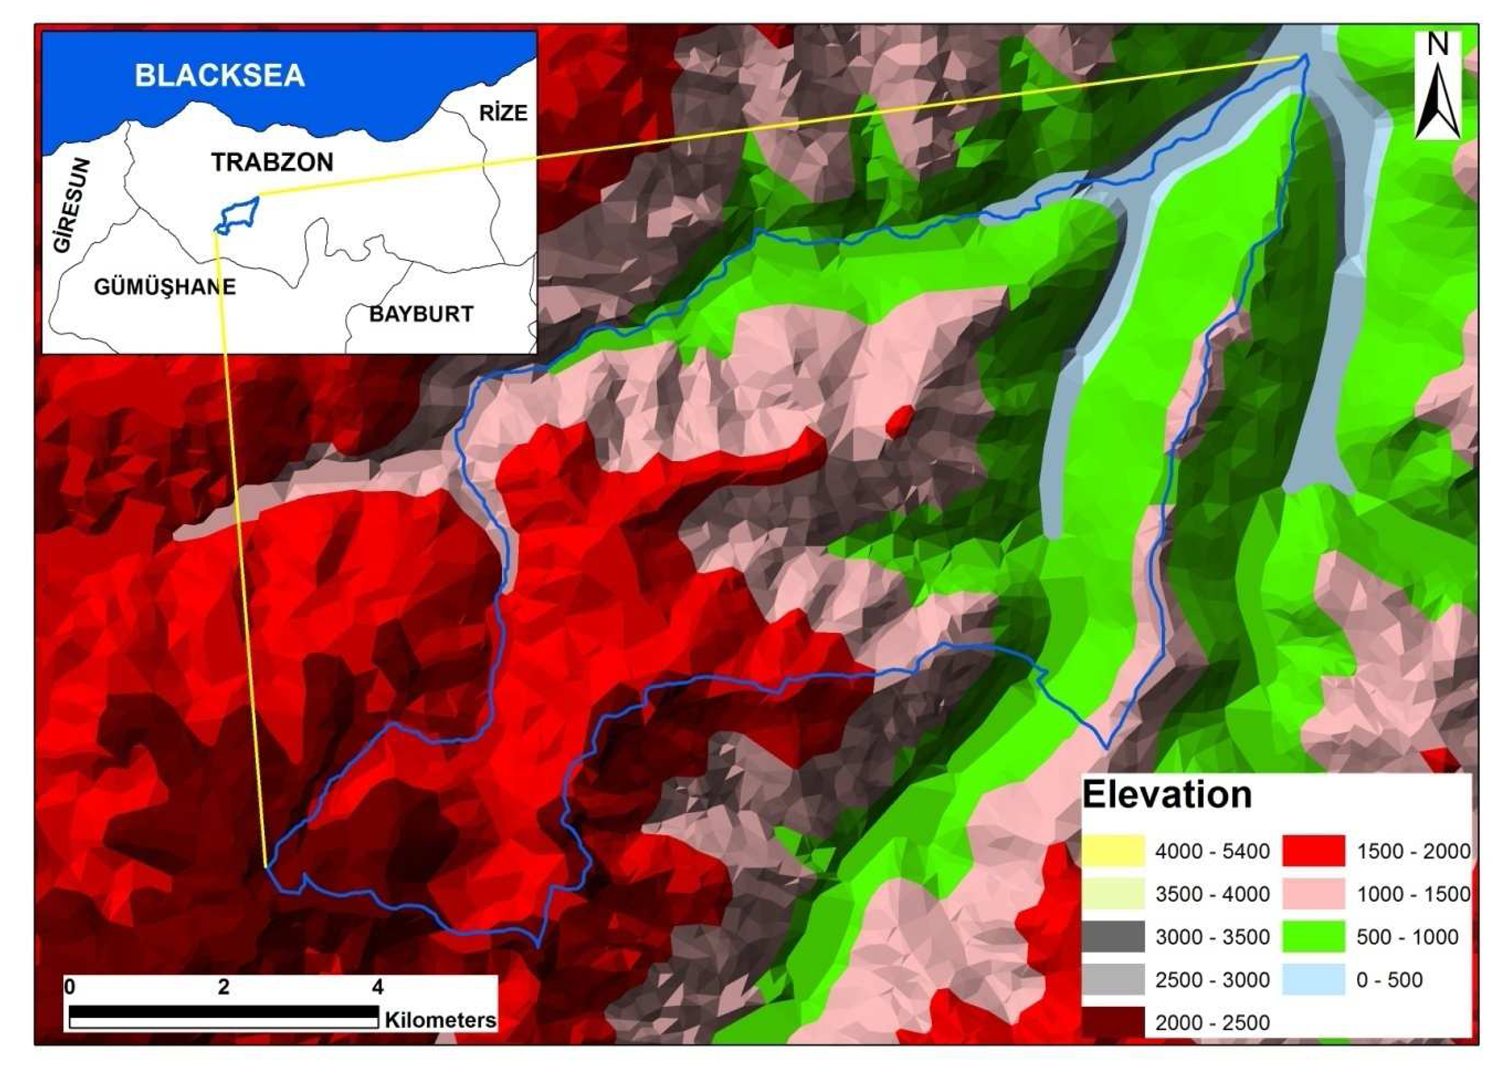
2. Study Area
3. Materials and Methods
3.1. Dataset and Methods
3.2. Geometric Correction of Landsat 7 ETM Image
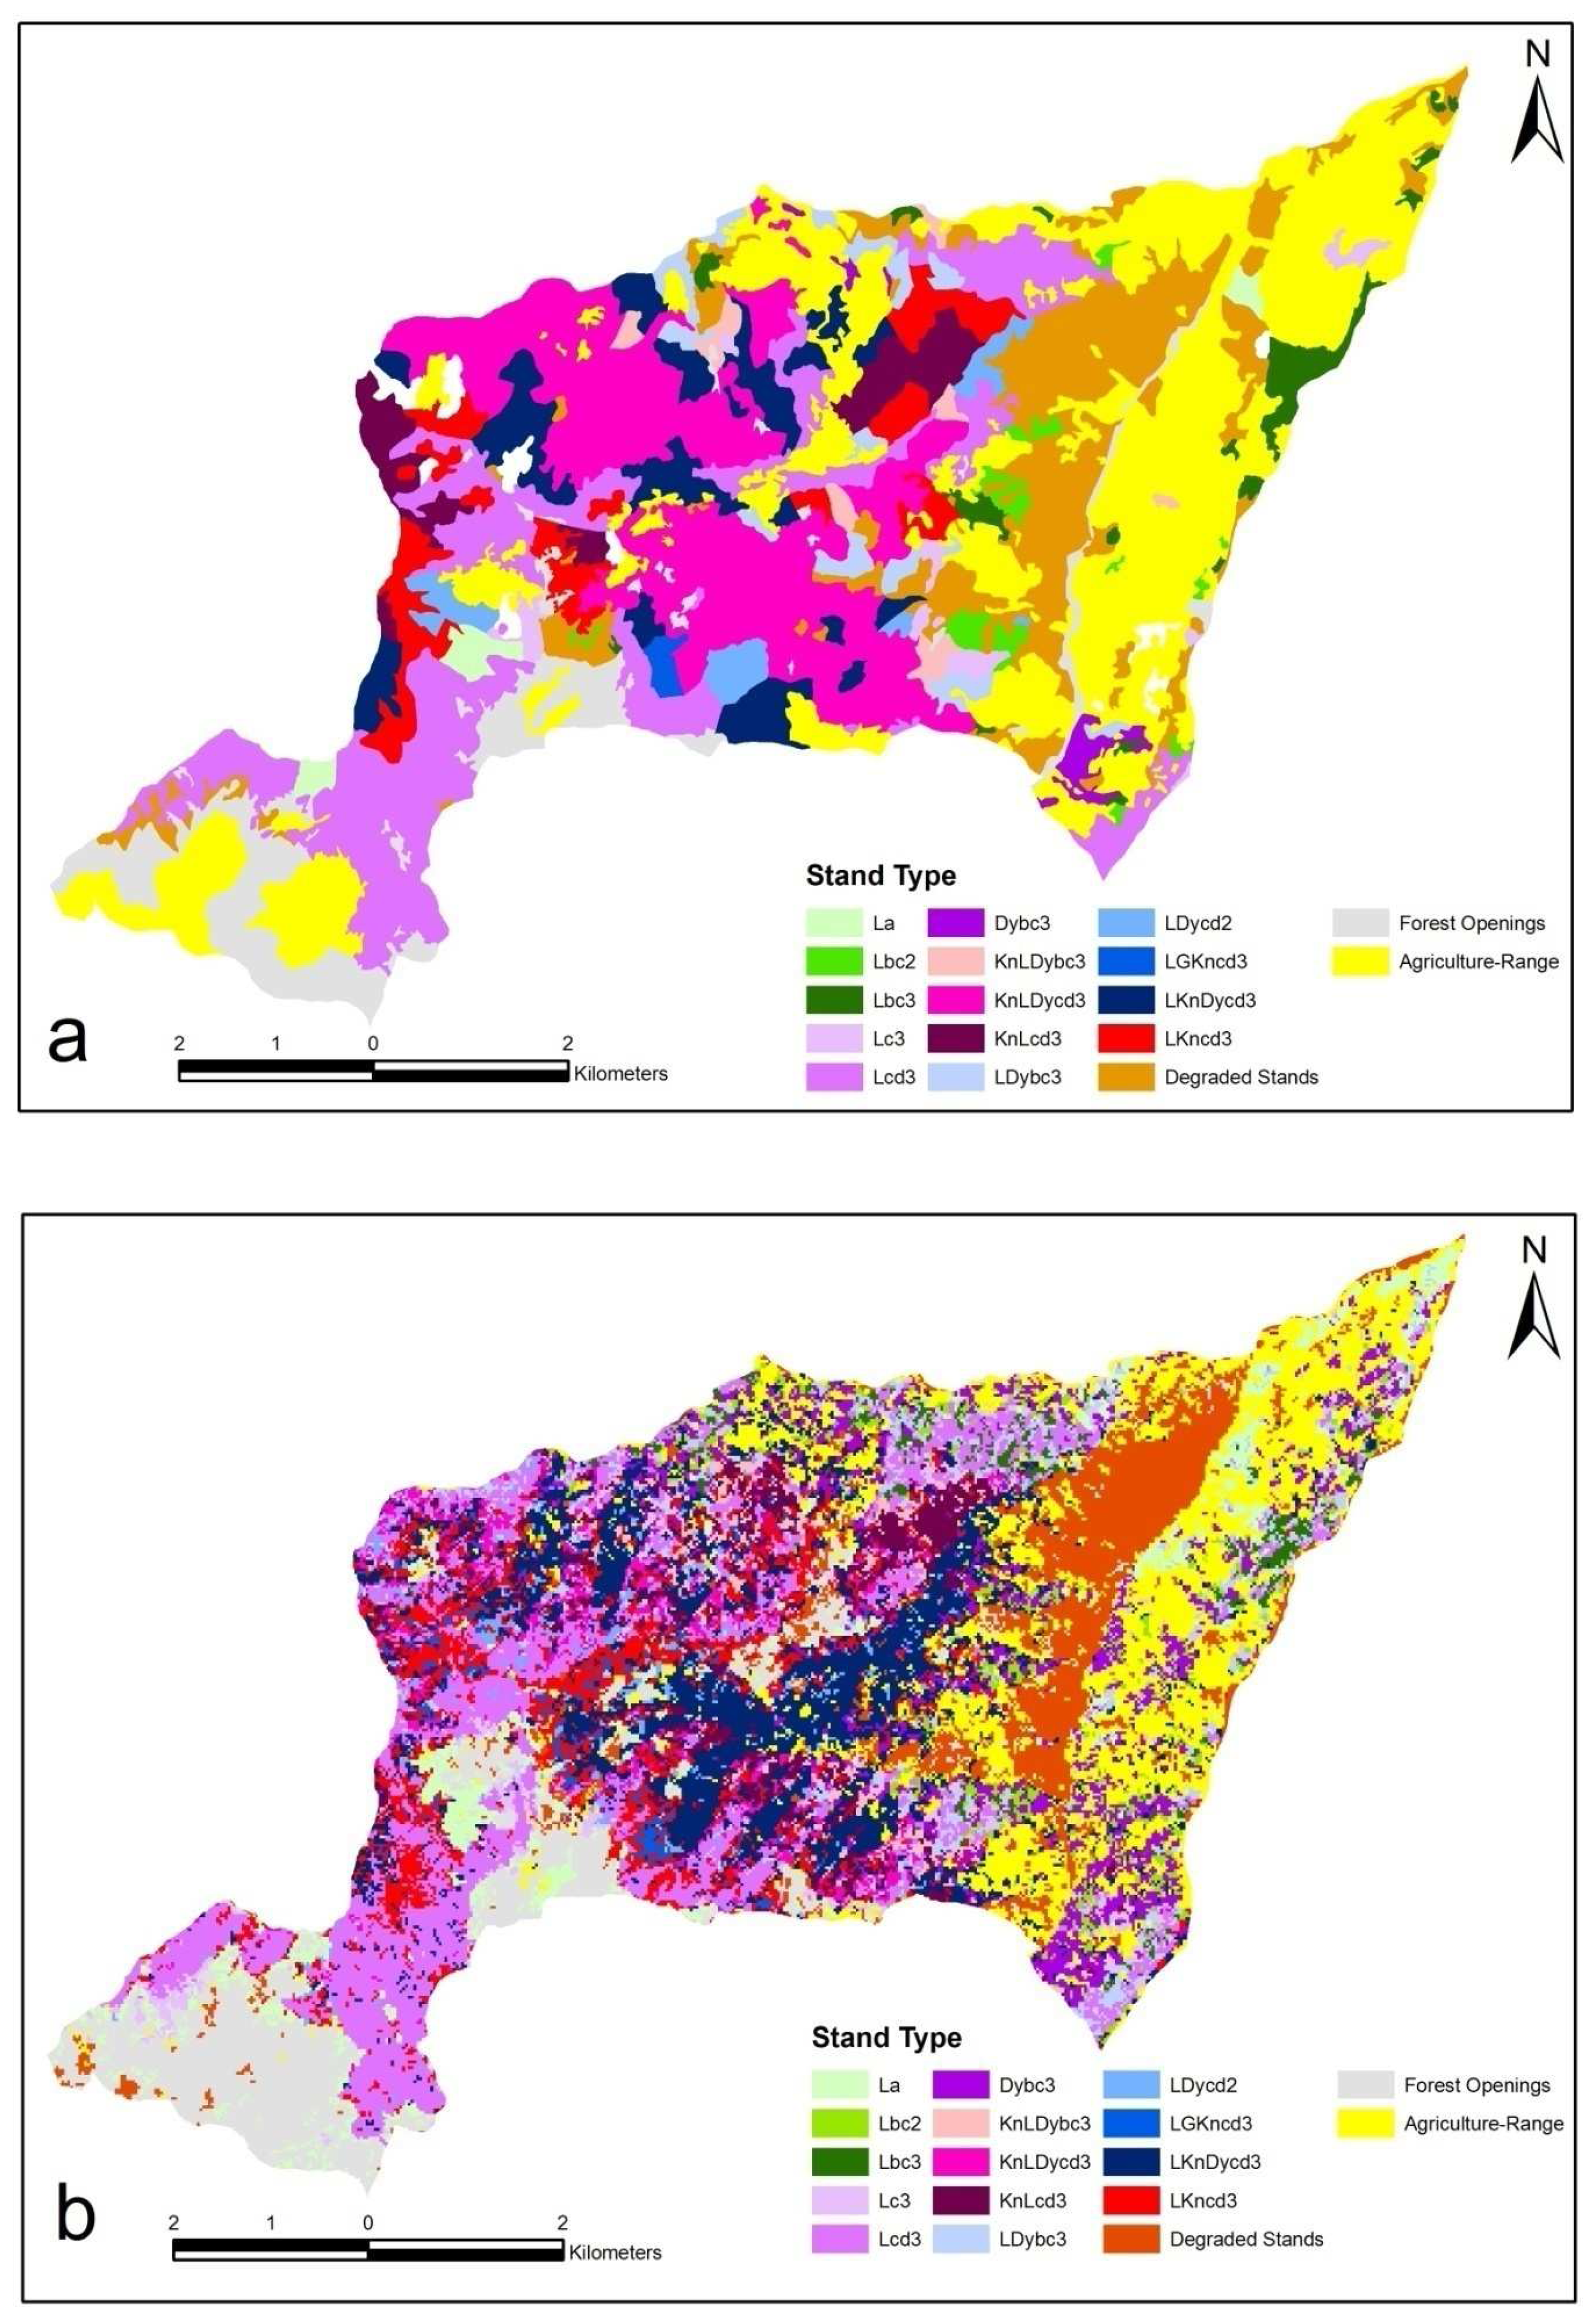
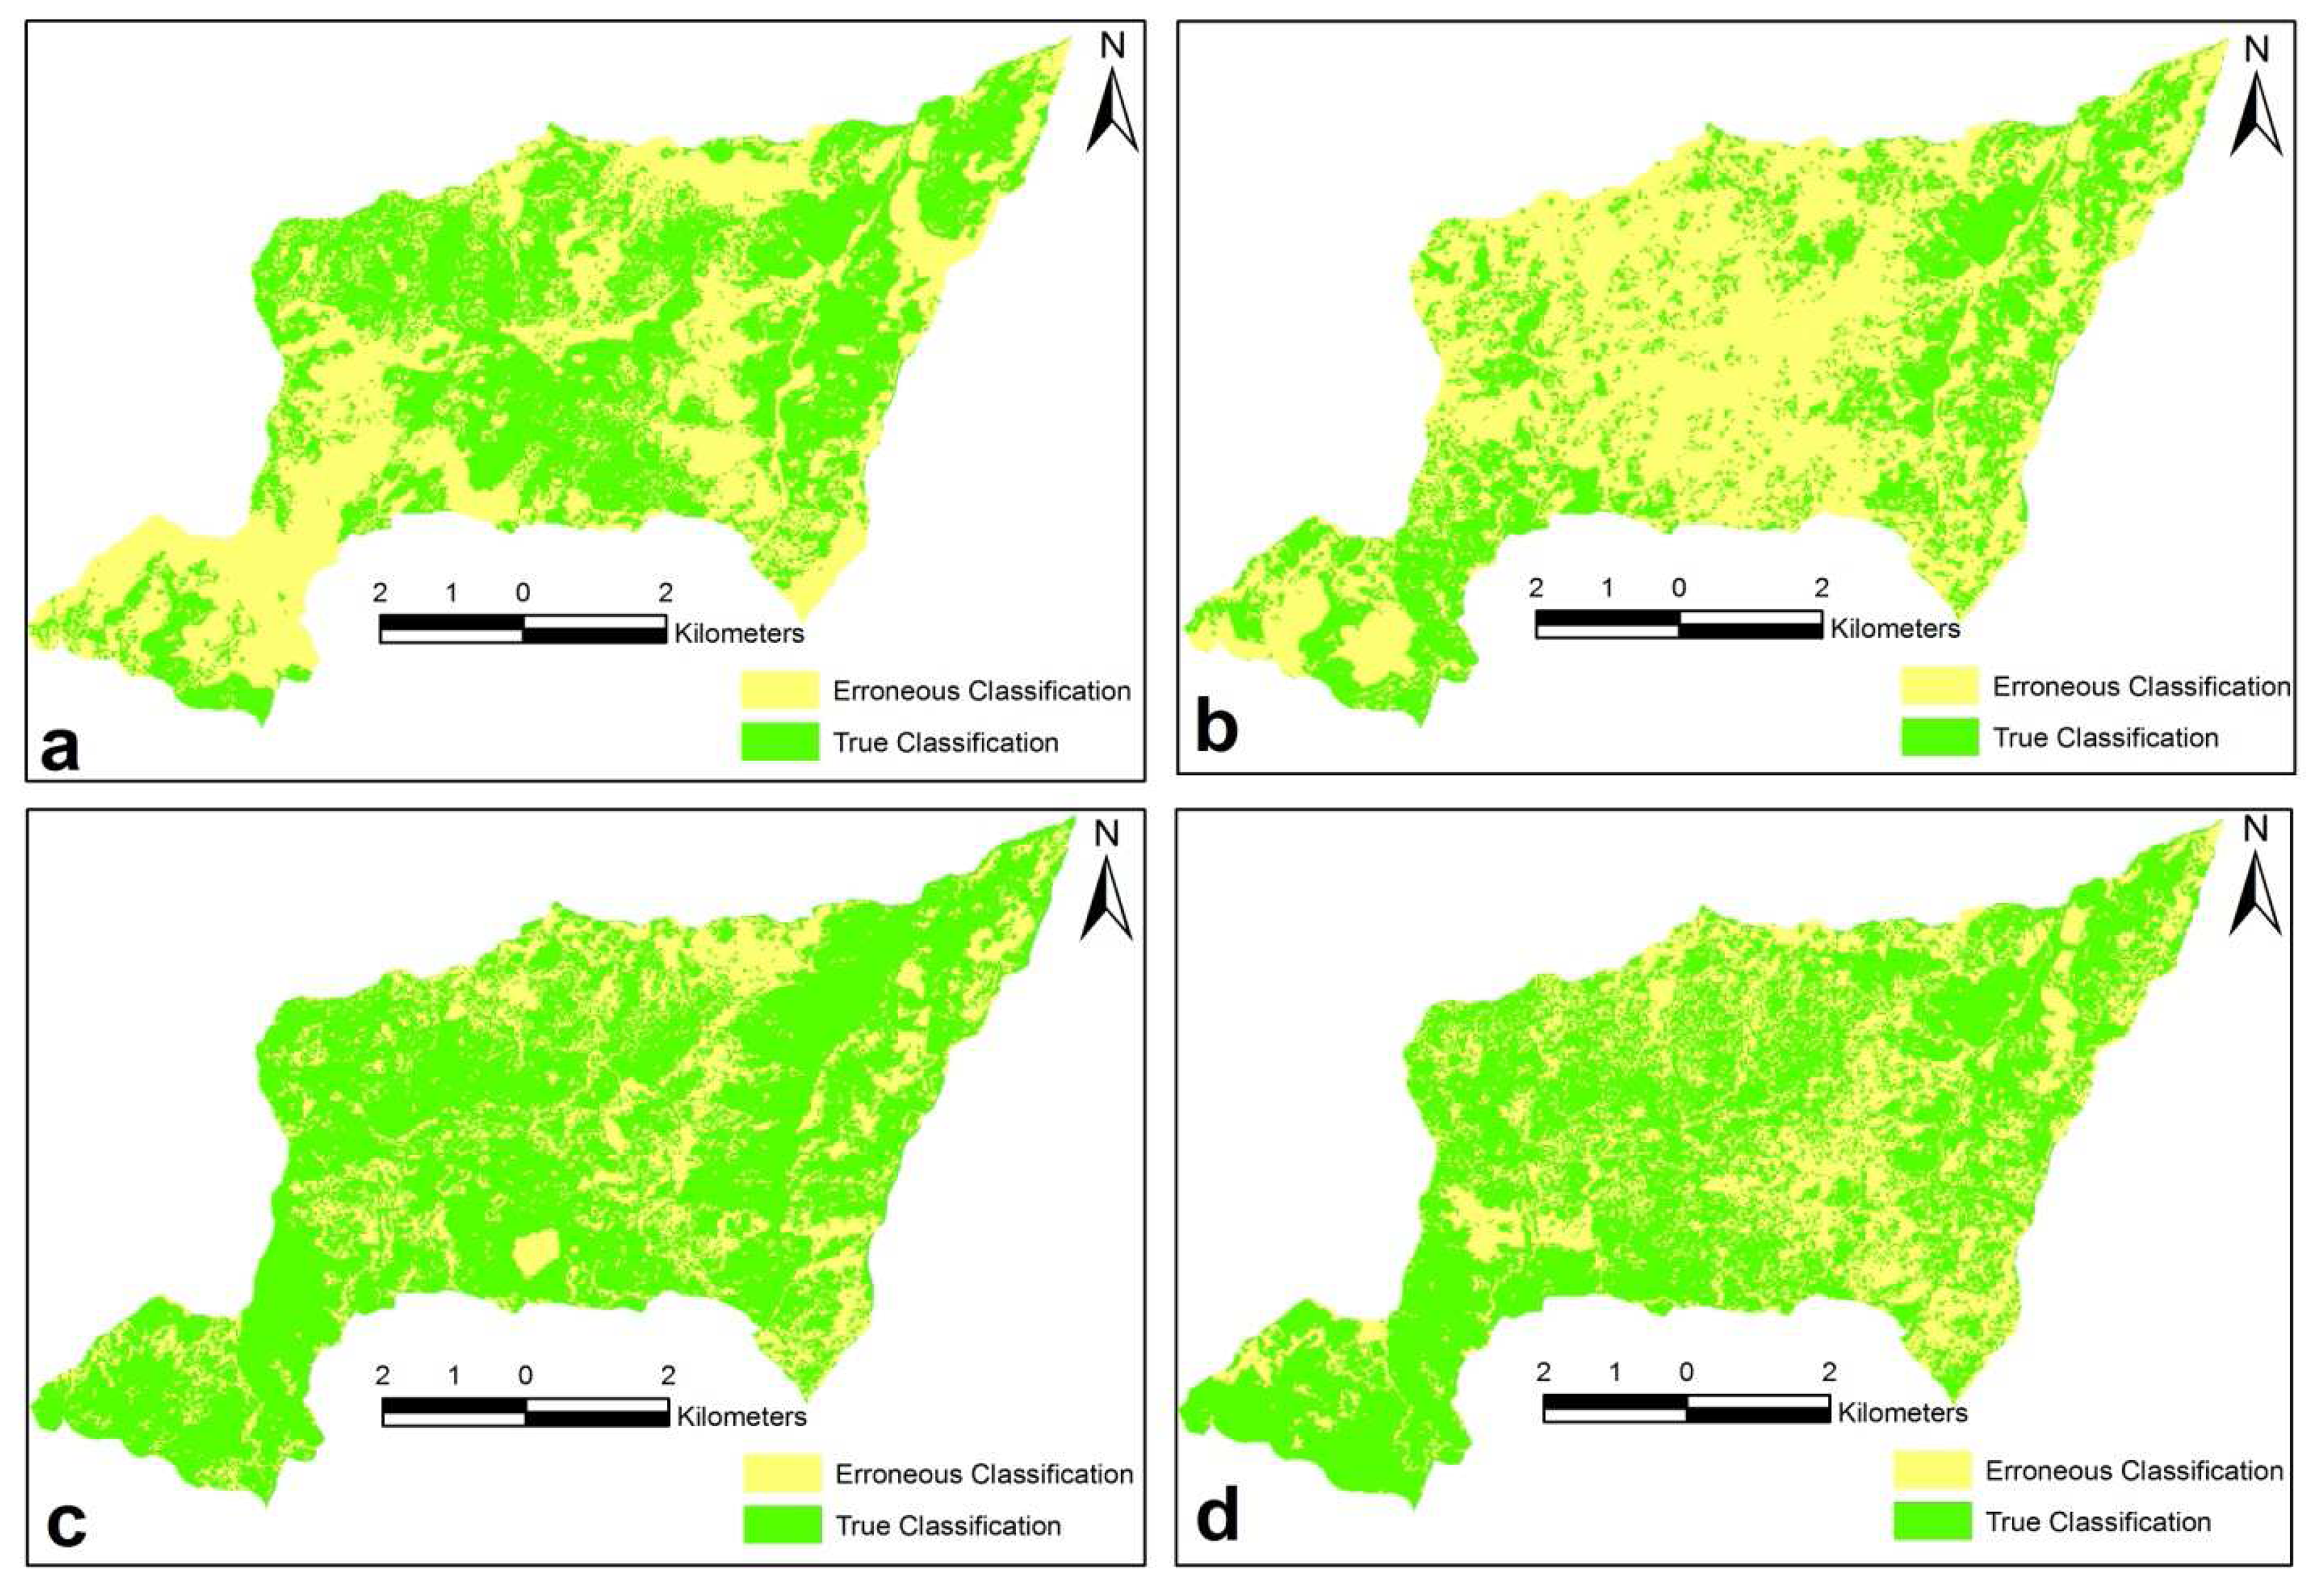
3.3. Classification of Landsat 7 ETM Image
4. Results and Discussion
5. Conclusion
Acknowledgments
Reference
- Meng, Q. Geostatistical prediction and mapping for large area forest inventory using remote sensing data. www.ucgis.org/summer/studentpapers/Mengqm_July03_2006.pdf.
- Hyyppa, J.; Hyyppa, H.; Inkinen, M.; Engdahl, M.; Linko, S.; Zhu, Y. Accuracy comparison of various remote sensing data sources in the retrieval of forest stand attributes. For. Ecol. Manage. 2000, 128, 109–120. [Google Scholar]
- Houghton, R.A.; Woodwell, G.M. Biotic contributions to the global carbon cycle: the role of remote sensing. In Proc Seventh International Symposium on Machine Processing of Remote Sensed Data; 1981; West Lafayette, Indiana; pp. 593–602. [Google Scholar]
- Botkin, D.B.; Estes, J.E.; McDonald, R.M.; Wilson, M.V. Studying the Earth's vegetation from space. Bioscience 1984, 34, 508–514. [Google Scholar]
- Malingreau, J.P. Remote sensing for tropical forest monitoring: an overview; in Remote Sensing and Geographical Information Systems for Resource Management in Developing Countries; Belward, A.S., Valenzuela, C. R., Eds.; Dordrecht; Kluwer, 1991; pp. 253–278. [Google Scholar]
- Roy, P.S. Remote sensing for forest ecosystem analysis and management: in environmental studies in India; Balakrishnan, M, Ed.; New Delhi; Oxford and IBH, 1993; pp. 335–363. [Google Scholar]
- Roy, P.S.; Sharma, K.P.; Jain, A. Stratification of density in dry deciduous forest using satellite remote sensing digital data, an approach based on spectral indices. J. Biosciences. 1996, 21, 723–734. [Google Scholar]
- Poso, S.; Hame, T.; Paananen, R. A method of estimating the stand characteristics of a forest compartment using satellite imagery. Silva Fenn. 1984, 18, 261–292. [Google Scholar]
- Wulder, M.A. Optical remote sensing techniques for the assessment of forest inventory and biophysical parameters. Progress in Physical Geography. 1998 a, 22, 449–476. [Google Scholar]
- Andersen, G.L. A Review of methodologies, classification and estimation of forest and vegetation variables in optical high resolution satellites.; Interim Report IR-98-085; International Institute for Applied Systems Analysis: Austria, 1998. [Google Scholar]
- Wynne, R.H.; Oderwald, R.G.; Reams, G.A.; Scrivani, J.A. Optical remote sensing for forest area estimation. J. Forest. 2000, 98, 31–36. [Google Scholar]
- Franklin, S.E.; Hall, R.J.; Smith, L.; Gerylo, G.R. Discrimination of conifer height, age and crown closure classes using Landsat-5 TM imagery in the Canadian Northwest territories. Int. J. Remote Sens. 2003, 24(9), 1823–1834. [Google Scholar]
- Yeşil, A.; Musaoğlu, N.; Kaya, Ş.; ÇoŞkun, G.; Asan, Ü.; Örmeci, C. Statistical modelling and stand type forest mapping selected area around Istanbul using Landsat-TM and Spot data. International Symposium on Remote Sensing and Integrated Technologies, Istanbul, Turkey, Proceeding. 2002 20-22 October; pp. 291–300.
- Pilger, N.; Peddle, D.R.; Luther, J.E. Estimation of forest cover type and structure from Landsat TM imagery using a canopy reflectance model for biomass mapping in Western Newfoundland; 2002. http://ieeexplore.ieee.org/iel5/7969/22038/01026103.pdf.
- Jensen, J.R.; Qiu, F.; Mınhe, J. Predictive modeling of coniferous forest age using statistical and artificial neural network approaches applied to remote sensor data. Int. J. Remote Sens. 1999, 20, 2805–2822. [Google Scholar]
- Spanner, M.A.; Pierce, L.L.; Running, S.W.; Peterson, D.L. Remote sensing of temperate coniferous forest leaf area index: the influence of canopy closure, understory vegetation and background reflectance. Int. J. Remote Sens. 1990, 11, 95–111. [Google Scholar]
- Gemmel, F.M. Effects of forest cover, terrain, and scale on timber volume estimation with Thematic Mapper data in a Rocky Mountain site. Remote Sens. Environ. 1995, 51, 291–305. [Google Scholar]
- PaÈivinen, R.; Pussinen, A.; Tomppo, E. Assessment of boreal forest stands using field assessment and remote sensing. Proceedings of Earsel Conference Operationalization of Remote Sensing, ITC Enshedene, The Netherlands, 19-23 April 1993.
- Kasischke, E.S.; Christensen, N.L.; Bourgeau-Chavez, L.L. Correlating radar backscatter with components of biomass in loblolly pine forests. IEEE Trans. Geosci. Remote Sensing. 1995, 33, 643–659. [Google Scholar]
- Wegmüller, U.; Werner, C.L. SAR interferometric signatures of forest. IEEE Trans. Geosci. Remote Sensing. 1995, 33, 1153–1161. [Google Scholar]
- Chiao, K.M. Comparisons of three remotely sensed data on forest crown closure and tree volume estimations. Int. Archives of Photogrammetry and Remote Sensing. 1996, Part B7. 31, 123–130. [Google Scholar]
- Ranson, K.J.; Sun, G.; Montgomery, B.; Lang, R.H. Mapping of boreal forest biomass using SAR. Proceedings of IGARSS'96 Conference, Lincoln, NE, 27-31 May 1996; vol. 1, pp. 577–579.
- Hyyppa, J.; Pulliainen, J.; Hallikainen, M.; Saatsi, A. Radar derived standwise forest inventory. IEEE Trans. Geosci. Remote Sensing. 1997, 35, 392–404. [Google Scholar]
- Çakır, G.; Sivrikaya, F.; Keleş, S. Forest cover change and fragmentation using Landsat data in Maçka State Forest Enterprise in Turkey. Environ. Monitor. Assess. 2008, 137, 51–66. [Google Scholar]
- Keleş, S.; Sivrikaya, F.; Çakır, G. Temporal changes in forest landscape patterns in Artvin forest planning unit, Turkey. Environ. Monitor. Assess. 2007, 129, 483–490. [Google Scholar]
- Kadıoğulları, A.İ; Baskent, E.Z. Spatial and temporal dynamics of land use pattern in Eastern Turkey: a case study in Gümüşhane. Environ. Monitor. Assess. 2008, 138, 289–303. [Google Scholar]
- Altun, L. The role of site factors in distinguishing forest sites in Trabzon-Maçka Ormanustu forest. PhD thesis, Karadeniz Technical University, The Graduate School of Natural and Applied Sciences, Trabzon: Turkey, 1995. [Google Scholar]
- Erdas Field Guide 6th edition.; Erdas LLC: Atlanta, Georgia, 2002.
- Sivrikaya, F.; Keleş, S.; Çakır, G.; Başkent, E.Z.; Köse, S. Comparing accuracy of classified Landsat data with land use maps reclassified from the stand type maps. 7th International Syposium on Spatial Accuracy Assessment in Natural Resources and Environmental Sciences 2006, 643–652. [Google Scholar]
- Baskent, E.Z.; Keles, S. Spatial forest planning: A review. Ecol. Model. 2005, 188, 145–173. [Google Scholar]
- Bettinger, P.; Sessions, J. Spatial forest planning: to adopt, or not to adopt.? J. Forestry. 2003, 101(2), 24–29. [Google Scholar]
- Church, R.L.; Murray, A.T.; Weintraub, A. Locational issues in forest management. Location Sci. 1998, 6, 137–153. [Google Scholar]
- Baskent, E.Z. Combinatorial optimization in forest ecosystem management modeling. Turk. J. Agric. For. 2001, 25, 187–194. [Google Scholar]
- Kurttila, M. The spatial structure of forests in the optimization calculations of forest planning: a landscape ecological perspective. Forest Ecol. Manage. 2001, 142, 129–142. [Google Scholar]
- Malchow-Moller, N.; Strange, N.; Thorsen, B.J. Real-options aspects of adjacency constraints. Forest Policy Econ. 2004, 6, 261–270. [Google Scholar]
- Borges, J.G.; Hoganson, H.M.; Rose, D.W. Combining a decomposition strategy with dynamic programming to solve spatially constrained forest management scheduling problems. Forest Sci. 1999, 45, 201–212. [Google Scholar]
- Başkent, E.Z.; Kadıoğulları, A. İ. Spatial and temporal Dynamics of land use pattern in Turkey: A case study in İnegöl. Landscape Urban Plan. 2007, 84(4), 316–327. [Google Scholar]


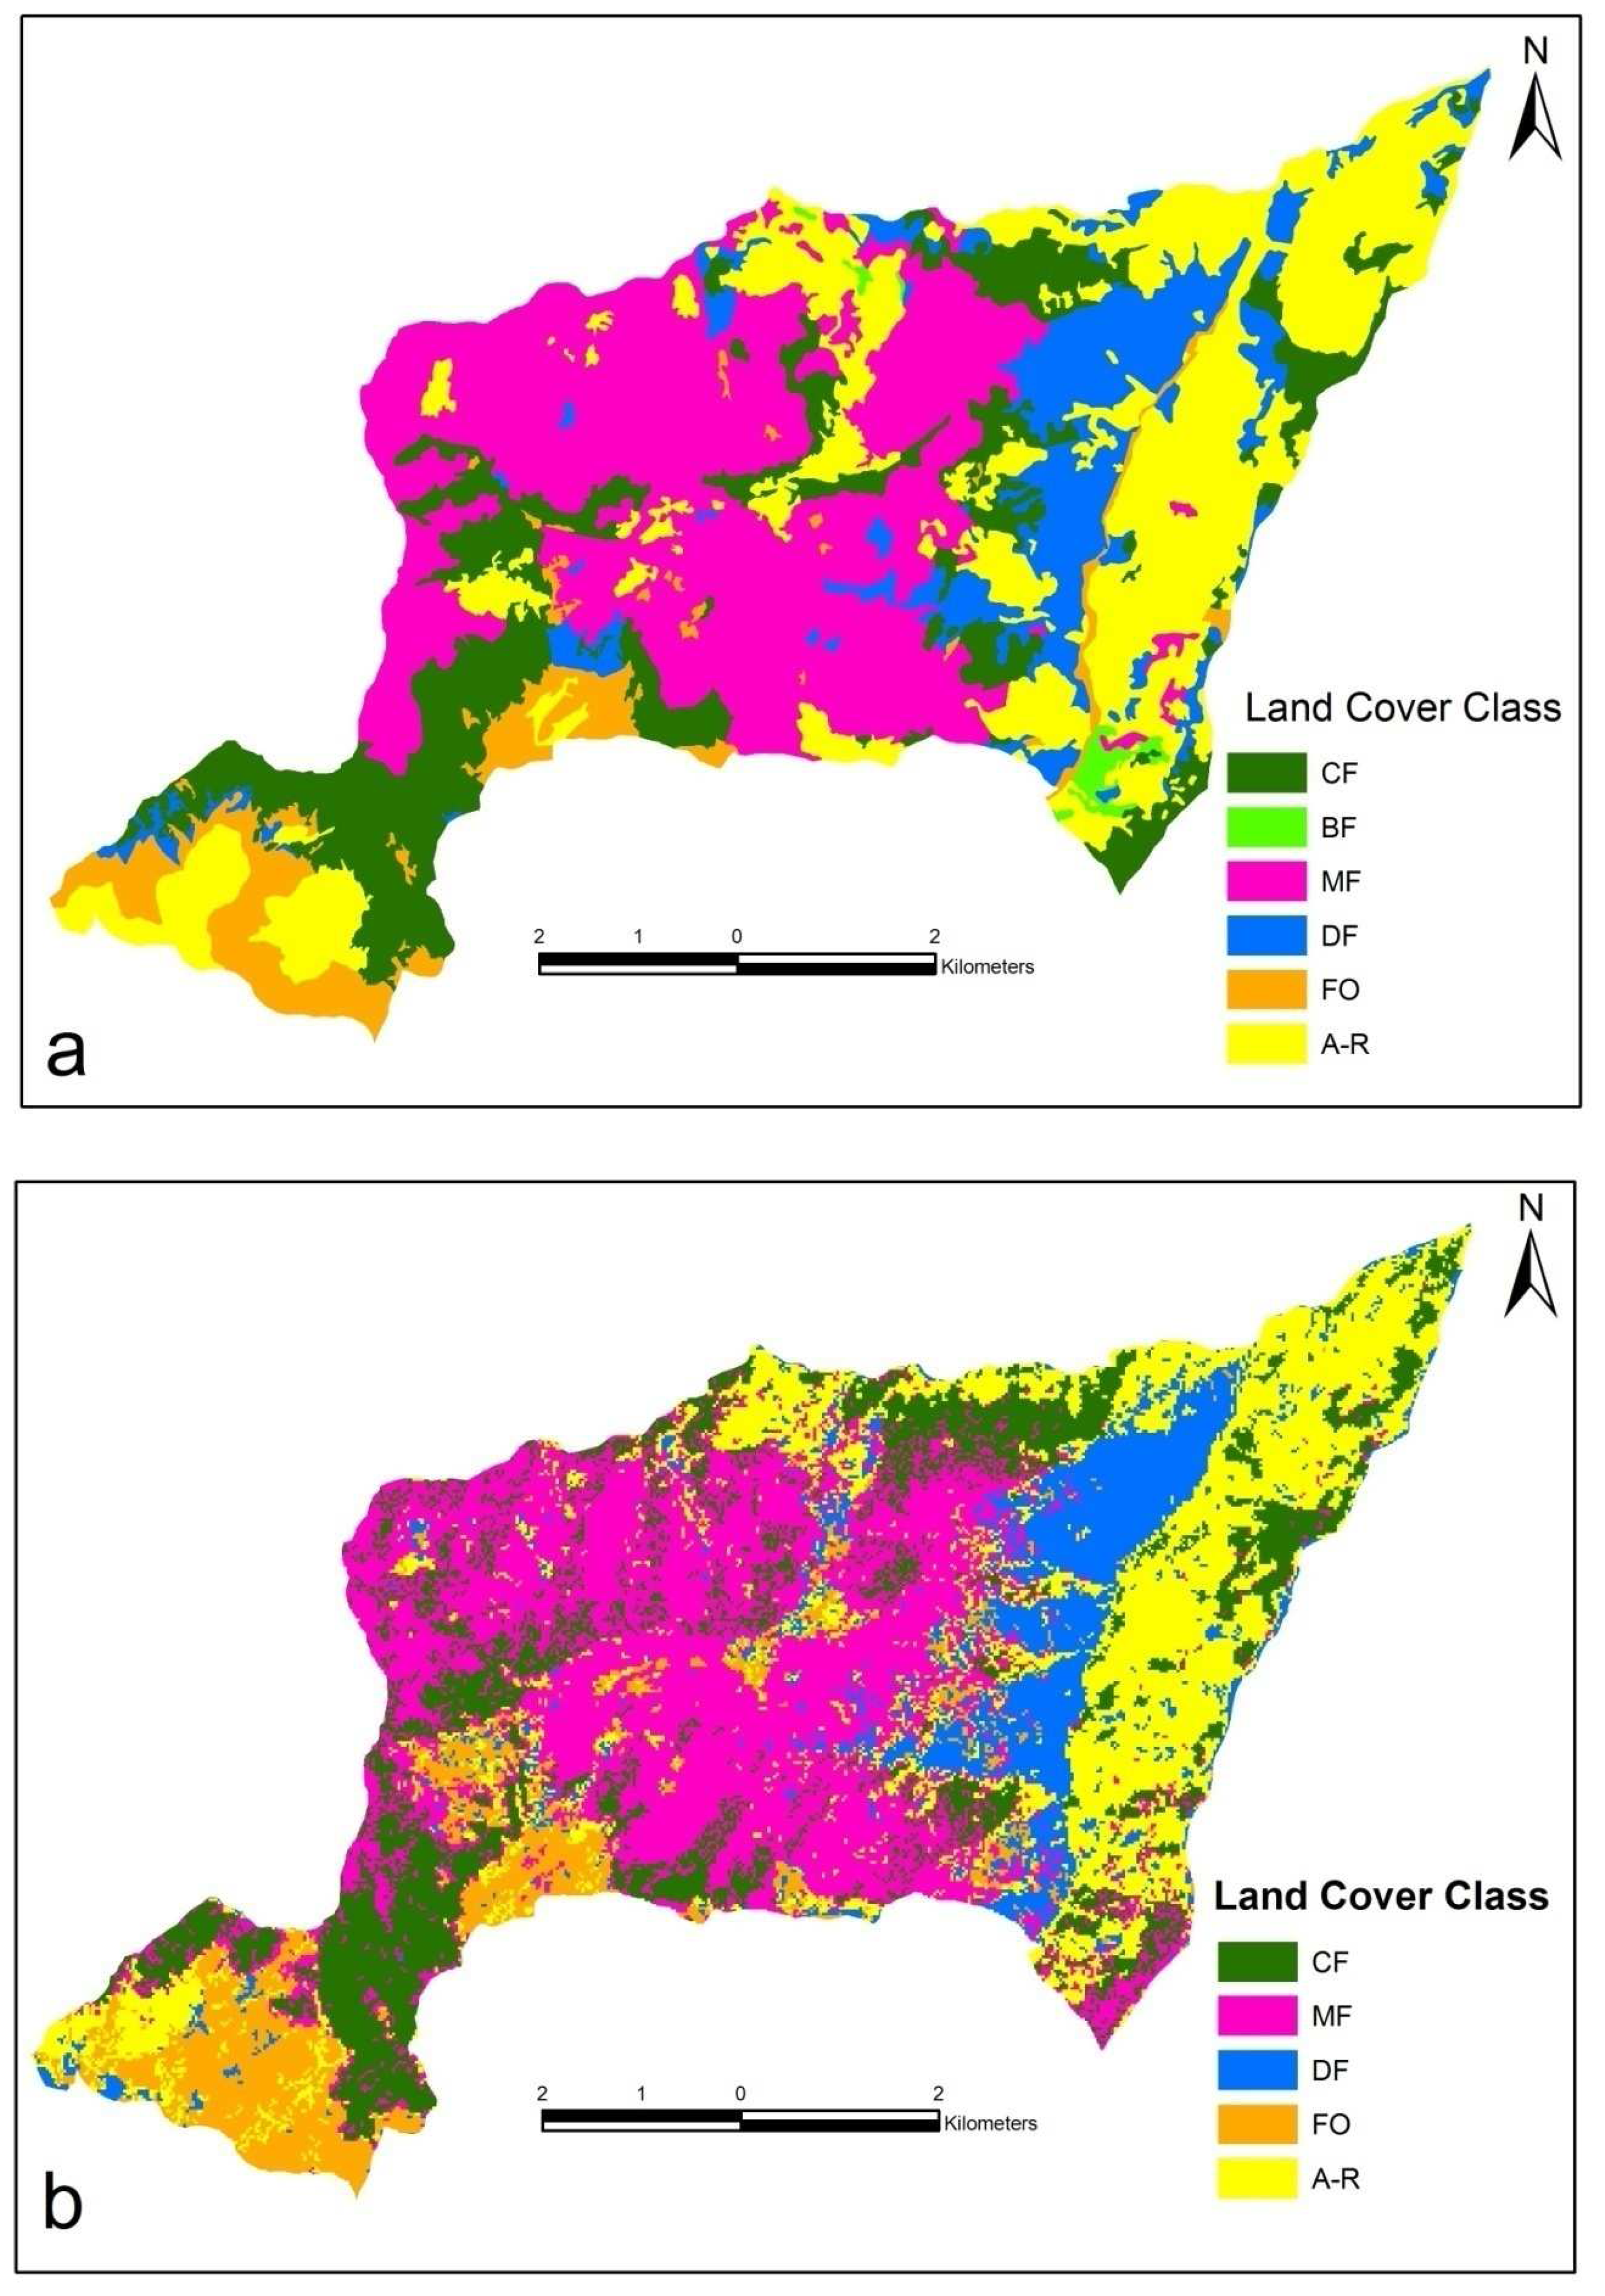
| Land Cover Classes | Description |
|---|---|
| Conifer Forest (CF) | Forest areas with pure conifer trees |
| Broadleaf Forest (BF) | Forest areas with pure broadleaf trees |
| Mixed Forest (MF) | Mixed (BF-CF, CF-BF) forest areas whose stand crown closure is greater than 10% |
| Degraded Forest (DF) | Degraded forest areas with estimated < 10% tree crown cover |
| Forest Openings (FO) | Treeless areas |
| Agriculture and Range (AR) | Agricultural lands and range areas |
| Land Cover Class | Forest Cover Type Map | Landsat 7 ETM | Difference (+/-) | Spatial Analysis | |||
|---|---|---|---|---|---|---|---|
| ha | % | ha | % | ha* | % | ||
| CF | 1119.4 | 18.7 | 1201.8 | 20.1 | -82.4 | 621.8 | 51.7 |
| BF | 40.6 | 0.7 | 0.0 | 40.6 | - | 0.0 | |
| MF | 2023.2 | 33.8 | 2085.4 | 34.8 | -62.2 | 1507.9 | 72.3 |
| DF | 694.9 | 11.6 | 690.0 | 11.5 | 4.9 | 345.2 | 50.0 |
| FO | 402.6 | 6.7 | 568.1 | 9.5 | -165.5 | 229.7 | 40.4 |
| AR | 1709.3 | 28.5 | 1444.7 | 24.1 | 264.6 | 953.4 | 66.0 |
| Total | 5990.0 | 100.0 | 5990.0 | 100.0 | |||
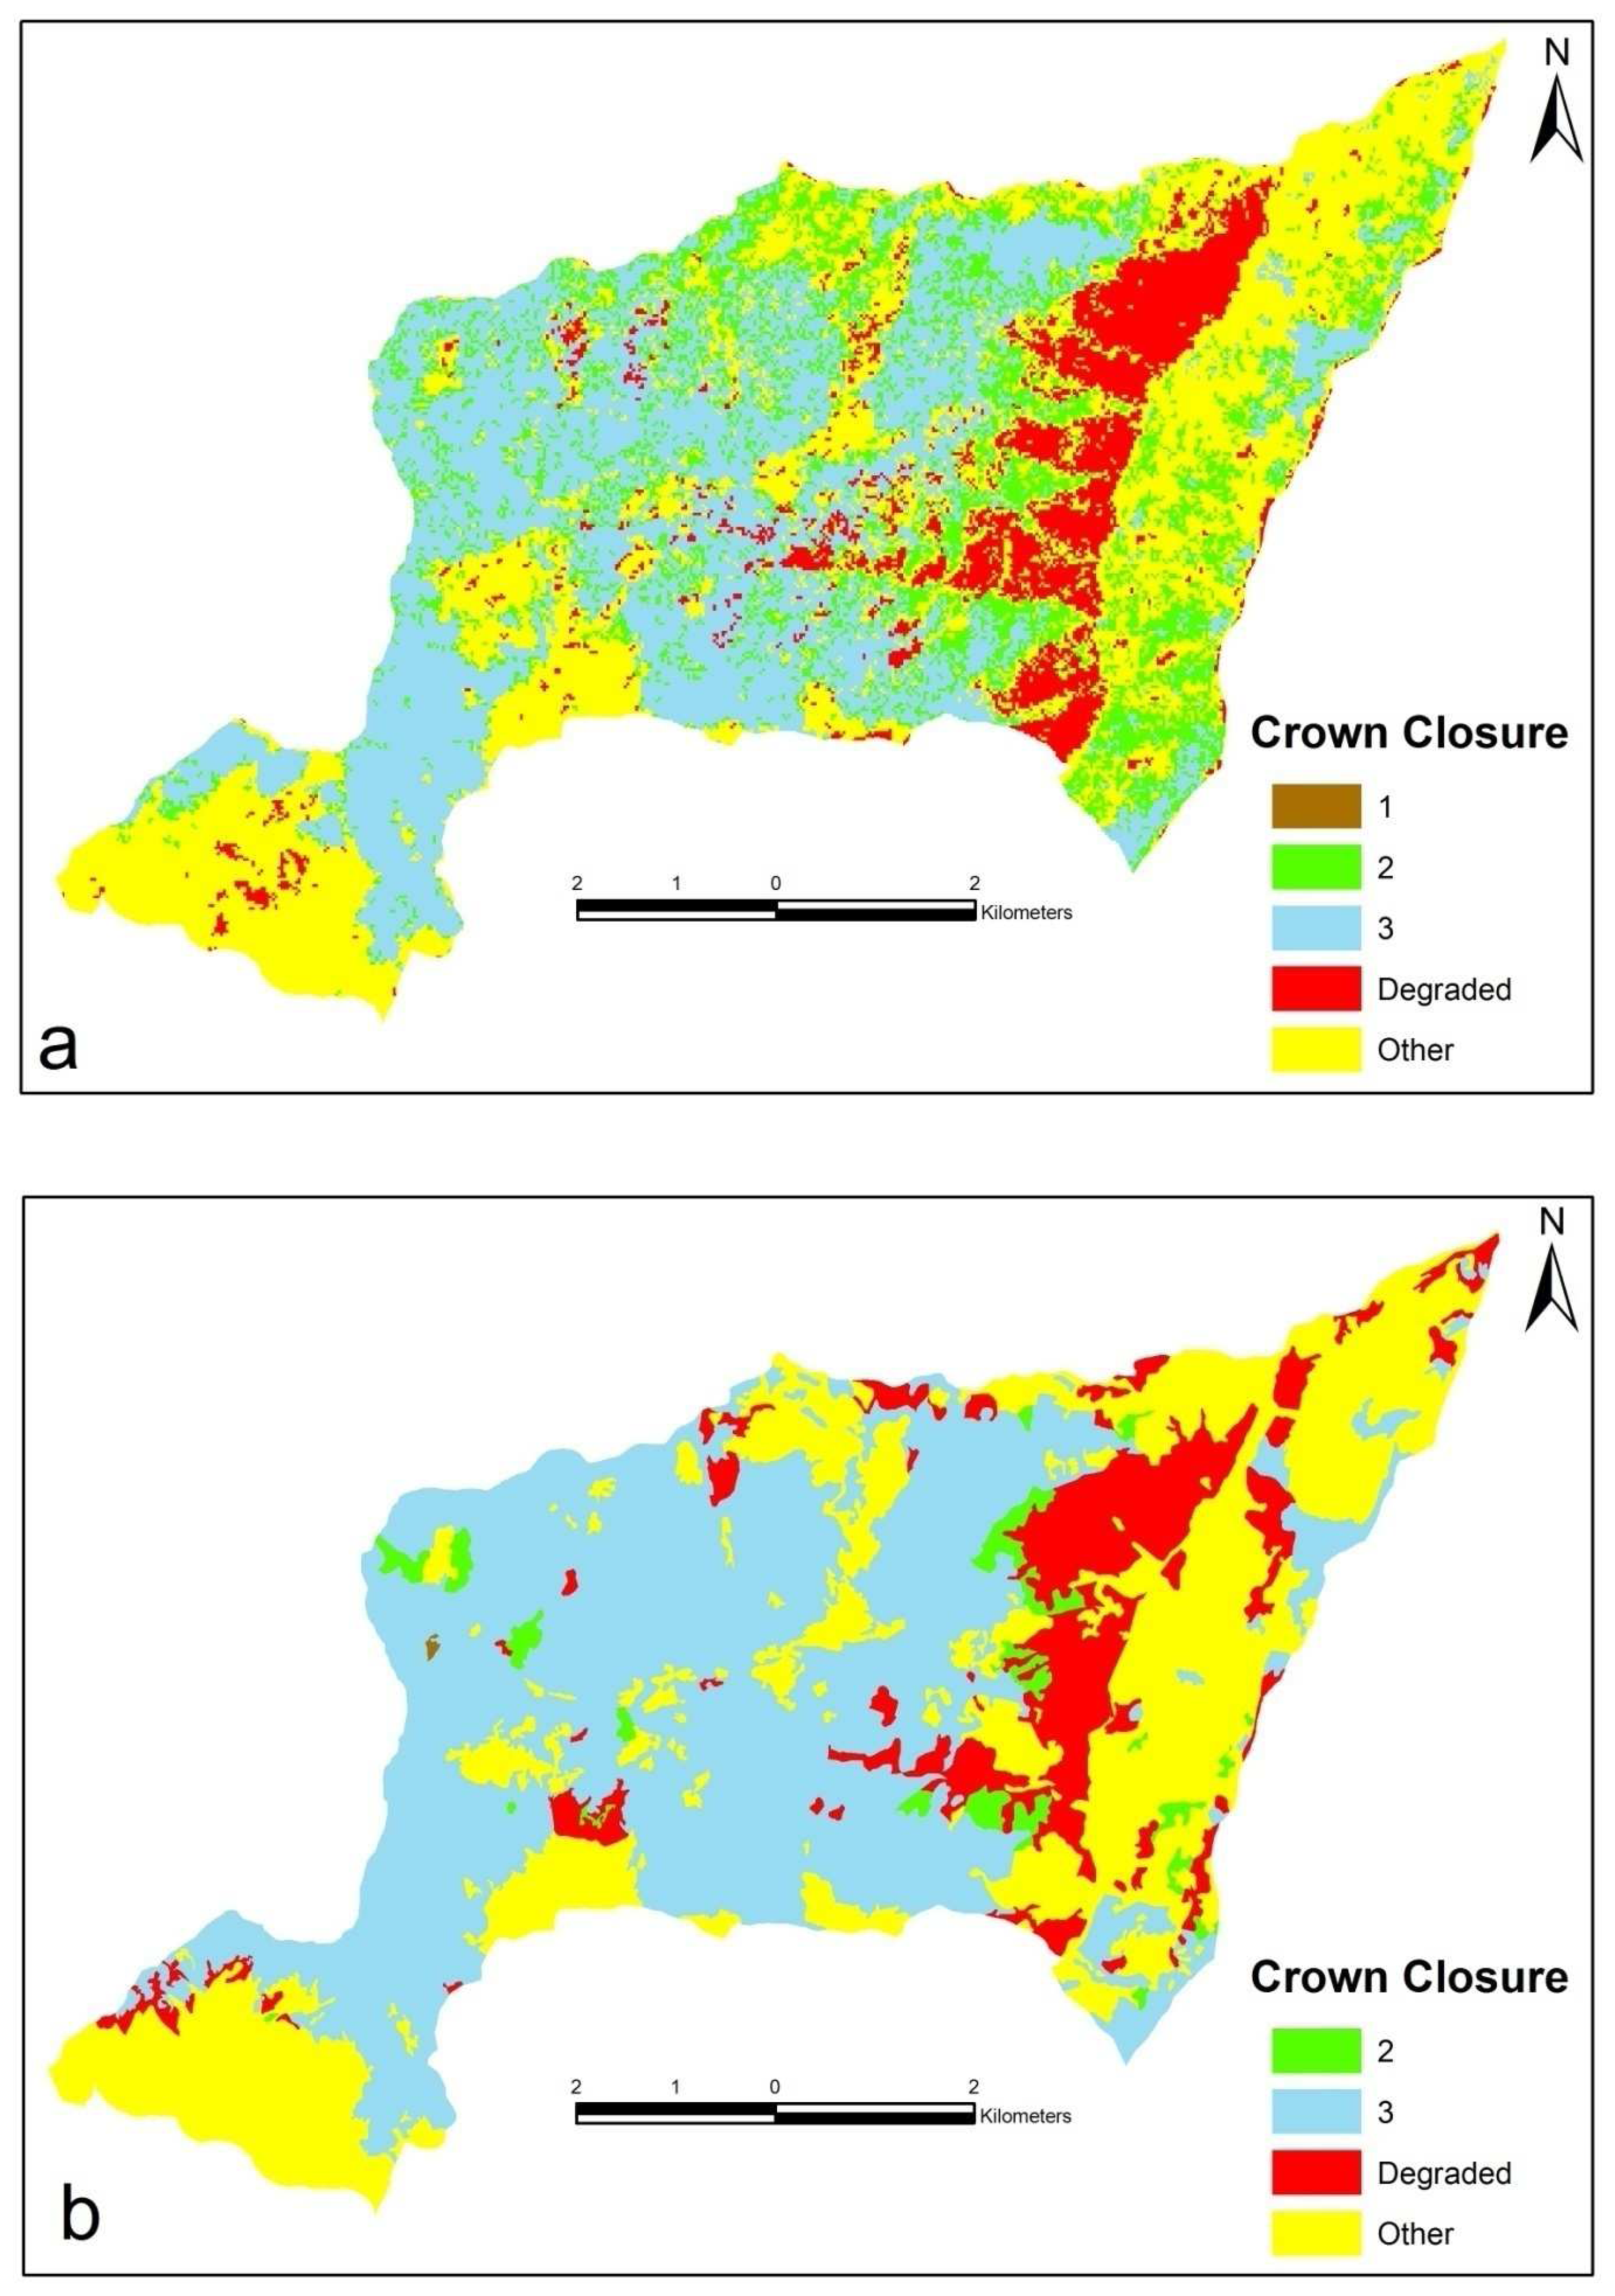
| Crown Closure Class (criteria (% cover)) | Forest Cover Type Map | Landsat 7 ETM | Difference (+/-) | Spatial Analysis | |||
|---|---|---|---|---|---|---|---|
| ha | % | ha | % | ha* | % | ||
| 1 (low coverage. 11-40 %) | 2.1 | 0.0 | - | 0.0 | 2.1 | - | 0.0 |
| 2 (medium coverage. 41-70 %) | 151.5 | 2.5 | 1057.5 | 17.7 | -906 | 67.3 | 6.4 |
| 3 (full coverage. 71-100 %) | 3029.5 | 50.6 | 2192.7 | 36.6 | 836.8 | 1994.9 | 91.0 |
| Degraded forest (sparsely distributed. 0-10 %) | 694.9 | 11.6 | 629.0 | 10.5 | 65.9 | 306.9 | 48.8 |
| Other | 2112.0 | 35.3 | 2110.8 | 35.2 | 1.2 | 1471.3 | 69.7 |
| Total | 5990.0 | 100.0 | 5990.0 | 100.0 | |||
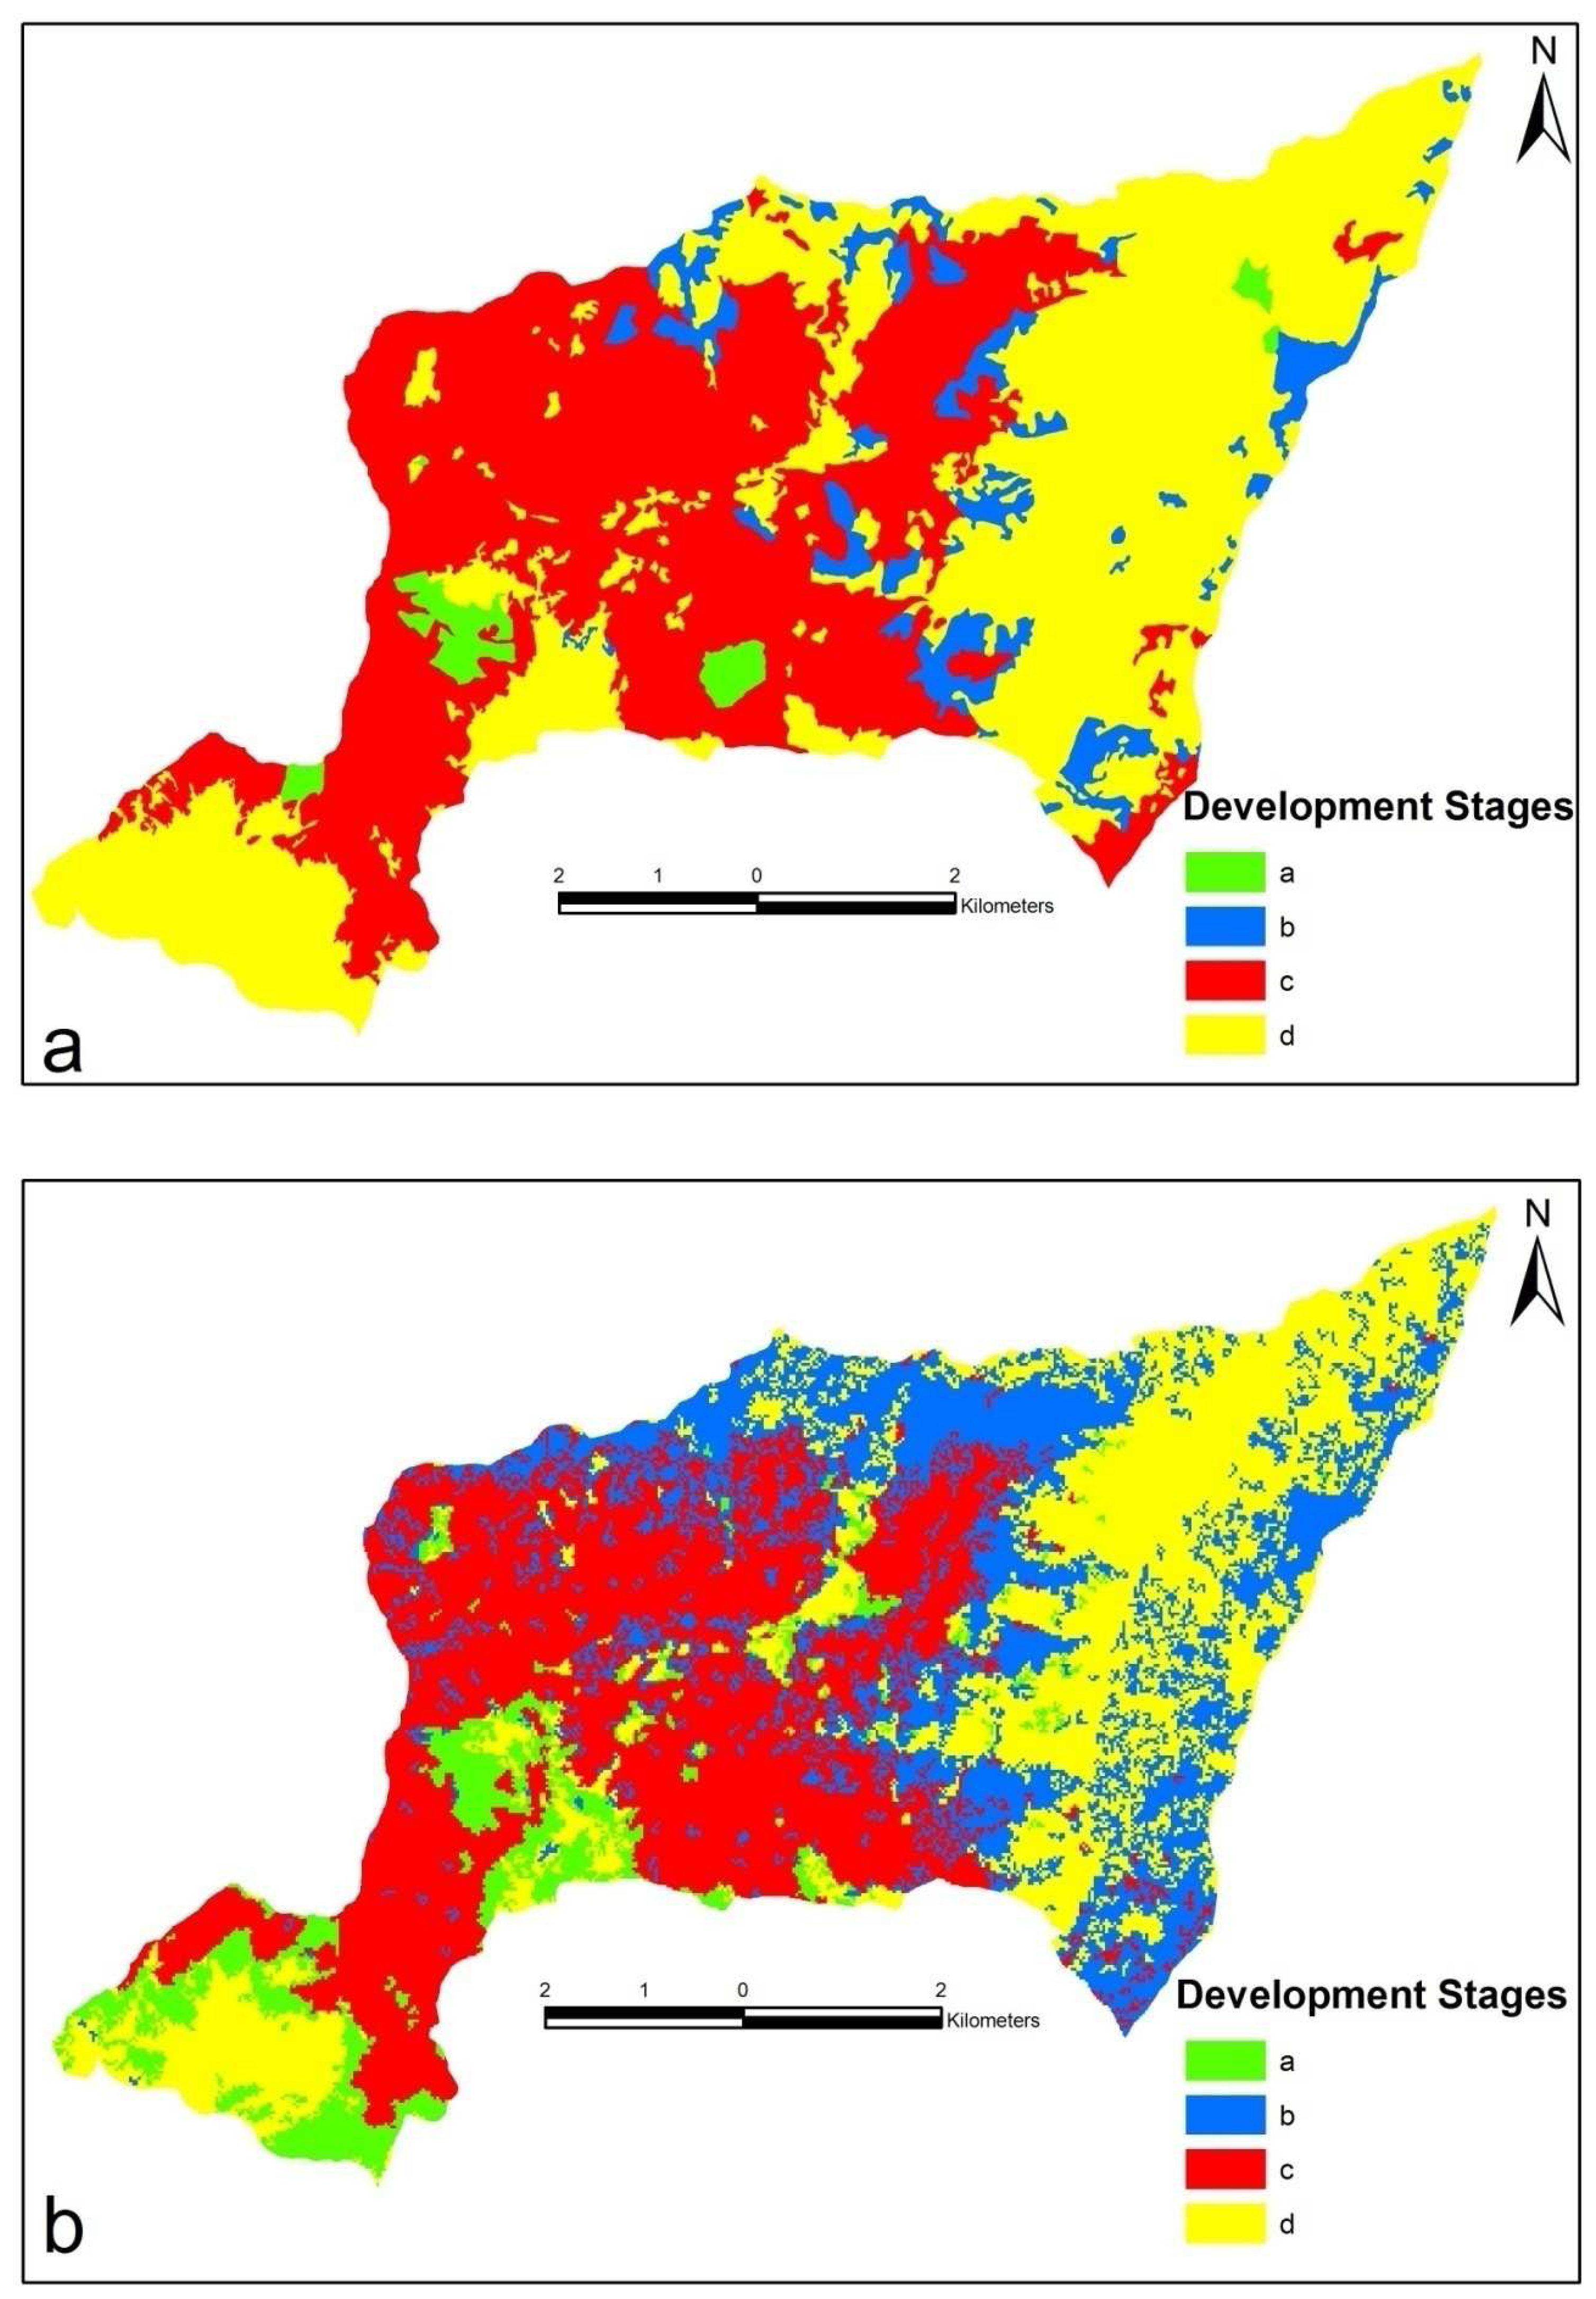
| Development Stages Class (criteria (average dbh)) | Forest Cover Type Map | Landsat 7 ETM | Difference (+/-) | Spatial Analysis | |||
|---|---|---|---|---|---|---|---|
| ha | % | ha | % | ha* | % | ||
| a (regenerated <8 cm) | 126.3 | 2.1 | 231.0 | 3.9 | -104.7 | 35.8 | 15.5 |
| b (young 8-19.9 cm) | 420.7 | 7.0 | 1193.2 | 19.9 | -772.5 | 252.1 | 21.1 |
| c (nature 20-35.9 cm) | 2634.0 | 44.0 | 2248.3 | 37.5 | 385.7 | 1995.3 | 88.7 |
| Other | 2809.0 | 46.9 | 2317.5 | 38.7 | 491.5 | 2043.3 | 88.2 |
| Total | 5990.0 | 100.0 | 5990.0 | 100.0 | |||
| Stand Type Class | Forest Cover Type Map | Landsat 7 ETM | Difference (+/-) | Spatial Analysis | |||
|---|---|---|---|---|---|---|---|
| ha | % | ha | % | ha* | % | ||
| La | 52.6 | 0.9 | 302.0 | 5.0 | -249.4 | 28.2 | 9.3 |
| Lbc2 | 62.5 | 1.0 | 161.5 | 2.7 | -99.0 | 12.7 | 7.9 |
| Lbc3 | 101.3 | 1.7 | 93.8 | 1.6 | 7.5 | 19.5 | 20.8 |
| Lc3 | 62.8 | 1.0 | 123.5 | 2.0 | -60.7 | 7.8 | 6.3 |
| Lcd3 | 829.3 | 13.8 | 807.0 | 13.5 | 22.3 | 432.7 | 53.6 |
| Dybc3 | 106.6 | 1.8 | 364.8 | 6.1 | -258.2 | 20.3 | 5.6 |
| KnLDybc3 | 62.1 | 1.1 | 130.8 | 2.2 | -68.7 | 6.4 | 4.9 |
| KnLDycd3 | 905.9 | 15.1 | 154.7 | 2.6 | 751.2 | 87.9 | 56.8 |
| KnLcd3 | 164.3 | 2.8 | 265.9 | 4.4 | -101.6 | 59.1 | 22.2 |
| LDybc3 | 123.9 | 2.1 | 191.3 | 3.2 | -67.4 | 29.2 | 15.3 |
| LDycd2 | 92.4 | 1.5 | 110.7 | 1.8 | -18.3 | 5.9 | 5.3 |
| LGKncd3 | 18.3 | 0.3 | 57.2 | 1.0 | -38.9 | 6.9 | 12.0 |
| LKnDycd3 | 340.4 | 5.7 | 743.8 | 12.4 | -403.4 | 13.9 | 1.9 |
| LKncd3 | 260.9 | 4.4 | 435.5 | 7.3 | -174.6 | 19.3 | 4.4 |
| DF | 694.9 | 11.6 | 561.2 | 9.4 | 133.7 | 296.8 | 52.9 |
| FO | 402.6 | 6.7 | 574.8 | 9.6 | -172.2 | 244.3 | 42.5 |
| AR | 1709.2 | 28.5 | 911.5 | 15.2 | 797.7 | 673.9 | 73.9 |
| Total | 5990.0 | 100.0 | 5990.0 | 100.0 | |||
© 2008 by MDPI (http://www.mdpi.org). Reproduction is permitted for noncommercial purposes.
Share and Cite
Günlü, A.; Sivrikaya, F.; Baskent, E.Z.; Keles, S.; Çakir, G.; Kadiogullari, A.İ. Estimation of Stand Type Parameters and Land Cover Using Landsat-7 ETM Image: A Case Study from Turkey. Sensors 2008, 8, 2509-2525. https://doi.org/10.3390/s8042509
Günlü A, Sivrikaya F, Baskent EZ, Keles S, Çakir G, Kadiogullari Aİ. Estimation of Stand Type Parameters and Land Cover Using Landsat-7 ETM Image: A Case Study from Turkey. Sensors. 2008; 8(4):2509-2525. https://doi.org/10.3390/s8042509
Chicago/Turabian StyleGünlü, Alkan, Fatih Sivrikaya, Emin Zeki Baskent, Sedat Keles, Günay Çakir, and Ali İhsan Kadiogullari. 2008. "Estimation of Stand Type Parameters and Land Cover Using Landsat-7 ETM Image: A Case Study from Turkey" Sensors 8, no. 4: 2509-2525. https://doi.org/10.3390/s8042509