Hemispheric Lateralization of Event-Related Brain Potentials in Different Processing Phases during Unimanual Finger Movements

Abstract
:1. Introduction
2. Methods
2.1. Participants
2.2. Variables
2.3. Experimental Design
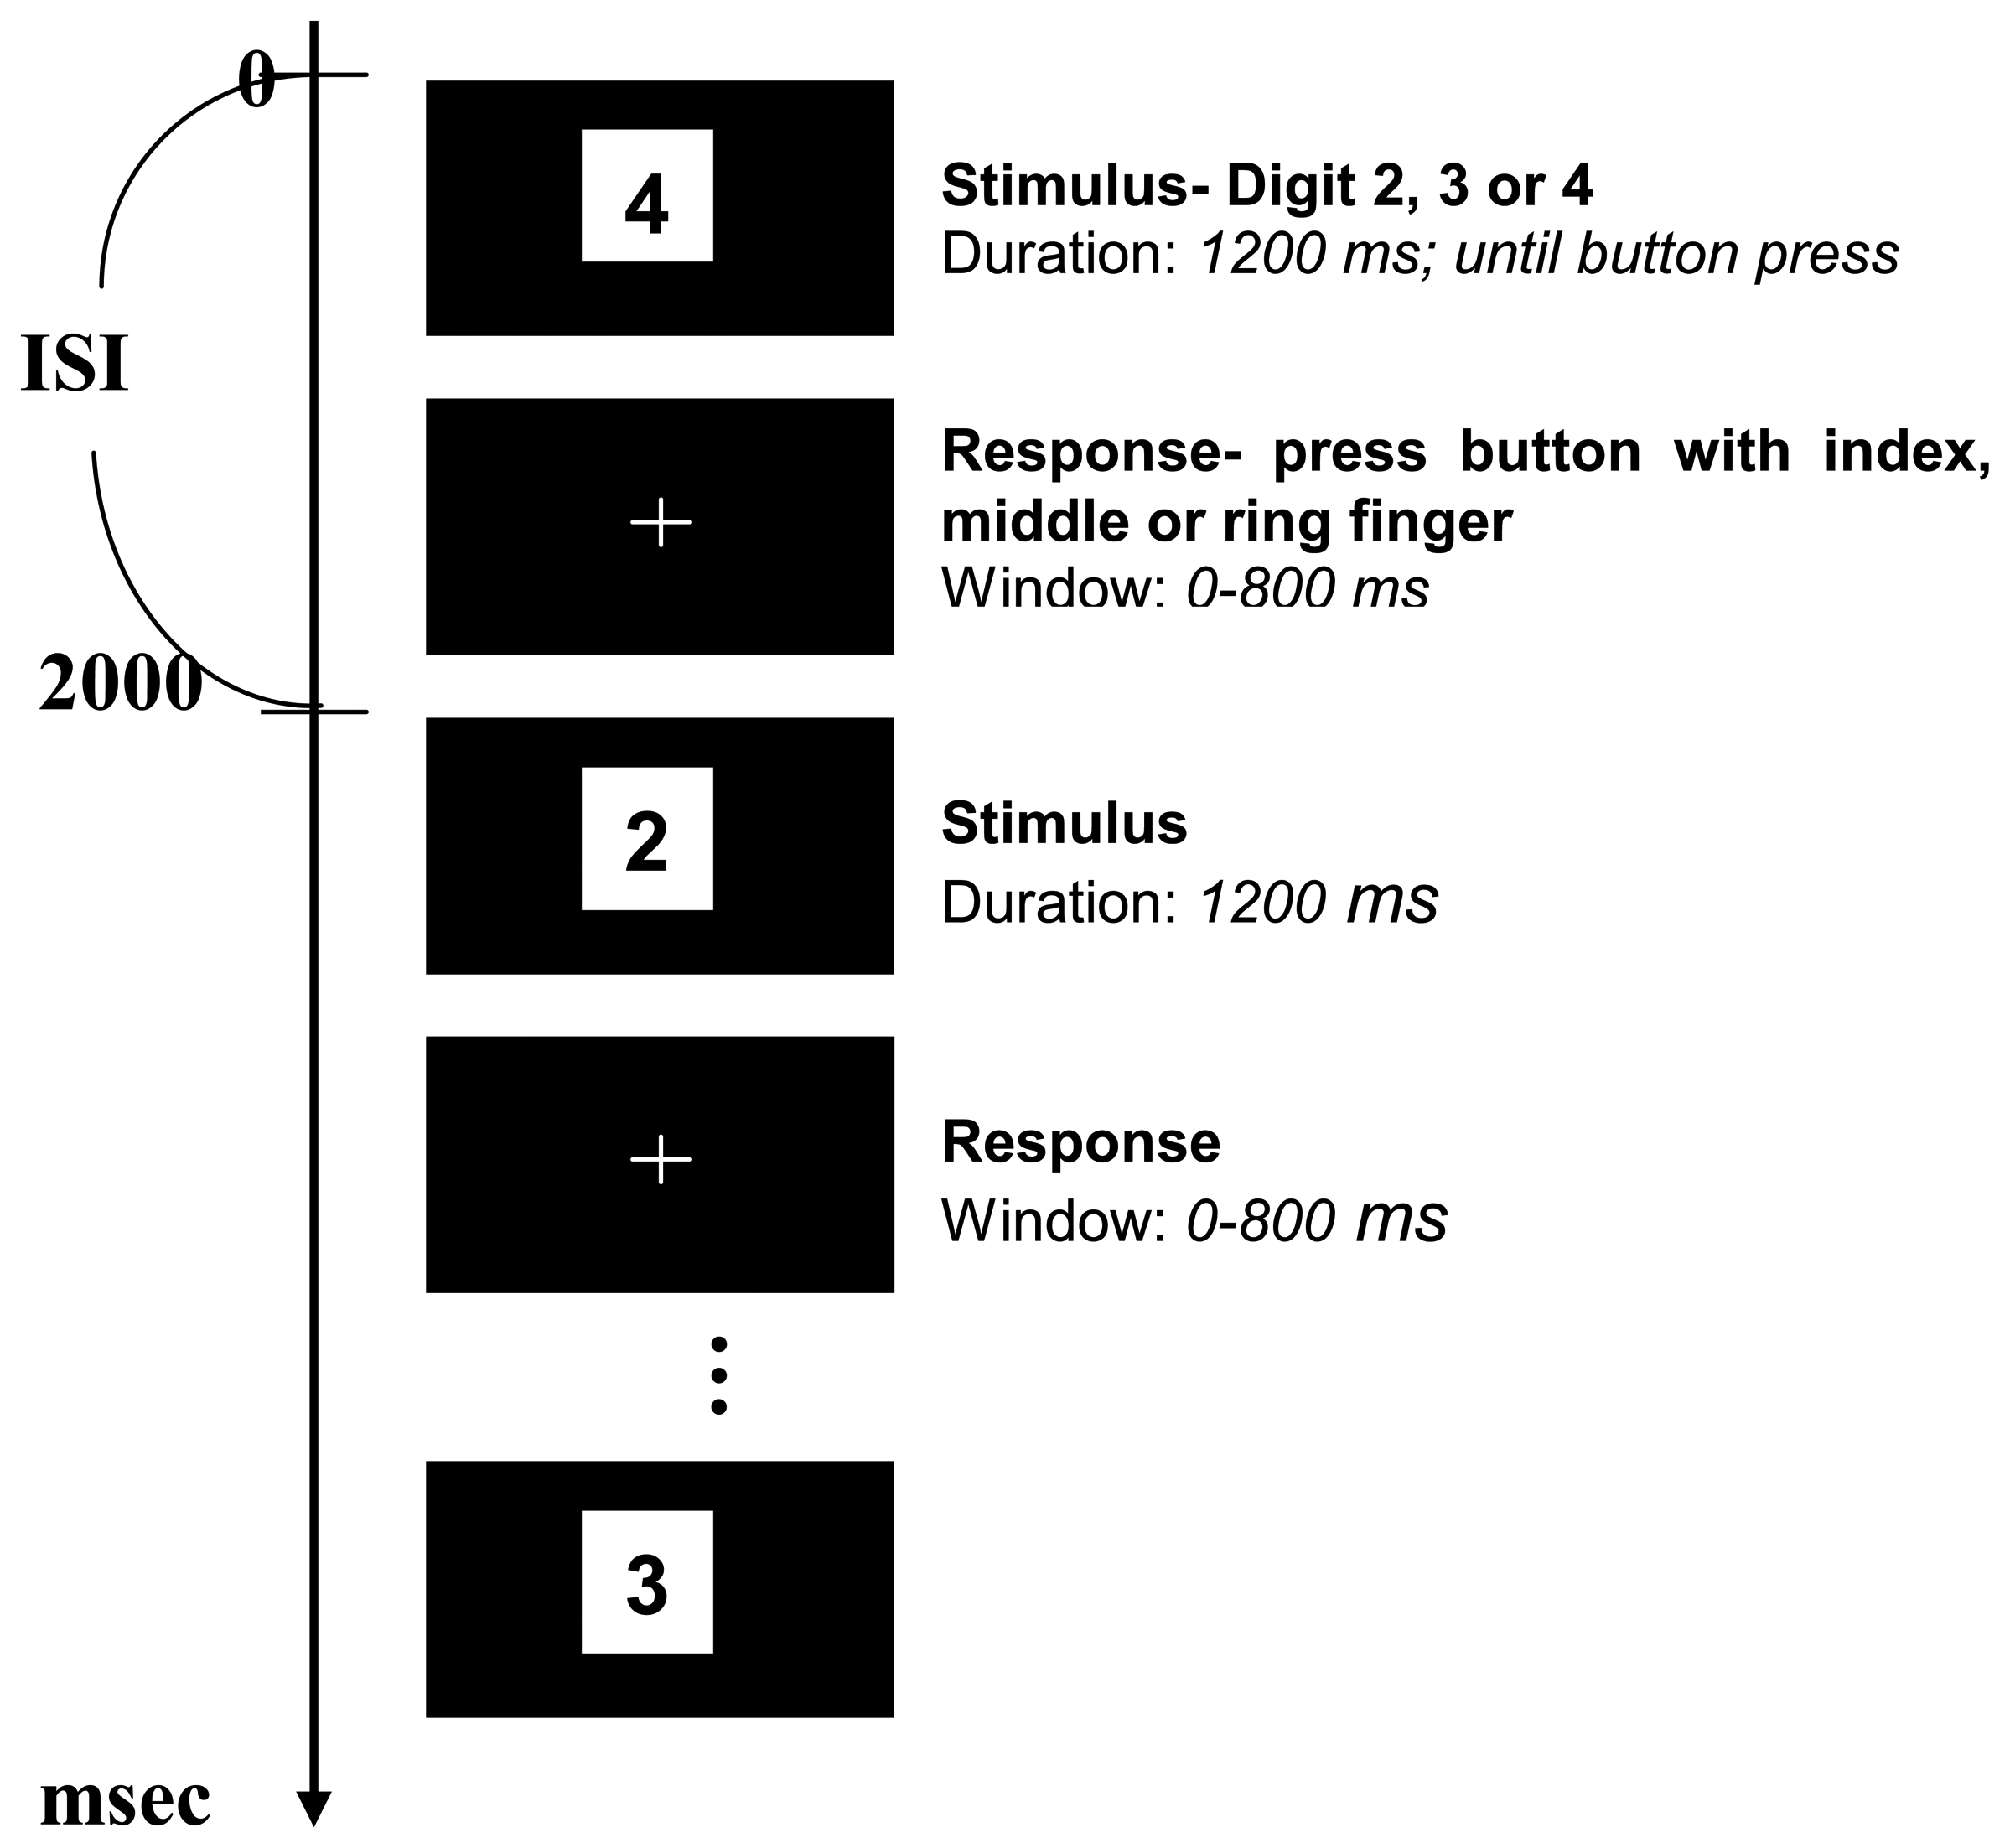
2.4. Stimulus presentation and key pressing performance
2.5. Experimental Procedure
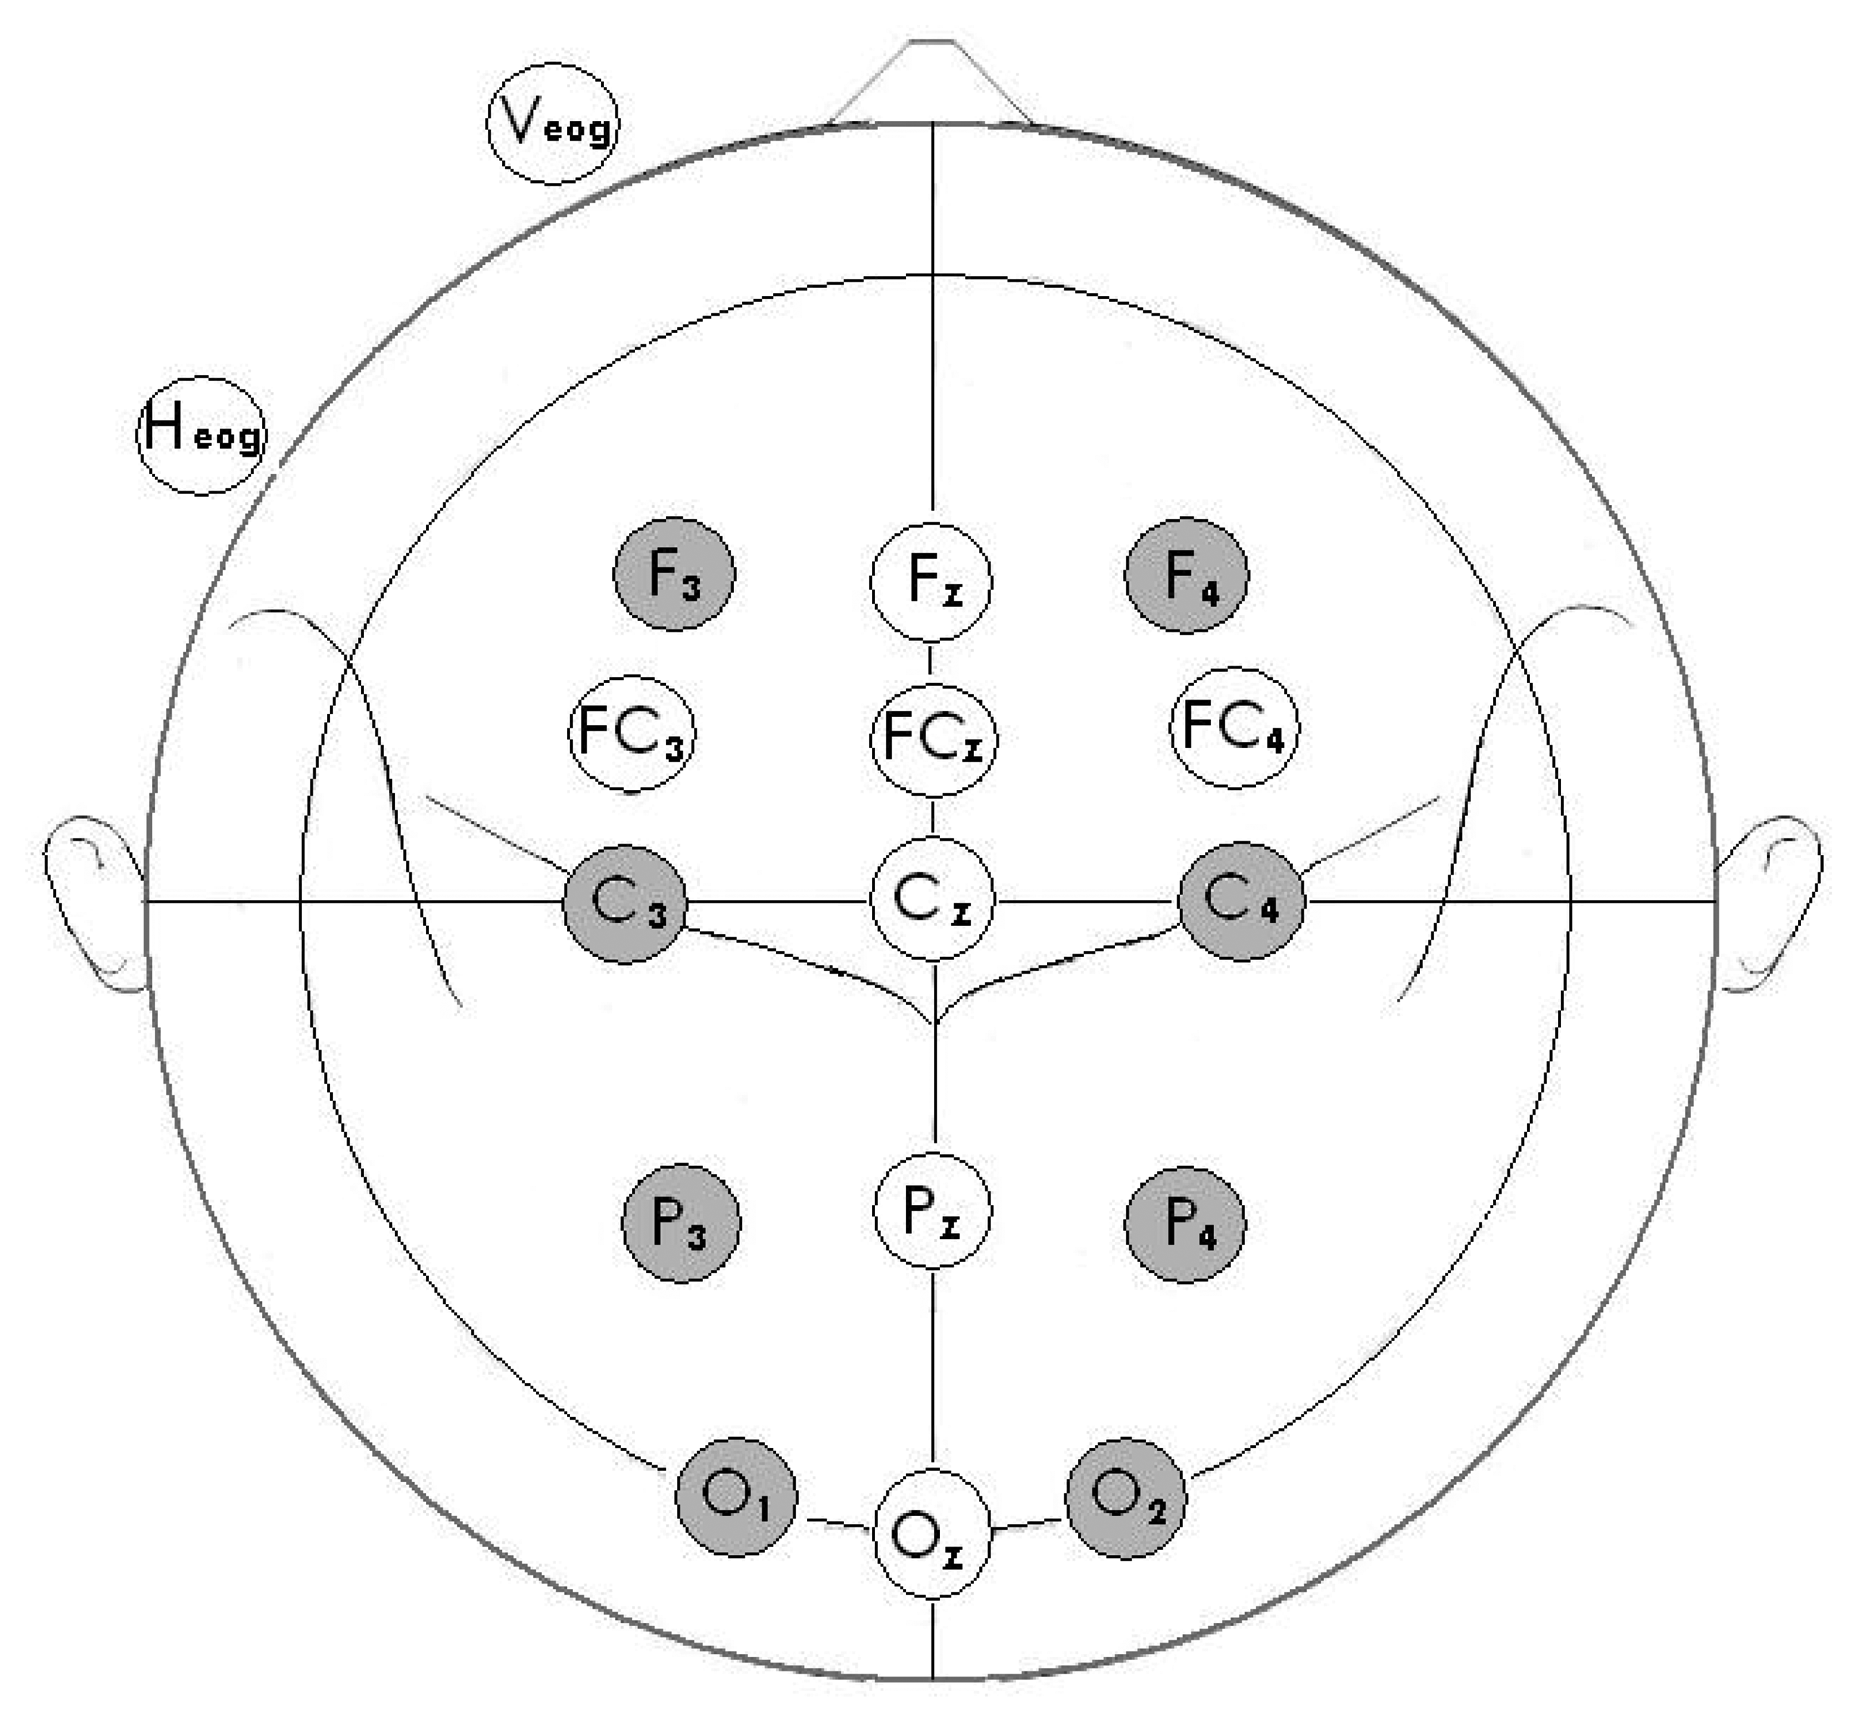
2.6. Electroencephalogram (EEG) acquisition and ERP recording
2.8. Statistics
3. Results
3.1. Behavioral results
4. Discussion and Conclusion
References
- Babiloni, C.; Carducci, F.; Del Gratta, C.; Demartin, M.; Romani, G.L.; Babiloni, F.; Rossini, P.M. Hemispherical asymmetry in human SMA during voluntary simple unilateral movements: An fMRI study. Cortex 2003, 39(2), 293–305. [Google Scholar]
- Gut, M.; Urbanik, A.; Forsberg, L.; Binder, M.; Rymarczyk, K.; Sobiecka, B.; Kozub, J.; Grabowska, A. Brain correlates of right-handedness. Acta Neurobiol. Exp. 2007, 67(1), 43–51. [Google Scholar]
- Mattay, V.S.; Callicott, J.H.; Bertolino, A.; Santha, A.K.S.; Van Horn, J.D.; Tallent, K.A.; Frank, J.A.; Weinberger, D.R. Hemispheric control of motor function: A whole brain echo planar fMRI study. Psychiatry Res. 1998, 83(1), 7–22. [Google Scholar]
- Solodkin, A.; Hlustik, P.; Noll, D.C.; Small, S.L. Lateralization of motor circuits and handedness during finger movements. Eur. J. Neurol. 2001, 8(5), 425–434. [Google Scholar]
- Babiloni, C.; Babiloni, F.; Carducci, F.; Cincotti, F.; Del Percio, C.; Hallett, M.; Kelso, A.J.S.; Moretti, D.V.; Liepert, J.; Rossini, P.M. Shall I Move My Right or My Left Hand? An EEG Study in Frequency and Time Domains. Journal of Psychophysiology 2003, 17(2), 69–86. [Google Scholar]
- Stancak, A.J.; Pfurtscheller, G. The effects of handedness and type of movement on the contralateral preponderance of mu -rhythm desynchronisation. Electroencephalogr. Clin. Neurophysiol. 1996, 99(2), 174–182. [Google Scholar]
- Stancak, A.; Pfurtscheller, G. Event-related desynchronisation of central beta-rhythms during brisk and slow self-paced finger movements of dominant and nondominant hand. Brain Res. Cogn. Brain Res. 1996, 4(3), 171–183. [Google Scholar]
- Urbano, A.; Babiloni, C.; Onorati, P.; Babiloni, F. Human cortical activity related to unilateral movements. A high resolution EEG study. Neuroreport 1996, 8(1), 203–206. [Google Scholar]
- Serrien, D.J. Coordination constraints during bimanual versus unimanual performance conditions. Neuropsychologia 2008, 46(2), 419–425. [Google Scholar]
- Hammond, G.R.; Fox, A.M. Electrophysiological evidence for lateralization of preparatory motor processes. Neuroreport 2005, 16(6), 559–562. [Google Scholar]
- Bai, O.; Mari, Z.; Vorbach, S.; Hallett, M. Asymmetric spatiotemporal patterns of event-related desynchronization preceding voluntary sequential finger movements: A high-resolution EEG study. Clin. Neurophysiol. 2005, 116(5), 1213–1221. [Google Scholar]
- Zhu, Y.H.; Di, H.B.; Wang, M.H.; Li, J.C.; Weng, X.C.; Chen, Y.Z. Lateralized distribution of motor areas involved in voluntary movement. Journal of Zhejiang University Medical Sciences 2005, 34(6), 518–522. [Google Scholar]
- Binkofski, F.; Amunts, K.; Stephan, K.M.; Posse, S.; Schormann, T.; Freund, H.-J.; Zilles, K.; Seitz, R.J. Broca's region subserves imagery of motion: A combined cytoarchitectonic and fMRI study. Hum. Brain Mapp. 2000, 11(4), 273–285. [Google Scholar]
- Meng, L.F.; Lu, C.P.; Chan, H.L. Time-varying brain potentials and interhemispheric coherences of anterior and posterior regions during unilateral finger movements. Sensors 2007, 7, 960–978. [Google Scholar]
- Meng, L.F.; Lu, C.P.; Chen, B.W.; Chen, C.H. Fatigue induced reversed hemispheric plasticity: A brain electrophysiological study. Lect. Notes Comput. Sci. 2006, 4232, 65–71. [Google Scholar]
- Meng, L.F.; Lu, C.P.; Chen, C.H. Unskilled finger key pressing and brain coherence. Lect. Notes Comput. Sci. 2006, 4061, 437–441. [Google Scholar]
- Lindín, M.; Zurrón, M.; Díaz, F. Changes in P300 amplitude during an active standard auditory oddball task. Biol Psychol. 2004, 66(2), 153–167. [Google Scholar]


| Early visual | Pre-execution | Execution | Post-execution | |
|---|---|---|---|---|
| Frontal | ||||
| F3 | -0.174 | -0.485 | 0.375 | -1.129 |
| Fz | -0.791 | -0.654 | 0.487 | -1.410 |
| F4 | -0.147 | -0.424 | -0.112 | -1.243 |
| F-value | F(1.471, 22.062)= 10.911***; p=.001 | F(2, 30) = 0.866; p=.431 | F(2, 30)= 5.900**; p=.007 | F(2, 30)= 2.348; p=.113 |
| Central | ||||
| C3 | -0.460 | 0.459 | 0.562 | -1.805 |
| Cz | -1.033 | 0.169 | 0.464 | -2.010 |
| C4 | -0.433 | 1.163 | -0.200 | -2.104 |
| F-value | F(2, 30)= 21.884***; p=.000 | F(2, 30)= 17.701***; p=.000 | F(2, 30)= 16.470***; p=.000 | F(2, 30)= 4.191*; p=.025 |
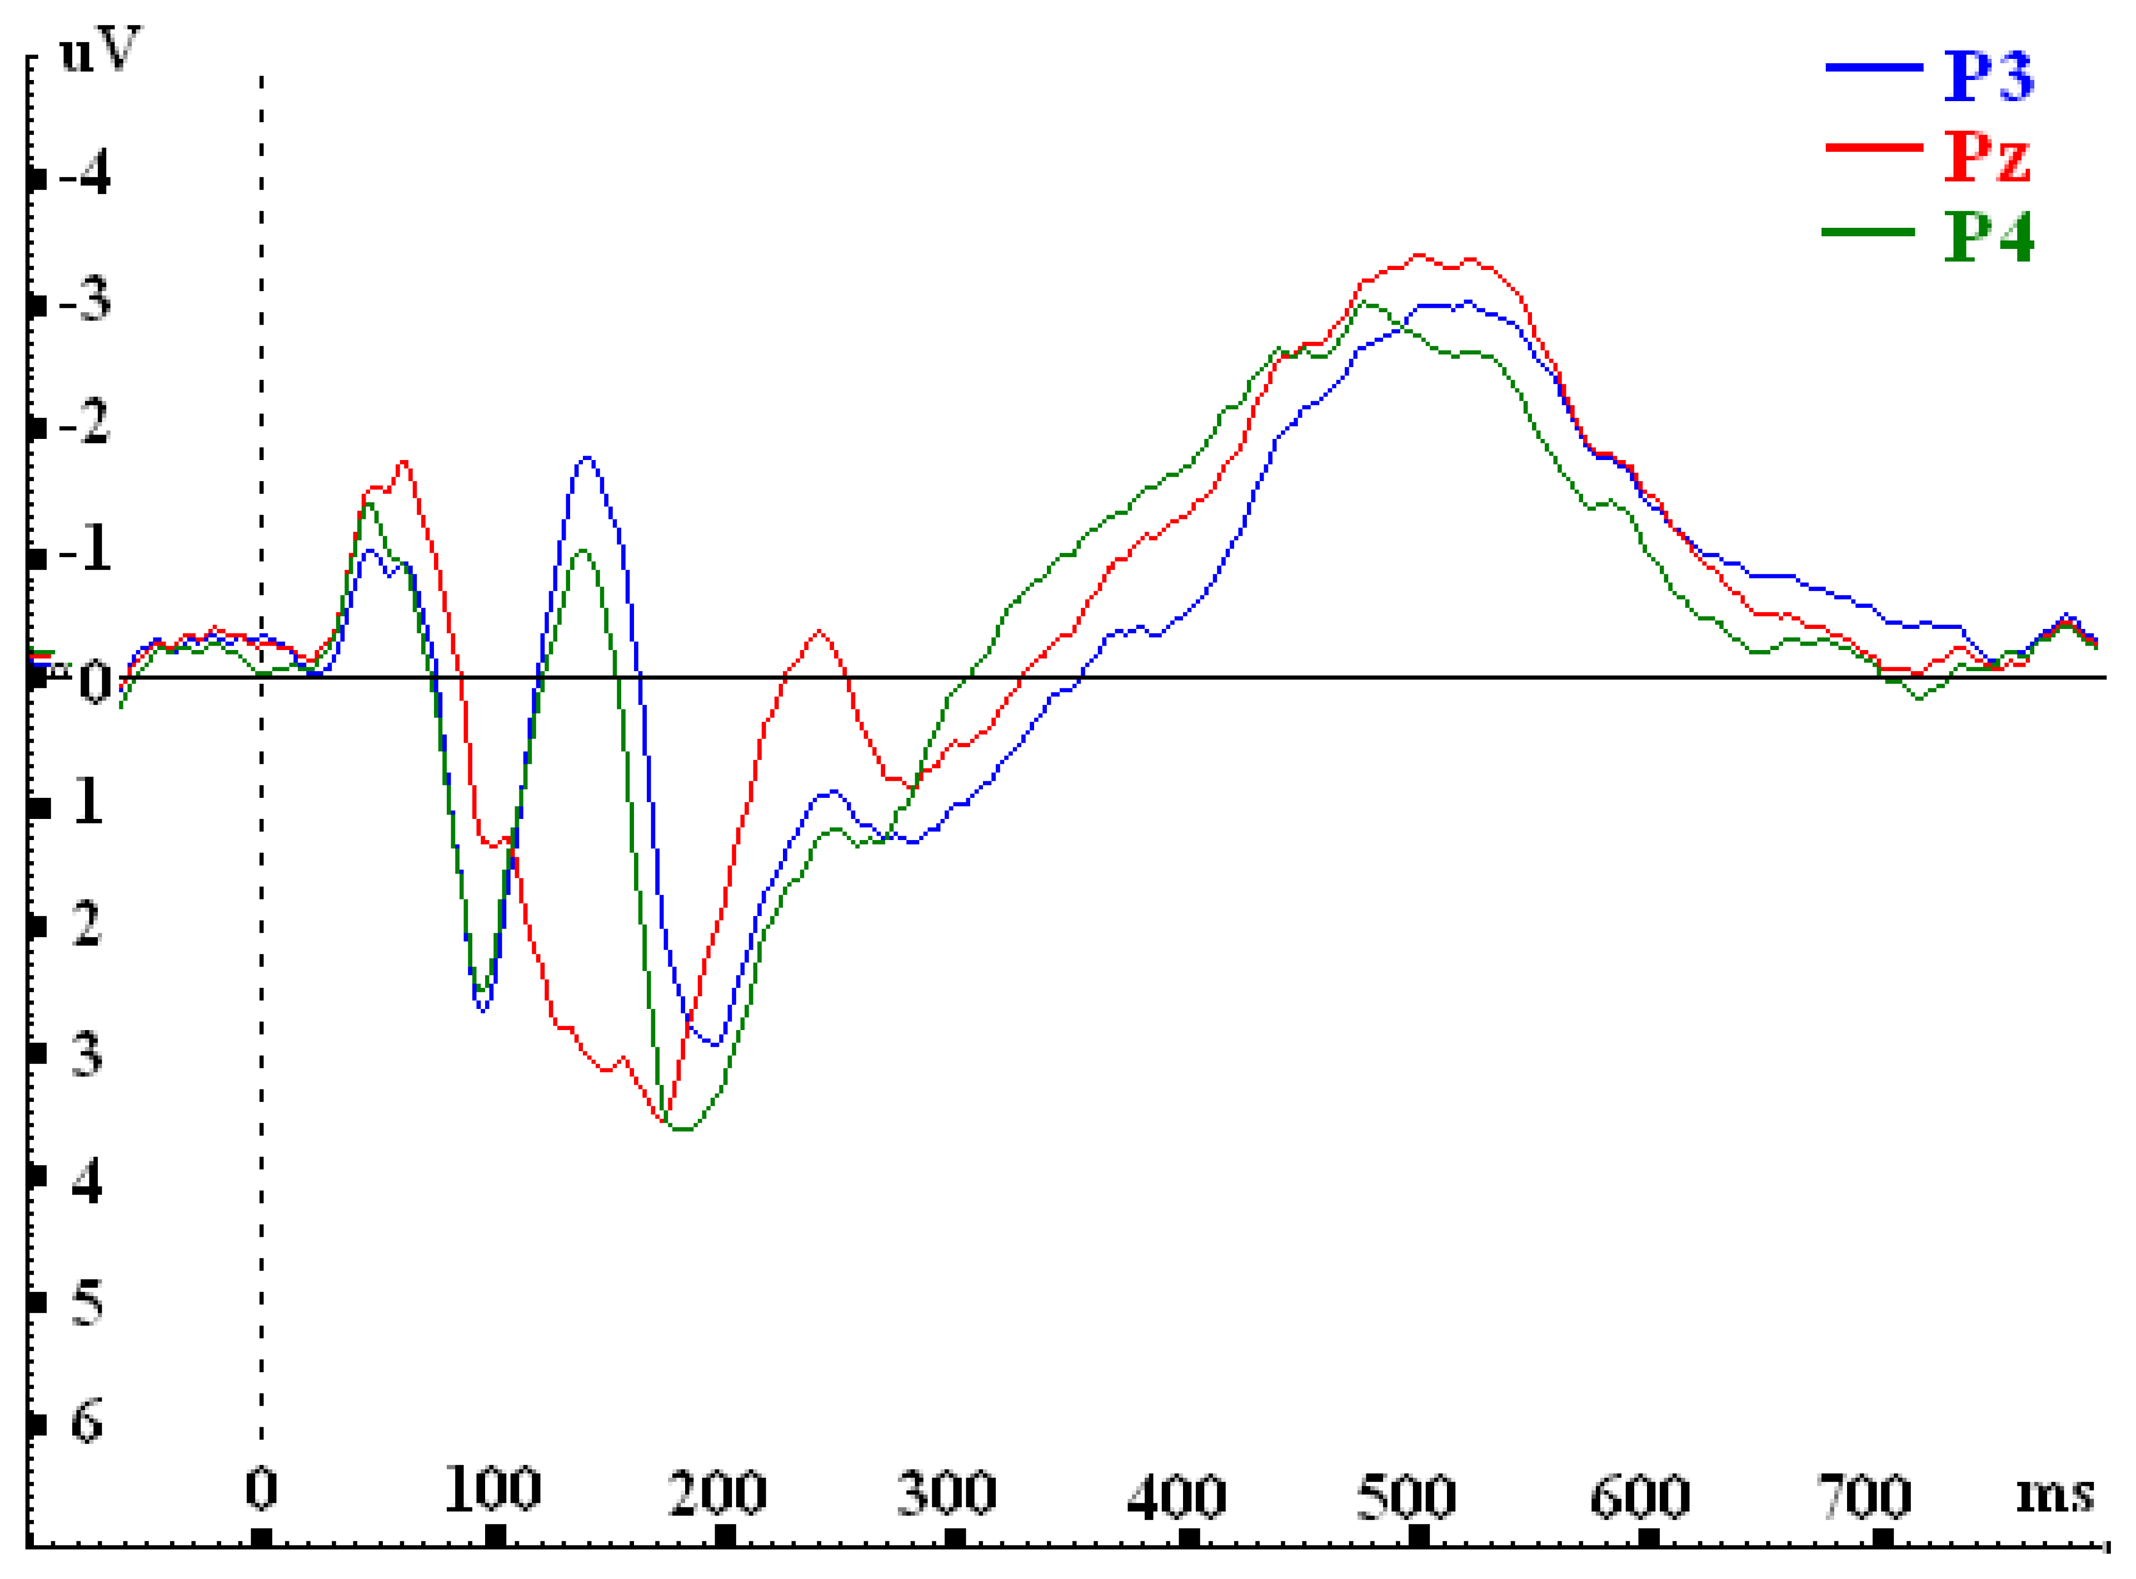
| Parietal | ||||
| P3 | 1.467 | 1.741 | -0.061 | -2.203 |
| Pz | 0.768 | 0.989 | -0.652 | -2.523 |
| P4 | 1.436 | 2.063 | -1.165 | -2.129 |
| F-value | F(2, 30)= 5.849**; p=.007 | F(2, 30)= 15.477***; p=.000 | F(2, 30)= 12.169***; p=.000 | F(2, 30)= 3.980*; p=.029 |
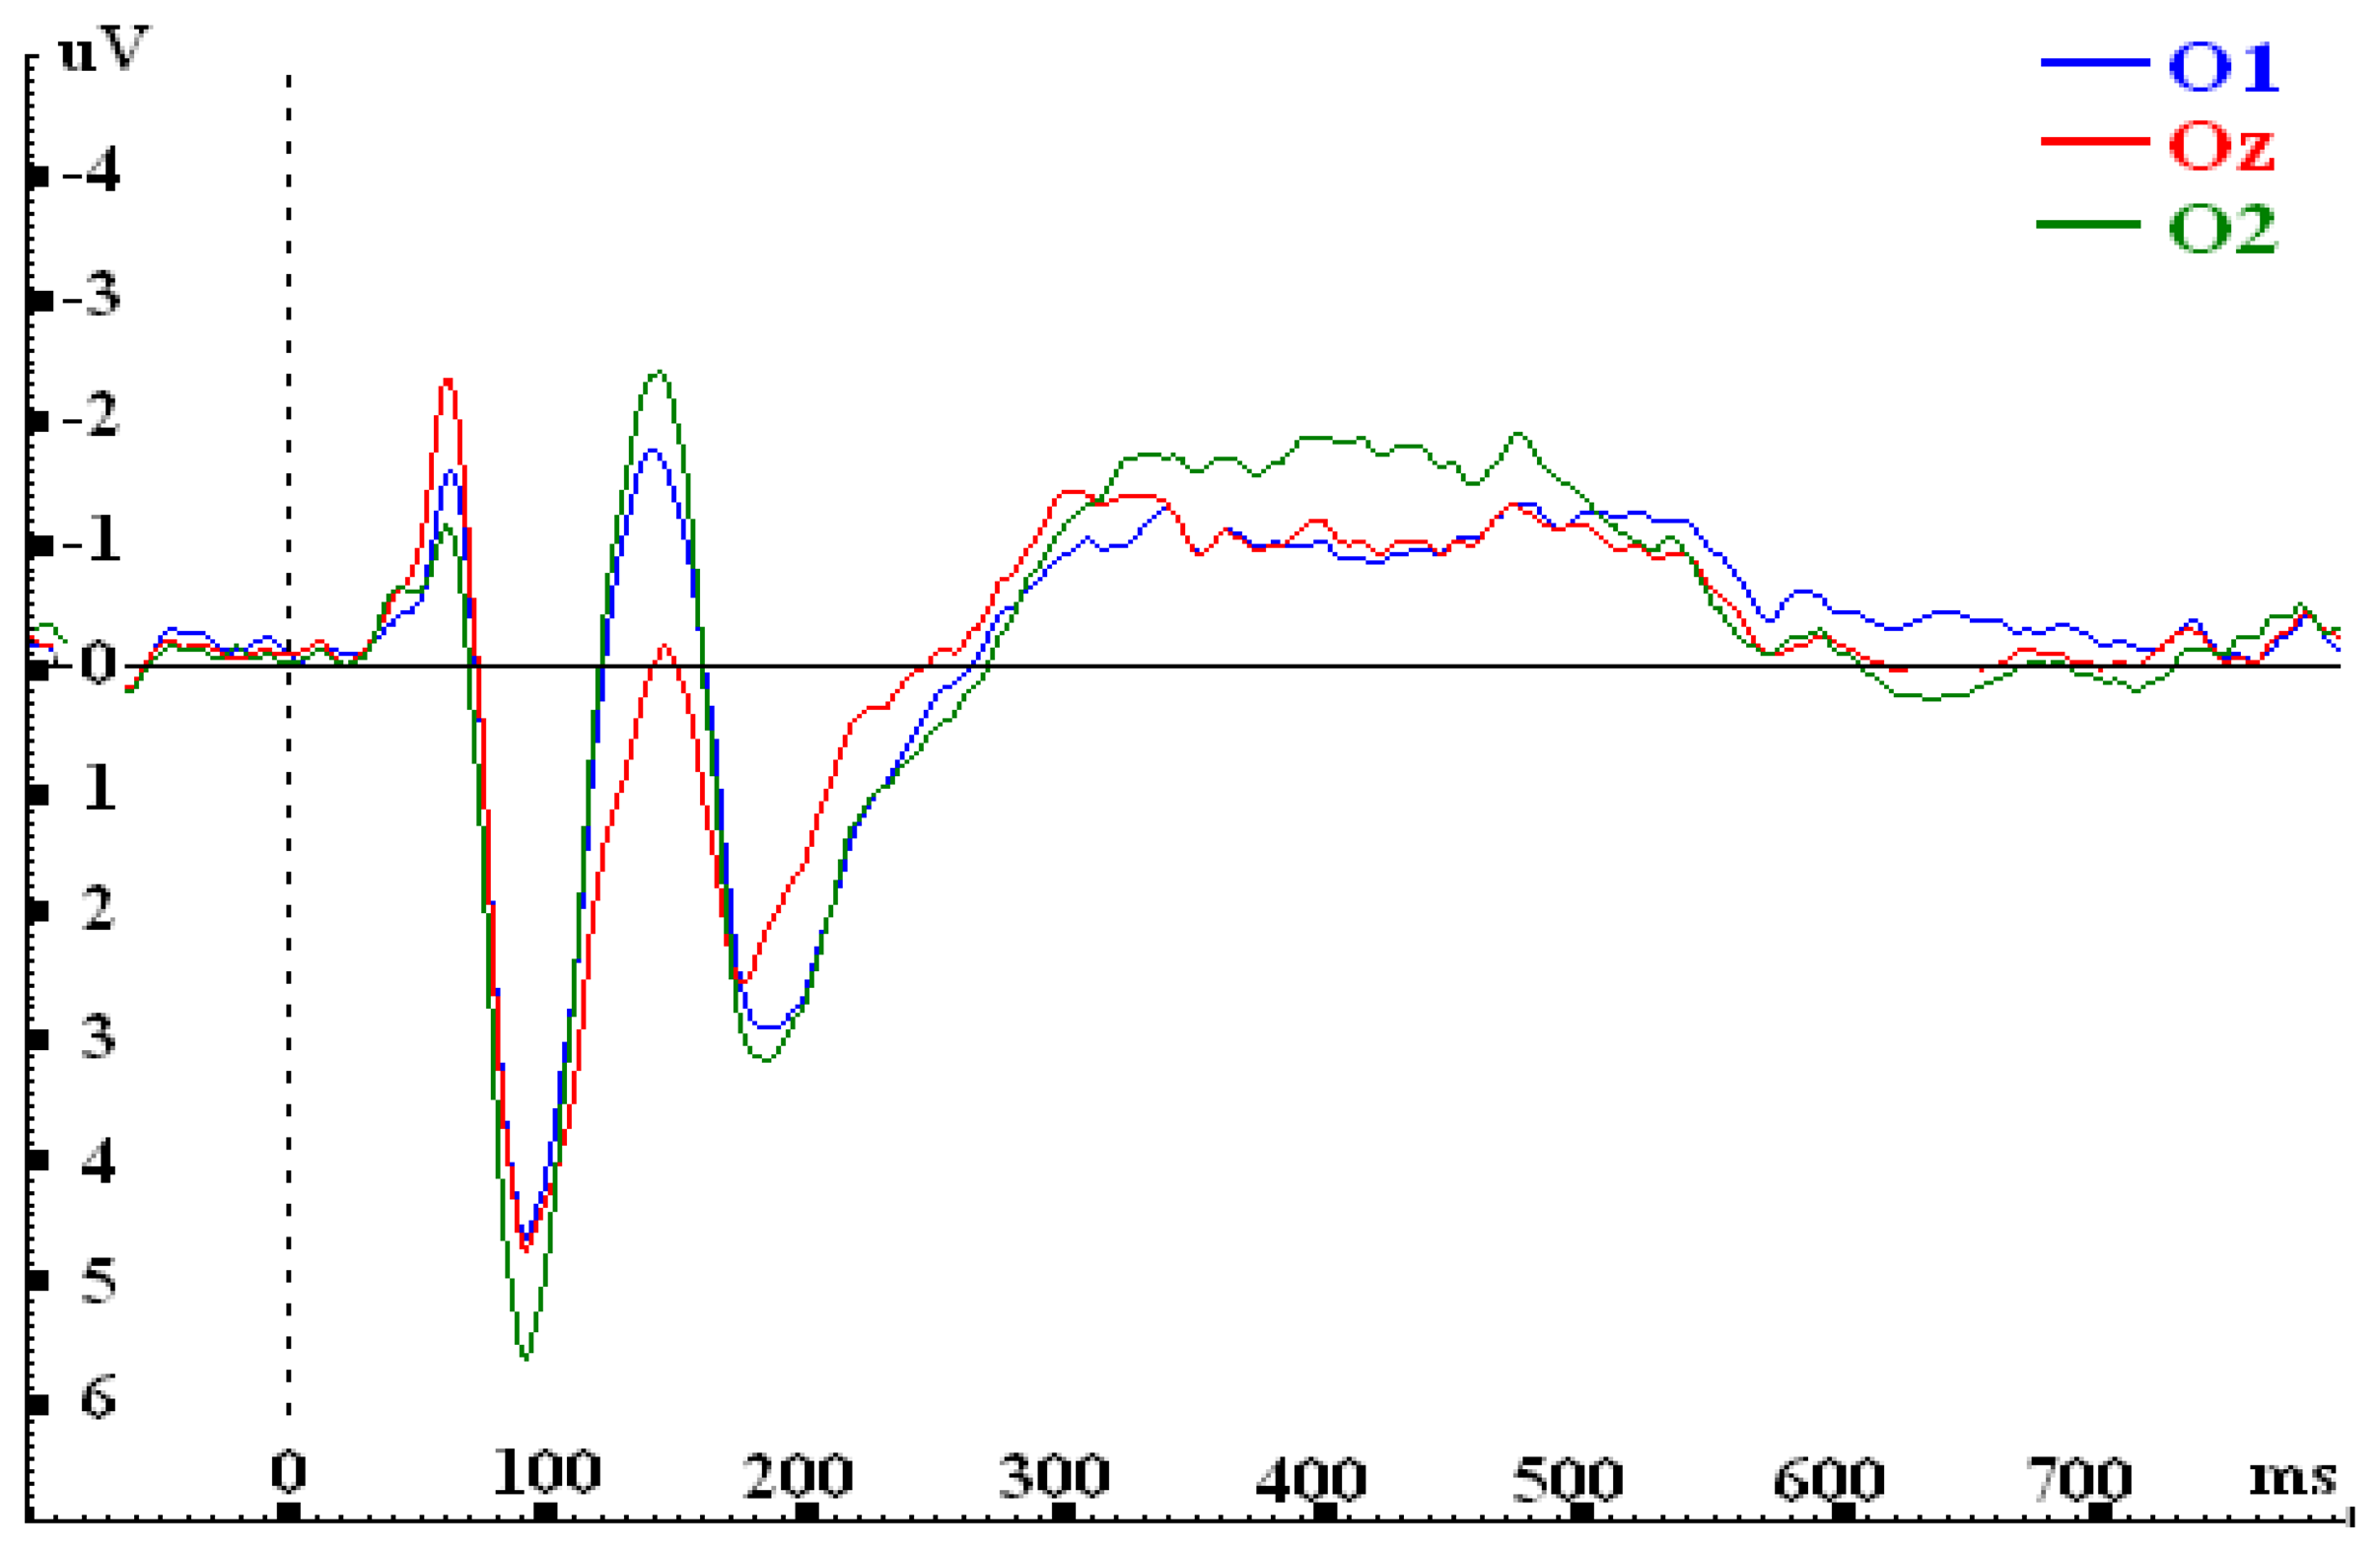
| Occipital | ||||
| O1 | 3.090 | 1.161 | -1.004 | -0.907 |
| Oz | 3.441 | 0.571 | -1.124 | -0.734 |
| O2 | 3.687 | 1.284 | -1.669 | -0.975 |
| F-value | F(2, 30)=1.866; p=.172 | F(2,30)= 10.979***; p=.000 | F(2,30)= 14.281***; p=.000 | F(2, 30)=3.038; p=.063 |
| Early visual | Pre-execution | Execution | Post-execution | |||||
|---|---|---|---|---|---|---|---|---|
| Mean Difference | p | Mean Difference | p | Mean Difference | p | Mean Difference | p | |
| F3 vs. F4 | -0.027 | .891 | -0.061 | .784 | 0.488* | .018 | 0.114 | .439 |
| C3 vs. C4 | -0.027 | .832 | -0.704** | .003 | 0.762*** | .000 | 0.299* | .023 |
| P3 vs. P4 | 0.030 | ..872 | -0.322 | .096 | 1.104*** | .000 | - 0.074 | .658 |
| O1 vs. O2 | -0.597 | .050 | -0.123 | .486 | 0.665*** | .001 | 0.068 | .504 |
| Early visual (P75-120) | Pre-execution (N175-260) | Execution (P310-420) | Post-execution (N420-620) | |
|---|---|---|---|---|
| F (F3 vs. F4) | ○ | |||
| C (C3 vs. C4) | ○ | ○ | ○ | |
| P (P3 vs. P4) | ○ | |||
| O (O1 vs. O2) | ○ |
© 2008 by MDPI (http://www.mdpi.org). Reproduction is permitted for noncommercial purposes.
Share and Cite
Meng, L.-F.; Lu, C.-P.; Li, Y.-W. Hemispheric Lateralization of Event-Related Brain Potentials in Different Processing Phases during Unimanual Finger Movements. Sensors 2008, 8, 2900-2912. https://doi.org/10.3390/s8042900
Meng L-F, Lu C-P, Li Y-W. Hemispheric Lateralization of Event-Related Brain Potentials in Different Processing Phases during Unimanual Finger Movements. Sensors. 2008; 8(4):2900-2912. https://doi.org/10.3390/s8042900
Chicago/Turabian StyleMeng, Ling-Fu, Chiu-Ping Lu, and Yi-Wen Li. 2008. "Hemispheric Lateralization of Event-Related Brain Potentials in Different Processing Phases during Unimanual Finger Movements" Sensors 8, no. 4: 2900-2912. https://doi.org/10.3390/s8042900