An Assessment of the Altimetric Information Derived from Spaceborne SAR (RADARSAT-1, SRTM3) and Optical (ASTER) Data for Cartographic Application in the Amazon Region

Abstract
:1. Introduction
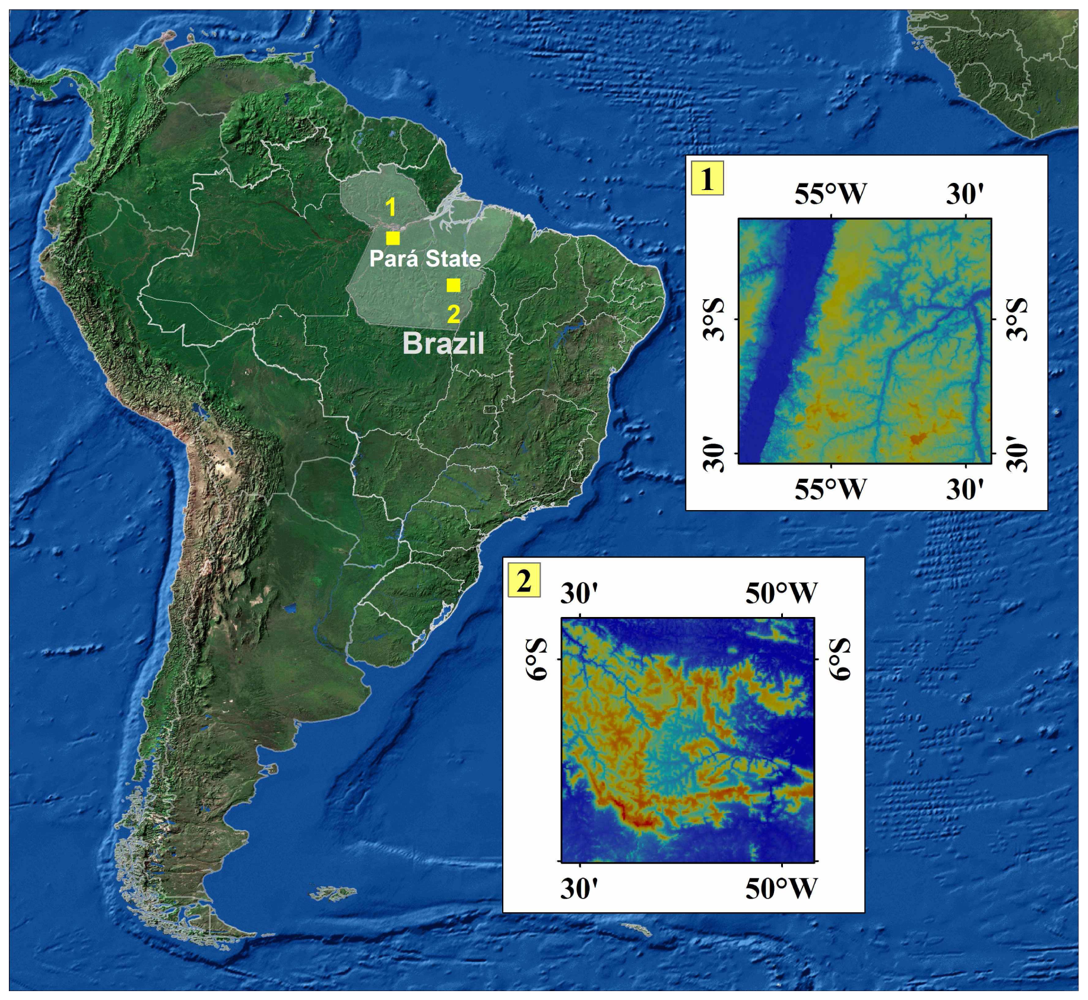
2. Test-sites
3. Characteristics of the data set
4. Methodology
4.1. Generation of stereoscopic DEM
4.2. DGPS Field Measurements
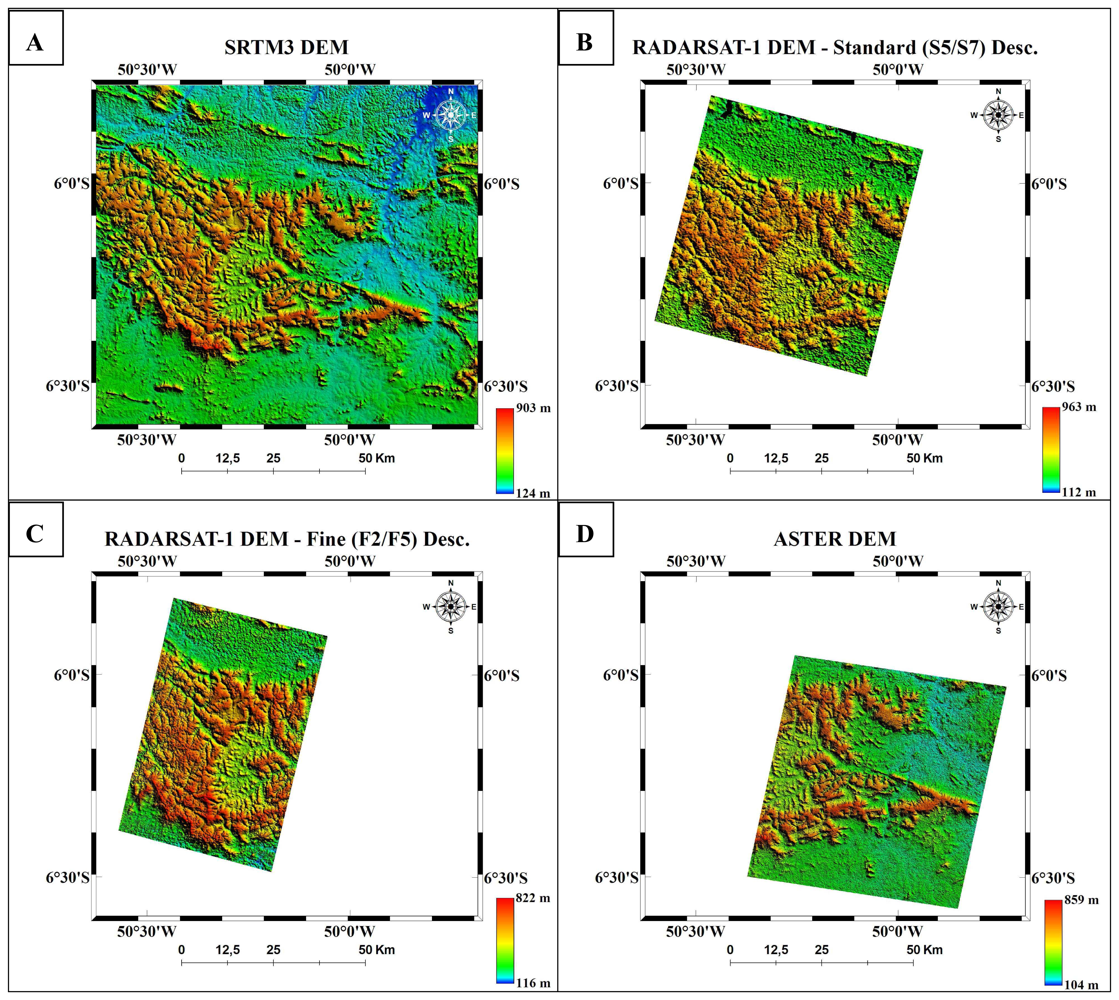
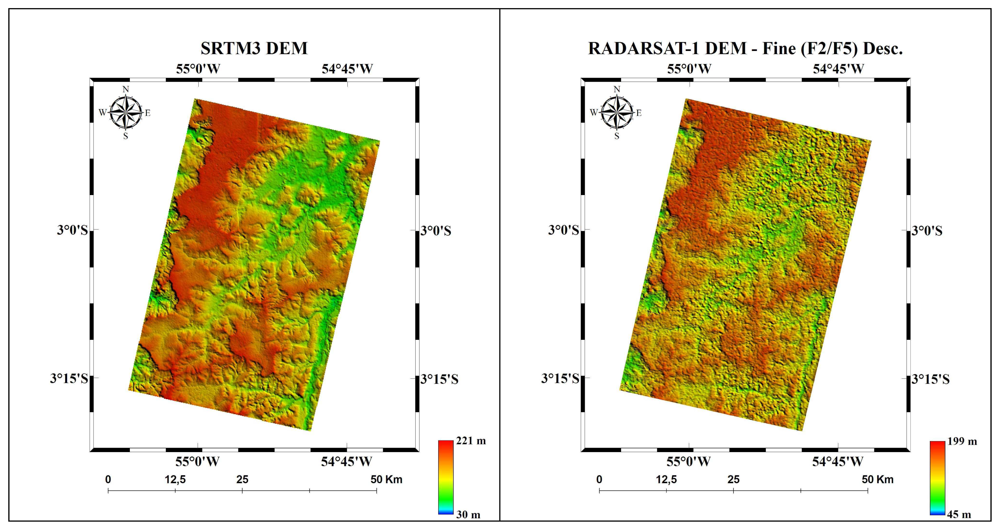
4.3. SRTM DEMs
4.4. Statistical Analysis
4.5. Discussion of the results
5. Conclusions
References and Notes
- IBGE. Mapa Índice Digital-Mapeamento Geral do Brasil, Primeira Edição ed; Brazilian Institute of Geography and Statistics (IBGE): Rio de Janeiro, Brazil, 2001. [Google Scholar]
- Toutin, T. Error Tracking of Radargrammetric DEM from RADARSAT Image. IEEE Transactions on Geoscience and Remote Sensing 1999, 37(5), 2227–2238. [Google Scholar]
- Abrams, M.; Hook, S. ASTER user handbook, Version 2; Pasadena; Jet Propulsion Laboratory/EROS Data Center, USA, 2001. [Google Scholar]
- Toutin, T. 3D Topographic Mapping with ASTER Stereo Data in Rugged Topography. IEEE Transactions on Geoscience and Remote Sensing 2002, 40(10), 2241–2247. [Google Scholar]
- Farr, T.G.; Rosen, P.A.; Caro, E.; Crippen, R.; Duren, R.; Hensley, S.; Kobrick, M.; Paller, M.; Rodriguez, E.; Roth, L.; Seal, D.; Shaffer, S.; Shimada, J.; Umland, J.; Werner, M.; Oskin, M.; Burbank, D.; Alsdorf, D. The Shuttle Radar Topography Mission. Reviews of Geophysics 2007, 45, RG 2004. [Google Scholar] [CrossRef]
- Rodriguez, E.; Morris, C.S.; Belz, J.E.; Chapin, E.C.; Martin, J.M.; Daffer, W.; Hensley, S. An assessment of the SRTM topographic products; 2005; JPL Pub D31639; p. 143 pp. [Google Scholar]
- Jarvis, A.; Rubiano, J.; Nelson, A.; Farrow, A.; Muligan, M. Practical use of SRTM data in the tropics: comparison with digital elevations models generated from cartographic data; CIAT Working Doc 198: Colombia, 2004; p. 35 pp. [Google Scholar]
- Paradella, W.R.; Oliveira, C.G.; Cecarelli, I.C.F.; Cottini, C.P.; Okida, R. Operational Use of RADARSAT-1 Fine Stereoscopy Integrated with TM-Landsat 5 Data for Cartographic Application in the Brazilian Amazon. Canadian Journal of Remote Sensing 2005, 31(2), 139–148. [Google Scholar]
- Sylvander, S.; Cousson, D.; Gigord, P. Etude des performances géométrique des images de RADARSAT. Bulletin de la Société Française de Photogrammétrie et Télédétection 1997, 148, 57–65. [Google Scholar]
- PCI. Geomatica Software Solutions, OrthoEngine Satellite Edition, reference manuals, versions 7.0, 8.2, 9.0; PCI Geomatics Inc., 2003; Canada. [Google Scholar]
- Cheng, P.; Toutin, T.; Stohr, C. Automated DEM Extraction from Aerial Photos or Optical Satellite Images. In Proceedings, Thirteenth International Conference on Applied Geologic Remote Sensing, Vancouver, Canada, 1999, March 1-3; pp. 56–63.
- Camargo, P.O. Relatório do Processamento dos Dados DGPS: Flona Tapajós; Geoambiente SR S/C Ltda, 2003; Brazil, Project 99/06271-7 - PIPE-FAPESP; p. 56 p. [Google Scholar]
- Merchant, D. Spatial Accuracy Specification for Large Scale Topographic Maps. Photogrammetric Engineering and Remote Sensing 1987, 53(7), 958–961. [Google Scholar]
- Galo, M.; Camargo, P.O. O uso do GPS no controle de qualidade de cartas; Congresso Brasileiro de Cadastro Técnico Multifinalitário, Annals, 1994; Florianópolis, Brazil; pp. 41–48. [Google Scholar]
- Carabajal, C.; Harding, D.J. SRTM C-Band and ICESat laser altimetry elevation comparisons as a function of tree cover and relief. Photogrammetric Engineering and Remote Sensing 2006, 72, 287–298. [Google Scholar]
- Toutin, T. RADARSAT-2 stereoscopy and polarimetry for 3D mapping. Canadian Journal of Remote Sensing 2004, 30(3), 496–503. [Google Scholar]


| Site | Carajás | |||
|---|---|---|---|---|
| Beam | Fine 2 (F2) | Fine 5 (F5) | Fine 2 (F2) | Fine 5 (F5) |
| Orbit | Descending | Descending | Ascending | Ascending |
| Date | 07/12/2001 | 15/12/2001 | 13/02/2002 | 20/12/2001 |
| Incidence | 39° - 42° | 45° - 48° | 39° - 42° | 45° - 48° |
| Look Azimuth | 282° | 282° | 78° | 78° |
| Site | Tapajós | |
|---|---|---|
| Beam | Fine 2 (F2) | Fine 5 (F5) |
| Orbit | Descending | Descending |
| Date | 20/09/2000 | 27/09/2000 |
| Incidence | 39° - 42° | 45° - 48° |
| Look Azimuth | 282° | 282° |
| Site | Carajás | ||
|---|---|---|---|
| Beam | Standard 5 (S5) | Standard 7 (S7) | ASTER (VNIR-3) |
| Orbit | Descending | Descending | - |
| Date | 31/05/1996 | 11/09/1996 | 16/08/2001 |
| Incidence | 36° - 42° | 45° - 49° | - |
| Look Azimuth | 282° | 282° | - |
| Product | Number of GCPs | Number of ICPs | RMSE (m) | LE90 (m) |
|---|---|---|---|---|
| F2 Asc. / F5 Asc.* | 13 | 20 | 19.85 | 32.65 |
| S5 Desc. / S7 Desc.* | 17 | 20 | 25.36 | 41.71 |
| F2 Desc. / F5 Desc.* | 20 | 14 | 20.11 | 33.08 |
| F2 Desc. / F5 Desc.** | 19 | 24 | 14.63 | 24.06 |
| ASTER* | 20 | 20 | 10.57 | 17.35 |
| SRTM3* | - | 20 | 12.10 | 19.90 |
| SRTM3** | - | 20 | 12.79 | 21.04 |
| Product | Mean of the Discrepancies (m) | Standard Deviation (m) | t|x| | t(n−1;5%) | χ2(A Class) | χ2(n−1; 10%) |
|---|---|---|---|---|---|---|
| F2 Asc. / F5 Aasc.* | 17.23 | 20.37 | 3.783 | 1.729 | 28.387 | 27.204 |
| S5 Desc. / S7 Desc.* | 20.88 | 26.02 | 3.589 | 1.729 | 46.310 | 27.204 |
| F2 Desc. / F5 Desc.* | − 7.56 | 18.52 | 1.527 | 1.771 | 16.050 | 19.812 |
| F2 Desc. / F5 Desc.** | 4.72 | 13.81 | 1.675 | 1.714 | 15.793 | 32.007 |
| ASTER* | −0.49 | 10.56 | 0.209 | 1.729 | 7.623 | 27.204 |
| SRTM3* | 10.06 | 6.31 | 7.130 | 1.729 | 2.726 | 27.204 |
| SRTM3** | 9.45 | 8.34 | 5.065 | 1.729 | 4.763 | 27.204 |
© 2008 by the authors; licensee Molecular Diversity Preservation International, Basel, Switzerland. This article is an open-access article distributed under the terms and conditions of the Creative Commons Attribution license ( http://creativecommons.org/licenses/by/3.0/).
Share and Cite
De Oliveira, C.G.; Paradella, W.R. An Assessment of the Altimetric Information Derived from Spaceborne SAR (RADARSAT-1, SRTM3) and Optical (ASTER) Data for Cartographic Application in the Amazon Region. Sensors 2008, 8, 3819-3829. https://doi.org/10.3390/s8063819
De Oliveira CG, Paradella WR. An Assessment of the Altimetric Information Derived from Spaceborne SAR (RADARSAT-1, SRTM3) and Optical (ASTER) Data for Cartographic Application in the Amazon Region. Sensors. 2008; 8(6):3819-3829. https://doi.org/10.3390/s8063819
Chicago/Turabian StyleDe Oliveira, Cleber Gonzales, and Waldir Renato Paradella. 2008. "An Assessment of the Altimetric Information Derived from Spaceborne SAR (RADARSAT-1, SRTM3) and Optical (ASTER) Data for Cartographic Application in the Amazon Region" Sensors 8, no. 6: 3819-3829. https://doi.org/10.3390/s8063819