Integrated Evaluation of Urban Development Suitability Based on Remote Sensing and GIS Techniques – A Case Study in Jingjinji Area, China


Abstract
:1. Introduction
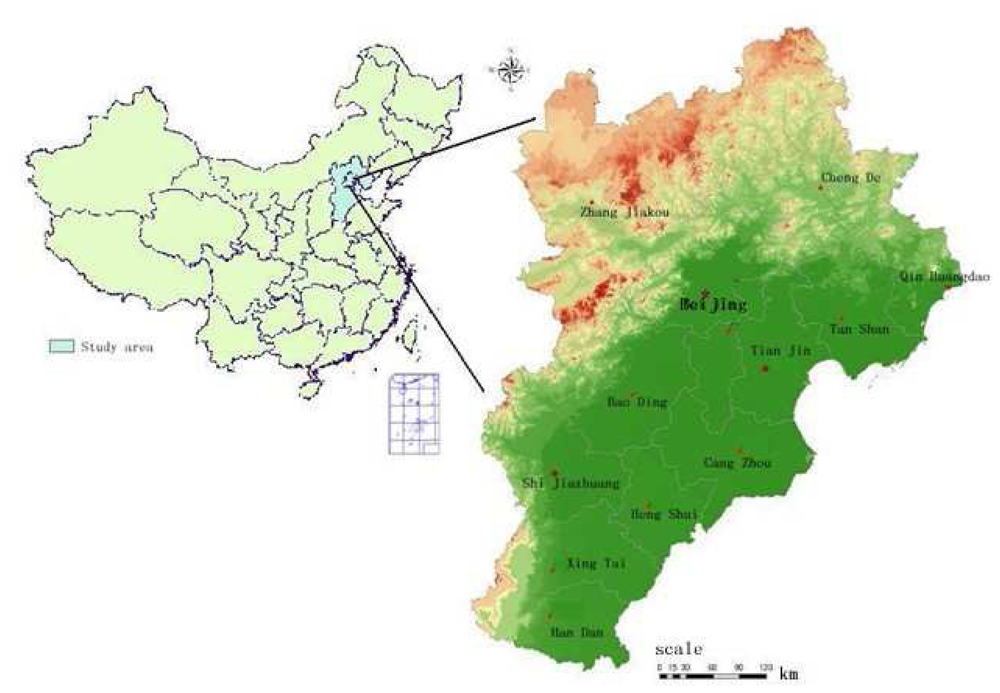
2. Study area
3. Methodology
3.1 Evaluation mechanism and factors selection
3.2 Data acquisition
- 1)
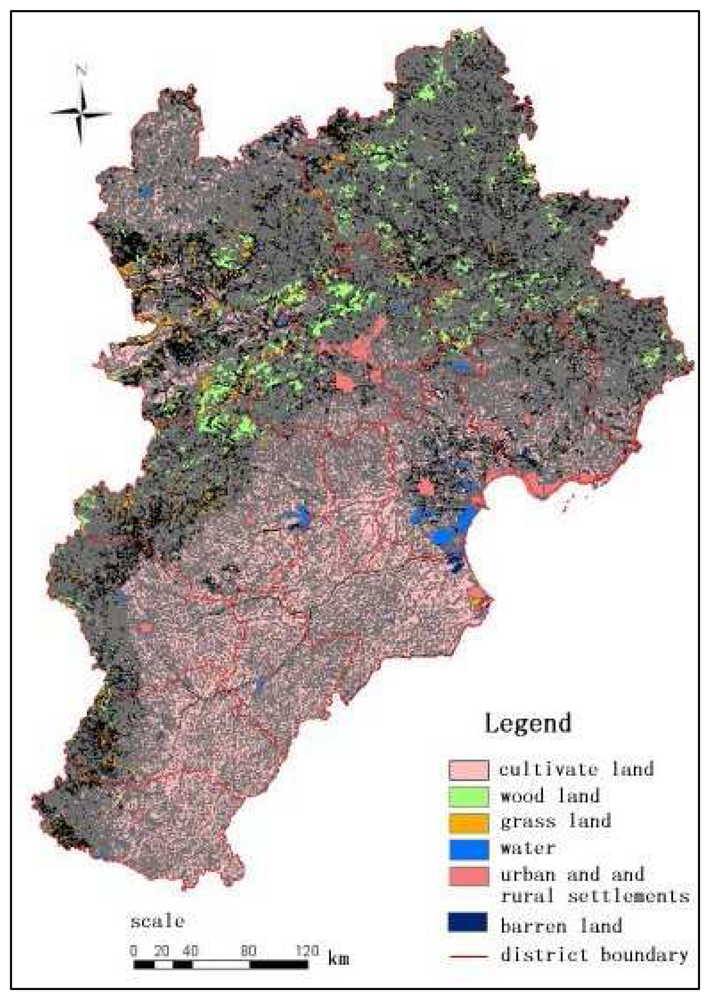
- Land use data: Land use data are the most fundamental data of the evaluation model for urban development suitability and their can be derived from remote sensing images. Land use data for 2005 were obtained from Landsat TM data through human-computer interactive interpretation. Six land use types were identified including: (1) cultivated land; (2) woodland; (3) grassland; (4) water; (5) urban and rural settlements; (6) barren land. A set of ground data from field surveys were selected and used to guarantee the land use classification on accuracy (Figure 2). Meanwhile, the ‘river density’ data, which refers to the length of the river per unit area within certain statistical unit, were derived from the land use data.
- 2)
- DEM data (including elevation and slope), geomorphological types data and transportation data were supplied by State Bureau of Surveying and Cartography (SBSC)
- 3)
- Meteorological data, including annual average precipitation data, accumulated air temperature data and wetness index data, were derived from National Resources and Environmental Database presented by Resources and Environmental Scientific Data Center (RESDC), Chinese Academy of Sciences (CAS). The accumulated air temperature refers to the annual daily mean air temperature above 0°C. Wetness index is defined as actual evapotranspiration dividing by potential evapotranspiration, which were calculated from meteorological data annually.
- 4)
- Population data: 100 m × 100m grid population data were presented by RESDC, CAS. These gridded population data were transformed from census data based on the spatialization model [19].
- 5)
- Railway density and road density data were also presented by RESDC, CAS. Road density is calculated by summing the length of roads of different classes and dividing by the area of 100 m grid cell statistical unit. Two road classes were selected for calculating: national roads and highways.
3.3 Establishment of the evaluation model
- 1)
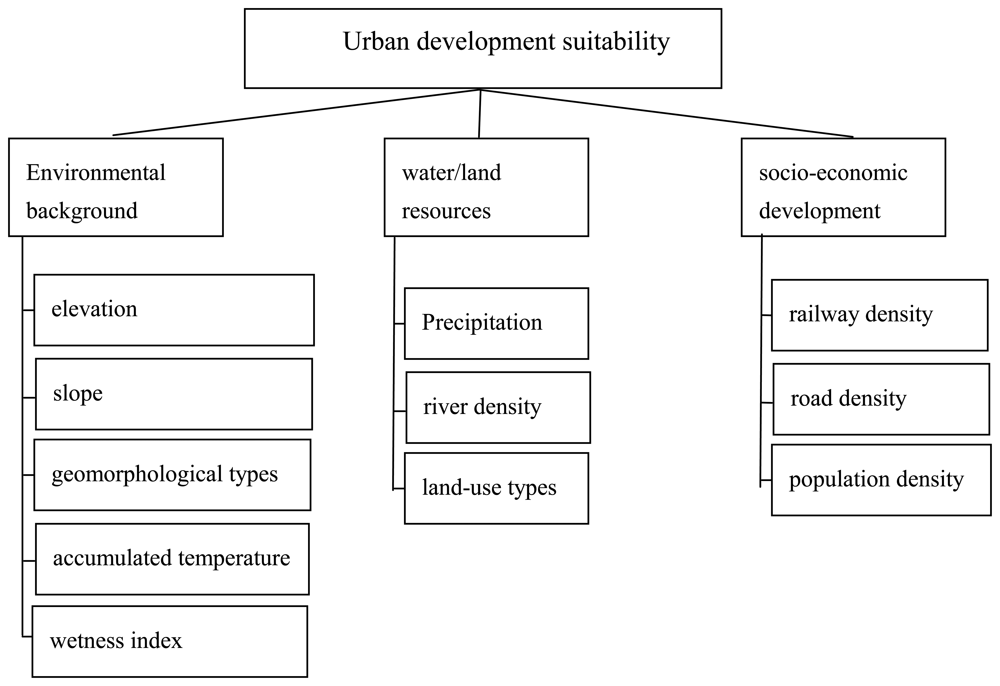
- Establish a criteria system for urban development suitability evaluation (as mentioned in section 3.1) and arrange these parameters in a hierarchical order (Figure 3).
- 2)
- Conduct the pair-wise comparison procedure and establish the weighting matrix. The relative importances of the selected parameters were achieved by consulting and surveying the opinions of 15 experts in the Jingjinji area. The results of this procedure are shown in Table 3.
- 3)
- Standardize the values of the parameters. Transform the original values of the parameters into relative scores. The standards for transformation are shown in Table 4.

4. Results and analysis
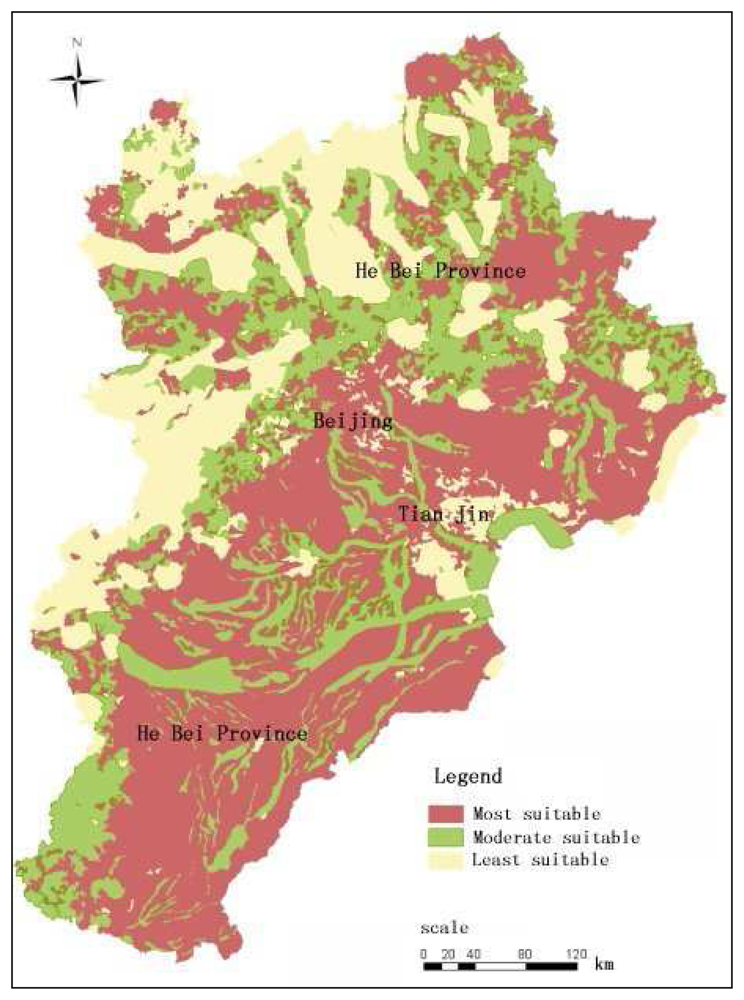
4.1 Evaluation of suitability for urban development in Jingjinji area
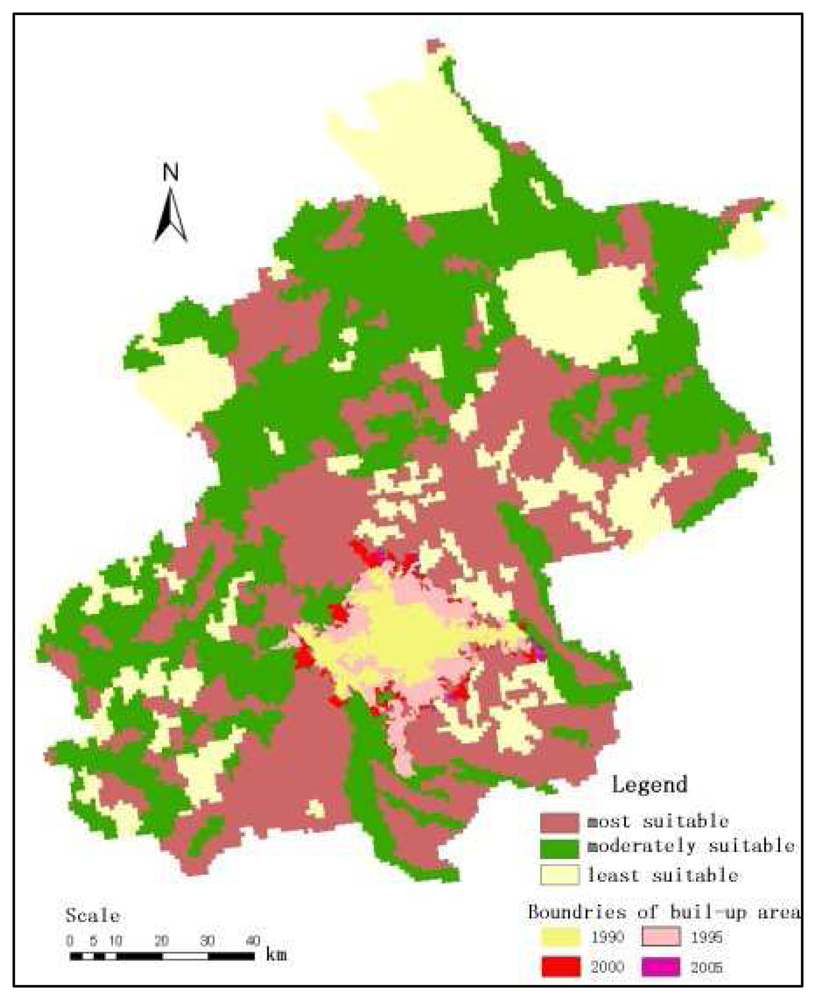
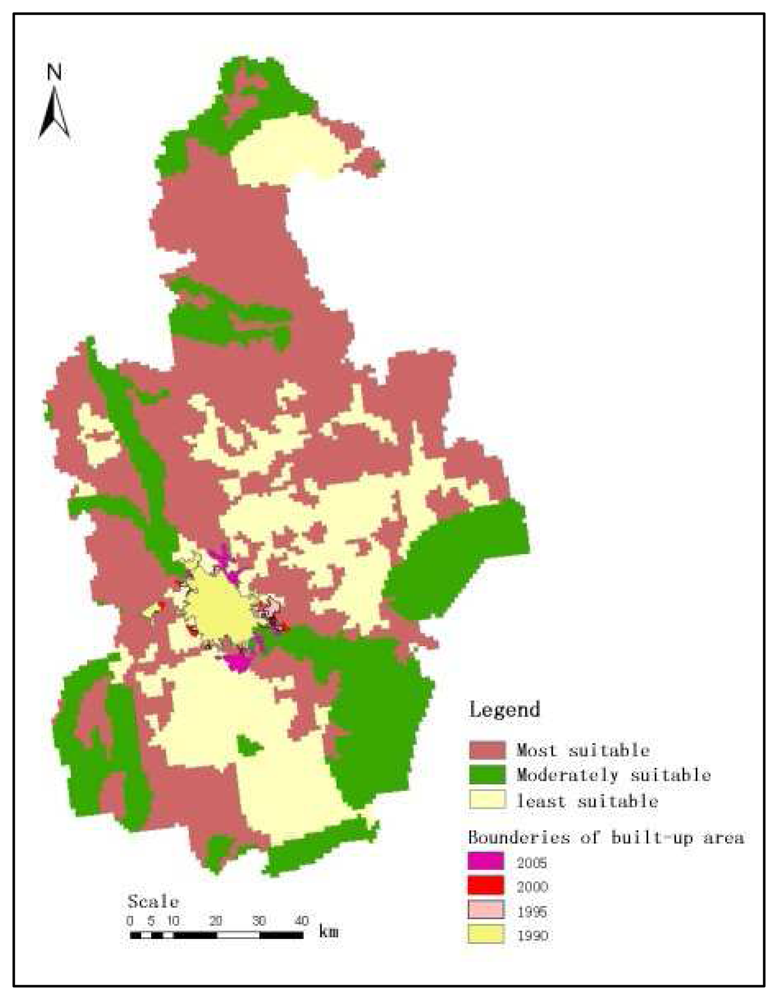
4.2 Combination analysis of urban growth tendency and USDI map in Jingjinji area
5. Conclusions
Supplementary Material
sensors-08-05975-s001.pdfAcknowledgments
References
- Long, H.; Wu, X.; Wang, W.; Dong, G. Analysis of Urban-rural Land-use Change during 1995–2006 and Its Policy Dimensional Driving Forces in Chongqing, China. Sensors 2008, 8, 681–699. [Google Scholar]
- Weng, Q. A Remote Sensing-GIS Evaluation of Urban Expansion and Its Impact on Surface Temperature in the Zhujiang Delta, China. Int. J. Remote Sens. 2001, 22, 1999–2014. [Google Scholar]
- Liu, J.Y.; Zhan, J.Y.; Deng, X.Z. Spatio-temporal Patterns and Driving Forces of urban land expansion in China during the economic reform era. Ambio 2005, 34, 450–455. [Google Scholar]
- Weng, Q. Land use change analysis in the Zhujiang Delta of China using satellite remote sensing, GIS and stochastic modelling. J. Environ. Manage. 2002, 64, 273–284. [Google Scholar]
- Liu, J.Y.; Liu, M.L.; Zhuang, D.F.; Zhang, Z.X.; Deng, X.Z. Study on Spatial Pattern of Land-use Change in China During 1995-2000. Sci. China (Ser.D) 2003, 46, 373–378. [Google Scholar]
- Deng, X.Z.; Huang, J.K.; Rozelle, S.; Uchida, E. Growth, population and industrialization, and urban land expansion of China. J. Urban Econ. 2008, 63, 96–115. [Google Scholar]
- Xie, Y.C.; Fang, C.L.; Lin, G.C.S.; Gong, H.M.; Qiao, B. Tempo-spatial Patterns of Land Use Changes and Urban Development in Globalizing China: a Study of Beijing. Sensors 2007, 7, 2881–2906. [Google Scholar]
- Tan, M.H.; Li, X.B.; Xie, H.; Lu, C.H. Urban land expansion and arable land loss in China-a case study of Beijing–Tianjin–Hebei region. Land Use Policy 2005, 22, 187–196. [Google Scholar]
- Liu, Y.; Lv, X.; Qin, X.; Guo, H.; Yu, Y.; Wang, J.; Mao, G. An Integrated GIS-based Analysis System for Land-use Management of Lake Areas in Urban Fringe. Landscape Urban Plan. 2007, 82, 233–246. [Google Scholar]
- Dai, F.C.; Lee, C.F.; Zhang, X.H. GIS-based Geo-environmental Evaluation for Urban Land-use Planning: A Case Study. Eng. Geol. 2001, 61, 257–271. [Google Scholar]
- Collins, M.G.; Steiner, F.R.; Rushman, M.J. Land-use Suitability Analysis in the United States: Historical Development and Promising Technological Achievements. Environ. Manag. 2001, 28(5), 611–621. [Google Scholar]
- Aly, M.H.; Giardino, J.R.; Klein, A.G. Suitability Assessment for New Minia City, Egypt: A GIS Approach to Engineering Geology. Environ. Eng. Geosci. 2005, 3, 259–269. [Google Scholar]
- Mohammad, A.M.; Mohammad, M.A. Integrating GIS and AHP for Land Suitability Analysis for Urban Development in a Secondary City of Bangladesh. J. Alam Bina 2006, 8, 1–19. [Google Scholar]
- Li, A.; Wang, A.; Liang, S.; Zhou, W. Eco-environmental Vulnerability Evaluation in Mountainous Region Using Remote Sensing and GIS-A Case Study in the Upper Reaches of Minjiang River, China. Ecol. Model. 2006, 192, 175–187. [Google Scholar]
- Beijing Statistical Bureau. Beijing Statistical Yearbook; Chinese Statistical Publishing House: Beijing, 2006. [Google Scholar]
- Tian Jin Statistical Bureau. Tian Jin Statistical Yearbook; Chinese Statistical Publishing House: Beijing, 2006. [Google Scholar]
- He Bei Statistical Bureau. He Bei Statistical Yearbook; Chinese Statistical Publishing House: Beijing, 2006. [Google Scholar]
- Wu, L.C. Gradation and Classification on Urban land.; China University of Mining and Technology Press: Xu Zhou, 2003. [Google Scholar]
- Dong, J. Study on the Progress of Spatialization of Anthrop Factors. J. Gansu Sci. 2007, 19, 91–94. [Google Scholar]
- Verburg, P.H.; Veldkamp, A.; Fresco, L.O. Simulation of changes in the spatial pattern of land use in China. Appl. Geogr. 1999, 19, 211–233. [Google Scholar]
- Saaty, T.L. Decision Making with AHP: Why is the Principle Eigenvector Necessary. Eur. J. Oper. Res. 2003, 145, 85–91. [Google Scholar]


| Region | Area(km2) | Area of built-up land (km2, 2005) | Population (million capita, 2005) | GDP (billion RMB,2005) |
|---|---|---|---|---|
| Beijing | 16300 | 940.96 | 15.56 | 6814.5 |
| Tianjin | 11700 | 341.65 | 10.36 | 3663.86 |
| He Bei | 185600 | 1073.97 | 68.49 | 10116.6 |
| Jingjinji area | 213600 | 2356.58 | 94.40 | 20594.96 |
| Factors | Parameters | Scale | Data sources |
|---|---|---|---|
| 1 Environmental background | 1.1 elevation | 1:500,000 | SBSC |
| 1.2 slope | 1:500,000 | SBSC | |
| 1.3 geomorphological types | 1:250,000 | SBSC | |
| 1.4 accumulated temperature (> 0°C) | 1:100,000 | RESDC | |
| 1.5 wetness index | 1:100,000 | RESDC | |
| 2 Water/land resources | 2.1 Precipitation | 1:100,000 | RESDC |
| 2.2 river density | 1:100,000 | RESDC | |
| 2.3 land use | 1:100,000 | Derived from Landsat TM images | |
| 3 Socio-economic development | 3.1 railway density | 1:100,000 | SBSC |
| 3.2 road density | 1:100,000 | SBSC | |
| 3.3 population density | 100m | RESDC |
| Factors | Weight | Parameters | Weight |
|---|---|---|---|
| 1. Environmental background | 0.10 | 1.1 elevation | 0.25 |
| 1.2 Slope | 0.07 | ||
| 1.3 geomorphological types | 0.36 | ||
| 1.4 accumulated temperature (> 0 °C) | 0.11 | ||
| 1.5 wetness index | 0.21 | ||
| 2. Water/land resources | 0.37 | 2.1 precipitation | 0.22 |
| 2.2 river density | 0.11 | ||
| 2.3 land-use types | 0.67 | ||
| 3. Socio-economic development | 0.53 | 3.1 railway density | 0.25 |
| 3.2 road density | 0.13 | ||
| 3.3 population density | 0.62 |
| Factors | Parameters | Standardized relative rates | ||
|---|---|---|---|---|
| 1 | 3 | 5 | ||
| 1 Environmental background | 1.1 elevation | >4,000m | 2,000-4,000m | <2,000m |
| 1.2 Slope | >15 degree | 5-15 degree | <5 degree | |
| 1.3 geomorphological types | abrupt mountain, sand hill | mountain, altiplano, mesa | hill, plain and all other types | |
| 1.4 accumulated temperature (> 0 °C) | <500°C | 500-1500°C | > 1500°C | |
| 1.5 wetness index | >30% | 10%-30% | <10% | |
| 2 water/land resources | 2.1 Precipitation | <50 mm | 50∼200 mm | >200 mm |
| 2.2 river density | <10 | 10∼100 | >100 | |
| 2.3 land-use types | barren land, water | woodland, grass land | cultivate land, urban and rural settlements | |
| 3 socio-economic development | 3.1 railway density | 0 | 1-30 | >31 |
| 3.2 density | 0 | 1-50 | >51 | |
| 3.3 population density | 0 | 1-100 | >101 | |
| Region | City | Built-up area (1990) | Built-up area (1995) | Built-up area (2000) | Built-up area (2005) | Average annual rate |
|---|---|---|---|---|---|---|
| Beijing | Beijing | 397.98 | 812.78 | 912.36 | 937.97 | 36.00 |
| Tianjin | Tianjin | 241.71 | 257.34 | 283.38 | 341.65 | 6.66 |
| He Bei province | Tang Shan | 86.36 | 97.91 | 114.4 | 118.11 | 2.12 |
| Qin Huangdao | 47.5 | 56.58 | 64.34 | 79.59 | 2.14 | |
| Lang Fang | 19.3 | 44.12 | 46.74 | 49.09 | 1.99 | |
| Shi Jiazhuang | 86.32 | 130.8 | 150.03 | 162.69 | 5.09 | |
| Bao Ding | 44.25 | 66.43 | 77.26 | 78.39 | 2.28 | |
| Cang Zhou | 33.37 | 43.35 | 52.03 | 55.43 | 1.47 | |
| Zhang Jiakou | 28.12 | 34 | 35.09 | 39.16 | 0.74 | |
| Chen De | 14.18 | 15.47 | 17.97 | 19.05 | 0.32 | |
| Xin Tai | 31.53 | 34.6 | 41.18 | 44.03 | 0.83 | |
| Han Dan | 47.93 | 52.66 | 60.45 | 101.18 | 3.55 | |
| Heng Shui | 18.47 | 21.31 | 34.06 | 41.08 | 1.51 | |
| Total province | 457.33 | 597.23 | 693.55 | 787.8 | 2.00 | |
| Jingjinji area | 1,097.02 | 1,667.35 | 1,889.29 | 2,067.42 | 4.98 |
| Sub-region | Most suitable (%) | Moderately suitable (%) | Least suitable (%) | Most suitable (without cropland, %) | Built-up areas in 2005 (%) |
|---|---|---|---|---|---|
| Beijing | 20.65 | 39.10 | 40.26 | 6.73 | 5.75 |
| Tianjin | 25.77 | 25.77 | 48.46 | 2.96 | 2.84 |
| He Bei province | 22.56 | 30.13 | 47.31 | 9.51 | 0.57 |
© 2008 by the authors; licensee Molecular Diversity Preservation International, Basel, Switzerland. This article is an open-access article distributed under the terms and conditions of the Creative Commons Attribution license (http://creativecommons.org/licenses/by/3.0/).
Share and Cite
Dong, J.; Zhuang, D.; Xu, X.; Ying, L. Integrated Evaluation of Urban Development Suitability Based on Remote Sensing and GIS Techniques – A Case Study in Jingjinji Area, China. Sensors 2008, 8, 5975-5986. https://doi.org/10.3390/s8095975
Dong J, Zhuang D, Xu X, Ying L. Integrated Evaluation of Urban Development Suitability Based on Remote Sensing and GIS Techniques – A Case Study in Jingjinji Area, China. Sensors. 2008; 8(9):5975-5986. https://doi.org/10.3390/s8095975
Chicago/Turabian StyleDong, Jiang, Dafang Zhuang, Xinliang Xu, and Lei Ying. 2008. "Integrated Evaluation of Urban Development Suitability Based on Remote Sensing and GIS Techniques – A Case Study in Jingjinji Area, China" Sensors 8, no. 9: 5975-5986. https://doi.org/10.3390/s8095975