Article

Resistive Oxygen Sensor Using Ceria-Zirconia Sensor Material and Ceria-Yttria Temperature Compensating Material for Lean-Burn Engine

National Institute of Advanced Industrial Science and Technology (AIST), Advanced Manufacturing Research Institute, 2266-98 Anagahora, Shimo-Shidami, Moriyama-ku, Nagoya 463-8560, Japan
*
Author to whom correspondence should be addressed.
Sensors 2009, 9(11), 8884-8895; https://doi.org/10.3390/s91108884
Submission received: 14 September 2009 / Revised: 13 October 2009 / Accepted: 2 November 2009 / Published: 5 November 2009
(This article belongs to the Section Chemical Sensors)

Abstract

:
Temperature compensating materials were investigated for a resistive oxygen sensor using Ce0.9Zr0.1O2 as a sensor material for lean-burn engines. The temperature dependence of a temperature compensating material should be the same as the sensor material; therefore, the Y concentration in CeO2-Y2O3 was optimized. The resistance of Ce0.5Y0.5O2-δ was independent of the air-to-fuel ratio (oxygen partial pressure), so that it was confirmed to function as a temperature compensating material. Sensor elements comprised of Ce0.9Zr0.1O2 and Ce0.5Y0.5O2-δ were fabricated and the output was determined to be approximately independent of the temperature in the wide range from 773 to 1,073 K.

Graphical Abstract

1. Introduction

Resistive oxygen sensors have recently attracted much attention due to their simple structure [1-5]. We have studied resistive oxygen sensors using cerium oxide as a sensor material [6-10], which has advantageous features such as durability against corrosive gases in vehicle exhaust [11-13]. The response time of a sensor using a cerium oxide thick film was improved by reducing the particle size from 2,000 to 100 nm in the thick film [14]. However, resistive oxygen sensors using n-type oxide semiconductors not only have resistance that is dependent on oxygen partial pressure, but also on temperature, and a large temperature dependence is a problem for a sensor. Generally, temperature compensating materials are used with a sensor material to solve such a problem [15-22]. Solid electrolytes have been previously suggested for use as temperature compensating materials [8,23].
A temperature compensating material was reported for lambda sensors [24], which can detect fuel-rich or fuel-lean air-to-fuel ratios for improvement of the conversion ratio of three-way catalysts. This report [24] suggested that yttria-doped zirconia should be used as a temperature compensating material for lambda sensors using a ceria-zirconia thick film as a sensor material.
For improvement in the mileage of vehicles, lean-burn engines have been proposed and recently commercialized [5]. We previously reported [23] the possibility of applying temperature compensating materials for lean-burn engines. In this report, we have made a detailed investigation of temperature compensating materials used for resistive oxygen sensors of Ce0.9Zr0.1O2 (CeZr10), which have a fast response and low resistance [14], in a lean-burn engine. First, temperature compensating materials suitable for CeZr10 were considered. The temperature dependence of the resistance for CeZr10 is large, as described in detail in Section 3, so that a solid electrolyte with a large temperature dependence of resistance is required. In the case of lean-burn, ceria system solid electrolytes are suitable, due to the high oxygen partial pressure, although this system has large electronic conductivity in low oxygen partial pressure [25]. Because the sensor material is also a ceria system, ceria solid electrolytes are used as the temperature compensating material for the oxygen sensor in a lean-burn engine. The temperature dependence of the resistance for yttria-doped ceria is larger than that for ceria doped with Sm, La, or Ca [26]. It was reported that the temperature dependence of resistance increased with increasing Y concentration in the CeO2-Y2O3 system [21]. Therefore, the Y concentration was optimized to obtain a suitable temperature compensating material for CeZr10. Furthermore, sensor elements comprising the sensor and temperature compensating materials were fabricated and the temperature dependent output of the sensor element was investigated.

2. Experimental

2.1. Sample preparation

2.1.1. Ceria-yttria powders

Solutions of Ce(NO3)3·6H2O and Y(NO3)3·6.2H2O were prepared using distilled water and stirred for several minutes. The concentrations of Ce3+ or Y3+ ([Ce3+] or [Y4+]) were 0.1 mol/dm3. The Ce(NO3)3 and Y(NO3)3 solutions were then mixed in ratios of [Y3+]/([Y3+]+[Ce3+]) = 0.20, 0.30, 0.40, 0.50, 0.60 and 0.70, which were denoted as CeY20, CeY30, CeY40, CeY50, CeY60, and CeY70, respectively. The mixed solution was mixed with aqueous ammonia and the resulting precipitate was then filtrated to obtain a white gel. The white gel was mixed with commercially available carbon powder using a hybrid mixer (Keyence Corporation, HM-500). The mixture was dried at 343 K in air for several hours and then calcined at 1,173 K to obtain a fine yttria-doped ceria powder.

2.1.2. Ceria-zirconia powder

Zirconia-doped ceria powder with [Zr4+]/([Zr4+] + [Ce3+]) = 0.10 (CeZr10) was prepared using the same method as that for the CeY20-CeY50 powders using ZrO(NO3)2 solution instead of Y(NO3)3 solution.

2.1.3. Thick films

A paste was first prepared by mixing the fine yttria-doped ceria or zirconia-doped ceria powder with an organic binder that included terpineol and ethyl cellulose. The paste was screen-printed on Al2O3 substrates. The screen printed thick films were calcined at 773 K for 5 h in air, and then sintered at 1,373 K. The thicknesses of the thick films were in the range from 6 to 8 μm.

2.1.4. Electrodes

Pt was used as the electrode material. The Pt electrodes had an interdigital structure. Three different electrode patterns were used in this study, the details of which are described in other sections.

2.2. Evaluation

The thick films were characterized using X-ray diffraction, (XRD; Cu Kα radiation, (RINT2100V/PC, Rigaku Corporation) and scanning electron microscopy, (SEM; JSM-6335F, Jeol).
For optimization of the Y concentration in the CeO2-Y2O3 system, the following experiment was carried out: sensor elements using the electrode patterns reported in [23] were placed in a furnace and heated in the range from 773 to 973 K. The resistance of the thick film was measured in a flow of 18.1%O2 in N2 or 0.20%O2 in N2. The activation energy of resistance, i.e., the temperature dependence of resistance, was calculated from an Arrhenius plot of reciprocal temperature versus the logarithm of resistance.
An apparatus for evaluation of the sensors in a model exhaust gas was used to obtain the resistance of the sensor material or the temperature compensating material, or the output of the sensor elements. The details of the apparatus are as follows:
The gas obtained after combustion of a gas mixture of propane, oxygen, and nitrogen over a combustion catalyst was used as the model gas to simulate exhaust gas. The resistance of the thick films and the output of the sensors were measured in the model gas. The details of the experimental method have been reported in [27].
Excess oxygen factor λ was defined as follows:
λ = { C ( O 2 ) / C ( C 3 H 8 ) } { C ( O 2 ) / C ( C 3 H 8 ) } stoich ,
where C(O2) and C(C3H8) are the concentrations of oxygen and propane, respectively, and {C(O2)/C(C3H8)}stoich is the stoichiometric ratio. The general excess air factor λair is described as follows:
λ air = { w ( air ) / w ( fuel ) } { w ( air ) / w ( fuel ) } stoich
where w(air) and w(fuel) are the weight of air and fuel, respectively, and {w(air)/w(fuel)}stoich is the stoichiometric air-to-fuel ratio. Therefore, if the value of λ is the same as that of λair, the oxygen partial pressures are significantly different. In the case of the same oxygen partial pressure, the relationship between λ and λair is expressed as:
λ air 0.15 × λ + 0.87 ( 1.1 λ 1.6 )
Thus, it was concluded that the results in this study were measured near λair = 1.
The oxygen partial pressure was measured by a zirconia sensor maintained at 1,008 K as a standard, i.e., the temperature of the measured gas was 1,008 K. The oxygen partial pressure changed sharply at λ = 1. The oxygen partial pressures at λ > 1 and λ < 1 were high and low, respectively. The regions of λ > 1 and λ < 1 are referred to as lean and rich, respectively.
The electrical circuit for the sensor element using the temperature compensating material is shown in Figure 1. A power source with a constant voltage of 1 V was connected in series to the sensor material and the temperature compensating material, and the voltage difference of the sensor material (voltage between electrodes AB) was measured as the output of the sensor element using the temperature compensating material.

3. Results and Discussion

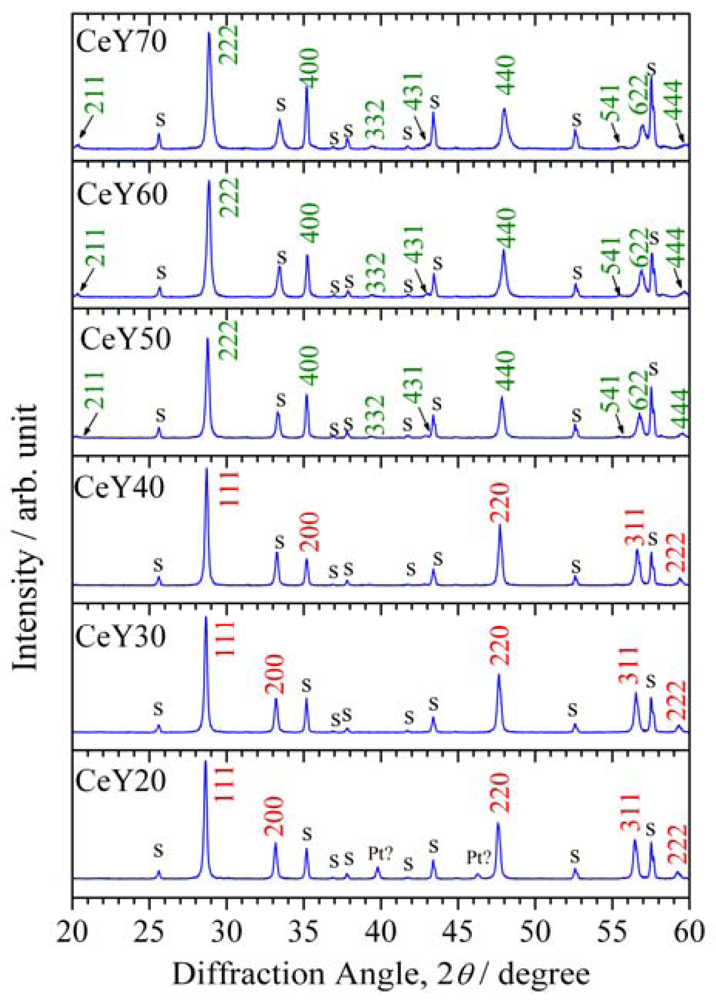
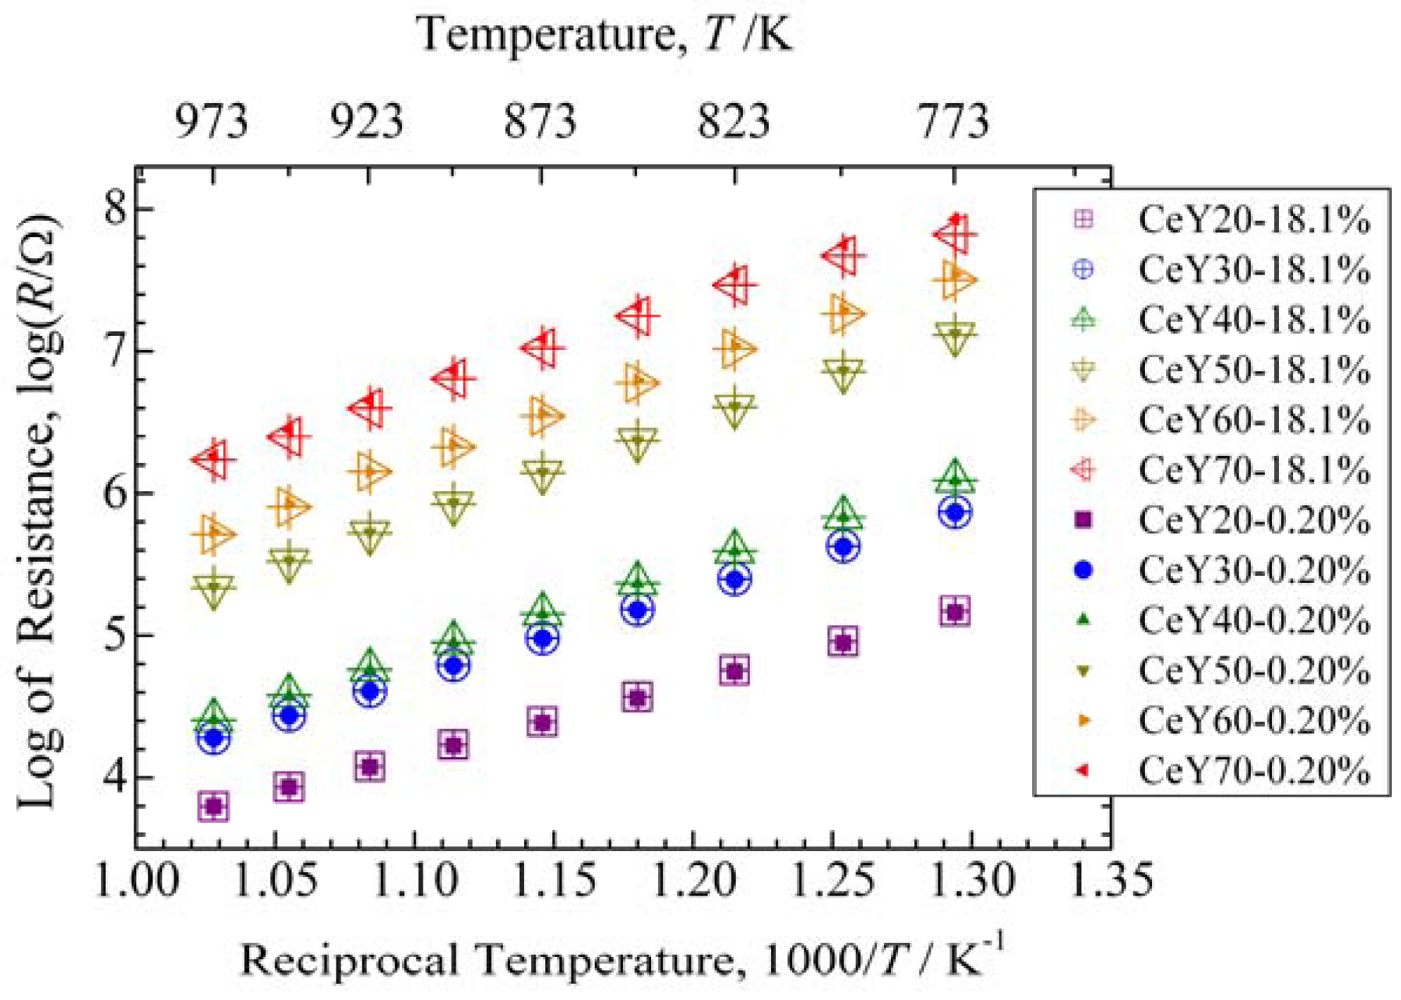
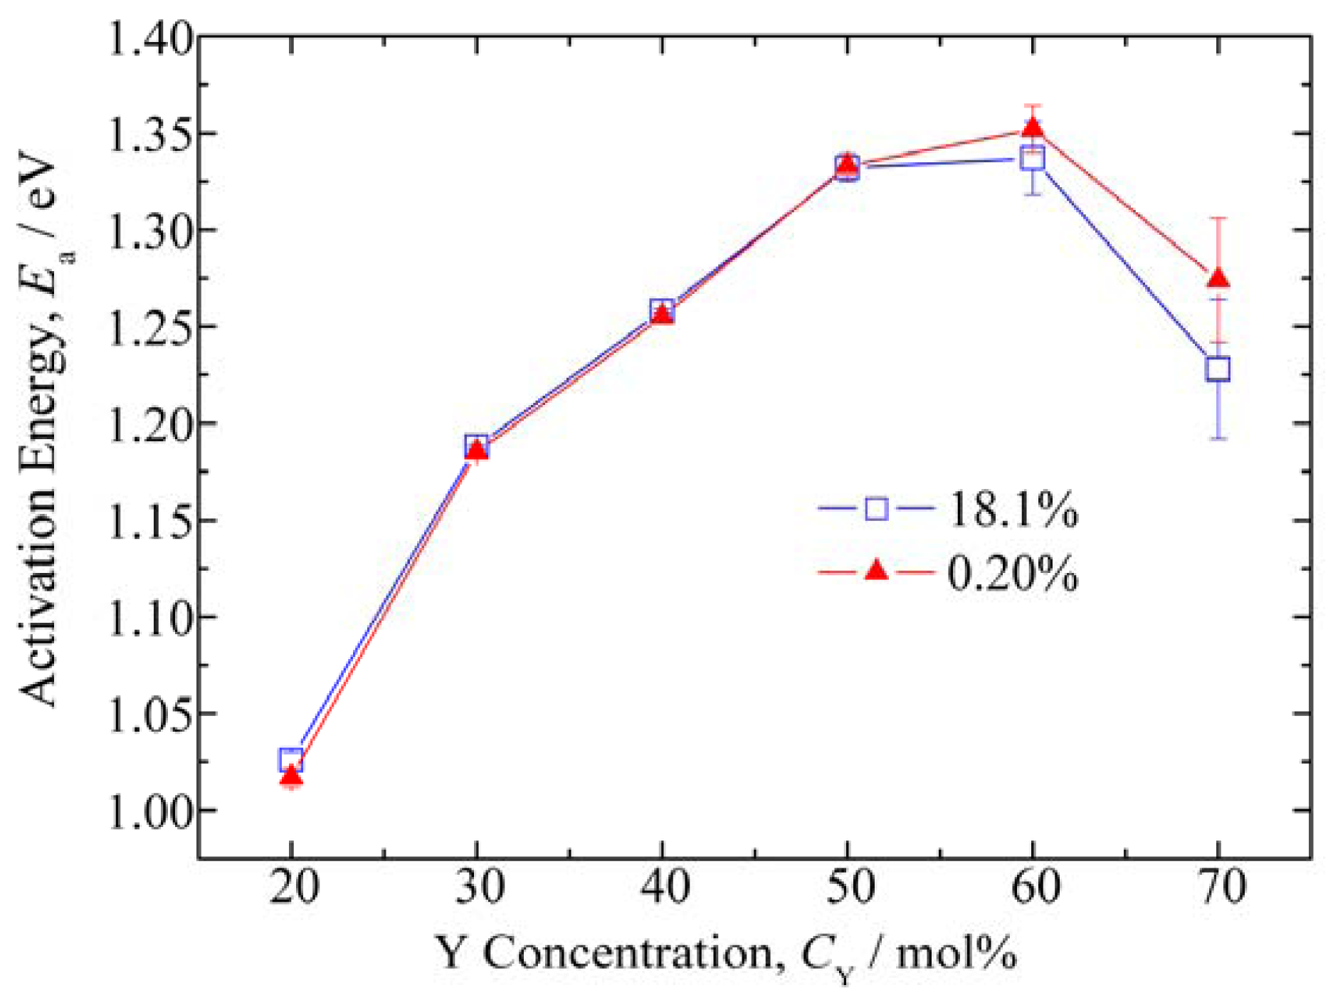
3.1. Optimization of Y concentration
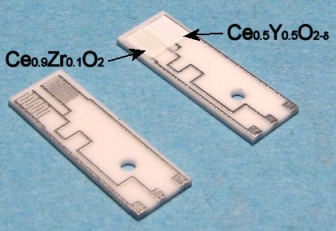
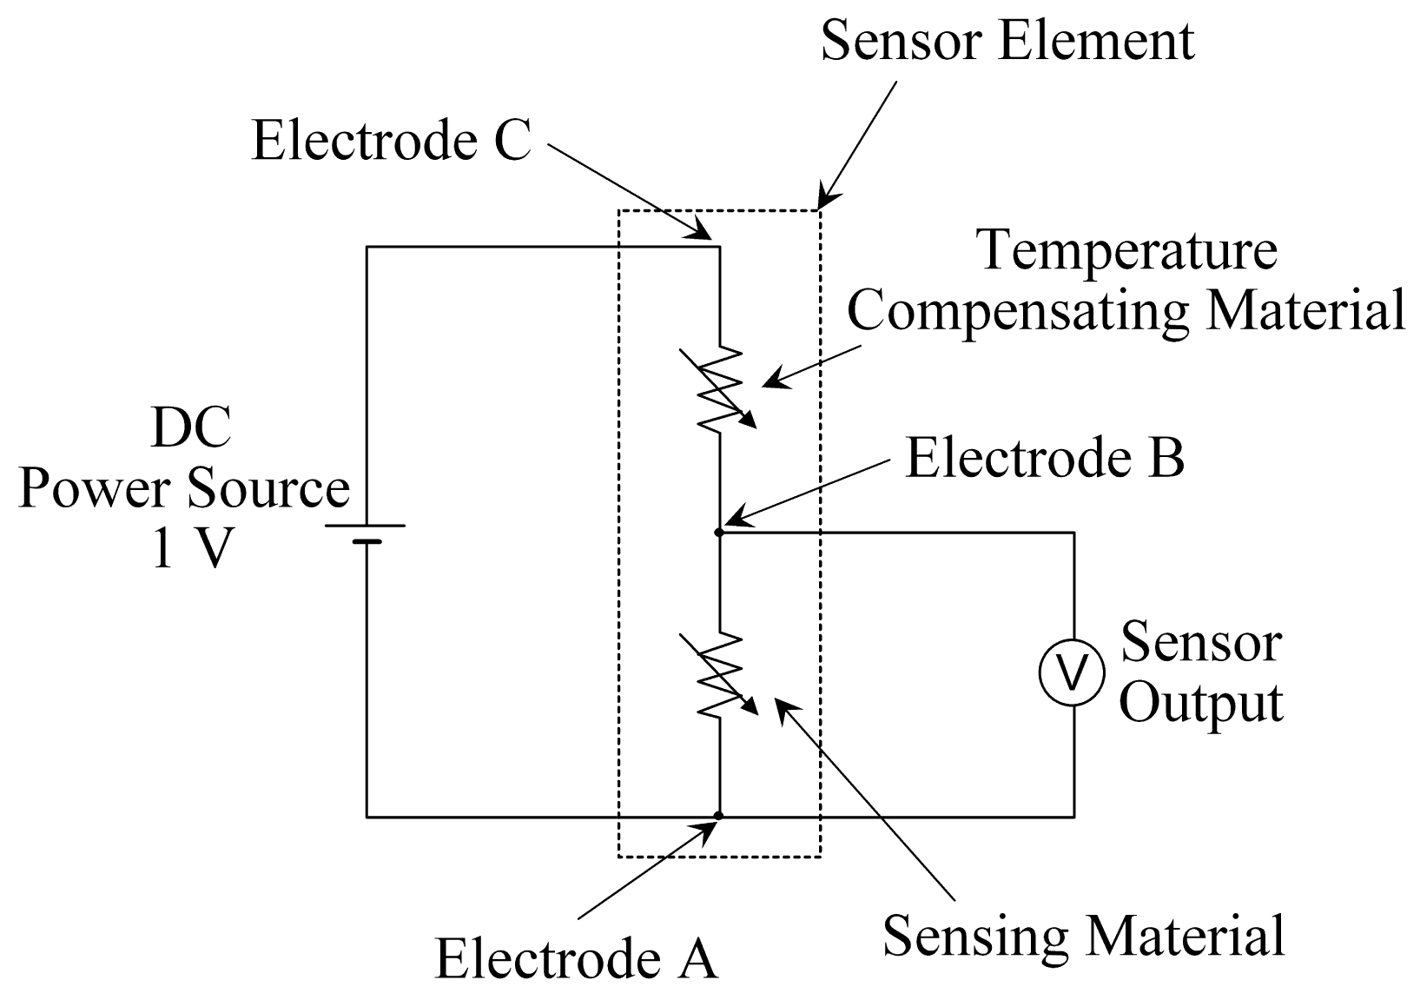
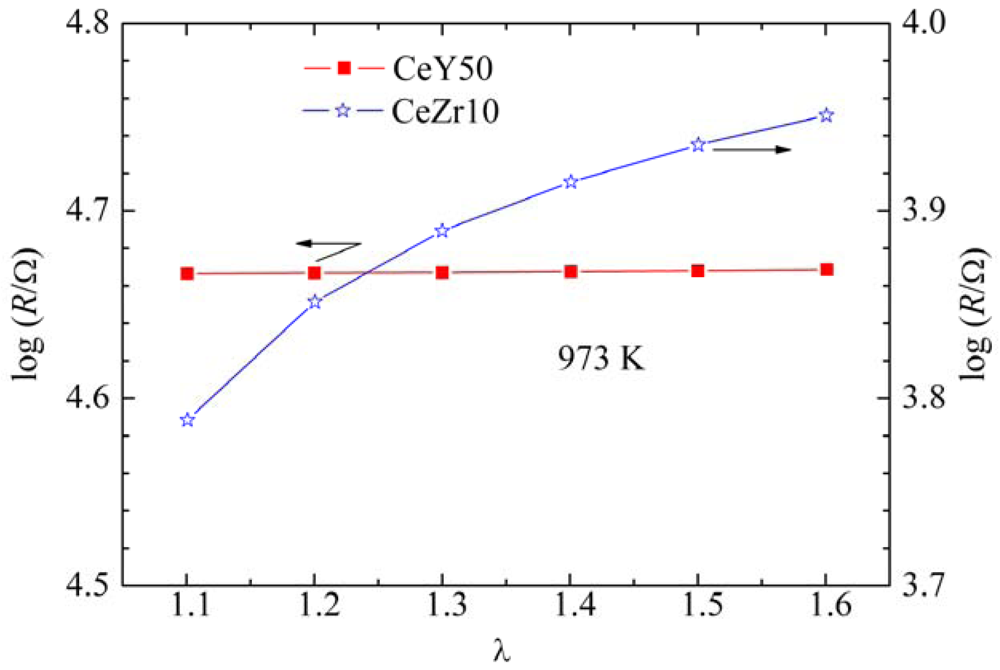
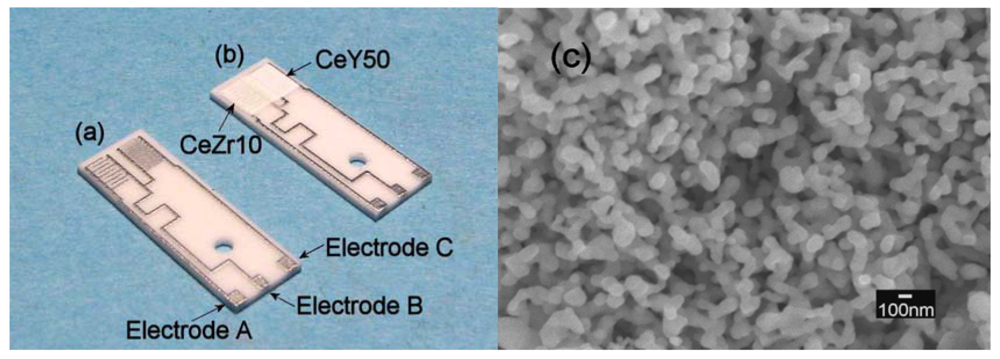
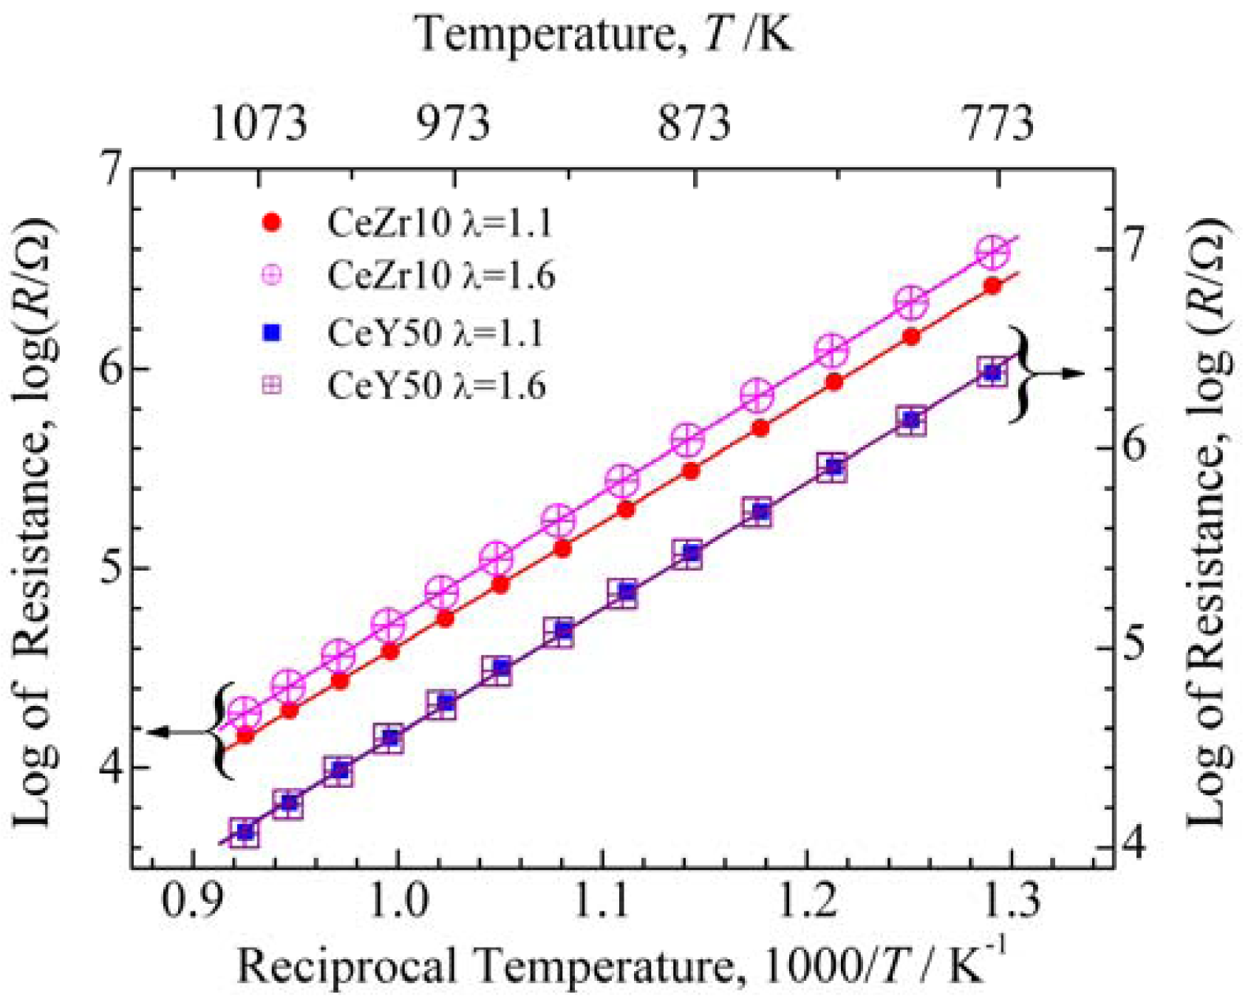
XRD patterns for the thick films fired at 1,373 K are shown in Figure 2. XRD analysis was carried out for thick films on alumina substrates. In the case of CeY20, the analysis was carried out for thick films with Pt electrodes, while for the samples with other concentrations of Y, thick films specially prepared for XRD analysis were used without Pt electrodes.
All of the XRD peaks in patterns for CeY20 to CeY40 were assigned to a fluorite structure, excluding those peaks from the alumina substrate, but some peaks in the patterns for CeY50 to CeY70 were not assigned to a fluorite structure. Y2O3 has a C-rare earth structure; therefore, the crystal structure was considered to change from fluorite type to the C-rare earth type structure. All of the XRD peaks in the patterns for CeY50 to CeY70 were assigned to the C-rare earth structure.
The angle of the peaks from the thick films increased with increasing Y concentration, which indicates the lattice constant decreased with increasing Y concentration. The coordination numbers of the cations in the fluorite and C-rare earth structures are 8 and 6, respectively. The ionic radius of Ce4+ with a coordination number of 6 or 8 is 0.087 or 0.097 nm, respectively, while that of Y3+ with a coordination number of 6 or 8 is 0.0900 or 0.1019 nm, respectively [28]. Therefore, the ionic radius of Y3+ with a coordination number of 6 is smaller than that of Ce4+ with a coordination number of 8, which may be the reason for the decrease in the lattice constant with increasing Y concentration.
McCullough and Britton proposed a complete solid solution for the CeO2-Y2O3 system and a continuous structural transition between CeO2 and Y2O3 [29]. However, Longo and Podda reported the existence of a two phase region [30]. Djurovic et al. summarized several phase diagrams of the CeO2-Y2O3 system reported so far [31]. In this study, it was not concluded that the medium region in the CeO2-Y2O3 system has a complete solid solution or two phase region, because the XRD pattern of the fluorite structure was similar to that for the C-rare earth structure, and the difference in the lattice constant of the two structures was only slight. We do not discuss this phenomenon in detail, because it is not within the scope of interest. However, it became clear that no third phase with a different structure was present in the samples. Figure 3 shows the resistance of thick films with various Y concentrations in the range from 773 to 973 K.
The resistance increased monotonically with increasing Y concentration. The gap of the resistance between CeY40 and CeY50 was larger than that for the other samples, which may be attributable to the difference of the crystal structures.
The resistances in an oxygen concentration of 18.1% were the same as that for 0.20% in the case of CeY20 to CeY50. For CeY60, the resistances at lower temperatures were different for oxygen concentrations between 18.1% and 0.20%. For CeY70, the resistances in the temperature range from 773 to 973 K were different for oxygen concentrations between 18.1% and 0.20%. The independence of the resistance with respect to the oxygen concentration is attributable to oxide ion conduction [32,33] for CeY20 to CeY50. The difference in the resistance between two oxygen partial pressures could be attributable to electrical conduction in the case of CeY60 and CeY70.
Figure 4 shows the activation energies calculated from the data shown in Figure 3. The activation energy increased with increasing Y concentration from CeY20 to CeY60, but decreased from CeY60 to CeY70. For the samples of more than 50 mol% Y, major cations are not Ce but Y. This means that the secondary element is Ce for the samples of more than 50 mol% Y. Thus, Ce may be the origin of scattering for oxide ion flow in the high concentrations of Y. Ce concentration decreases with increasing Y concentrations. This may be the reason for the decreasing activation energy in the high concentrations of Y. For CeY60 and CeY70, the activation energy was different when the oxygen concentration changed, which indicates that these materials are unsuitable as temperature compensating materials.
Measurement of the temperature dependence of resistance for CeZr10 using the same electrode structure as the samples in Figures 3 and 4 gave activation energies of 1.52 and 1.50 eV in oxygen concentrations of 18.1% and 0.20%, respectively. Therefore, it was concluded that CeY50 is the most suitable temperature compensating material of those examined in this study with respect to activation energy and the independence of resistance to oxygen concentration.

3.2. Sensor element

Figure 5 shows the dependence of resistance on λ for CeY50 and CeZr10. In this measurement, the electrodes for CeY50 and CeZr10 were the same and had an interdigital structure with a finger width of 0.1 mm, a finger length of 3.2 mm, a finger space of 0.2 mm, and a finger pair number of 7. The resistance of CeY50 was independent of λ, which satisfies the required property for a temperature compensating material. The resistance of CeZr10 increased with increasing λ.
Figure 6(a) shows electrode patterns for the sensor material and the temperature compensating material on one substrate with a size of 15 × 5 mm2. The electrodes for the sensor materials are shown at the lower left of Figure 6(a) and those for the temperature compensating material are shown at the upper right of Figure 6(a).
The resistance of the temperature compensating material was larger than that of the sensor material; therefore, the electrodes for the former had a smaller finger space and a larger finger pair number than those of the latter. Optimization resulted in similar resistances. Figure 6(b) shows a sensor element comprised of thick films of the sensor material and the temperature compensating material. Figure 6(c) shows an SEM image of the CeY50 sample surface. The thick film has a porous structure and its particle size and thickness were approximately 130 nm and 7.5 μm, respectively.
The resistance of the temperature compensating material and the sensor material of the sensor element (Figure 6(b)) are shown in Figure 7. Both the resistance of the temperature compensating material and the sensor material were the same, so that two vertical axes have been used in Figure 7 for clarity. The resistance of the temperature compensating material was independent of λ but that of the sensor material was dependent on λ; therefore, it was confirmed that both of the materials functioned as expected.
The activation energy for the resistance of CeY50 was 1.25 eV in both case of λ = 1.1 and 1.6, while the activation energies of CeZr10 were 1.23 and 1.26 eV in the case of λ = 1.1 and 1.6, respectively. Therefore, it was confirmed that the temperature dependency of the resistance for CeY50 and CeZr10 were almost the same. These activation energies were slightly smaller than that shown in Figure 4, which may be due to the difference in the electrode structures.
Figure 8 shows the output signal of the sensor element obtained using the electric circuit shown in Figure 1. For λ = 1.1 and 1.6, the output was slightly dependent on the temperature, as indicated by the slightly concave curves shown in Figure 8. The maximum, medium, and minimum outputs were 0.548, 0.531, and 0.513 V at λ = 1.1, and 0.615, 0.601, and 0.586 V at λ = 1.6, respectively. The difference between the medium values of λ = 1.6 and 1.1 (ΔEoutput) is 0.07 V, so that ΔEoutput/Δλ = 0.14 is obtained. The output fluctuated from the medium values with a range of 0.018 V or 0.015 V in the case of λ = 1.1 and 1.6, respectively.
The fluctuations represent 0.13 (=0.018/(ΔEoutput/Δλ)) in λ, so that the sensor element can detect a difference of 0.26 in λ. When λair is calculated from λ using Equation (3), a difference of 0.26 in λ indicates a difference of 0.04 in λair.
The power source voltage (Figure 1) was set to 1 V for the results in Figure 8. When the power source voltage was set higher, the sensor element output responded as the resistance of the temperature compensating material became higher. This may be attributed to an increase in the interface resistance between the materials and the electrode, because as the power source voltage increases, the current density increases. In the case of the temperature compensating material, the charge carriers are oxide ions, so that the reaction in Equation (4) occurs at the electrode:
1 / 2 O 2 + 2 e O 2
When this reaction is much faster, the interface resistance is not apparent. However, if there is an increase in electrons supplied from the electrodes, then Equation (4) becomes a rate-limiting step due to the relatively slow kinetics of the reaction. This may be the reason for the increase in interface resistance. Therefore, it is necessary to ensure that the power source voltage is not too large.

4. Conclusions

Temperature compensating materials were investigated for a resistive oxygen sensor using CeZr10 (Ce0.9Zr0.1O2) as a sensor material for lean-burn engines. The temperature compensating material should have the same temperature dependence of resistance as the sensor material and resistance that is independent of oxygen partial pressure. As a result of Y concentration optimization in the CeO2-Y2O3 material for the temperature compensating material, it was revealed that CeY50 (Ce0.5Y0.5O2-δ) had the same activation energy of resistance as CeZr10 and resistance that was independent of λ. For this composition, XRD analysis revealed no other phase except for fluorite or C-rare earth structures. Therefore, CeY50 was confirmed to function as a suitable temperature compensating material. Sensor elements comprised of CeZr10 and CeY50 as sensor and temperature compensating materials (Figure 6(b)) were fabricated, and the dependence of the sensor element output on temperature was investigated. The electrodes in the sensor element were optimized to adjust the resistance of CeZr10 to that of CeY50. The output was approximately independent of temperature in a wide range from 773 to 1,073 K and detection limits were clarified; the sensor could distinguish a difference of 0.26 and 0.04 in λ and λair, respectively.

References and Notes

  1. Ivers-Tiffee, E.; Hardtl, K.H.; Menesklou, W.; Riegel, J. Principles of solid state oxygen sensors for lean combustion gas control. Electrochim. Acta 2001, 47, 807–814. [Google Scholar]
  2. Rettig, F.; Moos, R.; Plog, C. Poisoning of temperature independent resistive oxygen sensors by sulfur dioxide. J. Electroceram. 2004, 13, 733–738. [Google Scholar]
  3. Sahner, K.; Moos, R.; Izu, N.; Shin, W.; Murayama, N. Response kinetics of temperature-independent resistive oxygen sensor formulations: a comparative study. Sens. Actuat. B-Chem. 2006, 113, 112–119. [Google Scholar]
  4. Neri, G.; Micali, G.; Bonavita, A.; Licheri, R.; Orru, R.; Cao, G.; Marzorati, D.; Borla, E.M.; Roncari, E.; Sanson, A. FeSrTiO3-based resistive oxygen sensors for application in diesel engines. Sens. Actuat. B-Chem. 2008, 134, 647–653. [Google Scholar]
  5. Moos, R.; Rettig, F.; Hurland, A.; Plog, C. Temperature-independent resistive oxygen exhaust gas sensor for lean-burn engines in thick-film technology. Sens. Actuat. B-Chem. 2003, 93, 43–50. [Google Scholar]
  6. Izu, N.; Shin, W.; Murayarna, N.; Kanzaki, S. Resistive oxygen gas sensors based on CeO2 fine powder prepared using mist pyrolysis. Sens. Actuat. B-Chem. 2002, 87, 95–98. [Google Scholar]
  7. Izu, N.; Shin, W.; Murayama, N. Fast response of resistive-type oxygen gas sensors based on nano-sized ceria powder. Sens. Actuat. B-Chem. 2003, 93, 449–453. [Google Scholar]
  8. Izu, N.; Shin, W.; Matsubara, I.; Murayama, N. Small temperature-dependent resistive oxygen gas sensors using Ce0.9Y0.1O2-δ as a new temperature compensating material. Sens. Actuat. B-Chem. 2004, 101, 381–386. [Google Scholar]
  9. Izu, N.; Shin, W.; Matsubara, I.; Murayama, N. Evaluation of response characteristics of resistive oxygen sensors based on porous cerium oxide thick film using pressure modulation method. Sens. Actuat. B-Chem. 2006, 113, 207–213. [Google Scholar]
  10. Izu, N.; Shin, W.; Matsubara, I.; Murayama, N. Improvement in response of resistive oxygen sensor based on ceria-zirconia thick film with Pt catalyst on surface. Sens. Actuat. B-Chem. 2009, 139, 317–321. [Google Scholar]
  11. Varhegyi, E.B.; Perczel, I.V.; Gerblinger, J.; Fleischer, M.; Meixner, H.; Giber, J. Auger and sims study of segregation and corrosion behavior of some semiconducting oxide gas-sensor materials. Sens. Actuat. B-Chem. 1994, 19, 569–572. [Google Scholar]
  12. Varhegyi, E.B.; Gerblinger, J.; Reti, F.; Perczel, I.V.; Meixner, H. Study of the behavior of CeO2 in SO2-containing environment. Sens. Actuat. B-Chem. 1995, 25, 631–635. [Google Scholar]
  13. Izu, N.; Shin, W.; Matsubara, I.; Murayama, N. Influence of SO2 gas on output of resistive oxygen sensors using CeO2 and Ce0.8Zr0.2O2. J. Electrochem. Soc. 2005, 152, H111–H114. [Google Scholar]
  14. Izu, N.; Oh-hori, N.; Itou, M.; Shin, W.; Matsubara, I.; Murayama, N. Resistive oxygen gas sensors based on Ce1-xZrxO2 nano powder prepared using new precipitation method. Sens. Actuat. B-Chem. 2005, 108, 238–243. [Google Scholar]
  15. Esper, M.J.; Logothetis, E.M.; Chu, J.C. Titania exhaust gas sensor for automotive applications. SAE Tech. Paper 1979. No. 790140. [Google Scholar]
  16. Fleischer, M.; Hanrieder, W.; Meixner, H. Oxygen sensor with semiconducting gallium oxide. European Patent EP0,464,243, 1995. [Google Scholar]
  17. Fleischer, M.; Meixner, H. Sensor for detecting reducing gases. European Patent EP0,464,244, 1992. [Google Scholar]
  18. Gerblinger, J.; Meixner, H. Gas and temp. sensor arrangement — for temp. independent determination of esp. oxygen at partial pressure. German Patent DE4,210,397, 1993. [Google Scholar]
  19. Gerblinger, J.; Meixner, H. Device for determining the partial pressure of gases in a gas mixture. European Patent EP0,563,613, 1993. [Google Scholar]
  20. Sugie, J. Oxide semiconductor gas sensor. Japanese Patent H06-222,026, 1994. [Google Scholar]
  21. Yahiro, H.; Baba, Y.; Eguchi, K.; Arai, H. High-temperature fuel-cell with ceria-yttria solid electrolyte. J. Electrochem. Soc. 1988, 135, 2077–2080. [Google Scholar]
  22. Frank, J.; Fleischer, M.; Meixner, H. Gas sensor. World Patent WO9,608,712, 1996. [Google Scholar]
  23. Izu, N.; Shin, W.; Matsubara, I.; Murayama, N.; Oh-hori, N.; Itou, M. Temperature independent resistive oxygen sensors using solid electrolyte zirconia as a new temperature compensating material. Sens. Actuat. B-Chem. 2005, 108, 216–222. [Google Scholar]
  24. Izu, N.; Nishizaki, S.; Itoh, T.; Shin, W.; Matsubara, I.; Murayama, N. Output evaluation of resistive oxygen sensor having Ce0.9Zr0.1O2 sensing material and Zr0.8Y0.2O2-δ temperature compensating material in model exhaust gas. J. Ceram. Soc. Jpn. 2007, 115, 688–691. [Google Scholar]
  25. Sammes, N.M.; Cai, Z.H. Ionic conductivity of ceria/yttria stabilized zirconia electrolyte materials. Solid State Ionics 1997, 100, 39–44. [Google Scholar]
  26. Dirstine, R.T.; Blumental, R.N.; Kuech, T.F. Ionic conductivity of calcia, yttria, and rare earth-doped cerium dioxide. J. Electrochem. Soc. 1979, 126, 264–269. [Google Scholar]
  27. Izu, N.; Oh-hori, N.; Shin, W.; Matsubara, I.; Murayama, N.; Itou, M. Response of resistive oxygen sensors using Ce1-xZrxO2 (x = 0.05, 0.10) thick films in propane combustion gas. Sens. Actuat. B-Chem. 2008, 130, 105–109. [Google Scholar]
  28. Shannon, R.D. Revised effective ionic radii and systematic studies of interatomic distances in halides and chalcogenides. Acta Crystallogr. 1976, A32, 751–767. [Google Scholar]
  29. McCullough, J.D.; Britton, J.D. X-ray studies of rare earth oxide systems. II. the oxide systems CeIV-SmIII, CeIV-GdIII, CeIV-YIII, PrIV-YIII and PrIII-YIII. J. Am. Chem. Soc. 1952, 74, 5225–5227. [Google Scholar]
  30. Longo, V.; Podda, L. Phase-equilibrium diagram of the system ceria-yttria for temperatures between 900-degrees-C and 1700-degrees-C. J. Mater. Sci. 1981, 16, 839–841. [Google Scholar]
  31. Djurovic, D.; Zinkevich, M.; Aldinger, F. Thermodynamic modeling of the yttrium-oxygen system. CALPHAD 2007, 31, 560–566. [Google Scholar]
  32. VanHerle, J.; Horita, T.; Kawada, T.; Sakai, N.; Yokokawa, H.; Dokiya, M. Low temperature fabrication of (Y,Gd,Sm)-doped ceria electrolyte. Solid State Ionics 1996, 86, 1255–1258. [Google Scholar]
  33. Cheng, C.H.; Lee, S.F.; Hong, C.W. Ionic dynamics of an intermediate-temperature yttria-doped-ceria electrolyte. J. Electrochem. Soc. 2007, 154, E158–E163. [Google Scholar]
Figure 1. Electrical circuit for the sensor element using the temperature compensating material.
Sensors 09 08884f1
Figure 2. XRD patterns for thick films with various Y concentrations, fired at 1,373 K. “CeYx” indicates a composition of Ce1-x/100Yx/100O2-δ. “s” indicates the peak from the substrate.
Sensors 09 08884f2
Figure 3. Resistance of thick films with various Y concentrations in the range from 773 to 973 K. “CeYx” indicates a composition of Ce1-x/100Yx/100O2-δ. The values after the composition indicate oxygen concentration.
Sensors 09 08884f3
Figure 4. Dependence of activation energy on the Y concentration, calculated from the data shown in Figure 3.
Sensors 09 08884f4
Figure 5. Dependence of the resistance on λ for CeY50 (Ce0.5Y0.5O2-δ) and CeZr10 (Ce0.9Zr0.1O2).
Sensors 09 08884f5
Figure 6. Fabricated sensor element. (a) Electrode patterns for the sensor material and the temperature compensating material on one substrate with a size of 15 × 5 mm2. (b) Overview of the sensor element, comprised of thick films of the sensor material and the temperature compensating material. (c) SEM image of the CeY50 (Ce0.5Y0.5O2-δ) sample surface.
Sensors 09 08884f6
Figure 7. Resistance of the temperature compensating material (CeY50:Ce0.5Y0.5O2-δ) and the sensor material (CeZr10:Ce0.9Zr0.1O2) on the sensor element shown in Figure 5(b).
Sensors 09 08884f7
Figure 8. Output signal of the sensor element obtained using the electric circuit shown in Figure 1.
Sensors 09 08884f8

