1. Introduction
The variation of viscoelastic properties of a polymer material during its crystallization is important information in the design of a variety of polymer processing equipments. For instance, the property change has a key role in the design of a mold for an injection molding machine, but the property measurement is difficult while the polymer crystallizes.
A quartz crystal resonator is composed of a thin quartz crystal sandwiched between two metal electrodes that establish an alternating electric field across the crystal, causing vibrational motion of the crystal. The motion is characterized with the resonant frequency and admittance of the resonator, and the characteristic is sensitive to the changes of mass and physical property of an overlayer on its electrode. Because the resonator is so sensitive, it can sense a variety of changes in micro-scale at the electrode interface. In polymerization, the rheological properties of a reactant and product mixture vary continuously as the polymerization proceeds. The resonator has been implemented in the monitoring of a UV photopolymerization by measuring its resonant resistance [
1]. The nucleation and crystal formation in a cooling crystallization have also been investigated with the quartz crystal resonator [
2,
3].
The resonant frequency and admittance of the resonator can be interpreted to the changes of mass and viscoelasticity of an overlayer at its electrode interface. Reed
et al. [
4] presented a physical description of a viscoelastically loaded resonator for either very thick viscous fluids or very thin elastic overlayers. Buttry and Ward [
5] gave an extensive review of the quart crystal resonator including basic principles of an AT-cut resonator and relation of the mechanical system composed of a spring, mass and a damper to the electrical circuit of resistance, inductance and capacitance. Nwankwo and Durning [
6] provided an impedance analysis of the resonator for very thick viscoelastic fluids. Kim
et al. [
7] demonstrated the applicability of a specially designed resonator system to monitor the change of viscoelastic property of thin polymer films subjected to temperature variation. When a PMMA/PVAc blend was coated on the one side of the resonator, the resonant frequency decreased accompanying hysteresis with the increased temperature. Based on the resonant frequency variation and the resonant resistance change, they demonstrated that there are two transient phase transition temperatures between the temperatures of 20 °C and 80 °C. Kunze
et al. [
8] developed an extended sheet-contact model to describe the change of resonant frequency and the dissipation of very thin viscoelastic solids coated on the electrode. Efimov
et al. [
9] studied the sensitivity variation of the resonator due to the energy trapping. It was found that energy trapping was insignificant for the small amount of mass loading, but the energy trapping became dominant and an oscillation occurred only in the region of the loading with a large loading. Thermoresponsive viscoelastic property of hydrogel was monitored with the impedance variation of a quartz crystal resonator [
10]. A continuum mechanics model was utilized in the analysis of continuous viscoelastic profiles of a liquid film [
11]. The frequency shift of viscoelastic overlayer has been interpreted with the small-load approximation [
12]. A new set of equations was derived from the complex frequency shift of polymer brushed, and was applied to analyze the dissipation data [
13].
In this study a generalized relation between the resonant characteristics of a quartz crystal resonator and the rheological properties of an overlayer applied on the electrode surface are developed from the mechanics of the quartz movement. The elastic shear modulus and viscosity of a polyethylene overlayer are estimated from the relation and the experimentally obtained resonant frequency and conductance of the resonator. The results are compared with the bulk property of polyethylene melt measured with a rheometer.
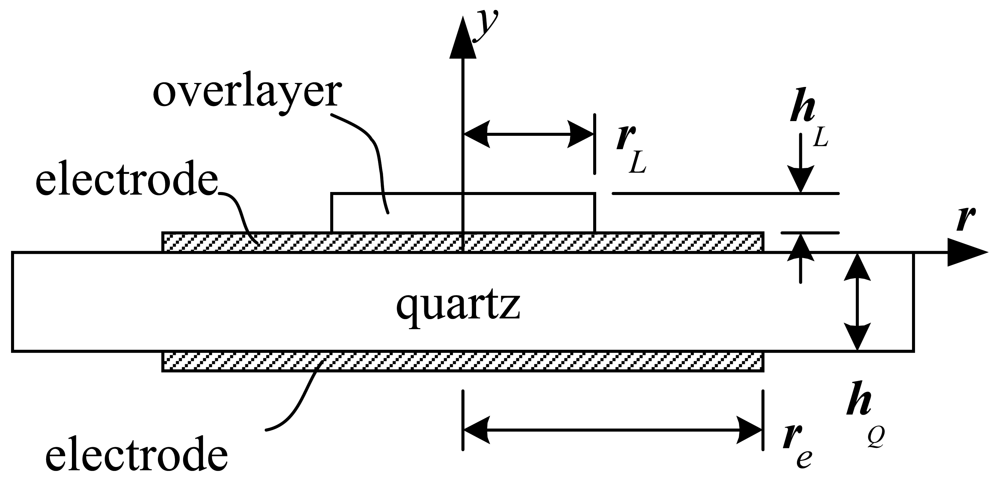
2. Theoretical Analysis
Consider the thickness-shear motion of a thin circular-disk-shape quartz crystal with thickness
hQ having a pair of concentric electrodes with radius
re on both sides as shown in
Figure 1.
The viscoelastic overlayer attached on the top electrode is assumed to be of axisymmetric shape with radius
rL and thickness
hL. Then the equation of motion for the quartz can be written as:
where
t is time and (
r, y) denotes the radial and axial coordinates of the cylindrical coordinate system. Further,
u(
r, y, t) is the mechanical displacement of the quartz along the
x-direction, ø(
r, y, t) the electric potential,
c66 the elastic shear modulus of the quartz,
e26 the piezoelectric constant of the quartz, ε
22 the dielectric constant of the quartz,
ηQ the viscosity of the quartz, and
ρQ the volume density of the quartz material.
The equation for the viscoelastic overlayer is similar to
Equation (1) but purely mechanical:
where
v(
r, y, t) is the mechanical displacement of the overlayer along the
x-direction,
μL the elastic shear modulus,
ηL the viscosity, and
ρL the volume density.
We have six boundary conditions for the above set of equations. Firstly, no-slip condition must be satisfied at the interface between the quartz and the overlayer (through the intermediate thin electrode of course). Secondly, the shear stress should vanish on the top surface of the overlayer. Next, the potentials on the top and bottom electrode surfaces are specified from a specified AC field. The fifth and sixth boundary conditions can be given by applying the Newton's second law to the mass of the top and bottom electrodes, respectively. Here, the forces acting on the electrodes may include the shear forces from the quartz and/or the overlayer (only for the top electrode).
Solutions to
Equations (1),
(2) and
(3) can be written as:
where
ω and
φ̂0 the angular frequency and the amplitude of the external AC electric potential, respectively. The radial dependence of the displacements is represented by
p(
r) = exp(-
r2/r
e2). Further, we have:
where
kQ=
ω√(
ρQ /c̃66) denotes the complex wave number and:
The five unknown constants
A, B, C, D, and
E and one unknown function
F(
r) can be determined from the boundary conditions. After some algebra we arrive at the following formula for
E:
where:
and
ρe is the areal density of the electrode.
It can be shown that the admittance
Y, defined as the ratio of amplitude of the current to that of the voltage applied across the electrodes, is given as:
where
C0=
ε22Ae/hQ is the static capacitance of quartz and
Ae is the area of the electrode. The admittance
Y is composed of real part
G and imaginary part
B called conductance and susceptance, respectively.
The resonant frequency ƒ
0 here is defined as the frequency at which
G becomes the maximum. For the case of no overlayer (
qL =
0) and under the assumption of
K2 ≪ 1 and
qe ≪ 1, the resonance frequency becomes:
where:
It was shown by many investigators that the quartz crystal resonator can be understood in terms of an equivalent electrical circuit. Now,
Equation (11) can be written as
Y =
Y0+
Ym, where
Y0 =
iωC0 represents the admittance of the static capacitance
C0, and
Ym = –
iωC0h0Pe/(2
φ̂0) denotes the admittance of motional branch. The impedance of the motional branch
Zm is the inverse of
Ym. Under the assumption that
ψQ =
kQhQ =
ψ(1
-iξ), where
ψ =
ωhQ√(
ρQ/ c̄
66), is very close to
π for ƒ ≅ ƒ
0 ≅ ƒ
00, it can be shown that the impedance becomes:
Note that
ψ represents the magnitude of
ψQ, and the ratio
ξ is the imaginary part versus the real part of
ψQ; ξ =
ωηQ /(2c̄
66). In this derivation,
ξ is also assumed to be very small (
ξ ≪ 1). Notice also that
qLR and –
qLI are the real and imaginary parts of
qL, respectively:
qL =
qLR –
iqLI. On the other hand the impedance
Zm is assumed to be composed of resistance
Rm, capacitance
Cm and inductance
Lm:
Comparing these two, we get:
where ƒ
0 is given as
Equation (12). All the three formulas shown above are the same as those derived by Martin
et al. [
14].
The resonant frequency with the overlayer can be obtained from the three components derived above; ƒ
0L=1/[2π√(
LmCm)]. Therefore, the shift of resonant frequency Δ
ƒ0L =
ƒ0L –
ƒ0 becomes:
On the other hand, following the R-L-C circuit theory,
Gmax is given by:
In addition,
Gmaxă
12 is given as
Gmaxă
12 =ƒ
0L/(
QRm), where Q = 2π
Lm/Rm is the Q-factor, Δƒ
12=ƒ
2 – ƒ
1 the band width, and ƒ
1 and ƒ
2 the values of the frequency at which the susceptance becomes the maximum and minimum, respectively. Then, we derive:
This indicates that Gmaxă12 which is a measure of the static capacitance of the quartz is independent of the properties of the overlayer.
We can see from
Equations (15) and
(16) that two important parameters that reflect the properties of the material of the viscoelastic overlayer are Δƒ
0L and
Gmax; the magnitude of the former increases proportionally with the raised
qLR and the latter decreases with the raised
qLI. On the other hand, we have:
where:
and:
in the range of
θ being 0 ≤
θ ≤ π/2.
For an effective analysis, we need to introduce two group variables, ∏1=hL√(c̄66 /(hQ√μ)) and ∏2 =ω0ηL/μL. We note that the asymptotically thin film of the material provides ∏1 → 0 and the asymptotically thick limit gives ∏1 → ∞. Similarly, a very hard material means ∏2 → 0 and the Newtonian liquid ∏2 → ∞. Further, in the following analysis we assume that γ = O(1) and ρL ∼ ρQ.
First, for the case of thin film (∏
1 → 0), we get
qLR=
qLc=
π γ ρL hL /(
ρQ hQ) and the formula for the frequency shift Δƒ
0L as follows:
which corresponds to the Sauerbrey's formula [
15] except for the parameter
γ.
For the case of thick (∏
1 → ∞) and elastic (∏
2 → 0) solid, we have:
Since
qLI=
0,
Gmax is the largest and independent of the material property. Further,
Equation (21a) implies that there can be an infinite number of values of the parameter
μL that produces a given value of
qLR, because at
N = (2
n-1)
π /2 (
n=
1,2,3…)
qL becomes infinite. However, the case of thick elastic material may not be encountered so frequently.
For the case of thick layer (∏
1 → ∞) of Newtonian liquid (∏
2 → ∞), we have
μ =
ω0 ηL. When the liquid has a low viscosity (
ηL → 0), then the frequency shift Δƒ
0L can be given as:
which is the same as the one derived by Kanazawa and Gordon [
16] except for the parameter
γ. In case of the resonator application to the measurement in water solution, the density and viscosity of the solution affect the frequency shift. Muramatsu
et al. [
17] showed that the experimental results of the shift linearly increase with the raise of square root of solution density and viscosity in water and ethanol-water solution.
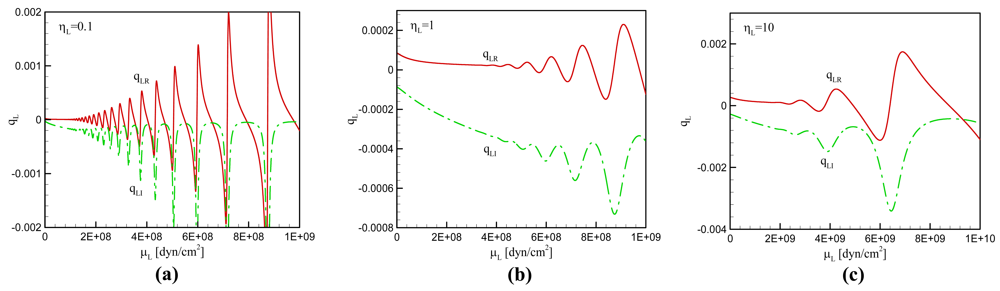
For the case of general viscoelastic overlayer, we can investigate the effect of
μL and
ηL on
qL by plotting
qL versus
μL at different values of
ηL. As shown in
Figure 2,
qL oscillates with
μL more pronouncedly at lower values of
ηL. A lower value of
μL produces the smaller amplitude of
qL fluctuation. It again implies that we can expect multiple values of the parameter set (
μL,
ηL) which give rise to a given value of
qL; selecting such parameter set is more highly possible at lower values of
ηL and
μL. From
Equations (15) and
(16) it is known that the frequency shift is determined from the real part of
qL and the maximum conductance from the imaginary part of
qL. When the experimental measurements of frequency shift and conductance are available, the estimation of
μL and
ηL is possible from the equations as demonstrated in
Figure 2. In this case, we must pay attention to the possibility of multiple sets of the properties which has not been reported in the previous studies.
In the practical implementation of a resonator the viscoelastic overlayer is often loaded on the electrode surface. When a viscoelastic overlayer of polymer is applied to the resonator for the measurement of physical property variation along with a change of temperature or polymerization degree, the variation of viscosity and elastic shear modulus of the overlayer can be computed for the frequency shift and maximum conductance of the resonator. In other words, monitoring the frequency and the conductance can explain the polymerization and crystallization processes of a polymer sample. In this case multiplicity in the solutions of the equations may be resolved by a certain strategy. For instance, provided that the resonant property is known at a given parameter set, the viscoelastic property is readily obtained from the equations uniquely: When the experimental condition, such as temperature, varies continuously, the physical properties of overlayer also follow the condition and the determination of the properties from
Figure 2 is a simple procedure.
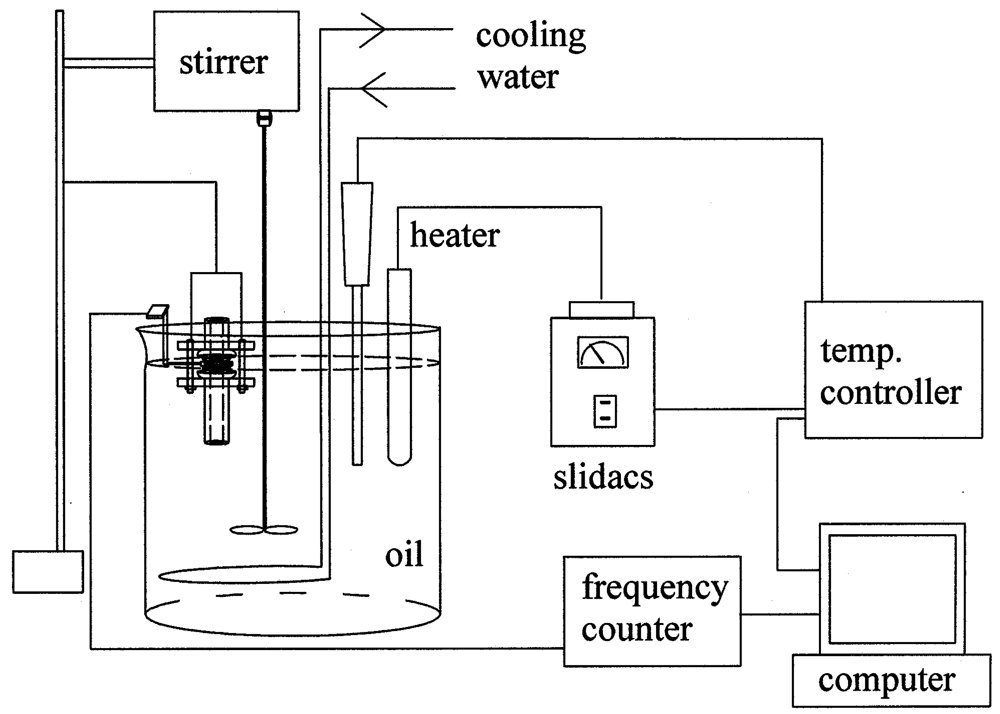
4. Application to Polyethylene Crystallization
The formula and analysis presented so far are applied to the experimental study on the measurement of material properties of polyethylene during its crystallization process. As the material and geometrical constant for the quartz, we consider the following parameters many of which are commonly used for an AT-cut crystal:
Here, the depth of quartz
hQ was obtained in such a way that the resultant resonant frequency matches with the measured one
ƒ0 = 7,996 [
kHz] without any overlayer. Further, we consider the following properties for silver electrodes:
Then, we have
qe = 0.00594. On the other hand,
Equation (13) gives
ƒ00 = 8,114
kHz and we obtain the theoretical prediction for
ƒ0, the resonant frequency without the overlayer, from
Equation (12) as follows:
ƒ0 = 7,997.7
kHz. On the other hand, the computation with
Equation (11) gives
ƒ0 = 7,996.0
kHz. We can see that the error of the theoretical prediction is only 0.02%. The electrode diameter
de takes different value for each experimental measurement to match the measured
Gmaxă
12 using
Equation (17).
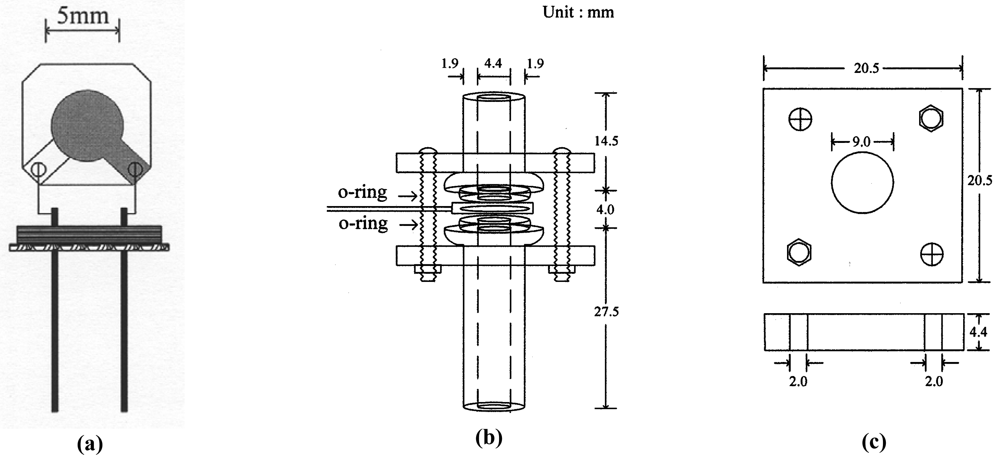
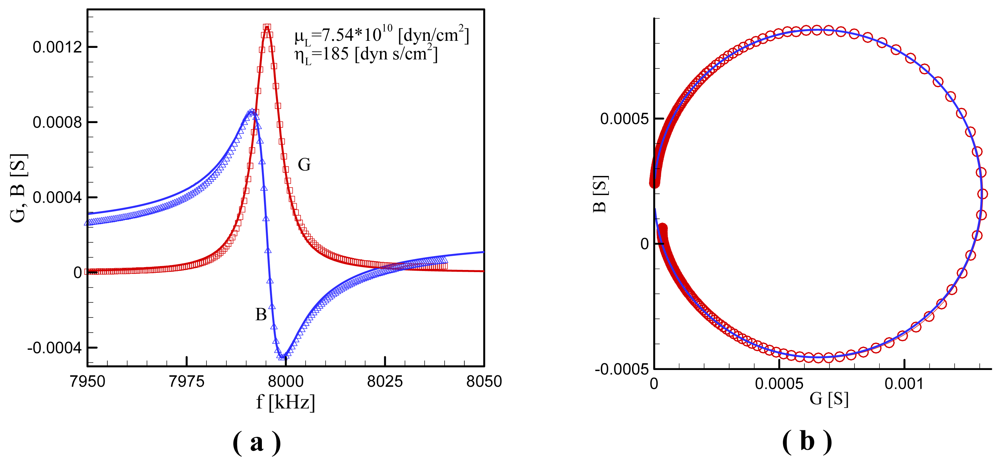
The experiment provided the conductance
G and the susceptance
B as a function of the frequency
ƒ for the case without overlayer at the room temperature and 11 cases with melted polyethylene at different temperatures, and a typical set of data at a temperature of 83 °C is shown in
Figure 5(a). First, for the unloaded case, we read
Gmax from the
G curve of
Figure 6(a) or from the radius of a circle matching the Nyquist plot as shown in
Figure 5(b), and also read Δƒ
12 from the
B curve in
Figure 5(a). From
Equation (17) we calculate the electrode diameter;
de =0.5101
cm. Then we find ξ from matching
Gmax obtained from the experiment with that given by calculating (16).
Equation (17) can be used as a guide or initial value for ξ, where
Rm =1/
Gmax is applied.
Equation (17) yields ξ = 2.08 × 10
-4, whereas the numerical calculation gives ξ = 2.12 × 10
-4 being only 2% different from the asymptotic calculation.
We next obtain the parameters
μL and
ηL for loaded cases. The measurement was done with the PE particles melted on the electrode surface. The total mass of the particles is 0.033 mg. It is assumed that all the particles contribute to a single particle, its size being determined by summing up all the particles' size;
dL=
0.0502 cm. This in turn provides the thickness of the PE particle;
hL=
0.0184 cm. Since the melted particles do not change their shape with temperature,
dL and
hL are fixed in the subsequent calculations. It is true that a parameter set (
μL,
ηL) results in one set of parameters
qLR and
qLI and therefore one set of values
Gmax and Δƒ. However as analyzed in the previous section, the inverse is not true. In fact, infinite number of parameter set (
μL,
ηL) can result in a given parameter set
Gmax and Δƒ.
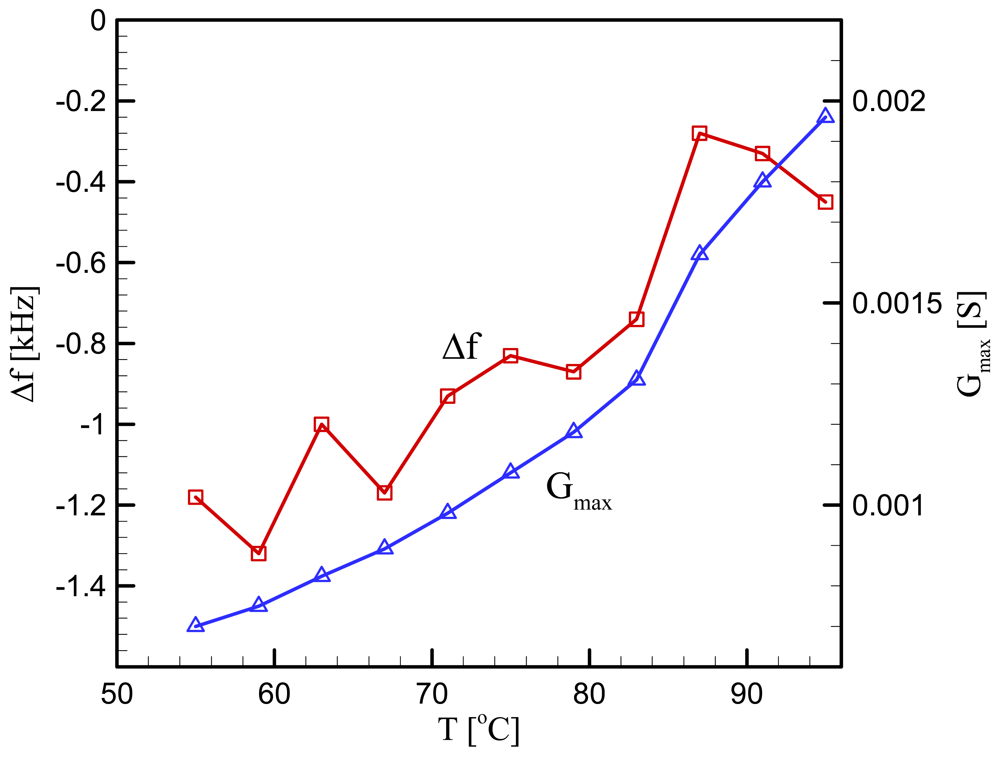
Figure 6 presents
Gmax and Δƒ measured from the experiment at 11 different temperatures. We see that
Gmax decreases monotonously with the temperature decrease, but Δƒ shows fluctuation although in overall it also decreases with the temperature decrease. The sensitivity of the experimental setup is determined by the measurement resolution of the impedance analyzer. The resolution of frequency measurement is 1 Hz, and that of conductance is 1 nS. Therefore, the variation trends of the frequency difference and conductance in
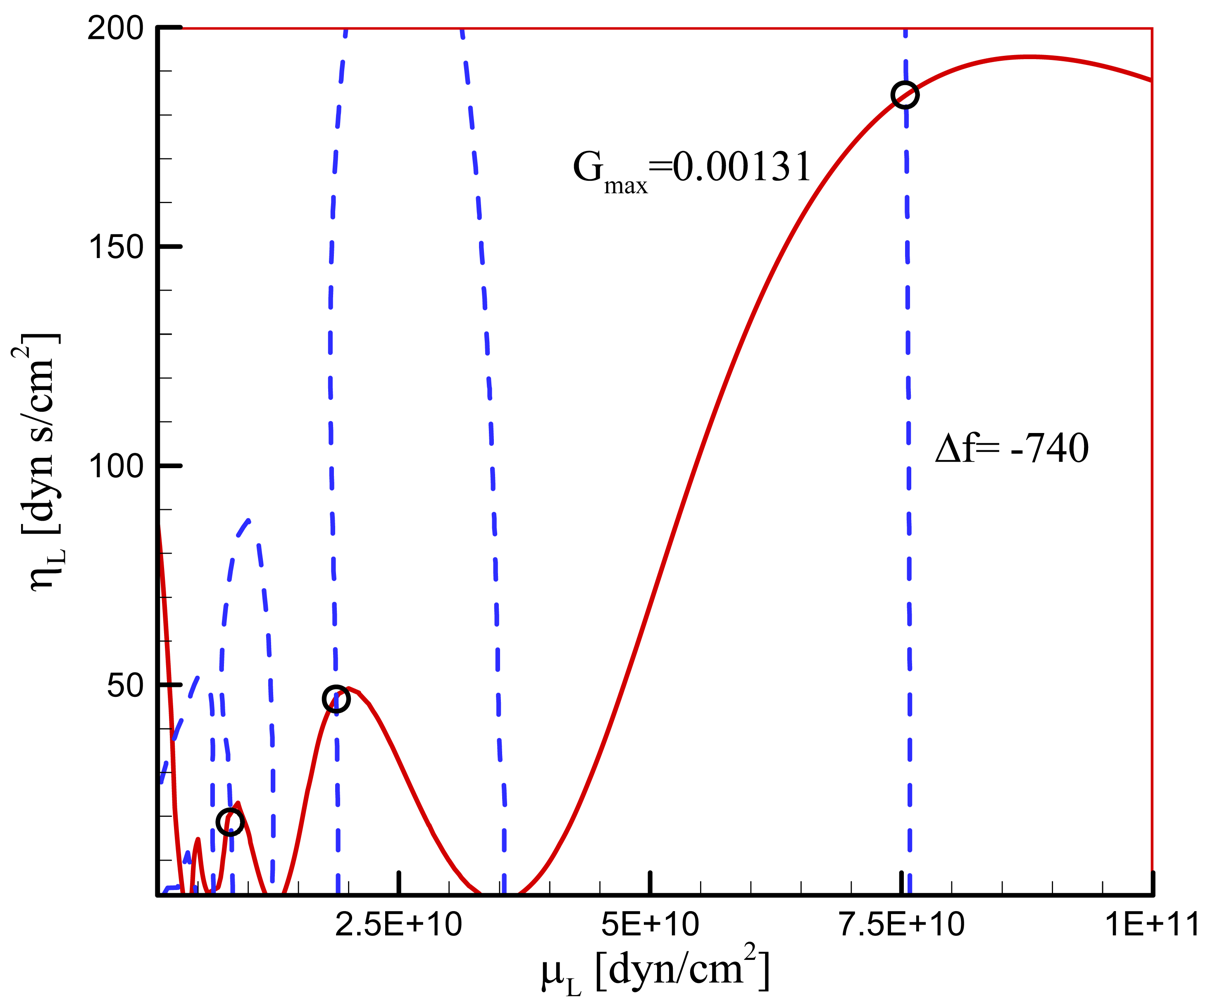
Figure 6 are real, while the fluctuation in the frequency is due to the instrumental sensitivity. To find the parameter set (
μL,
ηL) corresponding to each of the 11 data set (
Gmax, Δƒ), we generate a map on the (
μL,
ηL) space as shown in
Figure 7. Intersection of contour lines of
Gmax and that of Δƒ then gives us the parameters
μL and
ηL.
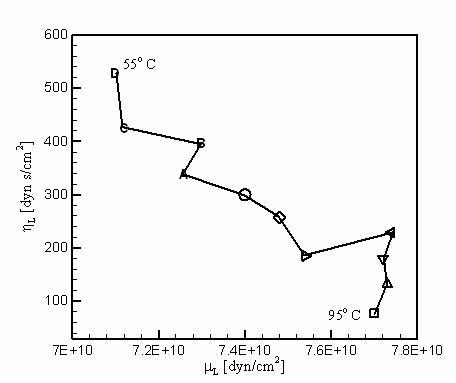
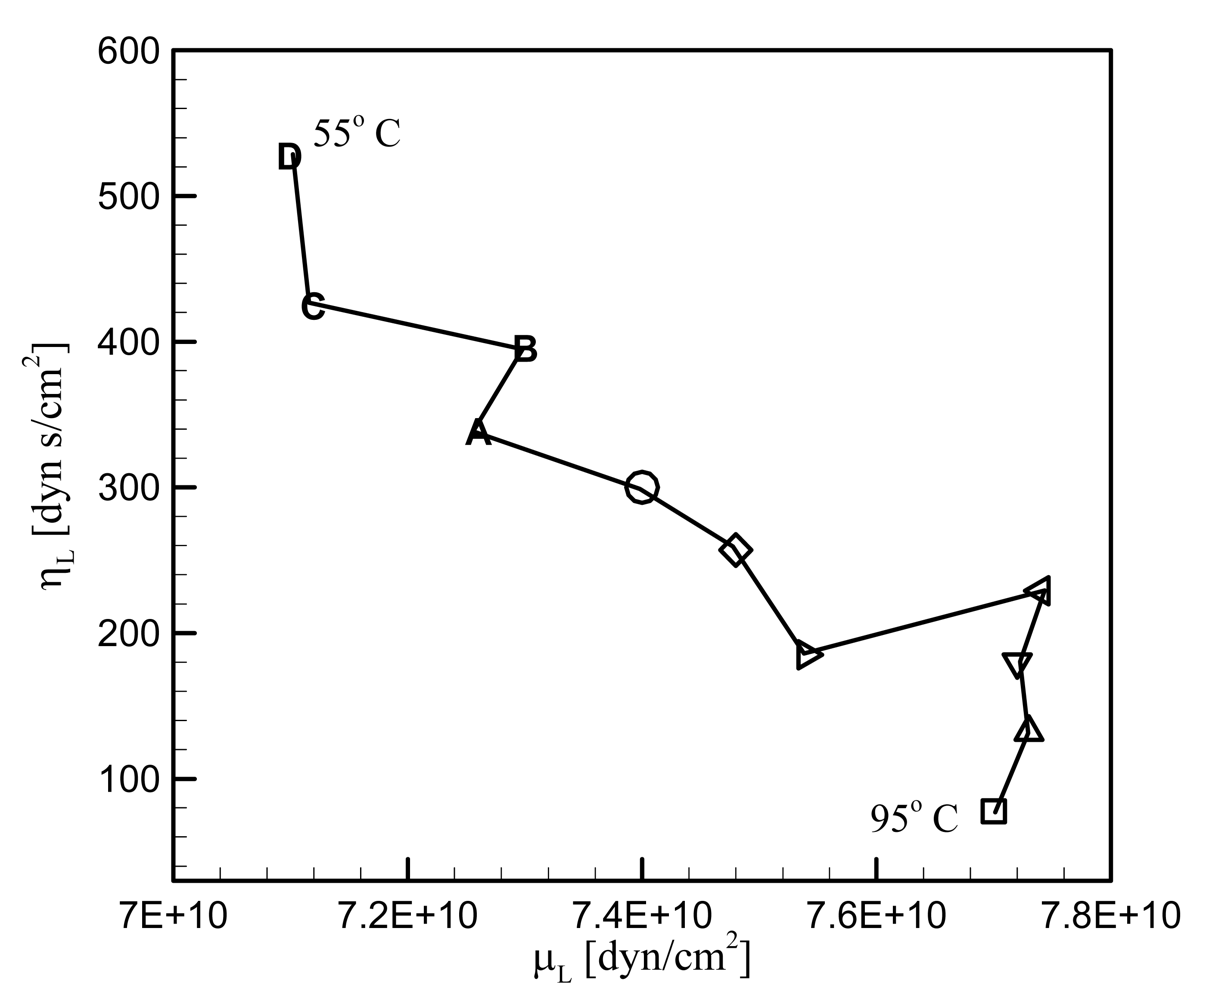
Figure 8 exhibits the parameters obtained in this way at the fundamental mode of the overlayer vibration. We see that as the temperature decreases from the melting point, the shear modulus decreases but the viscosity increases.
The measurements of elastic shear modulus and viscosity shown in
Figure 5 are compared with those of bulk polyethylene in melt state [
18], and the results are listed in
Table 1. The top three rows are of the instrumental measurements in the low rate of shear, the estimated values of this study is followed, and the bottom row is the estimation for the high frequency viscoelasticity from the low frequency measurements. Because the melt properties are of a large difference of frequency, a direct comparison between the measurement and the estimation of this study is difficult. However, the two rows show comparable values of viscoelasticity. The tendencies of the increase of elastic shear modulus and the decrease of viscosity with the frequency elevation of sample movement show that the measurements of this study are same to the melt properties. In addition, the effects of temperature variation on the elastic shear modulus and viscosity are the same in the studies. While the instrumental measurement of rheological property is limited to polymer melt, the proposed measurement technique of this study can be implemented to the wide range of applications for various materials.


