A Feature Extraction Method Based on Information Theory for Fault Diagnosis of Reciprocating Machinery

Abstract
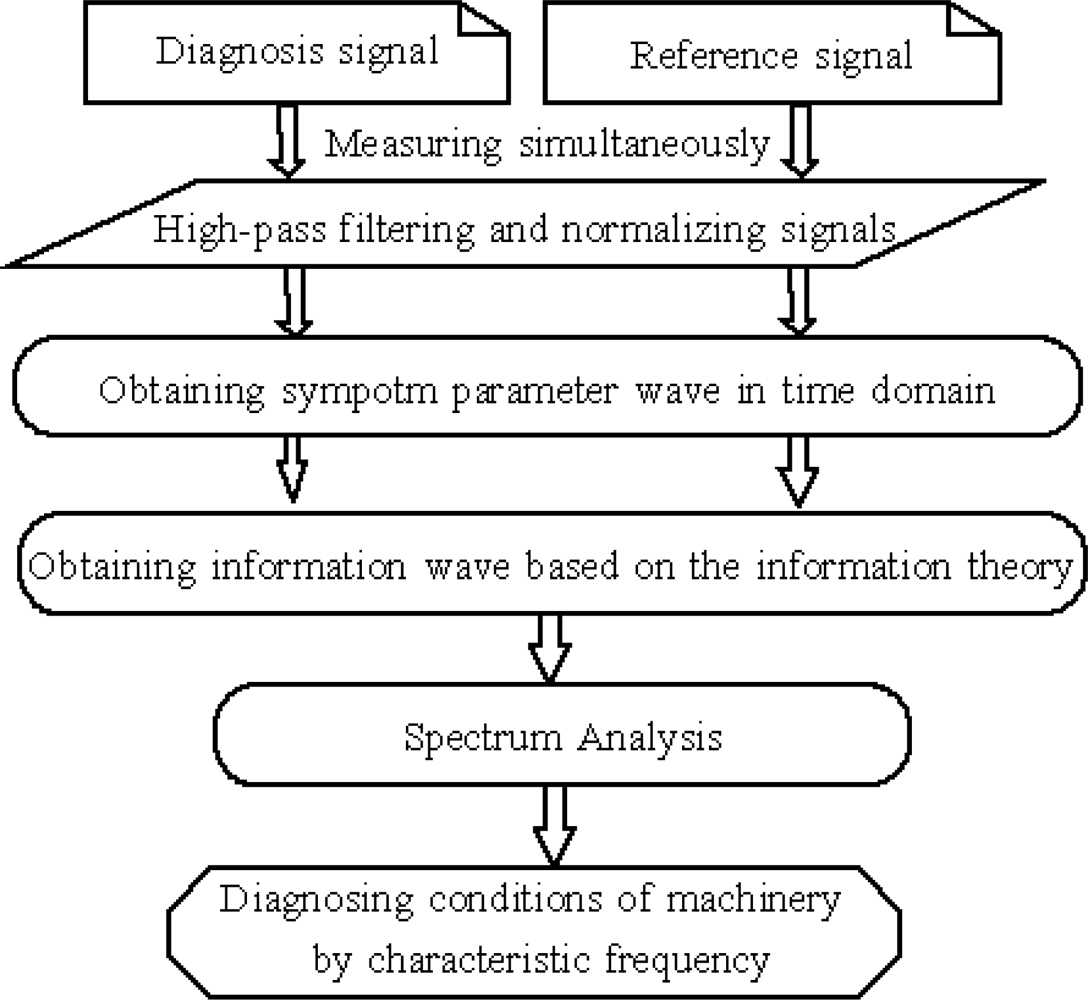
:1. Introduction
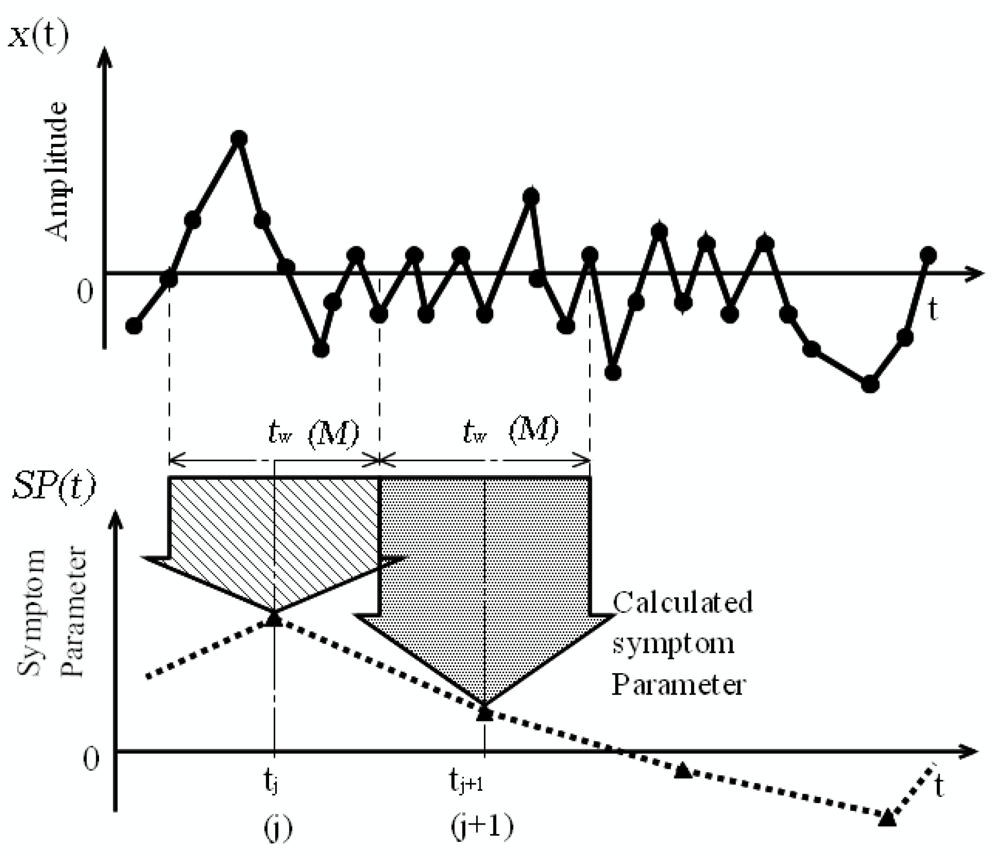
2. Method of Obtaining the Symptom Parameter Wave
3. Feature Extraction by Information Theory
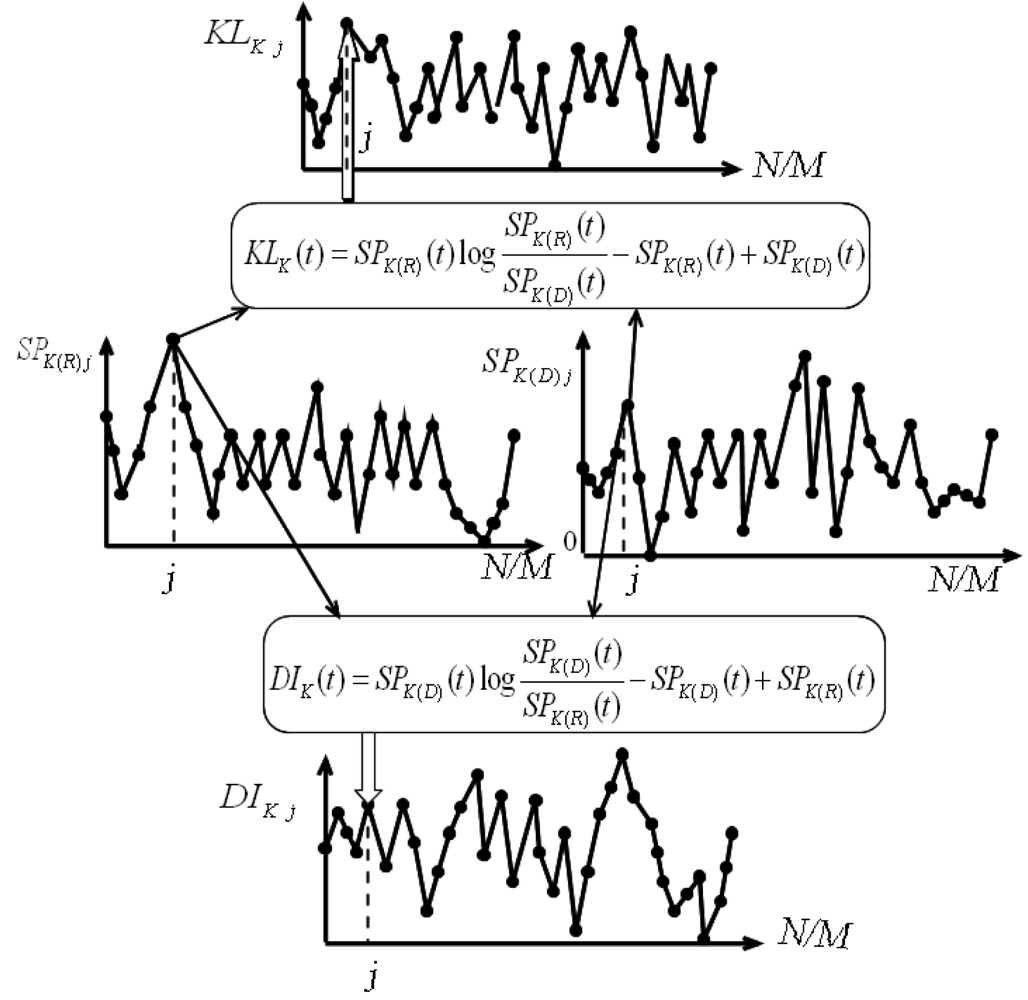
3.1. Derivation for Information Wave of Symptom Parameters
- Non-negativity: KL(P1,P2) ≥ 0 with equality if and only if P1 = P2.
- Asymmetry: KL(P1,P2) ≠ KL(P2,P1).
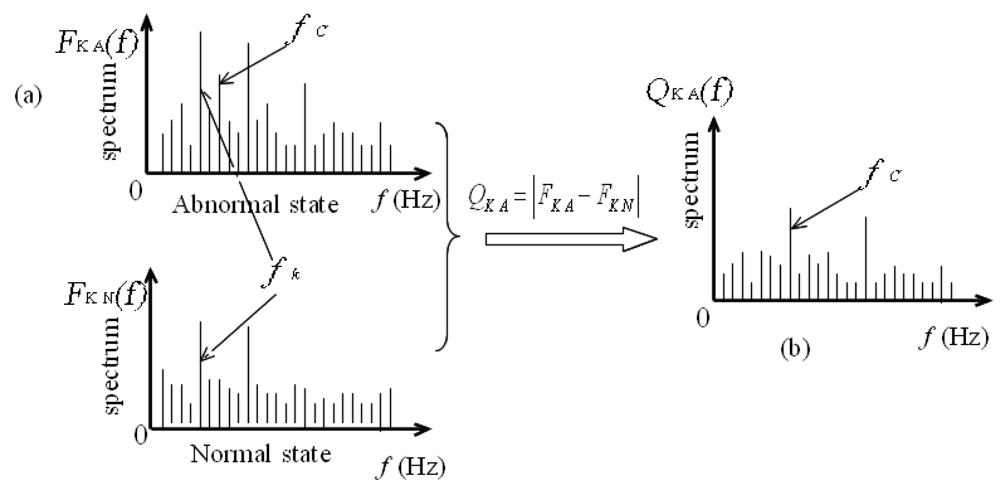
3.2. Spectrum Analysis for Information Wave
4. Practical Application
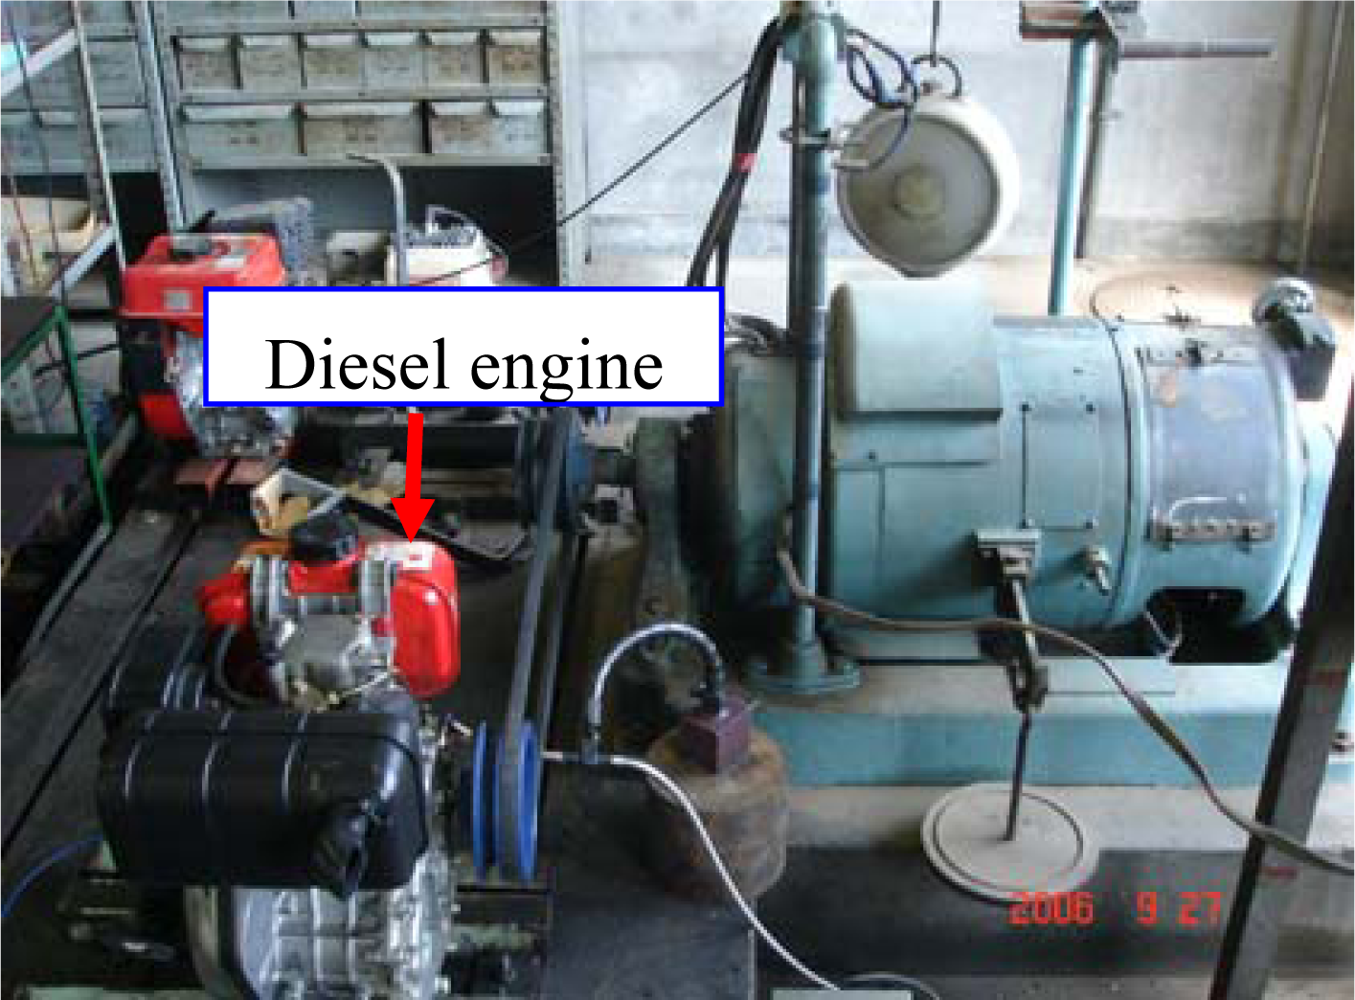
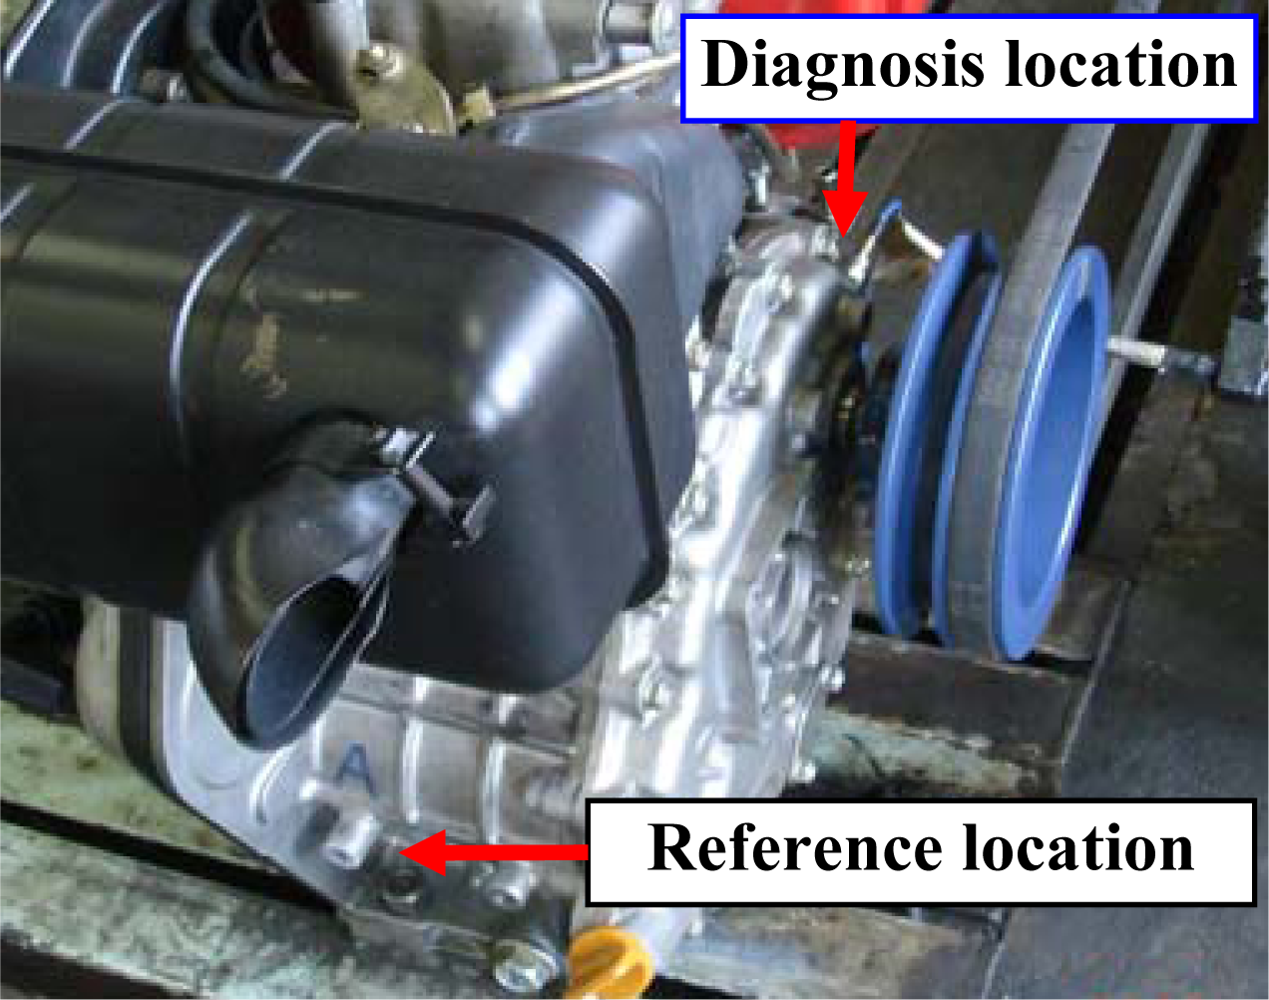
4.1. Experimental System
4.2. Pass-frequency of a Bearing
4.3. Verification and Discussion
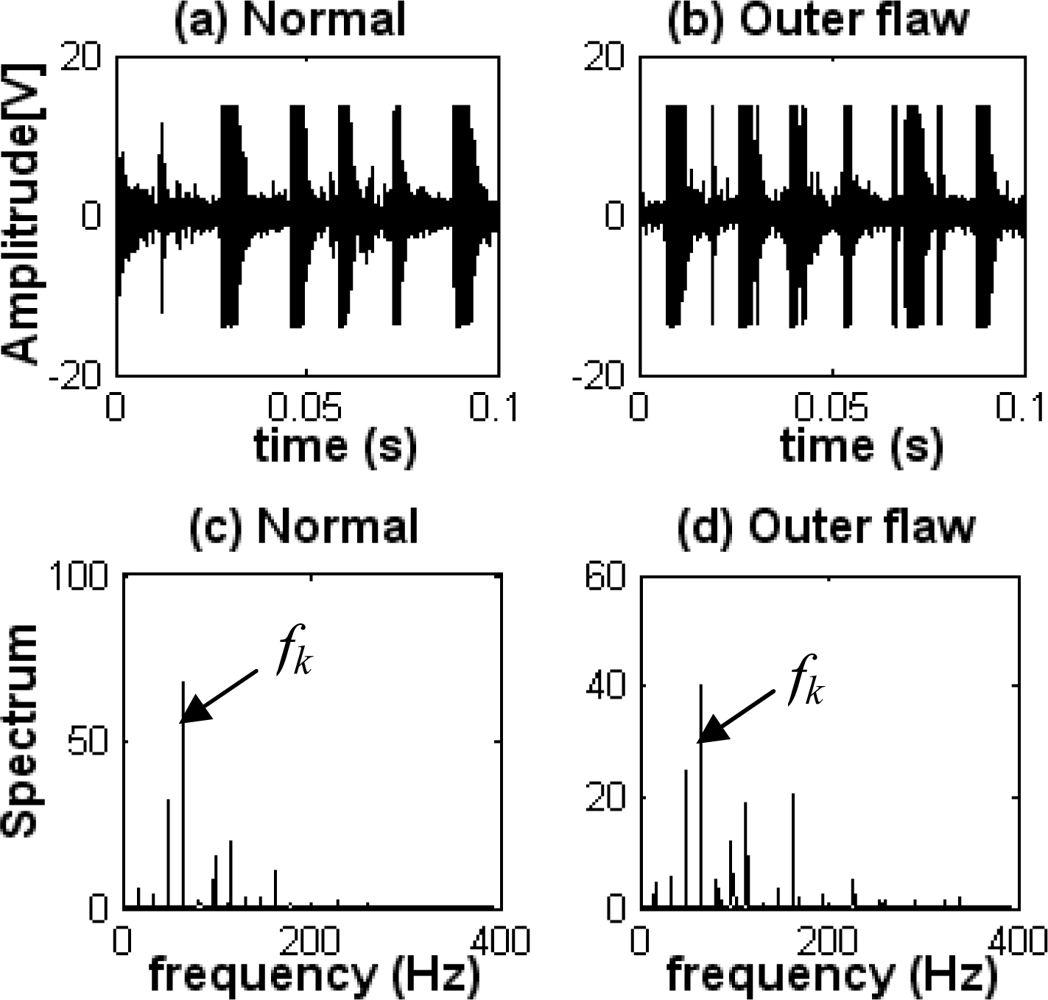
4.3.1. Diagnosis by the conventional FFT-based envelope analysis
4.3.2. Diagnosis by the wavelet analysis
4.3.3. Diagnosis by the proposed method
5. Conclusions
- A method to obtain symptom parameter waves was defined in the time domain using the time series signal;
- An information wave was also proposed on the basis of the two kinds of information energies using a symptom parameter wave for the feature extraction of a signal;
- A difference spectrum method of envelope information waves was derived for the feature extraction, and the envelope information wave was obtained from the absolute values of the information wave. The conditions of a machine were effectively differentiated by the extracted feature spectra;
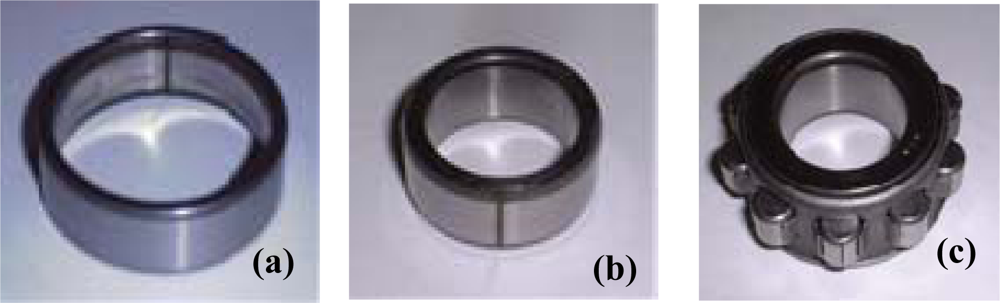
- A comparison was made between the proposed method, the conventional Hilbert-transform-based envelope detection, and wavelet analysis. Practical examples of diagnosis for a bearing used in a diesel engine have verified the effectiveness of the proposed method. The analyzed results showed that the bearing faults, such as the outer-race defect, the inner-race defect, and the roller defect, had been effectively identified by the proposed method. However, those faults could not be detected by either of the techniques it was compared to;
- The results also showed that the proposed technique was not much effective for the inner-race and roller defects comparing with the outer-race defect. It could be explained as follows. When a machine in the operating condition, the bearing outer is fixed, whereas, the roller and inner are rotary. Therefore, it makes the features of the signals measured in the roller and inner-race defects are more difficult to extract than in the outer-race defect.
References and Notes
- Wang, H.; Chen, P. Intelligent diagnosis method for a centrifugal pump using features of vibration signals. Neural Comput. Appl 2008. [Google Scholar] [CrossRef]
- Wang, H.; Chen, P. Sequential diagnosis for rolling bearing using fuzzy neural network. Proceedings of the 2008 IEEE/ASME International Conference on Advanced Intelligent Mechatronics, Xi'an, China, July 2008; pp. 56–61.
- Mitoma, T.; Wang, H.; Chen, P. Fault diagnosis and condition surveillance for plant rotating machinery using partially-linearized neural network. Comput. Ind. Eng 2008, 55, 783–794. [Google Scholar]
- Tandon, N.; Choudhury, A. A review of vibration and acoustic measurement methods for the detection of defects in rolling element bearings. Tribol. Int 1999, 32, 469–480. [Google Scholar]
- Niu, X.; Zhu, L.; Ding, H. New statistical moments for the detection of defects in rolling element bearings. Int. J. Adv. Manuf. Technol 2005, 26, 1268–1274. [Google Scholar]
- Heng, R.B.W.; Nor, M.J.M. Statistical analysis of sound and vibration signals for monitoring rolling element bearing condition. Appl. Acoust 1997, 53, 211–226. [Google Scholar]
- Baillie, D.C.; Mathew, J. A comparison of autoregressive modeling techniques for fault diagnosis of rolling element bearings. Mech. Syst. Signal Process 1996, 10, 1–17. [Google Scholar]
- Cheng, J.S.; Yu, D.J.; Yang, Y. The application of energy operator demodulation approach based on EMD in machinery fault diagnosis. Mech. Syst. Signal Process 2007, 21, 668–677. [Google Scholar]
- Baydar, N.; Ball, A. A comparative study of acoustic and vibration signals in detection of gear failures using Wigner-Ville distribution. Mech. Syst. Signal Process 2001, 15, 1091–1107. [Google Scholar]
- Lei, Y.G.; He, Z.J.; Zi, Y.Y. Fault diagnosis of rotating machinery based on multiple ANFIS combination with GAs. Mech. Syst. Signal Process 2007, 21, 2280–2294. [Google Scholar]
- Peng, Z.K.; Chu, F.L. Application of wavelet transform in machine condition monitoring and fault diagnostics: a review with bibliography. Mech. Syst. Signal Process 2003, 17, 199–221. [Google Scholar]
- Qiao, H.; He, Z.J.; Zhang, Z.S.; Zi, Y.Y. Fault diagnosis of rotating machinery based on improved wavelet package transform and SVMs ensemble. Mech. Syst. Signal Process 2007, 21, 688–705. [Google Scholar]
- Rai, V.K.; Mohanty, A.R. Bearing fault diagnosis using FFT of intrinsic mode functions in Hilbert-Huang transform. Mech. Syst. Signal Process 2007, 21, 2607–2615. [Google Scholar]
- Nikolaou, N.G.; Antoniadis, I.A. Rolling element bearing fault diagnosis using wavelet packets. NDT&E Int 2002, 35, 197–205. [Google Scholar]
- Peter, W.; Tse, Y.; Peng, H.; Yam, Richard. Wavelet analysis and envelope detection for rolling element bearing fault diagnosis-their effectiveness and flexibilities. J. Vib. Acoust 2001, 123, 303–311. [Google Scholar]
- Yang, Y.; Yu, D.; Cheng, J. A fault diagnosis approach for roller bearing based on IMF envelope spectrum and SVM. Measurement 2007, 40, 943–950. [Google Scholar]
- Schultheis, S.M.; Licketeig, C.A.; Parchewsky, R. Reciprocating compressor condition monitoring. Proceedings of the thirty-sixth turbo-machinery symposium, Houston, Texas, USA, September 2007; pp. 107–113.
- Kocur, D.; Stanko, R. Order bispectrum: A new tool for reciprocated machine condition monitoring. Mech. Syst. Signal Process 2000, 14, 871–890. [Google Scholar]
- Charles, P.; Sinha, J.K.; Gub, F.; Lidstone, L.; Ball, A.D. Detecting the crankshaft torsional vibration of diesel engines for combustion related diagnosis. J. Sound Vib 2009, 321, 1171–1185. [Google Scholar]
- Jiang, J.; Gu, F.; Gennish, R.; Moore, D.J.; Harris, G.; Ball, A.D. Monitoring of diesel engine combustions based on the acoustic source characterisation of the exhaust system. Mech. Syst. Signal Process 2008, 22, 1465–1480. [Google Scholar]
- El-Ghamry, M.H.; Reuben, R. L.; Steel, J. A. The development of automated pattern recognition and statistical feature isolation machinery fault using acoustic emission. Mech. Syst. Signal Process 2003, 17, 805–823. [Google Scholar]
- Geng, Z.; Chen, J.; Hull, J.B. Analysis of engine vibration and design of an applicable diagnosing approach. Int. J. of Mech. Sci 2003, 45, 1391–1410. [Google Scholar]
- Su, Y.T.; Lin, S.J. On initial fault detection of a tapered roller bearing: frequency domain analysis. J. Sound Vib 1992, 155, 75–84. [Google Scholar]
- Sheen, Y.T. An analysis method for the vibration signal with amplitude modulation in a bearing system. J. Sound Vib 2007, 303, 538–552. [Google Scholar]
- Sheen, Y.T. An envelope detection method based on the first-vibration-mode of bearing vibration. Measurement 2008, 41, 797–809. [Google Scholar]
- Sheen, Y.T.; Hung, C.K. Constructing a wavelet-based envelope function for vibration signal analysis. Mech. Syst. Signal Process 2004, 18, 119–126. [Google Scholar]
- Orhan, S.; Akturk, N; Celik, V. Vibration monitoring for defect diagnosis of rolling element bearings as a predictive maintenance tool: Comprehensive case studies. NDT&E Int 2006, 39, 293–298. [Google Scholar]
- Yang, D.M.; Stronach, A.F.; MacConnell, P. The application of advanced signal processing techniques to induction motor bearing condition diagnosis. Meccanica 2003, 38, 297–308. [Google Scholar]
- Toyata, T.; Fukuda, K.; Chen, P. Failure diagnosis of machinery by Kullback information theory Technical Report of IEICE,. 1996, R96-13. 13–16.
- Liu, X.; Toyota, T.; Chen, P.; Feng, F.; Niho, T. Study on deterioration trend control for rotating machinery by information theory. J. REAJ 1999, 21, 507–514. [Google Scholar]
- Liu, X.; Toyota, T.; Chen, P.; Feng, F.; Niho, T. Condition diagnosis for rotating machinery by Information Divergence. J. Jpn. Soc. Precis. Eng 2000, 66, 157–163. [Google Scholar]
- Fukunaga, K. Introduction to Statistical Pattern Recognition; Academic Press: San Diego, CA, USA, 1972. [Google Scholar]
- Kullback, S. Information Theory and Statistics; John Wiley & Sons, Inc: New York, NY, USA, 1959. [Google Scholar]
- Eguchi, S.; Copas, J. Interpreting Kullback–Leibler divergence with the Neyman-Pearson lemma. J. Multivariate Anal 2006, 97, 2034–2040. [Google Scholar]
- Chen, P.; Toyota, T. Sequential fuzzy diagnosis for plant machinery. JSME Int. J Series C 2003, 46, 1121–1129. [Google Scholar]
- Cheng, J.; Yu, D.; Yang, Y. Application of an impulse response wavelet to fault diagnosis of rolling bearings. Mech. Syst. Signal Process 2007, 21, 920–929. [Google Scholar]
- Rubini, R.; Meneghetti, U. Application of the envelope and wavelet transform analysis for the diagnosis of incipient faults in ball bearings. Mech. Syst. Signal Process 2001, 15, 287–302. [Google Scholar]
- Wang, H.; Chen, P. Fault diagnosis of centrifugal pump using symptom parameters in frequency domain. Agr. Eng. Int.: The CIGR E-J Manuscript IT 07 005,. 2007, 11, 1–14. [Google Scholar]


| Contents | Parameters |
|---|---|
| Bearing specification | N205 |
| Bearing outer diameter | 52 mm |
| Bearing inner diameter | 25 mm |
| Bearing width | 15 mm |
| Bearing roller diameter | 7 mm |
| The number of the rollers | 13 |
| Contact angle | 0 rad |
| Flaw width | 0.8 mm. |
| Flaw depth | 0.8 mm. |
© 2009 by the authors; licensee MDPI, Basel, Switzerland This article is an open access article distributed under the terms and conditions of the Creative Commons Attribution license (http://creativecommons.org/licenses/by/3.0/).
Share and Cite
Wang, H.; Chen, P. A Feature Extraction Method Based on Information Theory for Fault Diagnosis of Reciprocating Machinery. Sensors 2009, 9, 2415-2436. https://doi.org/10.3390/s90402415
Wang H, Chen P. A Feature Extraction Method Based on Information Theory for Fault Diagnosis of Reciprocating Machinery. Sensors. 2009; 9(4):2415-2436. https://doi.org/10.3390/s90402415
Chicago/Turabian StyleWang, Huaqing, and Peng Chen. 2009. "A Feature Extraction Method Based on Information Theory for Fault Diagnosis of Reciprocating Machinery" Sensors 9, no. 4: 2415-2436. https://doi.org/10.3390/s90402415