Article

Amperometric Hydrogen Peroxide Biosensor Based on Immobilization of Hemoglobin on a Glassy Carbon Electrode Modified with Fe3O4/Chitosan Core-Shell Microspheres

College of Chemistry and Ecological Engineering, Guangxi University for Nationalities, Nanning 530006, China
*
Author to whom correspondence should be addressed.
Sensors 2009, 9(8), 6185-6199; https://doi.org/10.3390/s90806185
Submission received: 10 June 2009 / Revised: 23 July 2009 / Accepted: 3 August 2009 / Published: 5 August 2009
(This article belongs to the Section Biosensors)

Abstract

:
Novel magnetic Fe3O4/chitosan (CS) microspheres were prepared using magnetic Fe3O4 nanoparticles and the natural macromolecule chitosan. Then, using an easy and effective hemoglobin (Hb) immobilization method, an innovative biosensor with a Fe3O4/CS-Hb-Fe3O4/CS “sandwich” configuration was constructed. This biosensor had a fast (less than 10 s) response to H2O2 and excellent linear relationships were obtained in the concentration range of 5.0 × 10⁻⁵ to 1.8 × 10⁻³ M and 1.8 × 10⁻³ to 6.8 × 10⁻³ M with a detection limit of 4.0 × 10⁻⁶ M (s/n = 3) under the optimum conditions. The apparent Michaelis-Menten constant Km was 0.29 mM and it showed the excellent biological activity of the fixed Hb. Moreover, the biosensor had long-time stability and good reproducibility. The method was used to determine H2O2 concentration in real samples.

Graphical Abstract

1. Introduction

Determination of hydrogen peroxide is of great interest because it is a by-product of several highly selective oxidases and it plays an important role in various fields such as food, pharmaceutical and environmental analysis [13]. Techniques for detecting H2O2 include titrimetry, chemiluminescence, spectrometry and electrochemical methods [4]. Among these techniques, electrochemical analyses have been extensively employed for determination of H2O2 because they offer intrinsic sensitivity, extended dynamic range and rapid response times [5].
Hemoglobin is a heme protein containing four electroactive iron hemes and it can store and transport oxygen in red blood cells [6]. It has commonly been employed to construct H2O2 biosensors as a result of its commercial availability and peroxidase activity [7]. However, the electron transfer reactivity of hemoglobin on conventional electrode surfaces is physiologically hampered, because its normal electroactive center is deeply buried in its electrochemically “insulated” peptide backbone [8]. Therefore many efforts have been made to enhance the electron transfer rate of hemoglobin by using mediators [911], promoters [1214] and a variety of immobilization materials such as polymer films [15], surfactants [16], and nanomaterials [1719].
In recent years, research has focused on magnetic nanoparticles. Due to their good biocompatibility, strong superparamagnetic properties, low toxicity and easy preparation processes, magnetic nanoparticles have been used in various fields, including enzyme immobilization [2023]. As one of the most important materials, a biocompatible ferromagnetic material could interact with proteins via some active groups such as -OH, -COOH, -NH2, without any denaturation of absorbed proteins [24,25] and could serve as a modifier to promote electron transfer reactions [26], so there has been very intense research on this topic in the field of biosensors [27,28]. One of the main problems in the application of superparamagnetic nanoparticles is surface modification with various useful materials which can tailor them for specific applications in drug targeting, immobilization of enzymes, immunology, cell separation process and so on [29]. The polymer magnetic microsphere is one kind of useful magnetic carrier that can be synthesized by coating a layer of polymer film onto the magnetic nanoparticles. It has been successfully applied in enzyme immobilization for its abundant functional groups. Qiu et al. synthesized magnetic core-shell Fe3O4@SiO2 nanoparticles and constructed a glucose biosensor using amino-functionalized Fe3O4@SiO2 nanoparticles covalently bound with ferrocene monocarboxylic acid as the building block [30]. Lai et al. prepared a kind of magnetic microsphere and Hb could be immobilized on the surface of the microspheres by cross-linking with glutaraldehyde [31].
Chitosan (CS) has various desirable properties, e.g., biocompatibility, low toxicity, good film forming propertied, high mechanical strength and high hydrophilicity, so it has been a rather important material for preparation of magnetic carriers. Recently, chemically modified electrodes and enzymatic biosensors with chitosan have been reported for determination of Fe3+ [32], Pd2+ [33], H2O2 [34], glucose [35], cholesterol [36], etc. To the best of our knowledge, most previous research on magnetic microspheres in various fields, including enzyme immobilization, has focused on iron oxide as the magnetic core. However, few studies were reported the use of microspheres in biosensors. In this study, a type of magnetic microsphere was prepared by suspension crosslinking using Fe3O4 nanoparticles and chitosan. An amperometric hydrogen peroxide biosensor with a sandwich configuration was fabricated for the first time based on an immobilized Hb modified electrode and the mediator hydroquinone (HQ).

2. Experimental Section

2.1. Apparatus

Cyclic voltammetric and amperometric experiments and EIS investigations were performed with a CHI660A electrochemical workstation (Shanghai Chenhua Instrument Co., China). The three-electrode system consisted of a platinum wire counter electrode, Ag/AgCl (saturated KCl) reference electrode, and modified glassy carbon electrode (3.0 mm diameter) as working electrode. All the electrochemical processes were in aerated solutions. Transmission electron micrograph (TEM) images were obtained with a JEM-200CX (JEOL, Japan) instrument.

2.2. Materials

Hb from bovine blood was obtained from Fluka. Chitosan (CS, 95% deacetylation) was bought from Shanghai Biochemical (Shanghai, China). d-glucose and 30% H2O2 were obtained from Guangzhou Chemical (Guangzhou, China). Disinfectant was purchased from South Land Pharmaceutical. Other reagents were of analytical reagent grade. All solutions were prepared with doubly distilled water. HQ was purchased from Sinopharm Chemical Co. Ltd., China. The exact concentration of H2O2 was determined by titration against a standard potassium permanganate solution.

2.3. Synthesis of Fe3O4 Nanoparticles [37]

Fe3O4 nanoparticles were synthesized by co-precipitation of Fe2+ and Fe3+ ions in the presence of alkaline solution under hydrothermal treatment. 5.2 g of FeCl3·6H2O and 2.0 g of FeCl2·4H2O were dissolved in 25 mL of 0.4 M HCl. The solution of the mixed iron-salts was added dropwise into a solution of 250 mL 1.5 M NaOH with vigorous stirring under an atmosphere of nitrogen gas. Then the obtained black precipitate was heated at 75 °C for 30 min. The precipitate was collected through centrifugation at 4,000 rpm, washed sequentially with distilled water and ethanol. A black colored powder (Fe3O4 nanoparticles) was obtained upon drying under vacuum at 60 °C for 6 h.

2.4. Preparation of Magnetic Microspheres (Fe3O4/CS) [31]

The suspension cross-linking technique was used for the preparation of magnetic microspheres. A 20 mL 2.5% chitosan solution containing 0.4 g Fe3O4 nanoparticles was prepared using a 3% acetic acid solution. Then it was poured, dropwise, into the dispersion medium composing of 80 mL paraffine oil and 5 mL Span-80 (a type of nonionic surfactant). At the same time, the dispersion medium was stirred with a magnetic stirrer at 1,500 rpm at room temperature. After thirty minutes, 1.0 M NaOH was added slowly to the dispersion medium to adjust the mixture to pH 10.0 at the stirring rate of 1200 rpm. Fifteen minutes later, 0.4 mL of epoxychloropropane was added to the medium and reacted for 40 min at 50 °C. Similarly, an additional 0.4 mL of epoxychloropropane was added to the dispersion and the stirring rate was lowered to 1,000 rpm. After 1 h, the mixture was continuously reacted for a further 2 h with a lower stirring rate of 800 rpm at the temperature of 60–70 °C. At the end of this period, the magnetic microspheres were collected using a magnet and washed consecutively with ether, acetone, 10% ethanol and doubly distilled water, then vacuum dried at 50 °C prior to storage for further analysis and use.

2.5. Configuration of Fe3O4/CS-Hb-Fe3O4/CS-GCE

A glassy carbon electrode (GCE, 3 mm in diameter) was polished with 1.0, 0.3, and 0.05 μm Al2O3 slurry, and rinsed thoroughly with doubly distilled water in order to obtain a mirror-like surface. Then it was sonicated in 1:1 nitric acid, absolute ethanol and doubly distilled water for 5 min, respectively, and allowed to dry at room temperature. 2.0 mg Fe3O4/CS was dispersed into 1.0 mL doubly distilled water with 15 min ultrasonic agitation and 2.0 mg mL−1 Fe3O4/CS suspension was obtained. 5 μL of this suspension was cast onto the surface of GCE, and then it was dried in air. One hour later, a drop of Hb (8 mg mL−1) with the volume of 10 μL was cast onto the surface of the modified GCE. After drying in air for approximately 5 h, the electrode was then coated with 5 μL Fe3O4/CS dispersion and dried for about 1 h. Finally, 5 μL 8% glutaraldehyde was dropped. The resulting Fe3O4/CS-Hb-Fe3O4/CS-GCE was obtained after the modified electrode was dried in air for 1 h and immersed in a 0.15 M PBS (pH 8.0) for 1 h to remove the redundant adsorption of Hb.

3. Results and Discussion

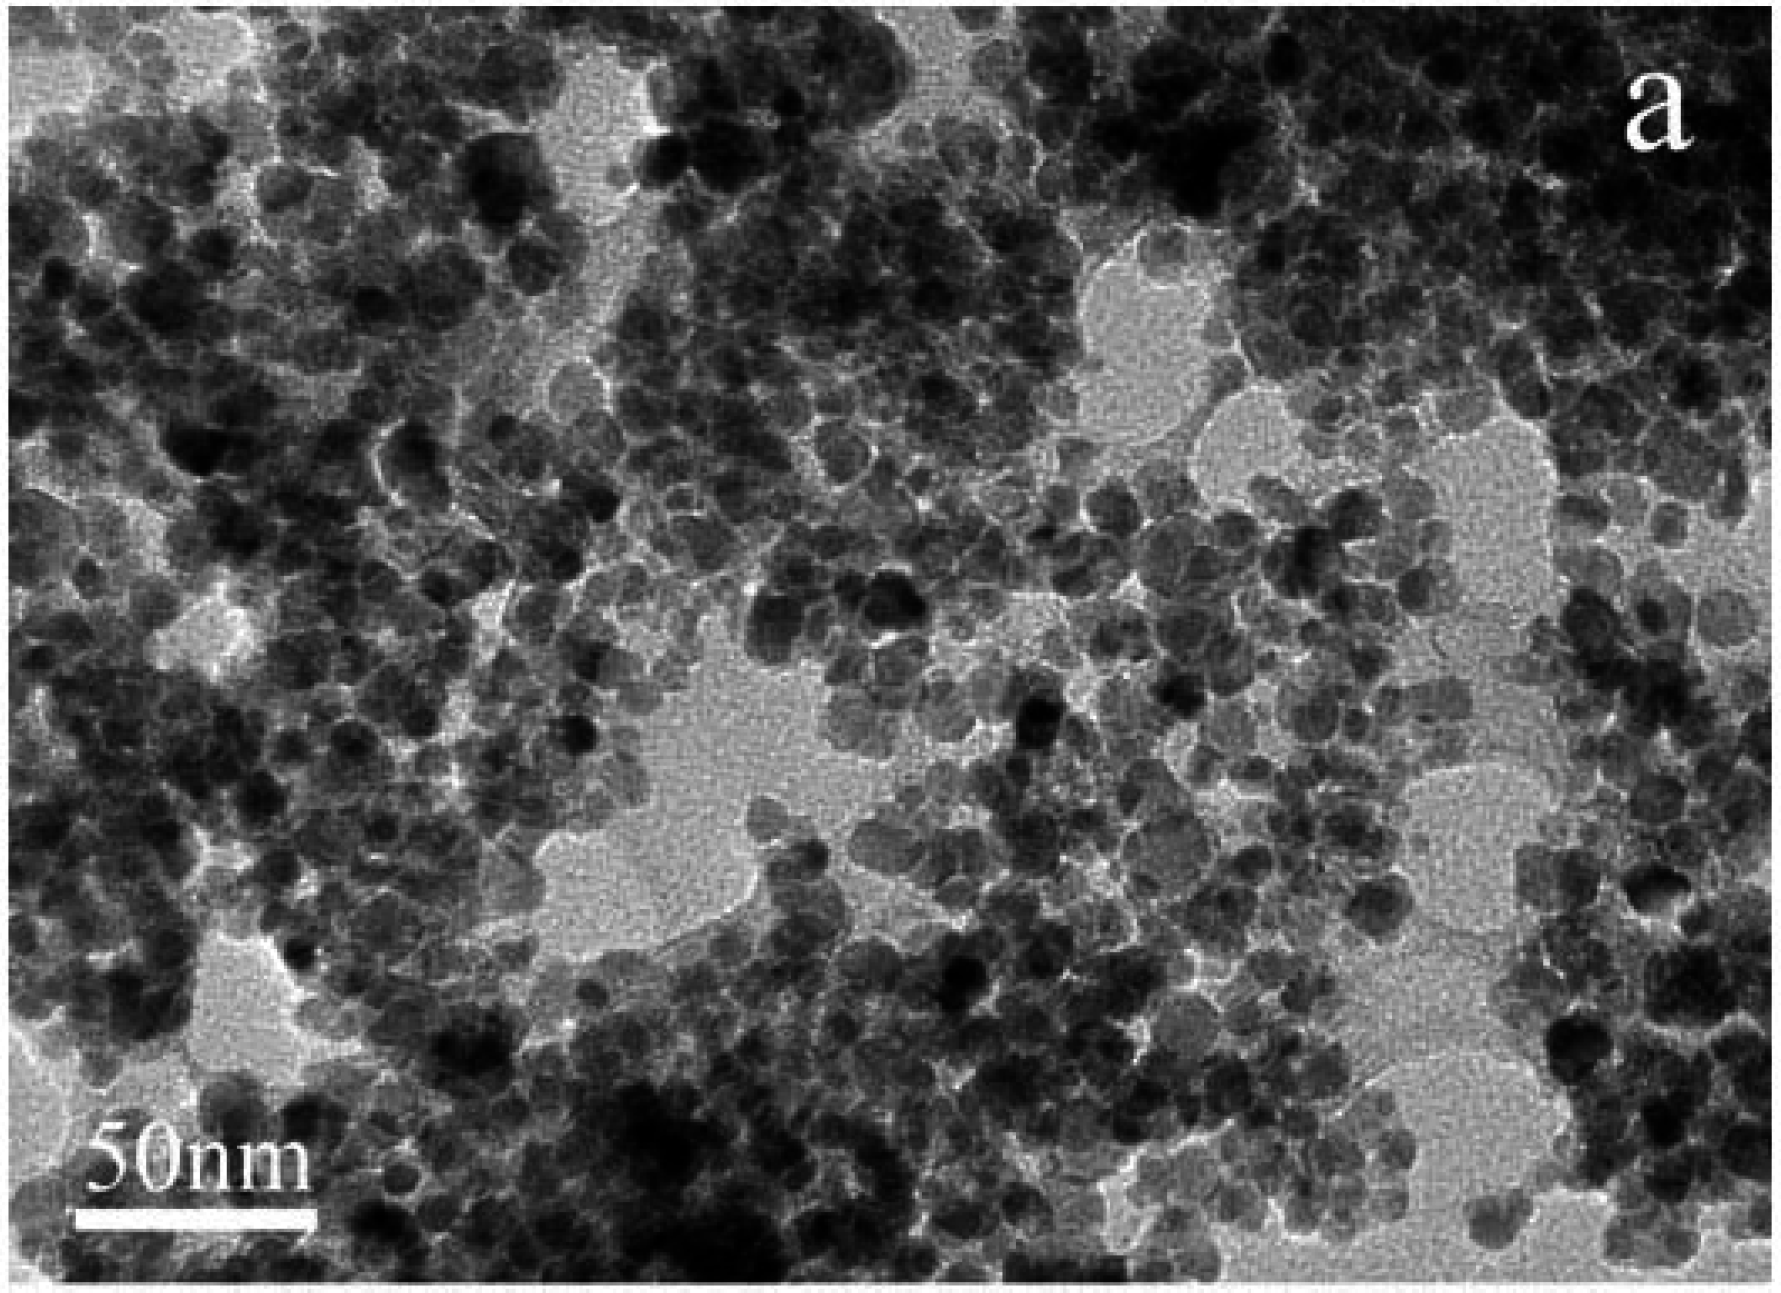
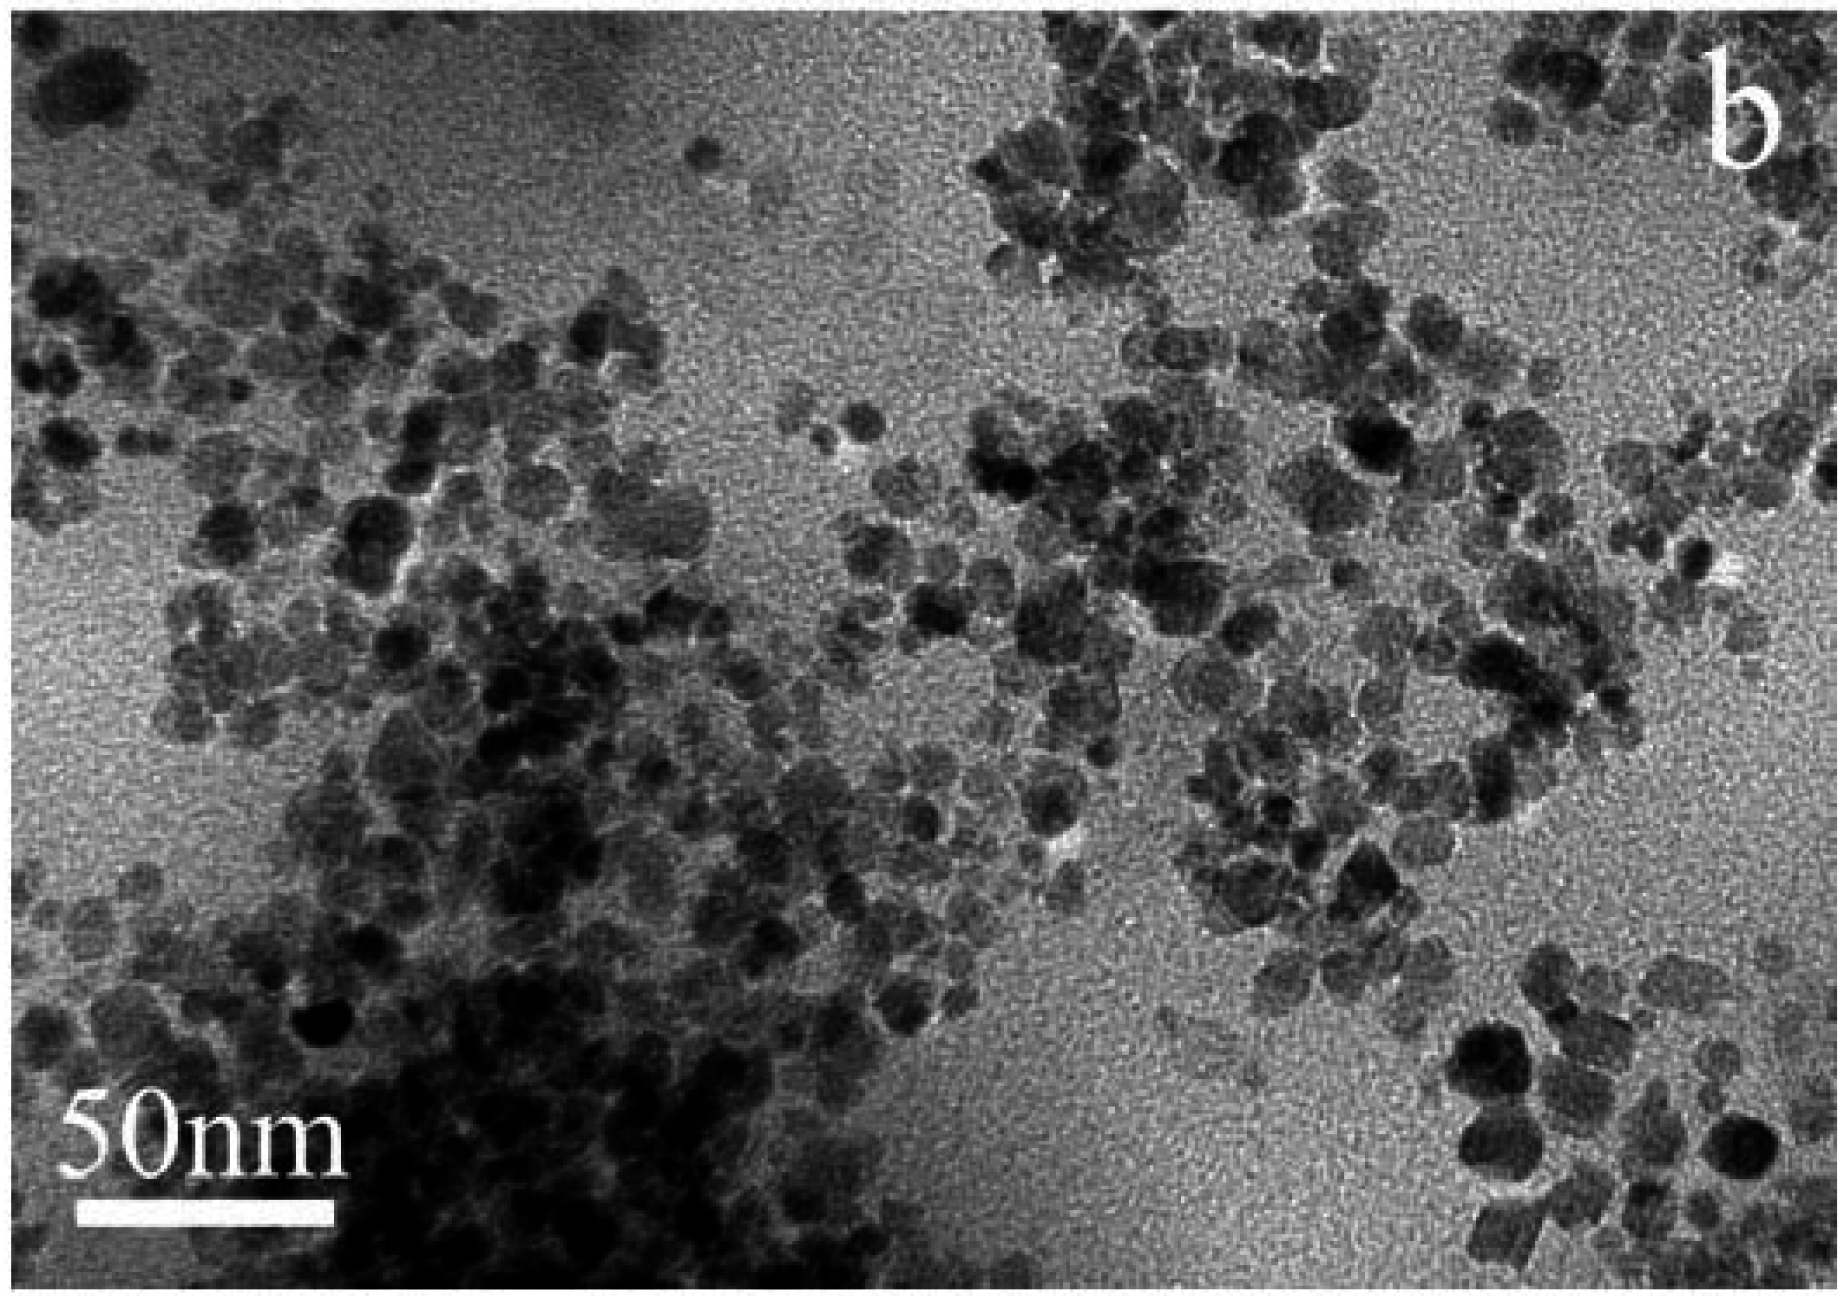
3.1. TEM Characterization of Fe3O4 Nanoparticles and Magnetic Microspheres

Figure 1 displays the TEM images of Fe3O4 nanoparticles (a) and magnetic microspheres (b). The Fe3O4 particles are nanosized and the average size is approximate 10 nm, with uniform distribution. The average diameter of microspheres is about 20 nm, which is larger than that of Fe3O4 nanoparticles, showing that the chitosan has been coated on the surface of the Fe3O4 nanoparticles.

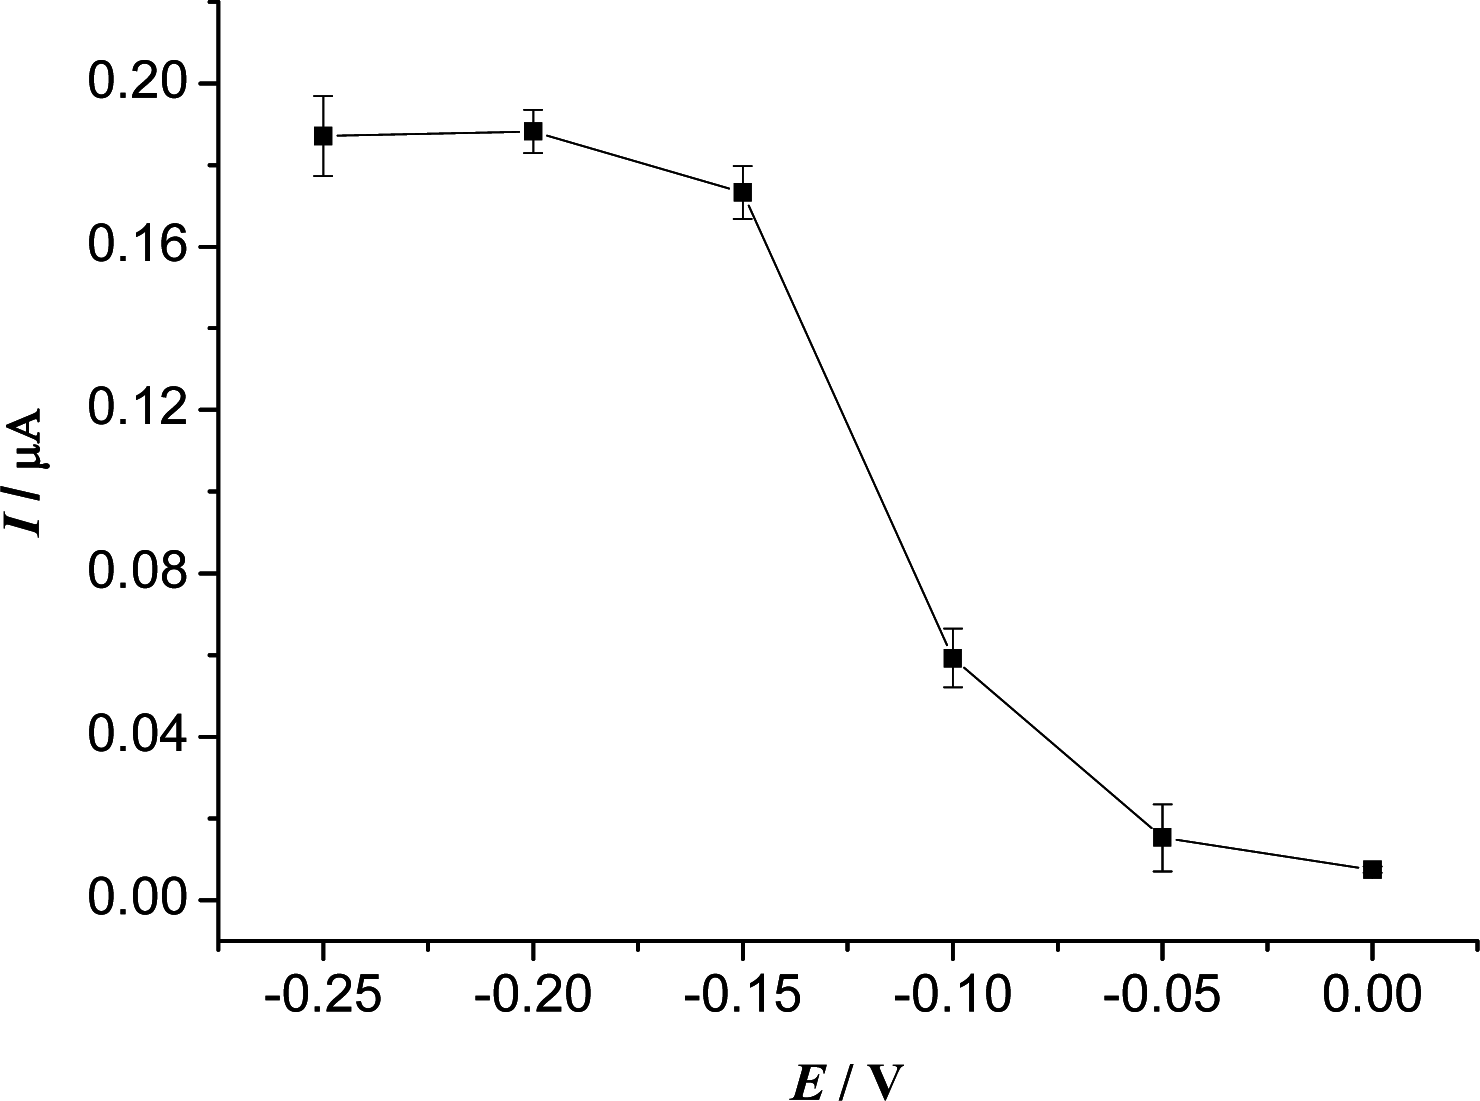
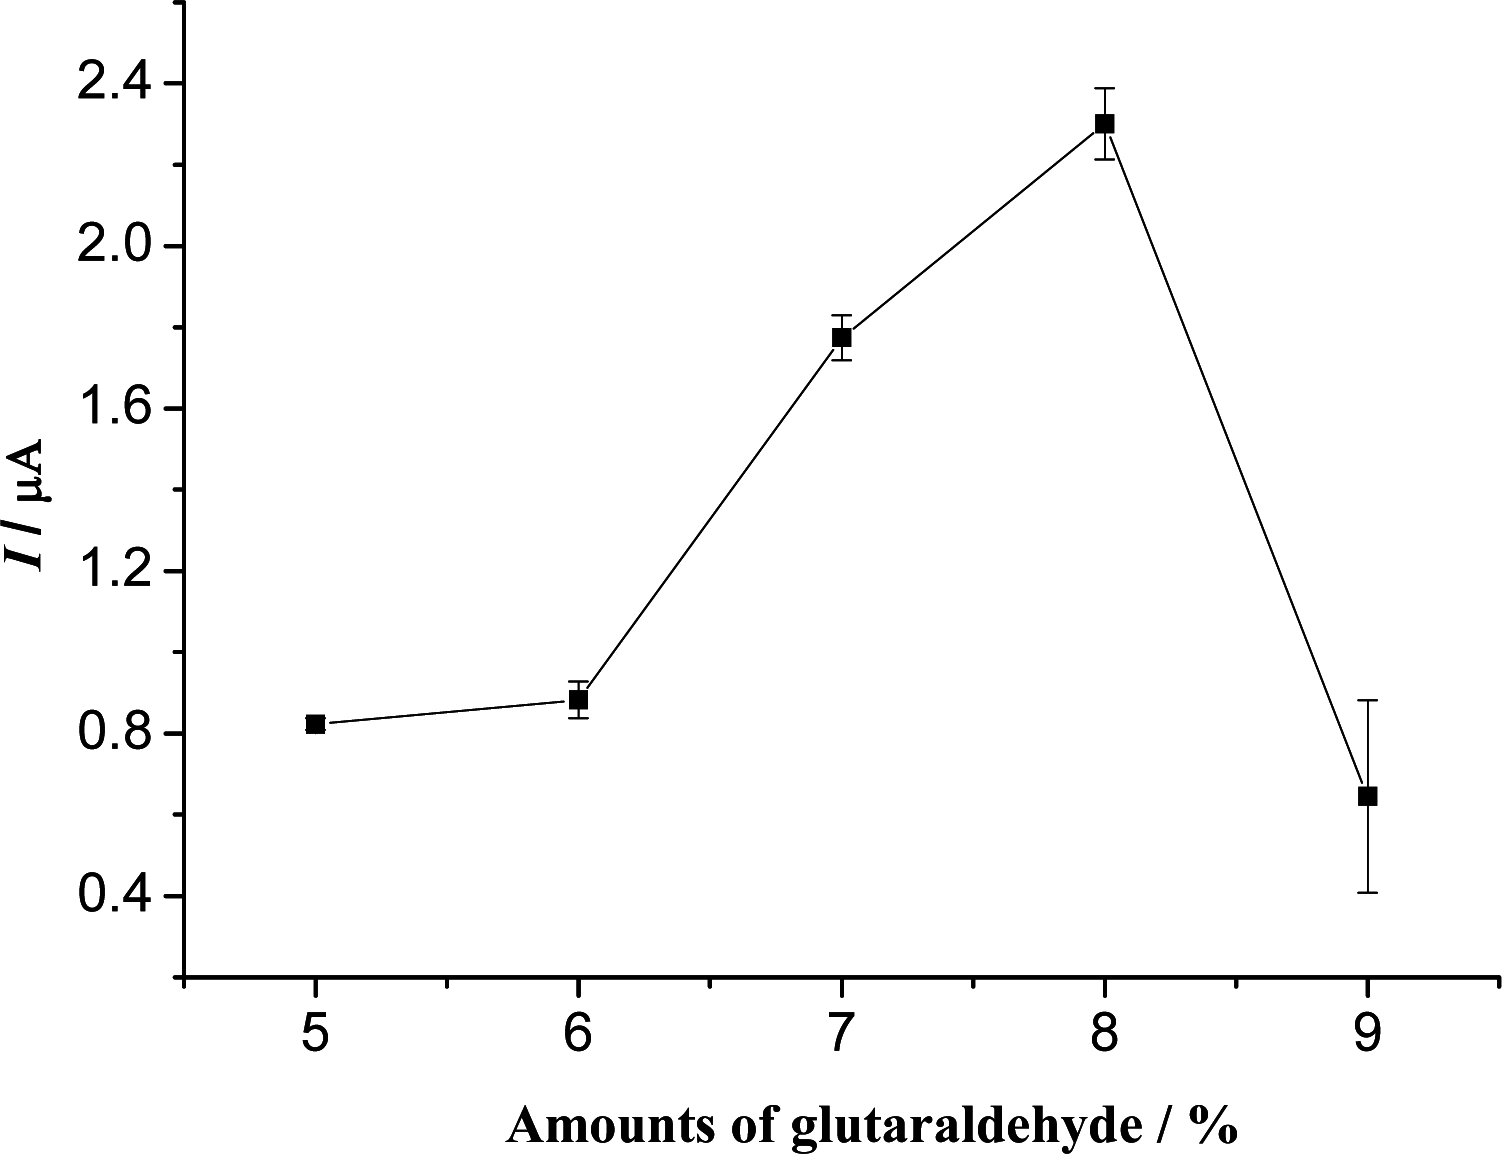
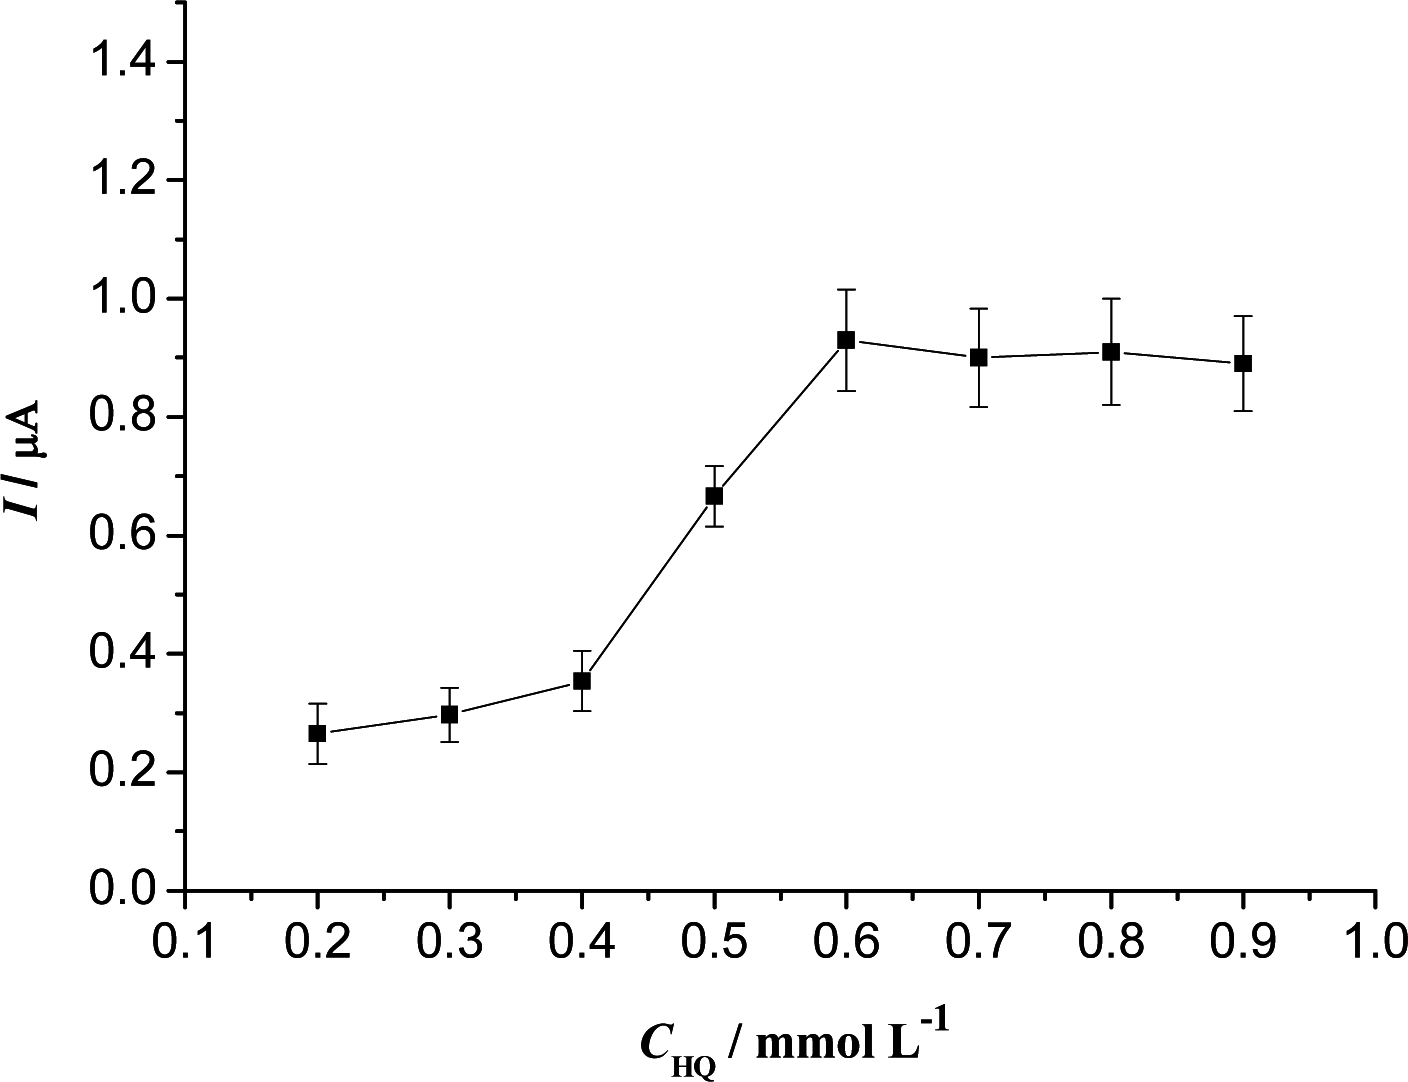
3.2. Optimization of Experimental Variables

To improve the performance of the biosensor, various factors influencing the response of the sensor such as amount of glutaraldehyde, the concentration of HQ, and the applied potential were investigated. Glutaraldehyde was used as a cross-linker in the construction of the biosensor. It plays an important role on the protein deposition, due to the cross-linking reaction between the amino groups of chitosan and the glyoxal groups of glutaraldehyde, and the glyoxal groups of glutaraldehyde and the amino groups of Hb. The effect of the concentration of glutaraldehyde used for the preparation of the biosensor is shown in Figure 2. It can be seen from Figure 2 that the biosensor prepared with 8% glutaraldehyde solution had a maximum response. The reason may be that: if the concentration of glutaraldehyde is low, the amount of immobilized protein is low and the response of the biosensor is low. However, if the concentration of glutaraldehyde is higher, the immobilization film is thicker, leading to a higher diffusion barrier. So 8% glutaraldehyde was selected as the cross linker.
As shown in Figure 3, the response of the modified electrode increased gradually as the HQ concentration was increased, reaching a maximal value of 6.0 × 10⁻⁴ M, and then the current did not change with further increases of the HQ concentration. Such a behavior is typical of a mediator-based sensor [38,39]. At a low HQ concentration, the current response is limited by enzyme-mediator kinetics. On the other hand, when the HQ concentration is too high, it results in a response limited by enzyme-substrate kinetics. However, a higher concentration of mediator produced a larger background current. Thus, 6.0 × 10⁻⁴ M HQ was chosen in the subsequent experiments.
Figure 4 shows the effect of the working potential on the steady-state current of the biosensor in the potential range from 0 to −0.25 V in pH 8.0 PBS containing 6.0 × 10⁻⁴ M HQ in the presence of 5.0 × 10⁻⁴ M H2O2. The steady-state current of electrocatalytic reduction of H2O2 increased gradually when the applied potential shifted from 0 to −0.15 V and then increased slowly as the potential became more negative from −0.15 to −0.25 V. Although a higher signal current was achieved at −0.25 V, the background current also increased distinctly. Moreover, lower potential can bring interferences from electroactive species. Therefore, −0.15 V was selected as the working potential for the amperometric measurement of H2O2.

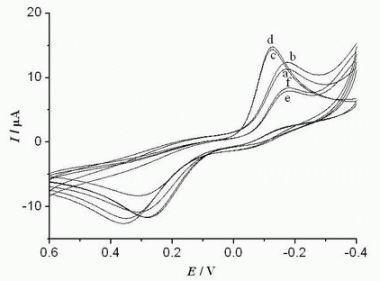
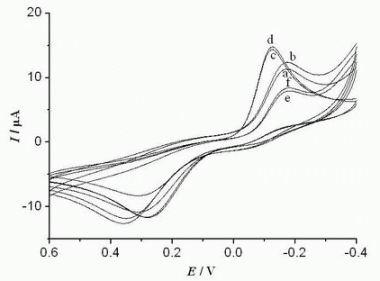
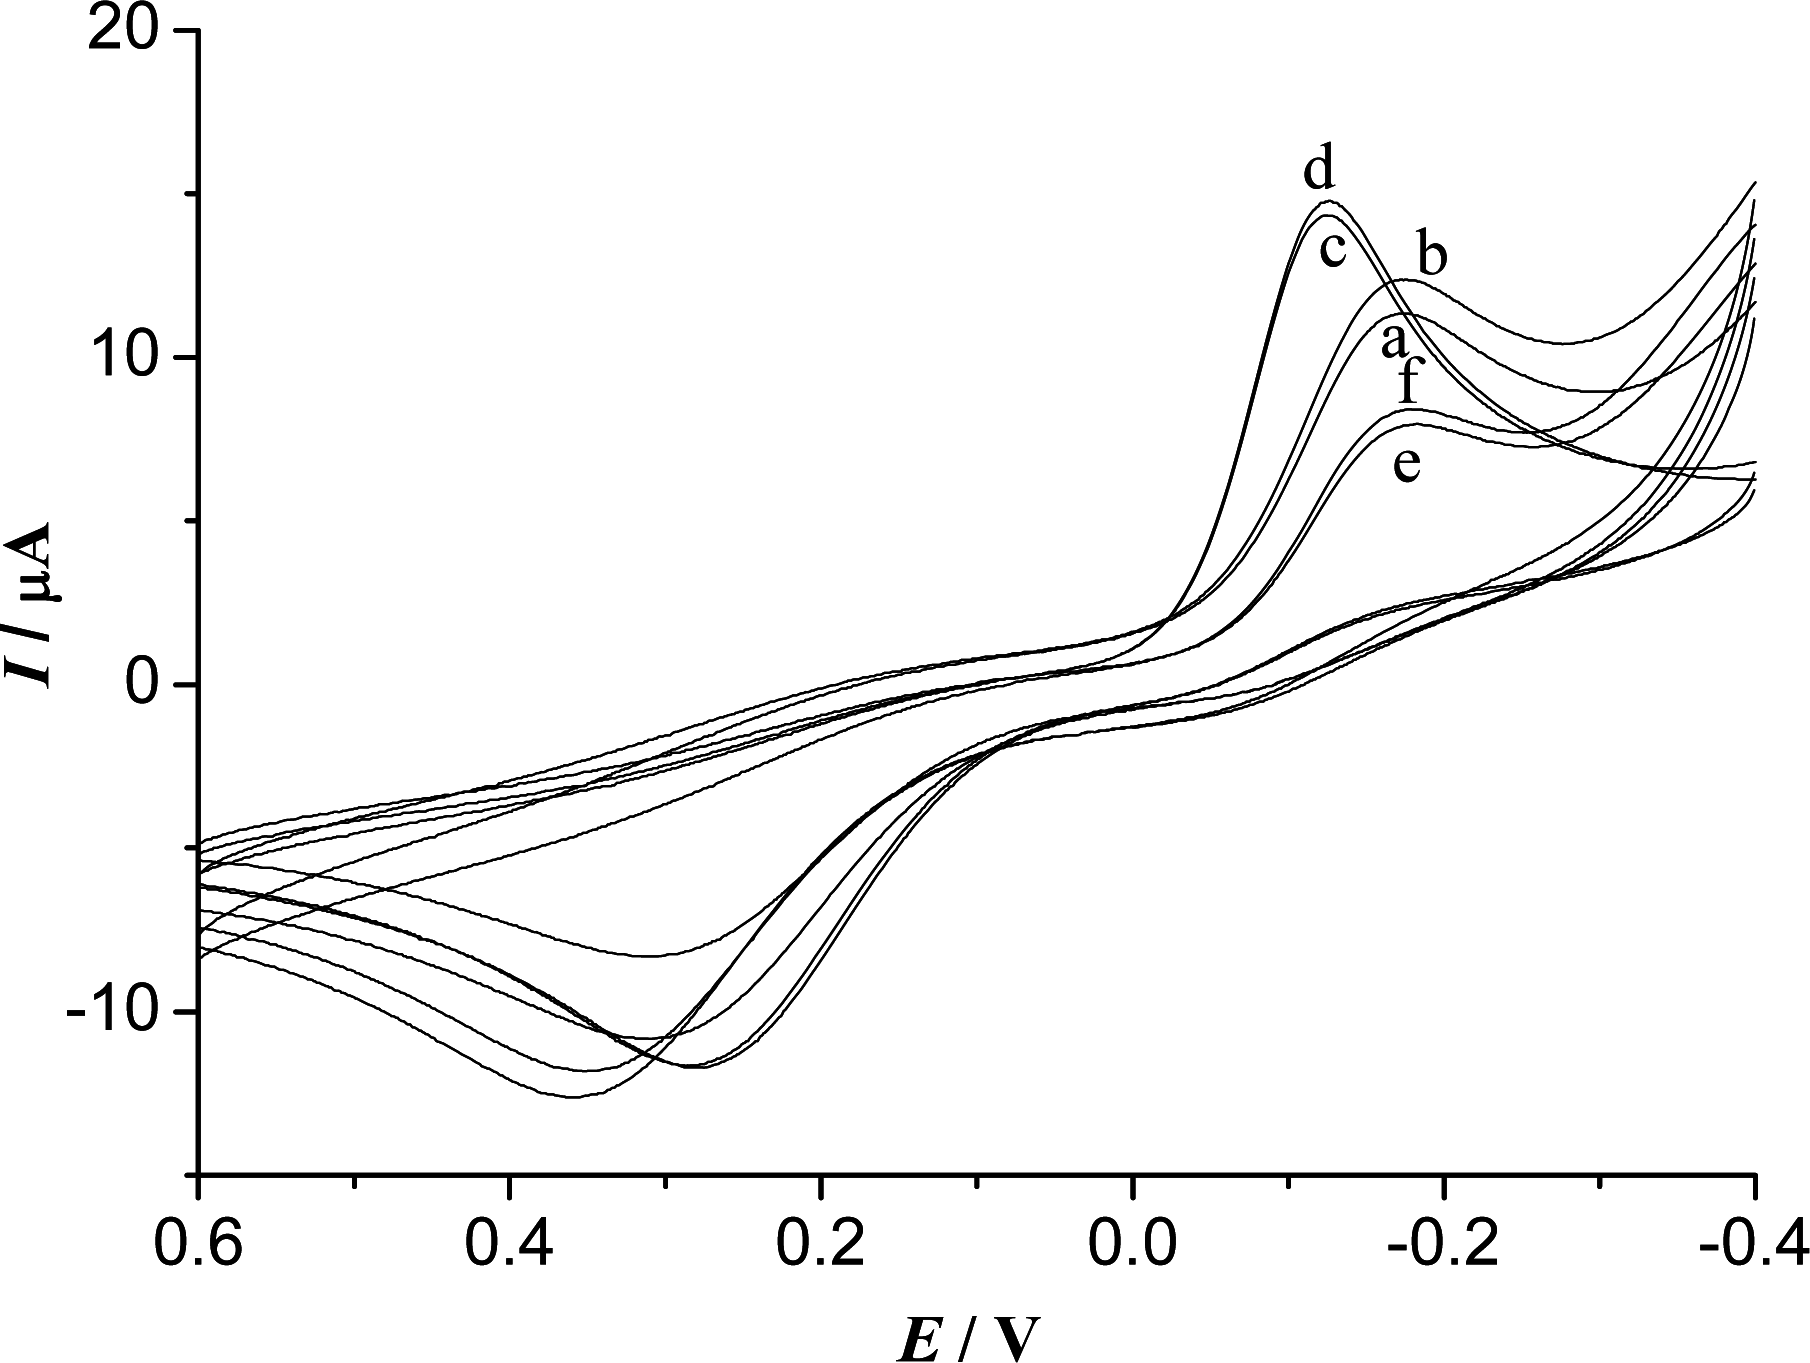
3.3. Electrochemical Characteristics of the Biosensor

Figure 5A shows the cyclic voltammograms of the Fe3O4/CS-Hb-Fe3O4/CS-GCE in 0.15 M pH 8.0 PBS containing 6.0 × 10⁻⁴ M HQ with different scan rates. Both anodic and cathodic peak currents increased linearly with the square root of scan rate (Figure 5B). From the results, we can confirm that a diffusion-controlled process occurred at the Fe3O4/CS-Hb-Fe3O4/CS-GCE. The result was consistent with the previous report [31].
Figure 6 shows the cyclic voltammograms of the different modified electrodes in the absence and presence of H2O2. As seen in Figure 6a and b, when 5.0 × 10⁻⁴ M H2O2 was added, the reduction current increased and the oxidation current decreased significantly at the Fe3O4/CS-Hb-Fe3O4/CS-GCE, indicating that an obviously catalytic reduction current of H2O2 was caused at the biosensor. However, hardly any clear current response to H2O2 can be observed at the Fe3O4/CS-GCE (c and d). The results demonstrated that the current response of the biosensor to H2O2 was mainly due to the catalytic reduction effect of Hb and the immobilized Hb remained its activity. The reason may be that the Fe3O4/CS can effectively absorb Hb and provide an excellent biocompatible environment on the electrode surface. The response to H2O2 of the Fe3O4/CS-Hb-Fe3O4/CS-GCE (a and b) was obviously larger than that of the Fe3O4/CS-Hb-GCE (e and f), suggesting that the “sandwich” configuration could more effectively promote the electron transfer. The reaction mechanism of the biosensor can be summarized as follows:
H 2 O 2 + Hb ( red ) H 2 O + Hb ( O )   ( Ox )   .. Hb ( O )   ( Ox ) + HQ ( Red ) Hb ( red ) + Q ( Ox ) + H 2 O Q ( Ox ) + 2 e + 2 H + HQ ( Red )
And the net reaction is H2O2 + 2e + 2H+ → 2H2O.

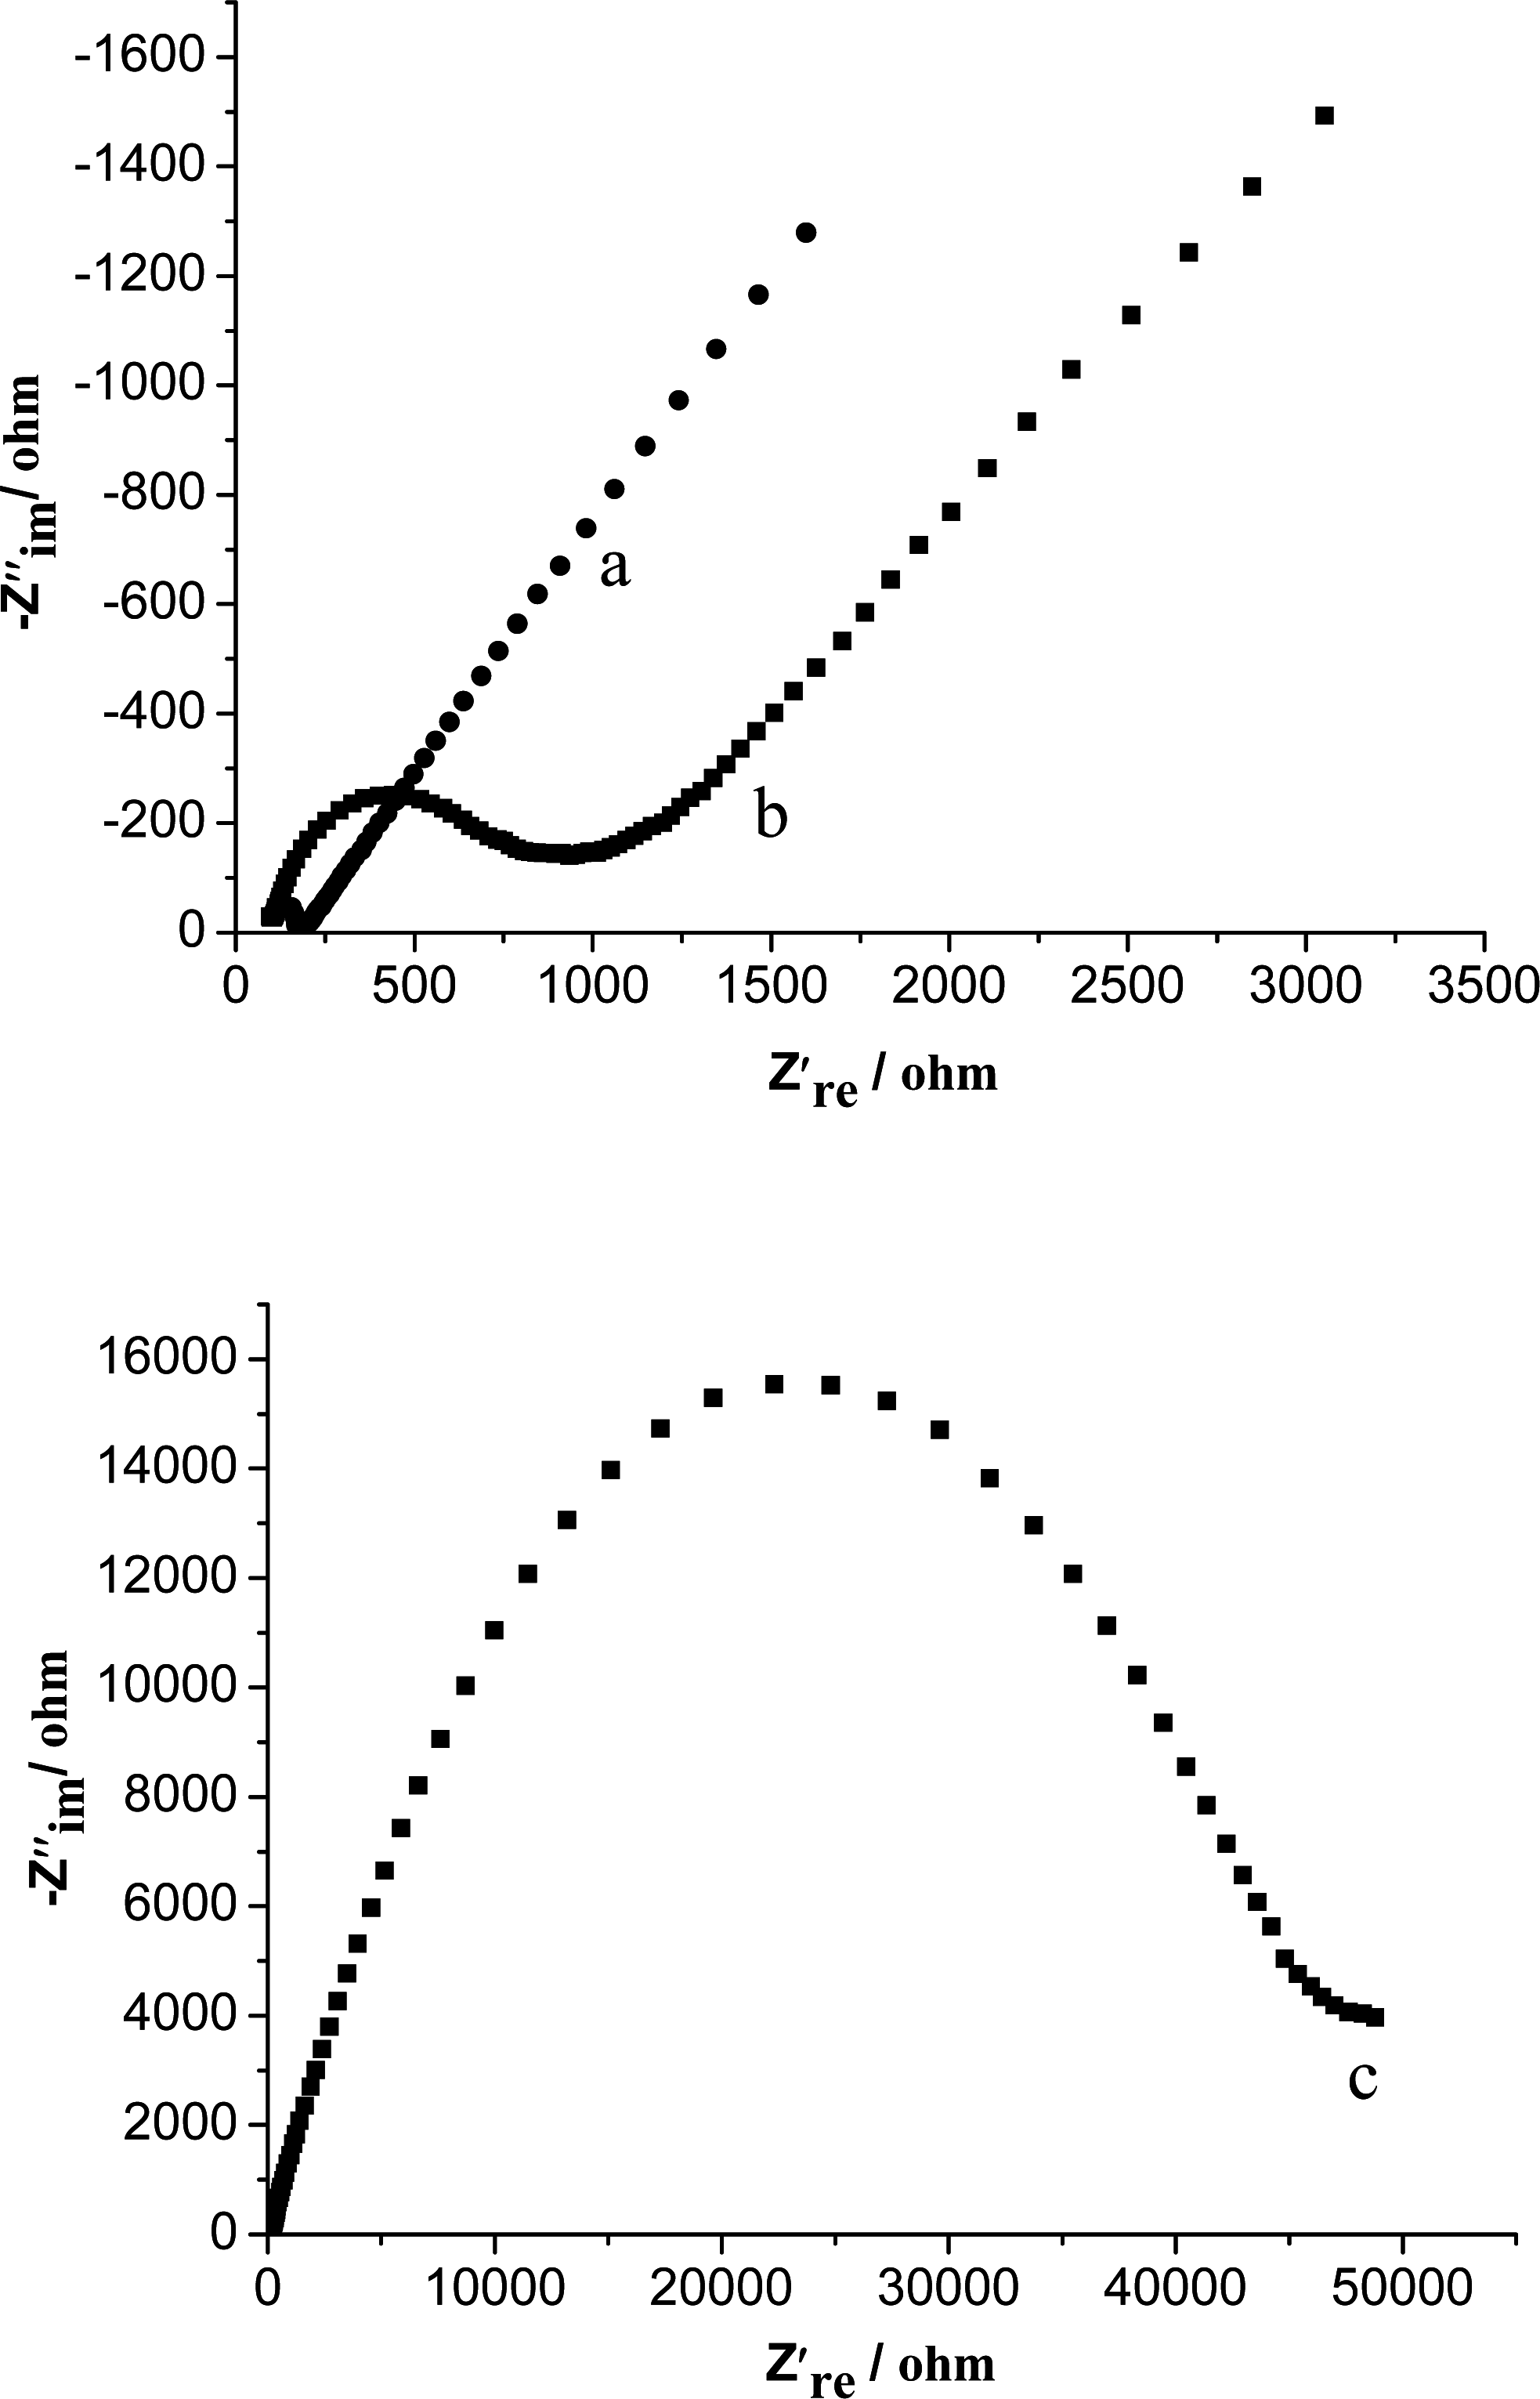
3.4. Electrochemical Impedance Spectroscopy Characterization

Electrochemical impedance spectroscopy (EIS) can provide useful information on the impedance changes of the electrode surface during the fabrication process. The Nyquist plot of the EIS includes a semicircular portion and a linear portion. The semicircle part at higher frequencies corresponds to the electron-transfer limited process. Its diameter is equal to the electron transfer kinetics resistance, Ret, which controls the electron transfer kinetics of the redox probe at the electrode interface [40]. Figure 7 displays the Nyquist plots of the EIS of bare GCE (a), Fe3O4/CS-GCE (b), and Fe3O4/CS-Hb-Fe3O4/CS-GCE (c) in 5.0 × 10⁻³ M K3Fe(CN)6/K4Fe(CN)6(1:1) containing 0.1 M KCl. The Nyquist diameter of the Fe3O4/CS-GCE is much larger than that of the bare GCE, which suggests that Fe3O4/CS coated on the electrode can block the electron transfer of the redox probe. Compared with the Fe3O4/CS-GCE, an obvious increase in the interfacial resistance is observed at the Fe3O4/CS-Hb-Fe3O4/CS-GCE, which indicated that Hb was immobilized successfully on the electrode. The Nyquist diameter of the Fe3O4/CS-GCE is much smaller than that of the MCMS/GCE [31], showing that Fe3O4 nanoparticles have more excellent conductivity than carbon-coated iron nanoparticles. However, the Ret of the Fe3O4/CS-Hb-Fe3O4/CS-GCE is obviously larger than that of Hb/MCMS/GCE [31]. This may be ascribed to the larger surface area of Fe3O4/CS and the specificity of the “sandwich” configuration, leading to more Hb immobilized onto the Fe3O4/CS-Hb-Fe3O4/CS-GCE.

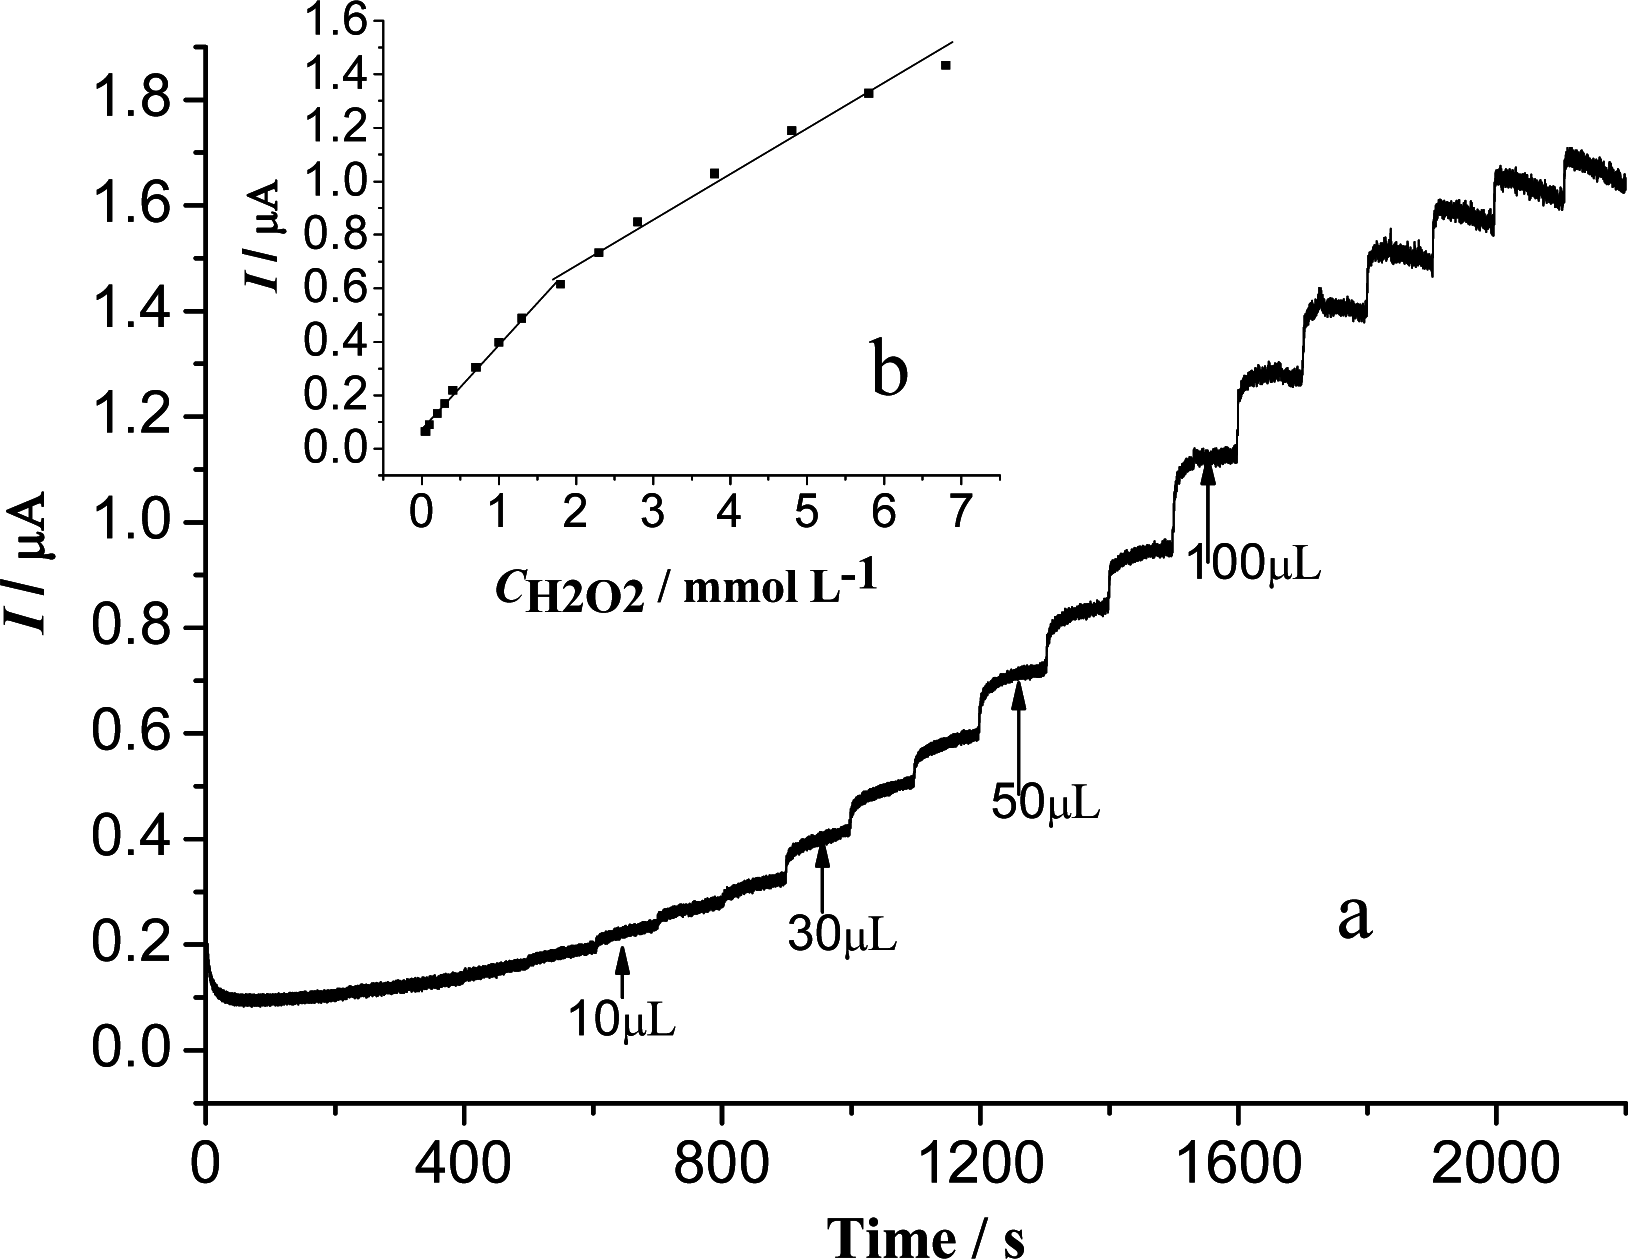
3.5. Amperometric Response of the H2O2 Biosensor

The typical steady-state amperometric response of the biosensor was investigated by successively increasing the H2O2 concentration under the optimized conditions. Figure 8 shows the chronoamperometric curve of the biosensor for successive addition of H2O2 in a magnetic stirring condition. When the H2O2 was added into the pH 8.0 PBS containing 6.0 × 10⁻⁴ M HQ, the biosensor responded rapidly to the substrate increase and achieved 95% of the steady current in 10 s. It is faster than the reported results of HRP that was immobilized on a hydrophilic matrix film modified glassy carbon electrode (40 s) [41]. This may result from the Fe3O4 nanoparticles that can facilitate the transfer of electrons. The inset shows the calibration curve between amperometric current and H2O2 concentration. Excellent linear relationships were obtained in the concentration range of 5.0 × 10⁻⁵–1.8 × 10⁻³ M and 1.8 × 10⁻³–6.8 × 10⁻³ M. The regression equations were expressed as ip (μA) = 0.07077 + 0.3150c (mM), R = 0.997 and ip (μA) = 0.3673 + 0.1340c (mM), R = 0.993. The detection limit of the biosensor was estimated as 4.0 × 10⁻⁶ M at a signal to noise ratio of 3. The linear ranger is broader than that of the Hb/MCMS/GCE (MCMS were prepared using carbon-coated iron nanoparticles as the magnetic core) [31]. The result indicates that the magnetic microspheres in the experiment displayed better catalytic ability than the microspheres using the magnetic core of carbon-coated iron nanoparticles.
The apparent Michaelis-Menten constant (Kmapp), which reflects the enzymatic affinity and the ratio of microscopic kinetic constants, can be obtained from electrochemical version of the Lineweaver-Burk equation [42]. Kmapp is calculated to be 0.29 mM, which is smaller than that those of 0.68 mM for Hb in hydrophilic matrix film modified electrode [41], 0.75 mM for Hb in chitosan/nano-CaCO3 composite electrode [43], and 0.898 mM for Hb in silica sol-gel film modified electrode [44]. These results suggest that the immobilized Hb remains its activity to H2O2 reduction and the biosensor has high affinity to H2O2.

3.6. Interference and Selectivity

Interference experiments for the biosensor were performed by comparing the amperometric responses to 5.0 × 10⁻⁴ M H2O2 before and after addition of possible interferents to 0.15 M pH 8.0 PBS containing 6.0 × 10⁻⁴ M HQ. The results from the test are listed in Table 1. In the experiments, 1.0 × 10⁻³ M glucose, l-cystine, l-lysine, l-glycine and uric acid did not cause any observable interference. However, an obvious interference was observed when 5.0 × 10⁻³ M ascorbic acid was added. The reason may be that the electroactive ascorbic acid can be oxidized by the HQ mediator. So the oxidation form of the mediator can be reduced and the cyclic catalytic reaction is destroyed [45].

3.7. Biosensor Repeatability and Stability

The repeatability of the biosensor was examined using the same electrode in the presence of 5.0 × 10⁻⁴ M H2O2. The relative standard deviation (RSD) was 4.6% for five successive assays. The fabrication repeatability of five Hb electrodes, prepared independently, shows an acceptable reproducibility, with a RSD of 4.8% for the response to the same concentration of H2O2. The biosensor was stored in a pH 8.0 PBS at 4 °C and measured intermittently (every 2 days). After 30 days, the biosensor retained about 89.5% of its original response. The stability of the biosensor is much better than that of previous biosensor [39]. Good long-term stability can be attributed to the sandwich configuration, which can more effectively immobilize Hb.

3.8. Analytical Application of the Biosensor

The accuracy of the biosensor was evaluated by determining the recoveries of hydrogen peroxide in a disinfectant using a standard addition method. Corresponding experiments were carried out with the titration method and the results displayed good consistent and precision between the two methods, as listed in Table 2. As seen in Table 2, the results obtained by the biosensor are satisfactory, with the recovery ranging from 98.1% to 107.7%.

4. Conclusions

Recently there has been increasing interest in in surface modification of magnetic nanoparticles with various useful materials. In this article, we introduced an amperometric H2O2 biosensor based on a Hb and Fe3O4/CSa “sandwich” configuration. The abundant amino groups present in Fe3O4/CS provide a biocompatible environment for Hb immobilization and glutaraldehyde acts as the cross linker. The biosensor exhibited a fast response to H2O2, and excellent linear relationships were obtained in the concentration range from 5.0 × 10⁻⁵ to 1.8 × 10⁻³ M and 1.8 × 10⁻³ to 6.8 × 10⁻³ M under the optimized experimental conditions, with a detection limit of 4.0 × 10⁻⁶ M (s/n = 3). The selectivity, repeatability and stability of the biosensor were also investigated, with satisfactory results, so this method could be used to construct a H2O2 biosensor for a variety of applications.

Acknowledgments

This work was supported by the Natural Science Foundation of Guangxi Zhuang Autonomous Region (No. 0639025, No.0991084), Support Program for 100 Young and Middle-aged Disciplinary Leaders in Guangxi Higher Education Institutions (No. RC20060703005), Key Laboratory of Development and Application of Forest Chemicals of Guangxi (GXFC08-06), the Education Department of Guangxi Zhuang Autonomous Region (No. 200807MS074) and the Innovation Project of Guangxi University for Nationalities (gxun-chx2009081).

References and Notes

  1. Forzani, E.S.; Rivas, G.A.; Solis, V.M. Amperometric determination of dopamine on an enzymatically modified carbon paste electrode. J. Electroanal. Chem 1995, 382, 33–40. [Google Scholar]
  2. Kulys, J.; Gorton, L.; Domingues, E.; Emnéus, J.; Jarskog, H. Electrochemical characterization of carbon pastes modified with proteins and polycations. J. Electroanal. Chem 1994, 372, 49–55. [Google Scholar]
  3. Kulys, J.; Wang, L.Z.; Maksimoviene, A. L-Lactate oxidase electrode based on methylene green and carbon paste. Anal. Chim. Acta 1993, 274, 53–58. [Google Scholar]
  4. Lei, C.X.; Hu, S.Q.; Shen, G.L.; Yu, R.Q. Immobilization of horseradish peroxidase to a nano-Au monolayer modified chitosan-entrapped carbon paste electrode for the detection of hydrogen peroxide. Talanta 2003, 59, 981–988. [Google Scholar]
  5. Tripathi, V.S.; Kandimalla, V.B.; Ju, H.X. Amperometric biosensor for hydrogen peroxide based on ferrocene-bovine serum albumin and multiwall carbon nanotube modified ormosil composite. Biosens. Bioelectron 2006, 21, 1529–1535. [Google Scholar]
  6. Zhang, Z.; Chouchane, S.; Magliozzo, R.S.; Rusting, J.F. Direct voltammetry and catalysis with mycobacterium tuberculosis catalase-peroxidase, peroxidases and catalase in lipid films. Anal. Chem 2002, 74, 163–170. [Google Scholar]
  7. Wade, R.S.; Castro, C.E. Oxidation of heme proteins by alkyl halides. J. Am. Chem. Soc 1973, 95, 231–234. [Google Scholar]
  8. Schlereth, D.; Mantele, W. Redox-Induced conformational changes in myoglobin and hemoglobin: Electrochemistry and ultraviolet-visible and Fourier transform infrared difference spectroscopy at surface-modified gold electrodes in an ultra-Thin-Layer spectroelectrochemical cell. Biochemistry 1992, 31, 7494–7502. [Google Scholar]
  9. Ye, J.; Baldwin, R.P. Catalytic reduction of myoglobin and hemoglobin at chemically modified electrodes containing methylene blue. Anal. Chem 1988, 60, 2263–2268. [Google Scholar]
  10. Reed, D.E.; Hawkridge, F.M. Direct electron transfer reactions of cytochrome C at silver electrodes. Anal. Chem 1987, 59, 2334–2339. [Google Scholar]
  11. Fan, C.H.; Wang, H.Y.; Sun, S.; Zhu, D.X.; Wagner, G.; Li, G.X. Electron-transfer reactivity and enzymatic activity of hemoglobin in a SP sephadex membrane. Anal. Chem 2001, 73, 2850–2854. [Google Scholar]
  12. Sun, H.; Hu, N.F.; Ma, H.Y. Direct electrochemistry of hemoglobin in polyacrylamide hydrogel films on pyrolytic graphite electrodes. Electroanalysis 2000, 12, 1064–1070. [Google Scholar]
  13. Liu, S.Q.; Dai, Z.H.; Chen, H.Y.; Ju, H.X. Immobilization of hemoglobin on zirconium dioxide nanoparticles for preparation of a novel hydrogen peroxide biosensor. Biosens. Bioelectron 2004, 19, 963–969. [Google Scholar]
  14. Li, Q.W.; Luo, G.A.; Feng, J. Direct electron transfer for heme proteins assembled on nanocrystalline TiO2 film. Electroanalysis 2001, 13, 359–363. [Google Scholar]
  15. Kafi, A.K.M.; Lee, D.Y.; Park, S.H.; Kwon, Y.S. A hydrogen peroxide biosensor based on peroxidase activity of hemoglobin in polymeric film. J. Nanosci. Nanotechnol 2007, 7, 4005–4008. [Google Scholar]
  16. Lu, Z.Q.; Huang, Q.D.; Rusling, J.F. Films of hemoglobin and didodecyldimethylammonium bromide with enhanced electron transfer rates. J. Electroanal. Chem 1997, 423, 59–66. [Google Scholar]
  17. Kumar, S.A.; Lo, P.H.; Chen, S.M. Electrochemical analysis of H2O2 and nitrite using copper nanoparticles/poly(o-phenylenediamine) film modified glassy carbon electrode. J. Electrochem. Soc 2009, 156, E118–E123. [Google Scholar]
  18. Lo, P.H.; Kumar, S.A.; Chen, S.M. Amperometric determination of H2O2 at nano-TiO2/DNA/thionin nanocomposite modified electrode. Colloids Surf. B 2008, 66, 266–273. [Google Scholar]
  19. Kumar, S.A.; Lo, P.H.; Chen, S.M. Electrochemical synthesis and characterization of TiO2 nanoparticles and their use as a platform for flavin adenine dinucleotide immobilization and efficient electrocatalysis. Nanotechnology 2008, 19, 255501:1–255501:7. [Google Scholar]
  20. Vázquez, M.; Luna, C.; Morales, M.P.; Sanz, R.; Serna, C.J.; Mijangos, C. Magnetic nanoparticles: synthesis, ordering and properties. Phys. B 2004, 354, 71–79. [Google Scholar]
  21. Lu, A.H.; Salabas, E.L.; Schüth, F. Magnetic nanoparticles: synthesis protection, functionalization and application. Angew. Chem. Int. Ed 2007, 46, 1222–1244. [Google Scholar]
  22. Osaka, T.; Matsunaga, T.; Nakanishi, T.; Arakaki, A.; Niwa, D.; Iida, H. Synthesis of magnetic nanoparticles and their application to bioassays. Anal. Bioanal. Chem 2006, 384, 593–600. [Google Scholar]
  23. Pankhurst, Q.A.; Connolly, J.; Jones, S.K.; Dobson, J. Applications of magnetic nanoparticles in biomedicine. J. Phys. D: Appl. Phys 2003, 36, R167–R181. [Google Scholar]
  24. Koneraacká, M.; Kopcansky, P.; Antalik, M.; Timko, M.; Ramchand, C.N.; Lobo, D.; Mehta, R.V.; Upadhyay, R.V. Immobilization of proteins and enzymes to fine magnetic particles. J. Magn. Magn. Mater 1999, 201, 427–430. [Google Scholar]
  25. Chan, H.T.; Do, Y.Y.; Huang, P.L.; Chien, P.L.; Chan, T.S.; Liu, R.S.; Huang, C.Y.; Yang, S.Y.; Horng, H.E. Preparation and properties of bio-compatible magnetic Fe3O4 nanoparticles. Magn. Magn. Mater 2006, 304, 415–417. [Google Scholar]
  26. Gong, J.M.; Lin, X.Q. Facilitated electron transfer of hemoglobin embedded in nanosized Fe3O4 matrix based on paraffin impregnated graphite electrode and electrochemical catalysis for trichloroacetic acid. Microchem. J 2003, 75, 51–57. [Google Scholar]
  27. Fan, A.P.; Lau, C.W.; Lu, J.Z. Magnetic based-based chemiluminescent metal immunoassay with a colloidal gold label. Anal. Chem 2005, 77, 3238–3242. [Google Scholar]
  28. Kouassi, G.K.; Irudayaraj, J. Magnetic and gold-coated magnetic nanoparticles as a DNA sensor. Anal. Chem 2006, 78, 3234–3241. [Google Scholar]
  29. Cho, Y.J.; Song, H.; Lee, K.; Kim, K.; Kwak, K.; Kim, S.; Park, J.T. The first observation of four-electron reduction in [60]fullerene-metal cluster self-assembled monolayers(SAMs). Chem. Commun 2002, 2, 2966–2967. [Google Scholar]
  30. Qiu, J.D.; Peng, H.P.; Liang, R.P. Ferrocene-modified Fe3O4@SiO2 magnetic nanoparticles as building block for construction of reagentless enzyme-based biosensosr. Electrochem. Commun 2007, 9, 2734–2738. [Google Scholar]
  31. Lai, G.S.; Zhang, H.L.; Han, D.Y. A novel hydrogen peroxide biosensor based on hemoglobin immobilized on magnetic chitosan microspheres modified electrode. Sens. Actuat. B 2008, 129, 497–503. [Google Scholar]
  32. Lu, G.H.; Yao, X.; Wu, X.G.; Zhang, T. Determination of the total iron by chitosan-modified glassy carbon electrode. Microchem. J 2001, 69, 81–87. [Google Scholar]
  33. Ye, X.Z.; Yang, Q.H.; Wang, Y.; Li, N.Q. Electrochemical behaviour of gold, sliver, platinum and palladium on the glass carbon electrode modified by chitosan and its application. Talanta 1998, 47, 1099–1106. [Google Scholar]
  34. Wang, G.; Xu, J.J.; Chen, H.Y.; Lu, Z.H. Amperometric hydrogen peroxide biosensor with sol-gel/chitosan network-like film as immobilization matrix. Biosens. Bioelectron 2003, 18, 335–343. [Google Scholar]
  35. Tan, X.C.; Tian, Y.X.; Cai, P.X.; Zou, X.Y. Glucose biosensor based on glucose oxidase immobilized in sol-gel chitosan/silica hybrid composite film on Prussian blue modified glass carbon electrode. Anal. Bioanal. Chem 2005, 381, 500–507. [Google Scholar]
  36. Tan, X.C.; Li, M.J.; Cai, P.X.; Luo, L.J.; Zou, X.Y. An amperometric cholesterol biosensor based on multiwalled carbon nanotubes and organically modified sol-gel/chitosan hybrid composite film. Anal. Biochem 2005, 337, 111–120. [Google Scholar]
  37. Reddy, K.R.; Lee, K.P.; Gopalan, A.I. Self-assembly approach for the synthesis of electro-magnetic functionalized Fe3O4/polyaniline nanocomposites: Effect of dopant on the properties. Colloids Surf. A 2008, 320, 49–56. [Google Scholar]
  38. Xiao, Y.; Ju, H.X.; Chen, H.Y. Hydrogen peroxide sensor based on horseradish peroxidase-labeled Au colloids immobilized on gold electrode surface by cysteamine monolayer. Anal. Chim. Acta 1999, 391, 73–82. [Google Scholar]
  39. Zhang, H.L.; Zou, X.Z.; Han, D.Y. Hydrogen peroxide sensor based on hemoglobin immobilized on glassy carbon electrode with SiO2 nanoparticles/Chitosan film as immobilization matrix. Anal. Lett 2007, 40, 661–676. [Google Scholar]
  40. Kharitonov, A.B.; Alfonta, L.; Katz, E.; Willner, I. Probing of bioaffinity interactions at interfaces using impedance spectroscopy and chronopotentiometry. J. Electroanal. Chem 2000, 487, 133–141. [Google Scholar]
  41. Xiong, H.Y.; Chen, T.; Zhang, X.H.; Wang, S.F. High performance and stability of a hemoglobin-biosensor based on an ionic liquid as nonaqueous media for hydrogen peroxide monitoring. Electrochem. Commun 2007, 9, 2671–2675. [Google Scholar]
  42. Kamin, R.A.; Willson, G.S. Rotating ring-disk enzyme electrode for biocatalysis kinetic studies and characterization of the immobilized enzyme layer. Anal. Chem 1980, 52, 1198–1205. [Google Scholar]
  43. Shan, D.; Wang, S.X.; Xue, H.G.; Cosnier, S. Direct electrochemistry and electrocatalysis of hemoglobin entrapped in composite matrix based on chitosan and CaCO3 nanoparticles. Electrochem. Commun 2007, 9, 529–534. [Google Scholar]
  44. Wang, Q.L.; Lu, G.X.; Yang, B.J. Direct electrochemistry and electrocatalysis of hemoglobin immobilized on carbon paste electrode by silica sol–gel film. Biosens. Bioelectron 2004, 19, 1269–1275. [Google Scholar]
  45. Lei, C.X.; Hu, S.Q.; Gao, N.; Shen, G.L.; Yu, R.Q. An amperometric hydrogen peroxide biosensor based on immobilizing horseradish peroxidase to a nano-Au monolayer supported by sol–gel derived carbon ceramic electrode. Bioelectrochemistry 2004, 65, 33–39. [Google Scholar]
Figure 1. TEM photos of synthesized Fe3O4 nanoparticles (a) and magnetic microspheres (b).
Sensors 09 06185f1aSensors 09 06185f1b
Figure 2. Effect of the glutaraldehyde concentration on the biosensor response to 5.0 × 10⁻⁴ M H2O2 in 0.15 M pH 8.0 PBS containing 6.0 × 10⁻⁴ M HQ.
Sensors 09 06185f2
Figure 3. Effect of HQ concentration on the biosensor response to 5.0 × 10⁻⁴ M H2O2 in 0.15 M pH 8.0 PBS.
Sensors 09 06185f3
Figure 4. Effect of the working potential on the biosensor response for 5.0 × 10⁻⁴ M H2O2 in 0.15 M pH 8.0 PBS containing 6.0 × 10⁻⁴ M HQ.
Sensors 09 06185f4
Figure 5. The cyclic voltammograms of Fe3O4/CS-Hb-Fe3O4/CS-GCE with different scan rates (from a to h: 20, 60, 100, 140, 180, 220, 260, 300 mV/s) in 0.15 M pH 8.0 PBS containing 6.0 × 10⁻⁴ M HQ (A). (B) the linear relation between peak current and v1/2.
Sensors 09 06185f5
Figure 6. Cyclic voltammograms of Fe3O4/CS-Hb-Fe3O4/CS-GCE (a,b), Fe3O4/CS-GCE (c,d) and Fe3O4/CS-Hb-GCE (e,f) in the absence (a,c,e) and in the presence (b,d,f) of 5.0 × 10⁻⁴ M H2O2 in 0.15 M pH 8.0 PBS containing 6.0 × 10⁻⁴ M HQ, scan rate: 100 mV/s.
Sensors 09 06185f6
Figure 7. Electrochemical impedance spectroscopy of different modified electrodes: the bare GCE (a), the Fe3O4/CS-GCE (b), the Fe3O4/CS-Hb-Fe3O4/CS-GCE (c) in 5.0 × 10⁻³ M K3Fe(CN)6/K4Fe(CN)6 (1:1) containing 0.1 M KCl.
Sensors 09 06185f7
Figure 8. Amperometric response of the biosensor to successive additions of H2O2 in 0.15 M PBS containing 6.0 × 10⁻⁴ M HQ. The working potential was −0.15 V. (inset) a plot of amperometric response vs, H2O2 concentration.
Sensors 09 06185f8
Table 1. Determination results of possible interferences tested with the biosensor.
Possible interferencesCurrent ratioa

Glucose1.02
l-Cystine0.99
l-Lysine1.01
l-Glycine1.01
Uric acid1.06
Ascorbic acid0.37
aRatio is the current for a mixture of interfering substance and 5.0 × 10⁻⁴ M H2O2 versus that for 5.0 × 10⁻⁴ M H2O2 alone. Other conditions as in Figure 6.
Table 2. Recovery determination results.
Sample numberAdded H2O2 (mM)Founda H2O2 by the present biosensor (mM)Recovery by the resent biosensor (%)Founda H2O2 by the titration method (mM)Recovery by the titration method (%)

10.20.846100.50.83796.0
20.61.291107.71.283106.3
31.21.82298.11.850100.4
aThe average of five measurements.

