An Improved Approach for Terrain Correction: Application to Northeast Asia’s Highest Peak (Mt. Jade, Taiwan)

Abstract
:1. Introduction
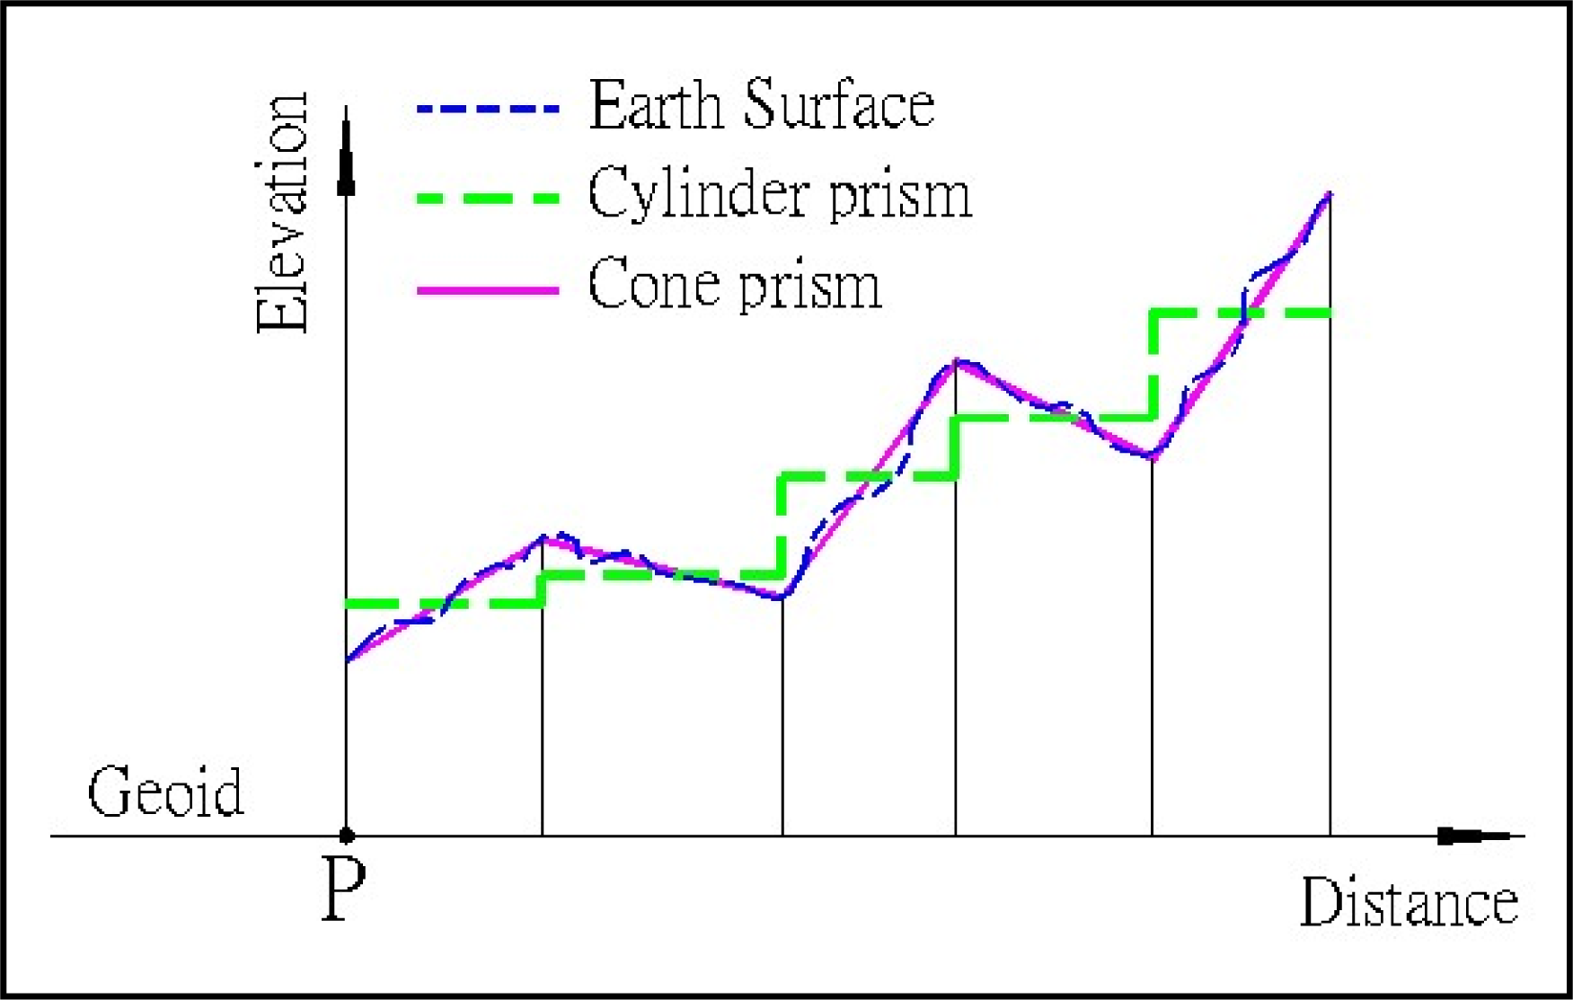
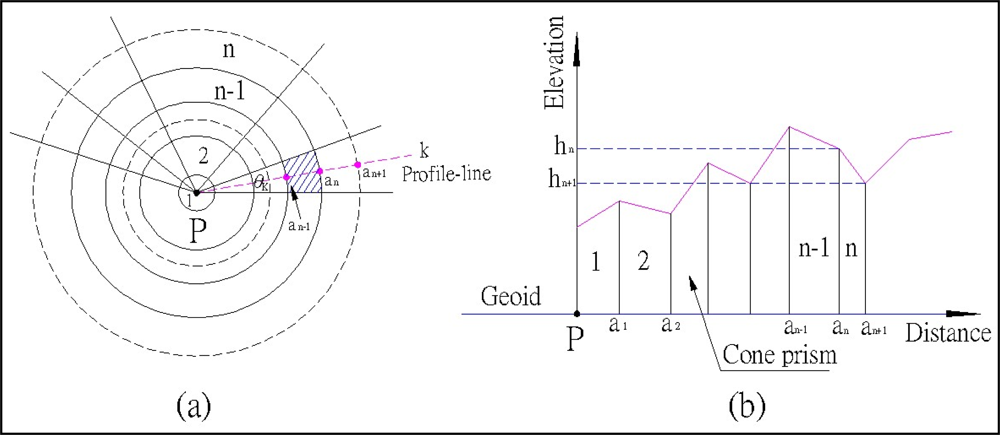
2. The Cone-section Method
| G | the gravitational constant |
| dm | the differential mass |
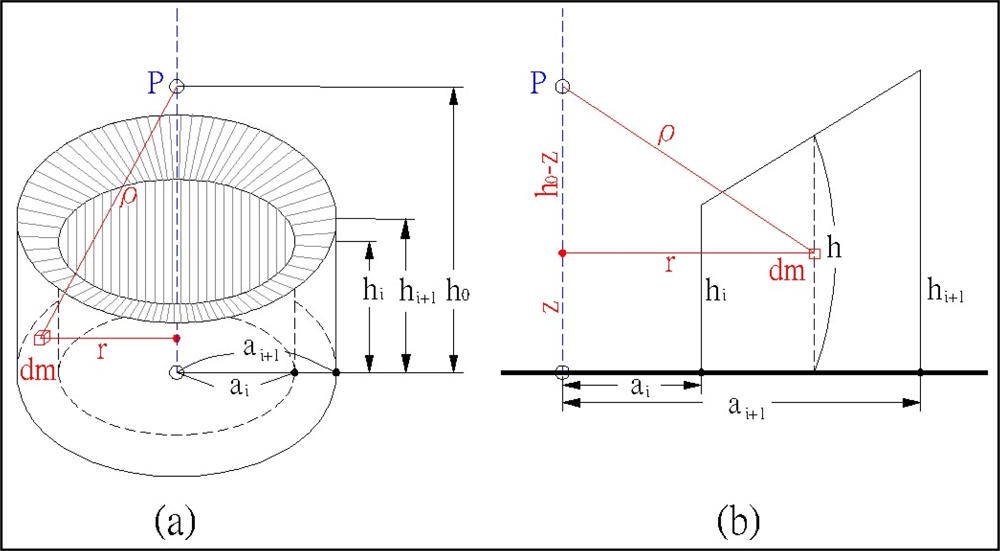
| h0 | the elevation of surveying site P |
| ρ | the distance between surveying site P and differential mass dm as shown in Equation (2) and Figure 3b |
| r | the horizontal distance between surveying site P and differential mass dm |
| z | the elevation of differential mass dm |
| δ | the average rock density (set to 2.57×10³ kg·m−3 [5]) |
| ai | the inner radii |
| hi | the inner elevation |
| ai+1 | the outer radii |
| hi+1 | the outer elevation |
| s | the slope parameter of Equation (9) |
| k | the intercept parameter of Equation (9) |
3. Results and Discussion
4. Conclusions
Acknowledgments
References and Notes
- Heiskanen, W.A.; Moritz, H. Physical Geodesy; W. H. Freeman and Co: San Francisco, CA, USA, 1967. [Google Scholar]
- Hwang, C.; Hsiao, Y.S. Orthometric corrections from leveling, gravity, density and elevation data: a case study in Taiwan. J. Geod 2003, 77, 279–291. [Google Scholar]
- Fournier, N.; Rymer, H.; Williams-Jones, G.; Brenes, J. High-resolution gravity survey: Investigation of subsurface structures at Poás volcano, Costa Rica. Geophys. Res. Lett 2004, 31, L15602. [Google Scholar] [CrossRef]
- Hammer, S. Terrain corrections for gravity stations. Geophysics 1939, 4, 184–194. [Google Scholar]
- Yen, H.Y.; Yen, Y.H.; Chen, C.H. Gravity terrain corrections of Taiwan. Terrestr. Atmos. Oceanic Sci 1994, 5, 1–10. [Google Scholar]
- Nowell, D. Gravity terrain corrections: An overview. J. Appl. Geo-phys 1999, 42, 117–134. [Google Scholar]
- Li, Y.C.; Sideris, M. Improved gravimetric terrain correction. Geophys. J. Int 1994, 119, 740–752. [Google Scholar]
- Tsoulis, D. Terrain correction computations for a densely sampled DTM in the Bavarian Alps. J. Geod 2001, 75, 291–307. [Google Scholar]
- Kirby, J.; Featherstone, W. High-resolution grids of gravimetric terrain correction and complete Bouguer corrections over Australia. Exp. Geophys 2002, 33, 161–165. [Google Scholar]
- Forsberg, R. A study of terrain reductions, density anomalies and geophysical inversion methods in gravity field modeling; Report no 355; Department of Geodesic Science and Survey, Ohio State University: Columbus, OH, USA, 1984. [Google Scholar]
- Hwang, C.; Wang, C.C.; Hsiao, Y.S. Terrain correction computation using Gaussian quadrature. Comput. Geosci 2003, 29, 1259–1268. [Google Scholar]
- Hwang, C.; Hsiao, Y.S.; Lu, C.C.; Wu, W.S.; Tseng, Y.H. Determination of northeast Asia’s highest peak (Mt. Jade) by direct leveling. Surv. Rev 2007, 39, 21–33. [Google Scholar]


| Site ID | Cone-section | Gaussian quadrature | Cylinder prism | Longitude (degree) | Latitude (degree) | Elevation (m) |
|---|---|---|---|---|---|---|
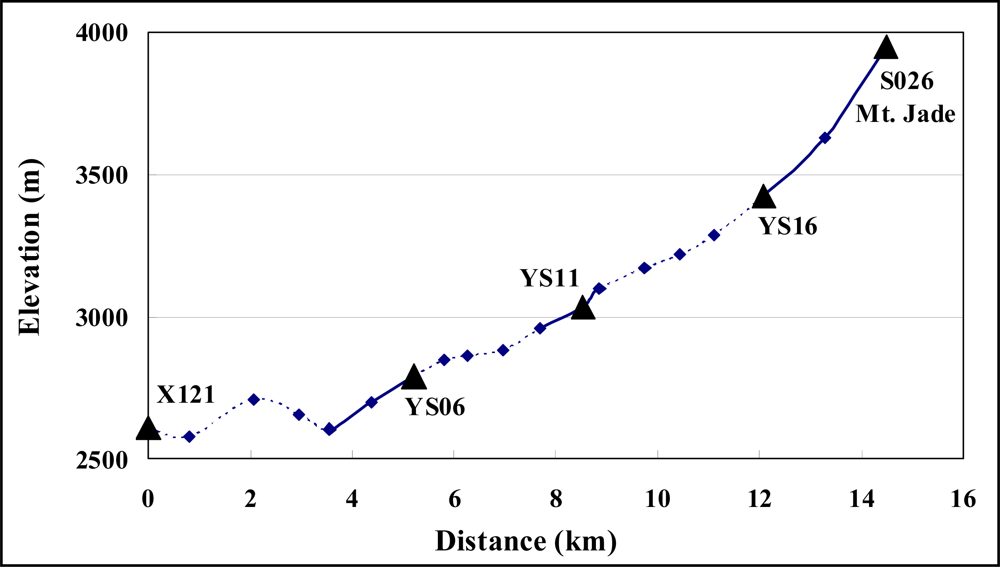
| X121 | 25.509 | 24.251 | 27.088 | 120.890 | 23.487 | 2,610 |
| YS06 | 36.049 | 35.217 | 40.583 | 120.910 | 23.472 | 2,792 |
| YS11 | 42.983 | 41.661 | 49.896 | 120.931 | 23.464 | 3,036 |
| YS16 | 45.006 | 42.686 | 46.132 | 120.949 | 23.467 | 3,426 |
| S026 | 90.660 | 114.387 | 90.651 | 120.957 | 23.470 | 3,952 |
| Site ID | Between Cone-section & Gaussian quadrature | Between Cylinder prism & Gaussian quadrature |
|---|---|---|
| X121 | 1.258 | 2.837 |
| YS06 | 0.832 | 5.366 |
| YS11 | 1.322 | 8.235 |
| YS16 | 2.320 | 3.446 |
| S026 | −23.727 | −23.736 |
| Method | Number of calculated points | |||
|---|---|---|---|---|
| 5 | 100 | 500 | 1,000 | |
| Computation time (second) | ||||
| Gaussian quadrature | 1.17 | 7.04 | 31.85 | 62.65 |
| Cylinder prism | 1.38 | 4.52 | 11.21 | 21.96 |
| Cone-section | 1.41 | 3.97 | 9.34 | 17.75 |
| Site ID | Cone-section | Gaussian quadrature | Cylinder prism | Longitude (degree) | Latitude (degree) | Elevation (m) |
|---|---|---|---|---|---|---|
| M028 | 29.564 | 28.553 | 30.607 | 121.143 | 23.752 | 2,515 |
| M477 | 26.181 | 25.753 | 29.108 | 121.317 | 24.187 | 2,817 |
| E019 | 67.942 | 66.375 | 68.443 | 121.002 | 22.977 | 2,930 |
| S048 | 116.686 | 115.724 | 120.204 | 120.761 | 22.627 | 3,090 |
| M089 | 37.496 | 36.704 | 36.591 | 121.285 | 24.152 | 3,236 |
| Site ID | Between Cone-section & Gaussian quadrature | Between Cylinder prism & Gaussian quadrature |
|---|---|---|
| M028 | 1.011 | 2.054 |
| M477 | 0.428 | 3.355 |
| E019 | 1.567 | 2.068 |
| S048 | 0.962 | 4.480 |
| M089 | 0.792 | −0.113 |
© 2009 by the authors; licensee MDPI, Basel, Switzerland This article is an open access article distributed under the terms and conditions of the Creative Commons Attribution license (http://creativecommons.org/licenses/by/3.0/).
Share and Cite
Chen, K.-H. An Improved Approach for Terrain Correction: Application to Northeast Asia’s Highest Peak (Mt. Jade, Taiwan). Sensors 2009, 9, 6604-6612. https://doi.org/10.3390/s90906604
Chen K-H. An Improved Approach for Terrain Correction: Application to Northeast Asia’s Highest Peak (Mt. Jade, Taiwan). Sensors. 2009; 9(9):6604-6612. https://doi.org/10.3390/s90906604
Chicago/Turabian StyleChen, Kwo-Hwa. 2009. "An Improved Approach for Terrain Correction: Application to Northeast Asia’s Highest Peak (Mt. Jade, Taiwan)" Sensors 9, no. 9: 6604-6612. https://doi.org/10.3390/s90906604