Next Article in Journal
Modelling and Calibration Technique of Laser Triangulation Sensors for Integration in Robot Arms and Articulated Arm Coordinate Measuring Machines
Previous Article in Journal
Nanomaterial-Assisted Signal Enhancement of Hybridization for DNA Biosensors: A Review
 
 
Correction published on 14 September 2009, see Sensors 2009, 9(9), 7397.
Article

Estimation of Parameters Obtained by Electrochemical Impedance Spectroscopy on Systems Containing High Capacities

by
Zoran Stević
1,*,
Mirjana Rajčić Vujasinović
1 and
Milan Radunović
2
1
University of Belgrade, Technical Faculty in Bor, VJ 12, 19210 Bor, Serbia
2
Faculty FUTURA, University Singidunum, Bulevar Mihajla Pupina 12a, 11070 New Belgrade, Serbia
*
Author to whom correspondence should be addressed.
Sensors 2009, 9(9), 7365-7373; https://doi.org/10.3390/s90907365
Submission received: 29 July 2009 / Revised: 3 September 2009 / Accepted: 7 September 2009 / Published: 11 September 2009
(This article belongs to the Section Chemical Sensors)

Abstract

:
Electrochemical systems with high capacities demand devices for electrochemical impedance spectroscopy (EIS) with ultra-low frequencies (in order of mHz), that are almost impossible to accomplish with analogue techniques, but this becomes possible by using a computer technique and accompanying digital equipment. Recently, an original software and hardware for electrochemical measurements, intended for electrochemical systems exhibiting high capacities, such as supercapacitors, has been developed. One of the included methods is EIS. In this paper, the method of calculation of circuit parameters from an EIS curve is described. The results of testing on a physical model of an electrochemical system, constructed of known elements (including a 1.6 F capacitor) in a defined arrangement, proved the validity of the system and the method.

1. Introduction

Every system may be regarded in a frequency domain displaying frequency logarithm on the X–axis and logarithm of module and/or phase angle of transfer function on the Y–axis (Bode plot) [13]. For the electrochemical system, the transfer function is, in fact, the impedance of an equivalent electrical circuit i.e., its complex form. That is why this method is named electrochemical impedance method (EIS) and it is widely used for characterization of electrochemical systems [414]. Applying alternate voltage, U(S), of different frequencies and constant amplitude to an electrical circuit, responding current, I(S), will appear [2,3]. Amplitude and phase angle of this current will depend on voltage and impedance, Z(S), of the circuit at that frequency:
I ( S ) = U ( S ) Z ( S )
where S = σ + jω is Laplace complex variable. For sinusoidal excitation the real part σ is equal to zero, so the S becomes S = jω, where frequency, ω, is given in s−1.
Conventional impedance spectra are actually snapshots of transfer functions taken at certain well-defined states of the system (usually stationary, constant potential states). However, for a fuller description of electrochemical systems the evolution of impedance spectra should be investigated during the evolution of the system in both potential and time. With the progress of digital techniques this is becoming increasingly possible [1517].
The system used for electrochemical measurements consisted of hardware (PC, AD-DA converter NI–621 produced by National Instruments and an analog interface developed at the Technical Faculty in Bor) and software for excitation and measurement (LABVIEW platform and originally developed application software) [18,19]. With the goal of achieving a full mathematical analysis of the measured data directly in the LabVIEW application, it was necessary to develop our own mathematical model which is implemented in the measurement software and described in this work. This was not possible with some commercially available fitting software packages (EqCwin, Z-view) [20].
The possibilities of the software described here are compared with the Thales software of the Zahner EIS firm [21,22]. Our model and software are more adequate to the real system because the model better describes real electrochemical systems taking into account the complexity of the processes. The mathematical model developed herein is adapted to the investigated class of electrochemical systems and it is strongly connected with the physical parameters of the system. That approach enabled us to obtain analytical values of mutual relationships between the physical parameters from the system response and, in that way, to make system optimization following some given criteria. This is a significant advantage in compare to the commercial software, where the model is not “visible”.

2. Theoretical Part

By recording amplitude and phase angle of the response current for every frequency value (excitation voltage known), one can obtain the module and the phase angle of impedance for that frequency; this is presented as one point on the Bode plot which gives the dependence of impedance module, Z, on frequency, f, in logarithmic scale. Logarithm is used in a goal to obtain linear dependences instead of exponential ones. At frequencies obtained by extrapolation of straight segments, some deviation from straight line appears, and the line slope changes gradually. From the heights of the horizontal regions and corner frequencies, one can calculate all the parameters of the circuit of which the Bode plot is recorded, i.e. to estimate the equivalent circuit parameters [2325].
After years of investigating of electrochemical behavior of different electrode materials, different equivalent electrical circuits that exhibit the same response on excitations as considered electrochemical systems have been found [2326]. One of the most common was the circuit presented in Figure 1.
R0 corresponds to the resistance of electrolyte and electrode material, and its value is on an order of magnitude of milliohms (mΩ) or Ohms (Ω). Capacity C0 corresponds to double layer formed on the electrolyte side. Resistances R1 and R2 (order of magnitude ohm to tens Ohms) are related to slow processes of adsorption and diffusion, as well as the capacitances C1 and C2. As a matter of fact, the branch R1C1 exhibits and describes the inconstancy of parameters in R2C2 branch. R3 is resistance of self-discharging, meaning that it is reciprocal to leakage current. Its value is on the order of hundreds of Ohms to tens of kiloohms.
For the adopted equivalent circuit (Figure 1) in a general case the impedance equation is complex and not clear enough. So, here a step by step method is applied, one frequency domain after other, knowing the nature of the process, i.e. orders of magnitude of the circuit parameters. For very low frequencies (on the order of μHz) all capacitors do not conduct electricity, so the impedance of the circuit remains the serial connection of R0 and R3:
Z 1 = R 0 + R 3
where Z1 is correlated to the first (the highest) horizontal plateau in Figure 5. At frequencies on the order of mHz capacitor C2 conducts, while C1 and C0 still are infinite resistances; so, the equivalent circuit has the shape presented in Figure 2.
The impedance of the circuit presented in Figure 2 is:
Z = S [ ( R 1 + R 3 ) R 0 C 2 + R 2 R 3 C 2 ] + R 0 + R 3 SC 2 ( R 2 + R 3 )   +   1
From the conditions for the impedance zero and pole, the corner frequencies may be obtained as:
f 1 = 1 2 π ( R 2 + R 3 ) C 2
f 2 = R 0 + R 3 2 π [ ( R 2 + R 3 ) R 0 C 2 + R 2 R 3 C 2 ]
At some higher frequencies (in order of dozens mHz) C2 becomes short circuit, while C0 and C1 are still in break, so the height of this horizontal region is:
Z 2 = R 0 + R 23 where R 23 = R 2 R 3 R 2 + R 3
At frequencies on the order of hundreds of mHz, C1 starts conducting, C0 is still in break, and C2 is a short circuit; the equivalent circuit then has the shape given in Figure 3.
The impedance of the circuit is then:
Z = S [ ( R 1 + R 23 ) R 0 C 1 + R 23 R 1 C 1 ] + R 0 + R 23 SC 1 ( R 1 + R 23 ) + 1
From the previous equation, corner frequencies may be obtained as:
f 3 = 1 2 π ( R 1 + R 23 ) C 1
and
f 4 = R 0 + R 23 2 π [ ( R 1 + R 23 ) R 0 C 1 + R 23 R 1 C 1 ]
Next horizontal region is obtained at frequencies higher then 1 Hz, when capacitor C1 becomes a short circuit, as well as C2, while C0 still does not conduct; so it can be written:
Z 3 = R 0 + R 123
where R123 is a parallel connection of R1, R2 and R3.
At relatively high frequencies (on the order of kHz) C0 starts leading, while C1 and C2 are short circuits, so the equivalent circuit becomes as in Figure 4.
The impedance of such circuit is:
Z = SR 0 R 123 C 0 + R 0 + R 123 SR 123 C 0 + 1
and corner frequencies are:
f 5 = 1 2 π R 123 C 0
f 6 = R 0 + R 123 2 π R 0 R 123 C 0
At the end, the lowest horizontal part of Bode plot is obtained at highest frequencies (on the order of tens of kHz) when C0 is in short circuit, too, so:
Z 4 = R 0
The theoretical Bode plot for the whole equivalent circuit given in Figure 1 is presented in Figure 5.

3. Experimental

Testing of the system and developed method was done on a physical model of the electrochemical system, constructed of known elements in a defined arrangement as in Figure 1.
The elements that the physical model was made of were: R0 = 3 Ω; R1 = 39 Ω, R2 =90 Ω; C0 = 0,12 μF; C1 = 30 mF; C2 = 1,6 F and R3 = 1 kΩ (alternatively R3 = 150 Ω). Experiments were performed using the following parameters: DC level 10 mV, AC amplitude 5 mV, frequency range 30 μHz up to 1 Hz. The obtained curves are presented in Figures 6 and 7.
From the experimentally obtained Bode curve, all parameters of the system have been determined by following the next steps:
From the plateau 4, R0 is obtained immediately from R0 = Z4;
Horizontal region 1 is equal to Z1, and then R3 can be calculated from:
R 3 = Z 1 R 0
Plateau 2 gives Z2, and then applying:
R 23 = Z 2 R 0 and R 2 = R 23 R 3 R 3 + R 23
From horizontal part 3, we get Z3 and calculate R123 = Z3 – R0. Then R1 can be estimated from:
R 1 = R 123 R 23 R 23 + R 123
From the corner frequency f1, capacitance C2 is calculated from:
C 2 = 1 2 π f 1 ( R 2 + R 3 )
From the corner frequency f3, C1 can be calculated as:
C 1 = 1 2 π f 3 ( R 1 + R 23 ) ;
Finally, from the corner frequency f5, C0 is estimated as:
C 0 = 1 2 π f 5 R 123 .
Using the method described above, values of the circuit parameters have been calculated from the plot given in Figure 6. The results are compared with those obtained using the commercial software EqCwin applied to the data from Figure 6 (Table 1).
The plot in Figure 7 gives similar results, except R3, that is, in this case, 150 Ω. Plots in Figures 6 and 7 do not have the fourth plateau for highest frequencies, so R0 could not be determined from such a curve.

4. Conclusions

Table 1 shows a very good agreement between the actual values of the electrical components forming the investigated physical model, the values obtained by the method described in this work and the values obtained using a commercial software product. In that way the method, hardware and software are fully confirmed. It should be emphasized that this method describes the system very well and clearly, but its big disadvantage is that it works with very low frequencies (on the order of μHz), that means a need for special equipment (like this described in the present work, or similar) and the experiments have a very long duration. The second problem may be resolved by starting the experiment from a frequency f2 (much higher than previously indicated), but in that case R3 must be determined by some other method (for example potentiostatic).

References and Notes

  1. Conway, B.E. Electrochemical supercapacitors; Kluwer Academic/Plenum Publishers: New York, NY, USA, 1999; pp. 479–495. [Google Scholar]
  2. Brazill, S.A.; Bender, S.E.; Hebert, N.E.; Cullison, J.K.; Kristensen, E.W.; Kuhr, W.G. Sinusoidal voltammetry: a frequency based electrochemical detection technique. J. Electroanal. Chem 2002, 531, 119–132. [Google Scholar]
  3. Darowicki, K. Differential analysis of impedance data. Electrochim. Acta 1998, 43, 2281–2285. [Google Scholar]
  4. Arbizzani, C.; Mastragostino, M.; Meneghello, L. Characterization by impedance spectroscopy of a polymer-based supercapacitor. Electrochim. Acta 1995, 40, 2223–2228. [Google Scholar]
  5. Rosvall, S.J.M.; Honeychurch, M.J.; Elton, D.M.; Bond, A.M. A practical approach to applying short time Fourier transform methods in voltammetric investigations. J. Electroanal. Chem 2001, 515, 8–16. [Google Scholar]
  6. Popkirov, G.S. Fast time-resolved electrochemical impedance spectroscopy for investigations under nonstationary conditions. Electrochim. Acta 1996, 41, 1023–1027. [Google Scholar]
  7. Honda, K.; Rao, T.N.; Tryk, D.A.; Fujishima, A.; Watanabe, M.; Yasui, K.; Masuda, H. Impendance characteristics of the nanoporous honeycomb diamond electrodes for electrical double-layer capacitor applications. J. Electrochem. Soc 2001, 148, A668–A679. [Google Scholar]
  8. Itagaki, M.; Ono, T.; Watanabe, K. Application of electrochemical impedance spectroscopy to solvent extraction of metallic ions. Electrochim. Acta 1999, 44, 4365–4371. [Google Scholar]
  9. Dekanski, A.; Stevanović, J.; Stevanović, R.; Jovanović, V.M. Glassy carbon electrodes: II. Modification by immersion in AgNO3. Carbon 2001, 39, 1207–1216. [Google Scholar]
  10. Yin, Q.; Kelsall, G.H.; Vaughan, D.J.; Brandon, N.P. Mathematical models for time-dependent impendance of passive electrodes. J. Electrochem. Soc 2001, 148, A200–A208. [Google Scholar]
  11. Tsamouras, D.; Kobotiatis, L.; Dalas, E.; Sakkopoulos, S. An impedance study of the metal sulfide CuxZn(1−x)S/electrolyte interface. J. Electroanal. Chem 1999, 469, 43–47. [Google Scholar]
  12. Karden, E.; Buller, S.; de Doncker, R.W. A frequency-domain approach to dynamical modeling of electrochemical power sources. Electrochim. Acta 2002, 47, 2347–2356. [Google Scholar]
  13. Avramovic, Z; Antonijevic, M. Corrosion of cold-deformed brass in acid sulphate solution. Corr. Sci 2004, 46, 2793–2802. [Google Scholar]
  14. Ragoisha, G.A.; Bondarenko, A.S. Potentiodynamic electrochemical impedance spectroscopy - Copper underpotential deposition on gold. Electrochem. Commun 2003, 5, 392–395. [Google Scholar]
  15. Martinez-Ortiz, F. On the use of a real time application interface under Linux in the electrochemistry laboratory - Application to chronopotentiometry. J. Electroanal. Chem 2005, 574, 239–250. [Google Scholar]
  16. Novickiy, S.P.; Kenzin, V.I.; Voloshin, A.A. Russian Electrochem 1993, 29, 138–143.
  17. Rodriguez, G.; Aromataris, L.; Donolo, M.; Hernandez, J.; Moitre, D. Software for calculation of electric power systems parameters. Comp. Electr. Eng 2003, 29, 643–651. [Google Scholar]
  18. Stevic, Z.; Andjelkovic, Z.; Antic, D. A New PC and LabVIEW package based system for electrochemical investigations. Sensors 2008, 8, 1819–1831. [Google Scholar]
  19. Stevic, Z.; Rajcic-Vujasinovic, M. Chalcocite as a potential material for supercapacitors. J. Power Sources 2006, 160, 1511–1517. [Google Scholar]
  20. Kurek, P.; Thiemann-Handler, S.; Marzantowicz, M.; Foltyn, M. An automated setup for impedance and electrochemical measurements of NOx sensors. Ionics 2004, 10, 469–472. [Google Scholar]
  21. Strunz, W. Relaxation voltammetry: A technology for the evaluation of barrier coatings. Electrochem. Appl 2002, 1/02, 6–10. [Google Scholar]
  22. Hoffmann, J. AC-Impedance Spectroscopy on molten carbonate fuel cells. Electrochem. Appl 2002, 1/02, 10–12. [Google Scholar]
  23. Tan, H.; Su, X.; Wei, W.; Yao, Sh. Robust complex non-linear regression method for the estimation of equivalent circuit parameters of the thickness-shear-mode acoustic wave sensor. Chemometr. Intell. Lab. Sys 1999, 48, 71–80. [Google Scholar]
  24. Borcea, L. Electrical impedance tomography. Inverse Probl 2002, 18, R99–R136. [Google Scholar]
  25. Nelatury, S.R.; Singh, P. Equivalent circuit parameters of nickel/metal hydride batteries from sparse impedance measurements. J. Power Sources 2004, 132, 309–314. [Google Scholar]
  26. Rajcic-Vujasinovic, M.; Stankovic, Z.; Stevic, Z. The consideration of the electrical circuit analogous to the copper or coppersulfide/electrolyte interfaces based on the time transient analysis. Russ. Electrochem 1999, 35, 347–354. [Google Scholar]
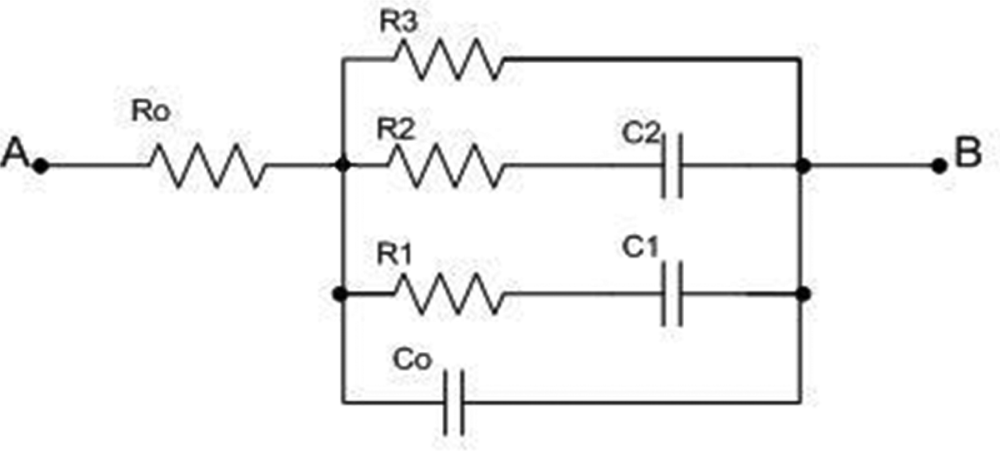
Figure 1. Considered equivalent electrical circuit.
Sensors 09 07365f1
Figure 2. Equivalent circuit for the second frequency domain (on the order of mHz).
Sensors 09 07365f2
Figure 3. Equivalent circuit for fourth frequency domain (on the order of hundreds of mHz).
Sensors 09 07365f3
Figure 4. Equivalent circuit for sixth frequency domain (on the order of kHz).
Sensors 09 07365f4
Figure 5. Theoretical Bode plot for adopted equivalent circuit.
Sensors 09 07365f5
Figure 6. Experimentaly obtained Bode plot for the physical model (R3 = 1 kΩ).
Sensors 09 07365f6
Figure 7. Experimentaly obtained Bode plot for the physical model (R3 = 150 Ω).
Sensors 09 07365f7
Table 1. Parameters of the investigated equivalent circuit.
ParameterActual valueMeasured valueEqCwin value
R1 [Ω]394145
C1 [F]0.030.030.028
R2 [Ω]909393.4
C2 [F]1.61.581.59
R3 [Ω]1,0009921,003

