Article

Determination of Antidepressants in Human Plasma by Modified Cloud-Point Extraction Coupled with Mass Spectrometry

by
Elżbieta Gniazdowska
1,2,
Natalia Korytowska
3,
Grzegorz Kłudka
3 and
Joanna Giebułtowicz
3,*
1
Łukasiewicz Research Network, Industrial Chemistry Institute, 8 Rydygiera, 01-793 Warsaw, Poland
2
Department of Bioanalysis and Drugs Analysis, Doctoral School, Medical University of Warsaw, 61 Żwirki i Wigury, 02-091 Warsaw, Poland
3
Department of Bioanalysis and Drugs Analysis, Faculty of Pharmacy, Medical University of Warsaw, 1 Banacha, 02-097 Warsaw, Poland
*
Author to whom correspondence should be addressed.
Pharmaceuticals 2020, 13(12), 458; https://doi.org/10.3390/ph13120458
Submission received: 5 October 2020 / Revised: 7 December 2020 / Accepted: 7 December 2020 / Published: 12 December 2020
(This article belongs to the Special Issue Analytical Techniques in the Pharmaceutical Sciences)

Abstract

:
Cloud-point extraction (CPE) is rarely combined with liquid chromatography coupled to mass spectrometry (LC–MS) in drug determination due to the matrix effect (ME). However, we have recently shown that ME is not a limiting factor in CPE. Low extraction efficiency may be improved by salt addition, but none of the salts used in CPE are suitable for LC–MS. It is the first time that the influences of a volatile salt—ammonium acetate (AA)—on the CPE extraction efficiency and ME have been studied. Our modification of CPE included also the use of ethanol instead of acetonitrile to reduce the sample viscosity and make the method more environmentally friendly. We developed and validated CPE–LC–MS for the simultaneous determination of 21 antidepressants in plasma that can be useful for clinical and forensic toxicology. The selected parameters included Triton X-114 concentration (1.5 and 6%, w/v), concentration of AA (0, 10, 20 and 30%, w/v), and pH (3.5, 6.8 and 10.2). The addition of 10% of AA increased recovery twice. For 20 and 30% (w/v) of AA, three phases were formed that prolonged the extraction process. The developed CPE method (6% Triton X-114, 10% AA, pH 10.2) was successfully validated through LC–MS/MS simultaneous determination of 21 antidepressants in human plasma. The linearity was in the range of 10–750 ng/mL (r2 > 0.990).

1. Introduction

Cloud-point extraction (CPE) is a modification of liquid–liquid extraction (LLE) that is more friendly to the environment and users, mainly due to lower consumption of organic solvents according to the global trend of "green chemistry.” CPE has also advantages over solid phase extraction (SPE), such as faster and cheaper optimization processes and no need for expensive equipment [1]. In CPE, the surfactant (such as Triton X-114) in a concentration above the critical micelle concentration (CMC) can exist as a homogeneous isotropic liquid, which separates into two isotropic phases with different concentrations of surfactant. Sample ingredients are separated into the surfactant micelle-rich phase (hydrophobic components when nonionic surfactant is used) and the micelle-poor phase (hydrophilic components) [2].
Nowadays, the most reliable technique of pharmaceutical determination is liquid chromatography coupled to mass spectrometry (LC–MS). However, there are only a very few papers reporting LC–MS coupled with CPE in drug determination, i.e., in the determination of memantine in rat plasma [3], and bisoprolol [4], antazoline [1], abacavir, efavirenz, lamivudine, and belfinavir in human plasma [5]. The disadvantage of the CPE–LC–MS, contrary to LLE–LC–MS, is the lower extraction efficiency (recovery). Recovery for bisoprolol was 46−61% using CPE and 74−86% using LLE [4]. In CPE methods coupled with other techniques than mass spectrometry, non-volatile salts such as NaCl [6,7,8,9], Na2SO4 [10], Na2B4O7 [11], and (NH4)2SO4 [12] are used to improve the efficiency of extraction. However, these salts are incompatible with LC–MS due to possible matrix effect (ME) and deposition in the ion source. Moreover, they crystallize in the capillary lumen resulting in the additional need for cleaning and maintenance of LC–MS. The alternative approach is the usage of volatile salts such as ammonium acetate (AA) and formate. These salts are the commonly used modifiers of a mobile phase in positive ionization mode in LC–MS. However, there are no reports on their application in CPE–LC–MS.
Determination of antidepressants in biological samples is necessary for the effective and safe treatment of depression, a common mental disorder. According to World Health Organization (WHO), more than 264 million people of all ages suffer from depression globally. This disease is one of the most serious public health problems [13]. Moreover, the treatment of depression is a complex issue, sometimes being associated with dysphoric, mixed, agitated, or psychotic states that can increase suicidal risk [14]. Moreover, antidepressants are frequently used together with other legal or illegal drugs and can result in a synergy of symptoms and intoxication. The drugs can be also used in intentional poisoning [15,16]. The antemortem screening analysis can be useful in cases of suspected poisoning or vehicle accidents in clinical or forensic toxicology investigations. The screening method should allow one to rapidly determine and quantify the wide spectrum of compounds. Thus, the method of simultaneous determination of antidepressants from different classes is needed.
There are many LC methods for the determination of antidepressants using various detectors, e.g., UV–Vis, photodiode-array (PDA), diode-array (DAD), and fluorescence detector. Recently, MS has been also extensively employed in the analysis of complex biological samples especially [17]. Since detectors based on UV–visible spectrometry are universal, less expensive, and less complicated than LC–MS, they are commonly used in routine laboratories. They frequently provide a satisfactory limit of quantitation for antidepressants in plasma (even 5 ng/mL for some compounds) [18], due to aromatic rings (e.g., phenyl group and naphthalene group) and other major UV chromophores present in their structures. Those detectors are also applied in multi-methods, permitting one to simultaneously determine up to 11 antidepressants in plasma (LC–PDA) [19]. However, the conventional detectors are less selective than LC–MS, which is crucial in forensic and clinical toxicology when in samples many legal and illegal compounds may occur. Thus, LC–MS remains the gold standard, especially in legal medicine. Since the method has a drawback of matrix effects and ion suppression issues, the careful validation needs to be performed [17].
LC–MS methods of antidepressant determination use electrospray ionization in positive ion mode (ESI+) [20,21,22,23,24,25,26,27,28], atmospheric pressure chemical ionization in positive ion mode (APCI+) [29], or QTOF MS in positive ionization mode with a DuoSpray ion source [30]. Samples were prepared using LLE [20,26,29], microextraction by packed sorbent (MEPS) [28], protein precipitation (PP) [25,30], SPE [22], on-line SPE [21,23], capillary restricted-access media (RAM) [27], and online-restricted access molecularly imprinted solid-phase extraction (RAMIP-BSA) [24]. All methods require the use of environmentally harmful organic solvents. As an alternative, we aim to develop the environmentally friendly CPE that can be coupled with mass spectrometry. The novel CPE protocol provides better recoveries than the previous studies reporting the use of CPE–LC–MS [1,4].
This study aimed to examine the effects of one volatile salt AA’s addition on recovery and the matrix effect of the CPE–LC–MS method. To make the extraction method more environmentally friendly, we used ethanol instead of methanol or acetonitrile to reduce the sample viscosity at the last point of sample preparation. We have developed the method for the simultaneous determination of 21 major antidepressants. The compounds were from four different classes—i.e., non-selective monoamine reuptake inhibitors (N06AA): amitriptyline, clomipramine, desipramine, doxepin, imipramine, maprotiline, nortriptyline, opipramol, protriptyline, and trimipramine; selective serotonin reuptake inhibitors (SSRIs)(N06AB): citalopram, fluoxetine, fluvoxamine, paroxetine, and sertraline; monoamine oxidase A inhibitors (N06AG): moclobemide; and other antidepressants (N06AX): mianserin, mirtazapine, tianeptine, trazodone, and venlafaxine. The selected pharmaceuticals have different structures and chemical properties, and logP and pKa range from 1.5 to 5.2 and 6.0 to 10.5, respectively. The analyzed parameters for the simultaneous determination of the compounds were the concentration of non-ionic surfactant Triton X-114, sample pH, and AA concentration. Finally, validation parameters were compared with several reported methods.

2. Results and Discussion

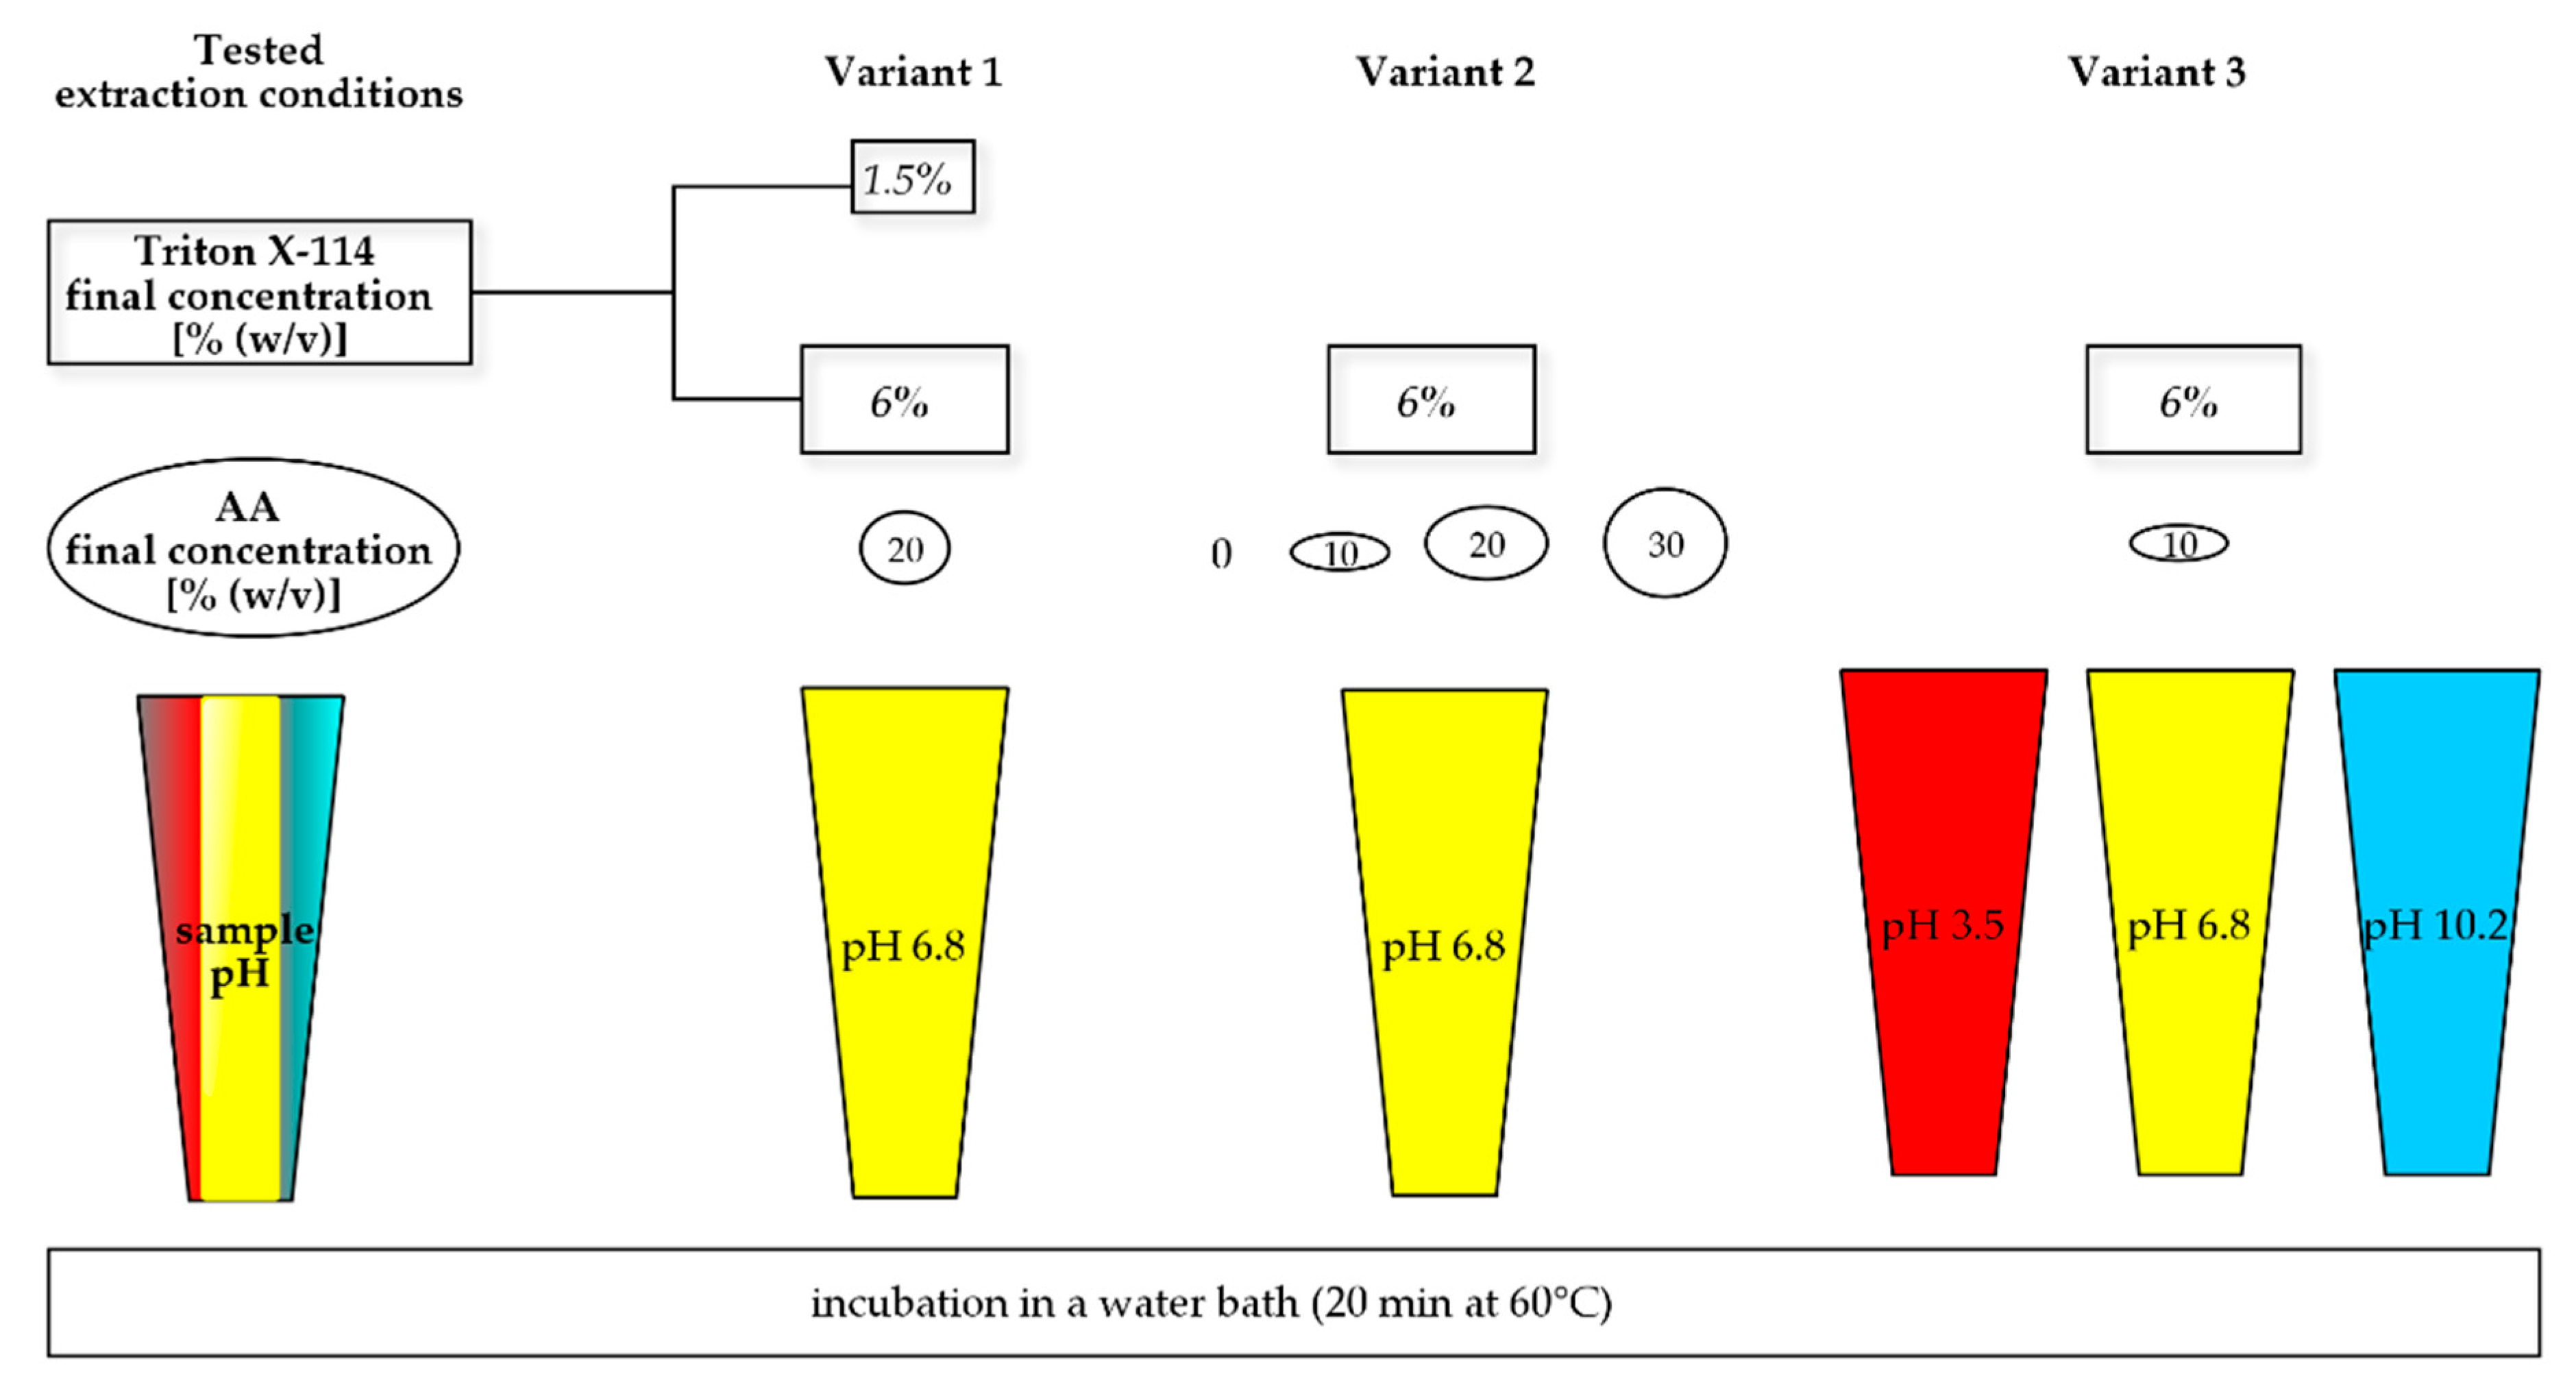
2.1. Development of Cloud-Point Extraction

The analytical method was developed for determination of such antidepressants as amitriptyline (AMI), citalopram (CIT), clomipramine (CLO), desipramine (DES), doxepin (DOX), fluoxetine (FLX), fluvoxamine (FLV), imipramine (IMI), maprotiline (MAP), mianserin (MIA), mirtazapine (MIR), moclobemide (MOC), nortriptyline (NOR), opipramol (OPI), paroxetine (PAR), protriptyline (PRO), sertraline (SER), tianeptine (TIA), trazodone (TRA), trimipramine (TRI), and venlafaxine (VEN) in human plasma by LC–MS/MS (Figure 1).
The initial factors of extraction included pH 6.8, temperature 60°C, and 20% of AA. To reach pH 6.8, only water was used. Thus, pH 6.8 was selected to reduce the time of the process, reduce the cost, and diminish the risk of contamination. AA concentration was selected as a medium value from all tested in the experiment. The level of antidepressants corresponded to a plasma concentration of 100 ng/mL.
Many factors affect CPE efficiency. In this paper, the influences of surfactant concentration (Triton X-114), volatile salt (AA—0, 10, 20, and 30% (w/v)), and extraction pH (about 3.5, 6.8, 10.2) was tested to select the optimal conditions for the simultaneous determination of 21 antidepressants. Other parameters, i.e., volume of reagents and equilibrium time, were used as described previously [2,31]. However, in the current study higher temperature was selected (60 °C). The optimal temperature for CPE is 15–20 °C greater than the cloud point of the surfactant, which in the case of Triton X-114 is 23 °C, and was reviewed to be 40–60 °C [32]. With an increase in temperature, the efficacy of the extraction increases, and the volume of the surfactant-rich phase decreases due to the disruption of the hydrogen bonds and the dehydration of the phase [32].
The optimal conditions (concentration of Triton-X-114 and AA, pH sample) were defined as the ones showing the highest mean recovery and the lowest absolute ME (MEA) (Equation (1)) [33], for simultaneously analyzing all 21 antidepressants. The influences of selected parameters are presented in Figure 2, Figure 3, Figure 4 and Figure 5 and summarized in Figure 6. The chromatography separation was not optimized. We used the gradient elution mode, eluent flow rate, and analytical column commonly used in our analysis [31].

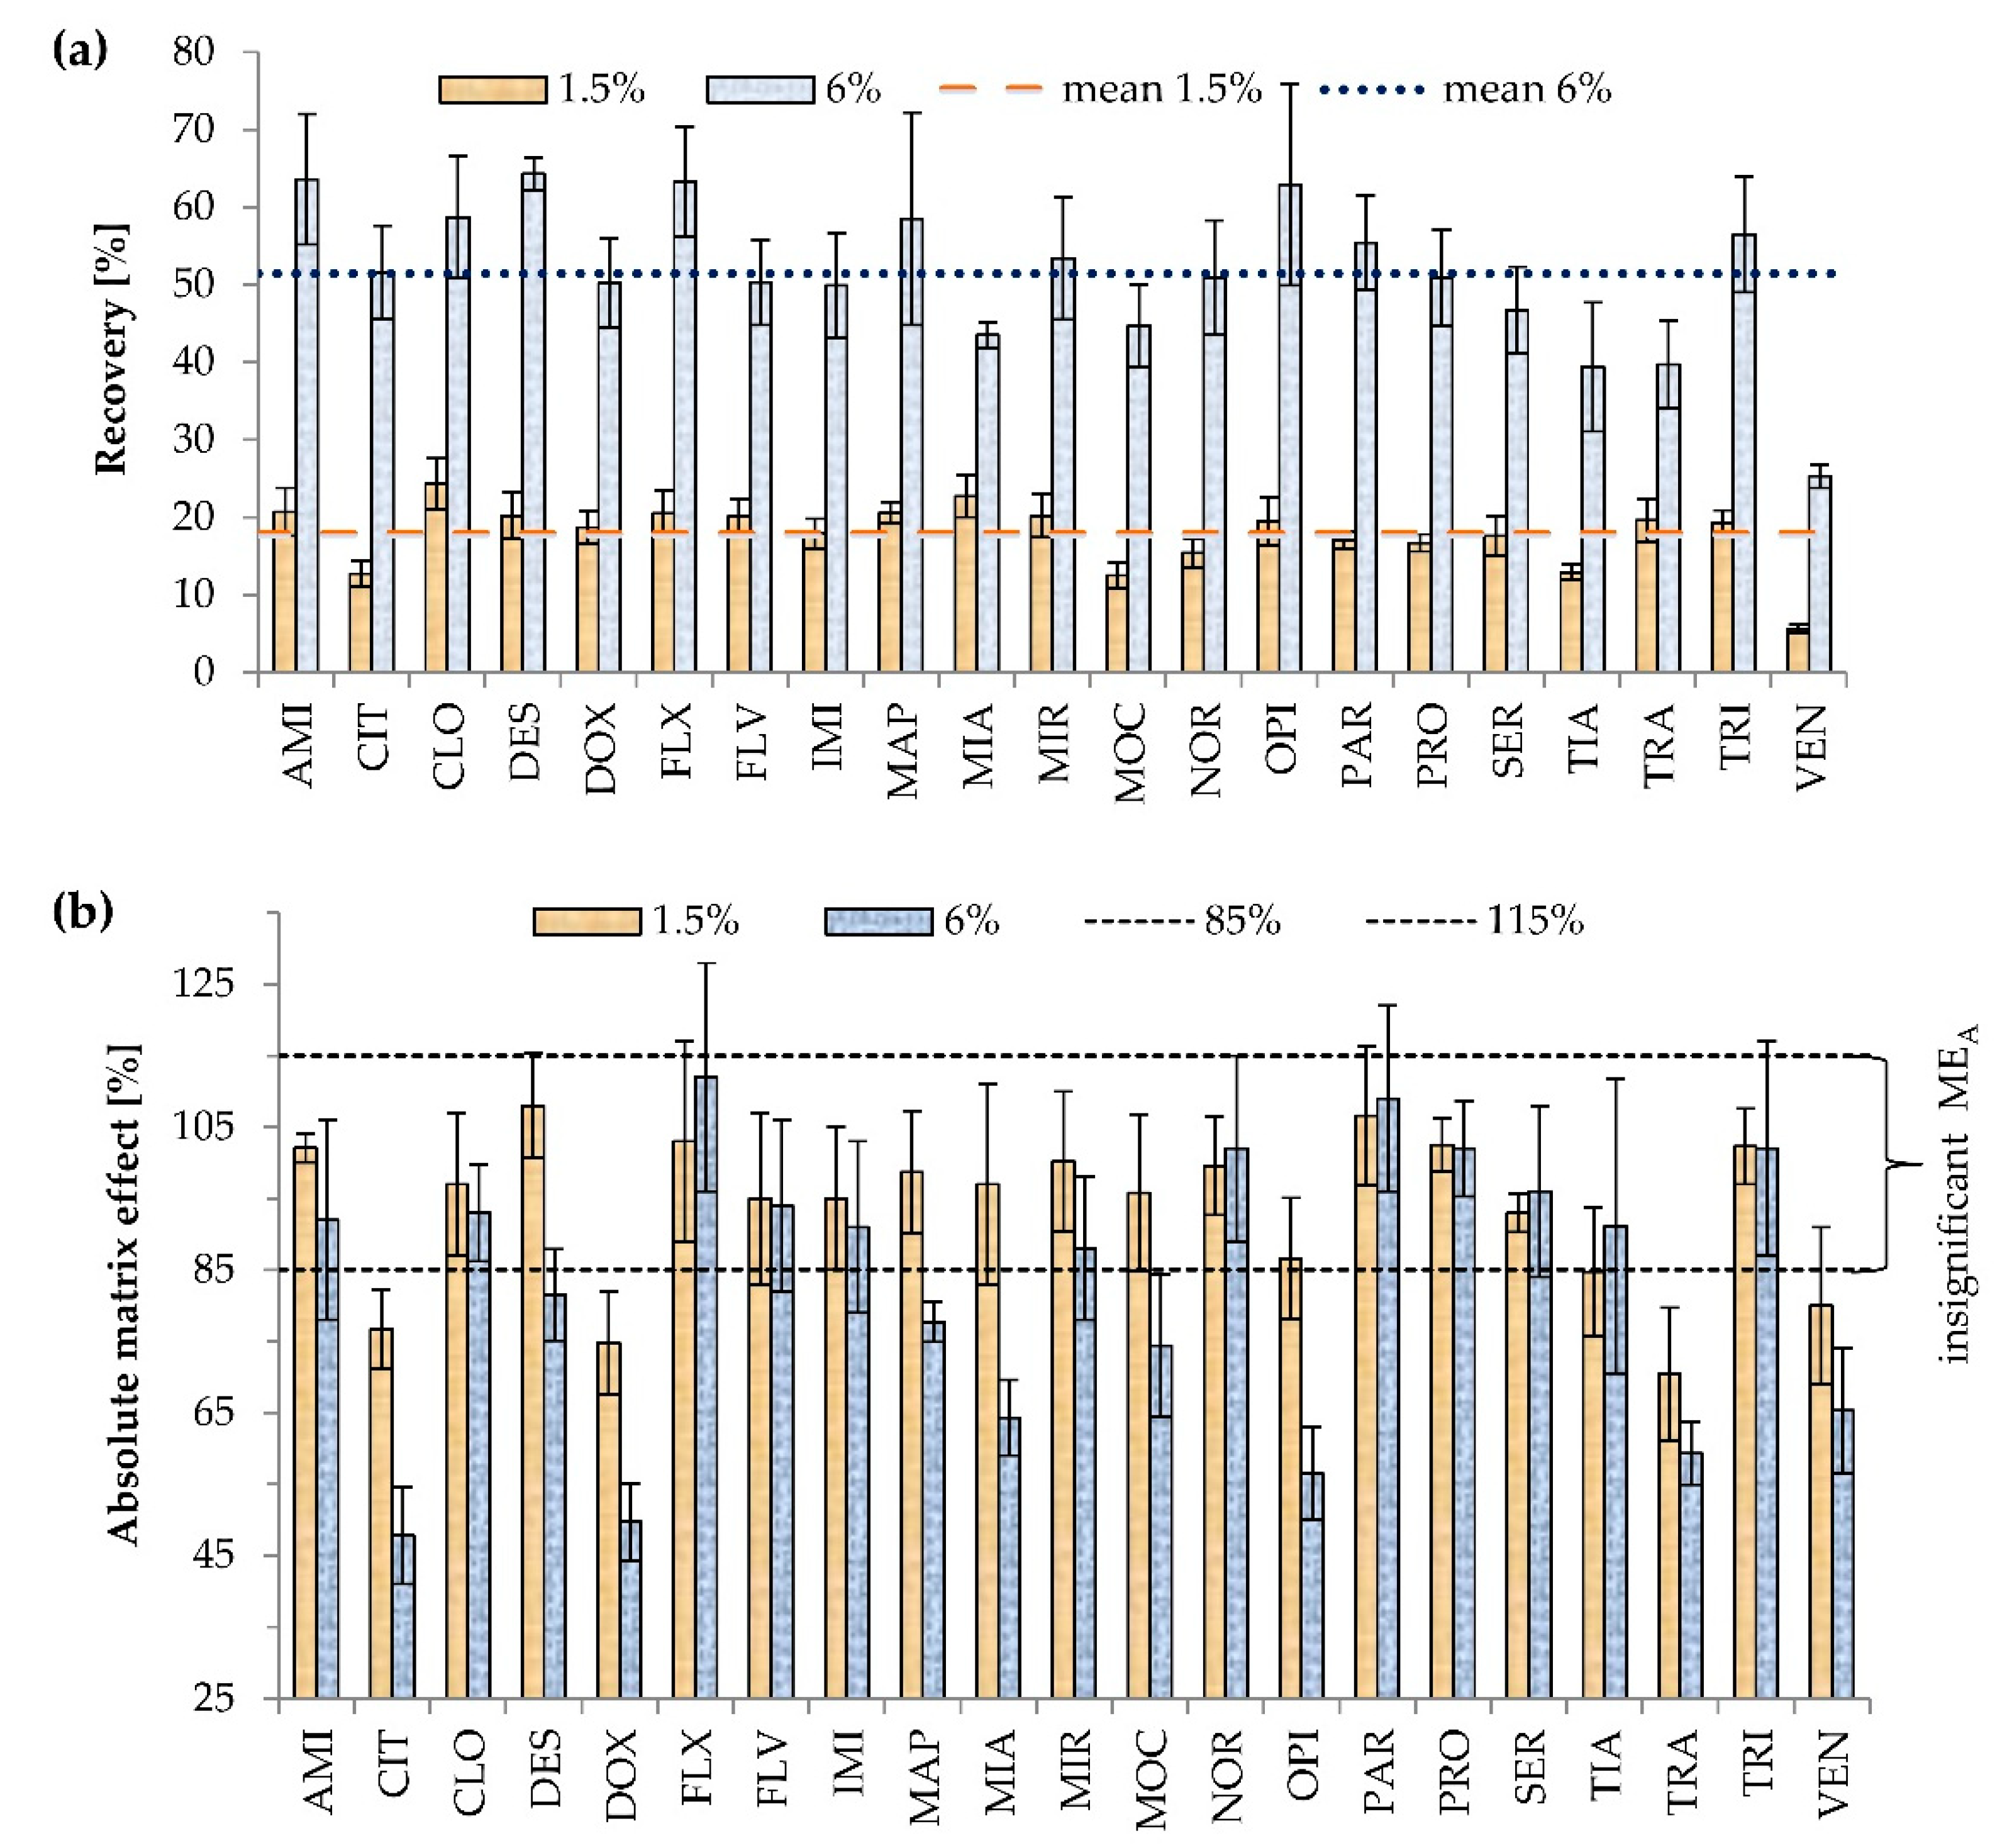
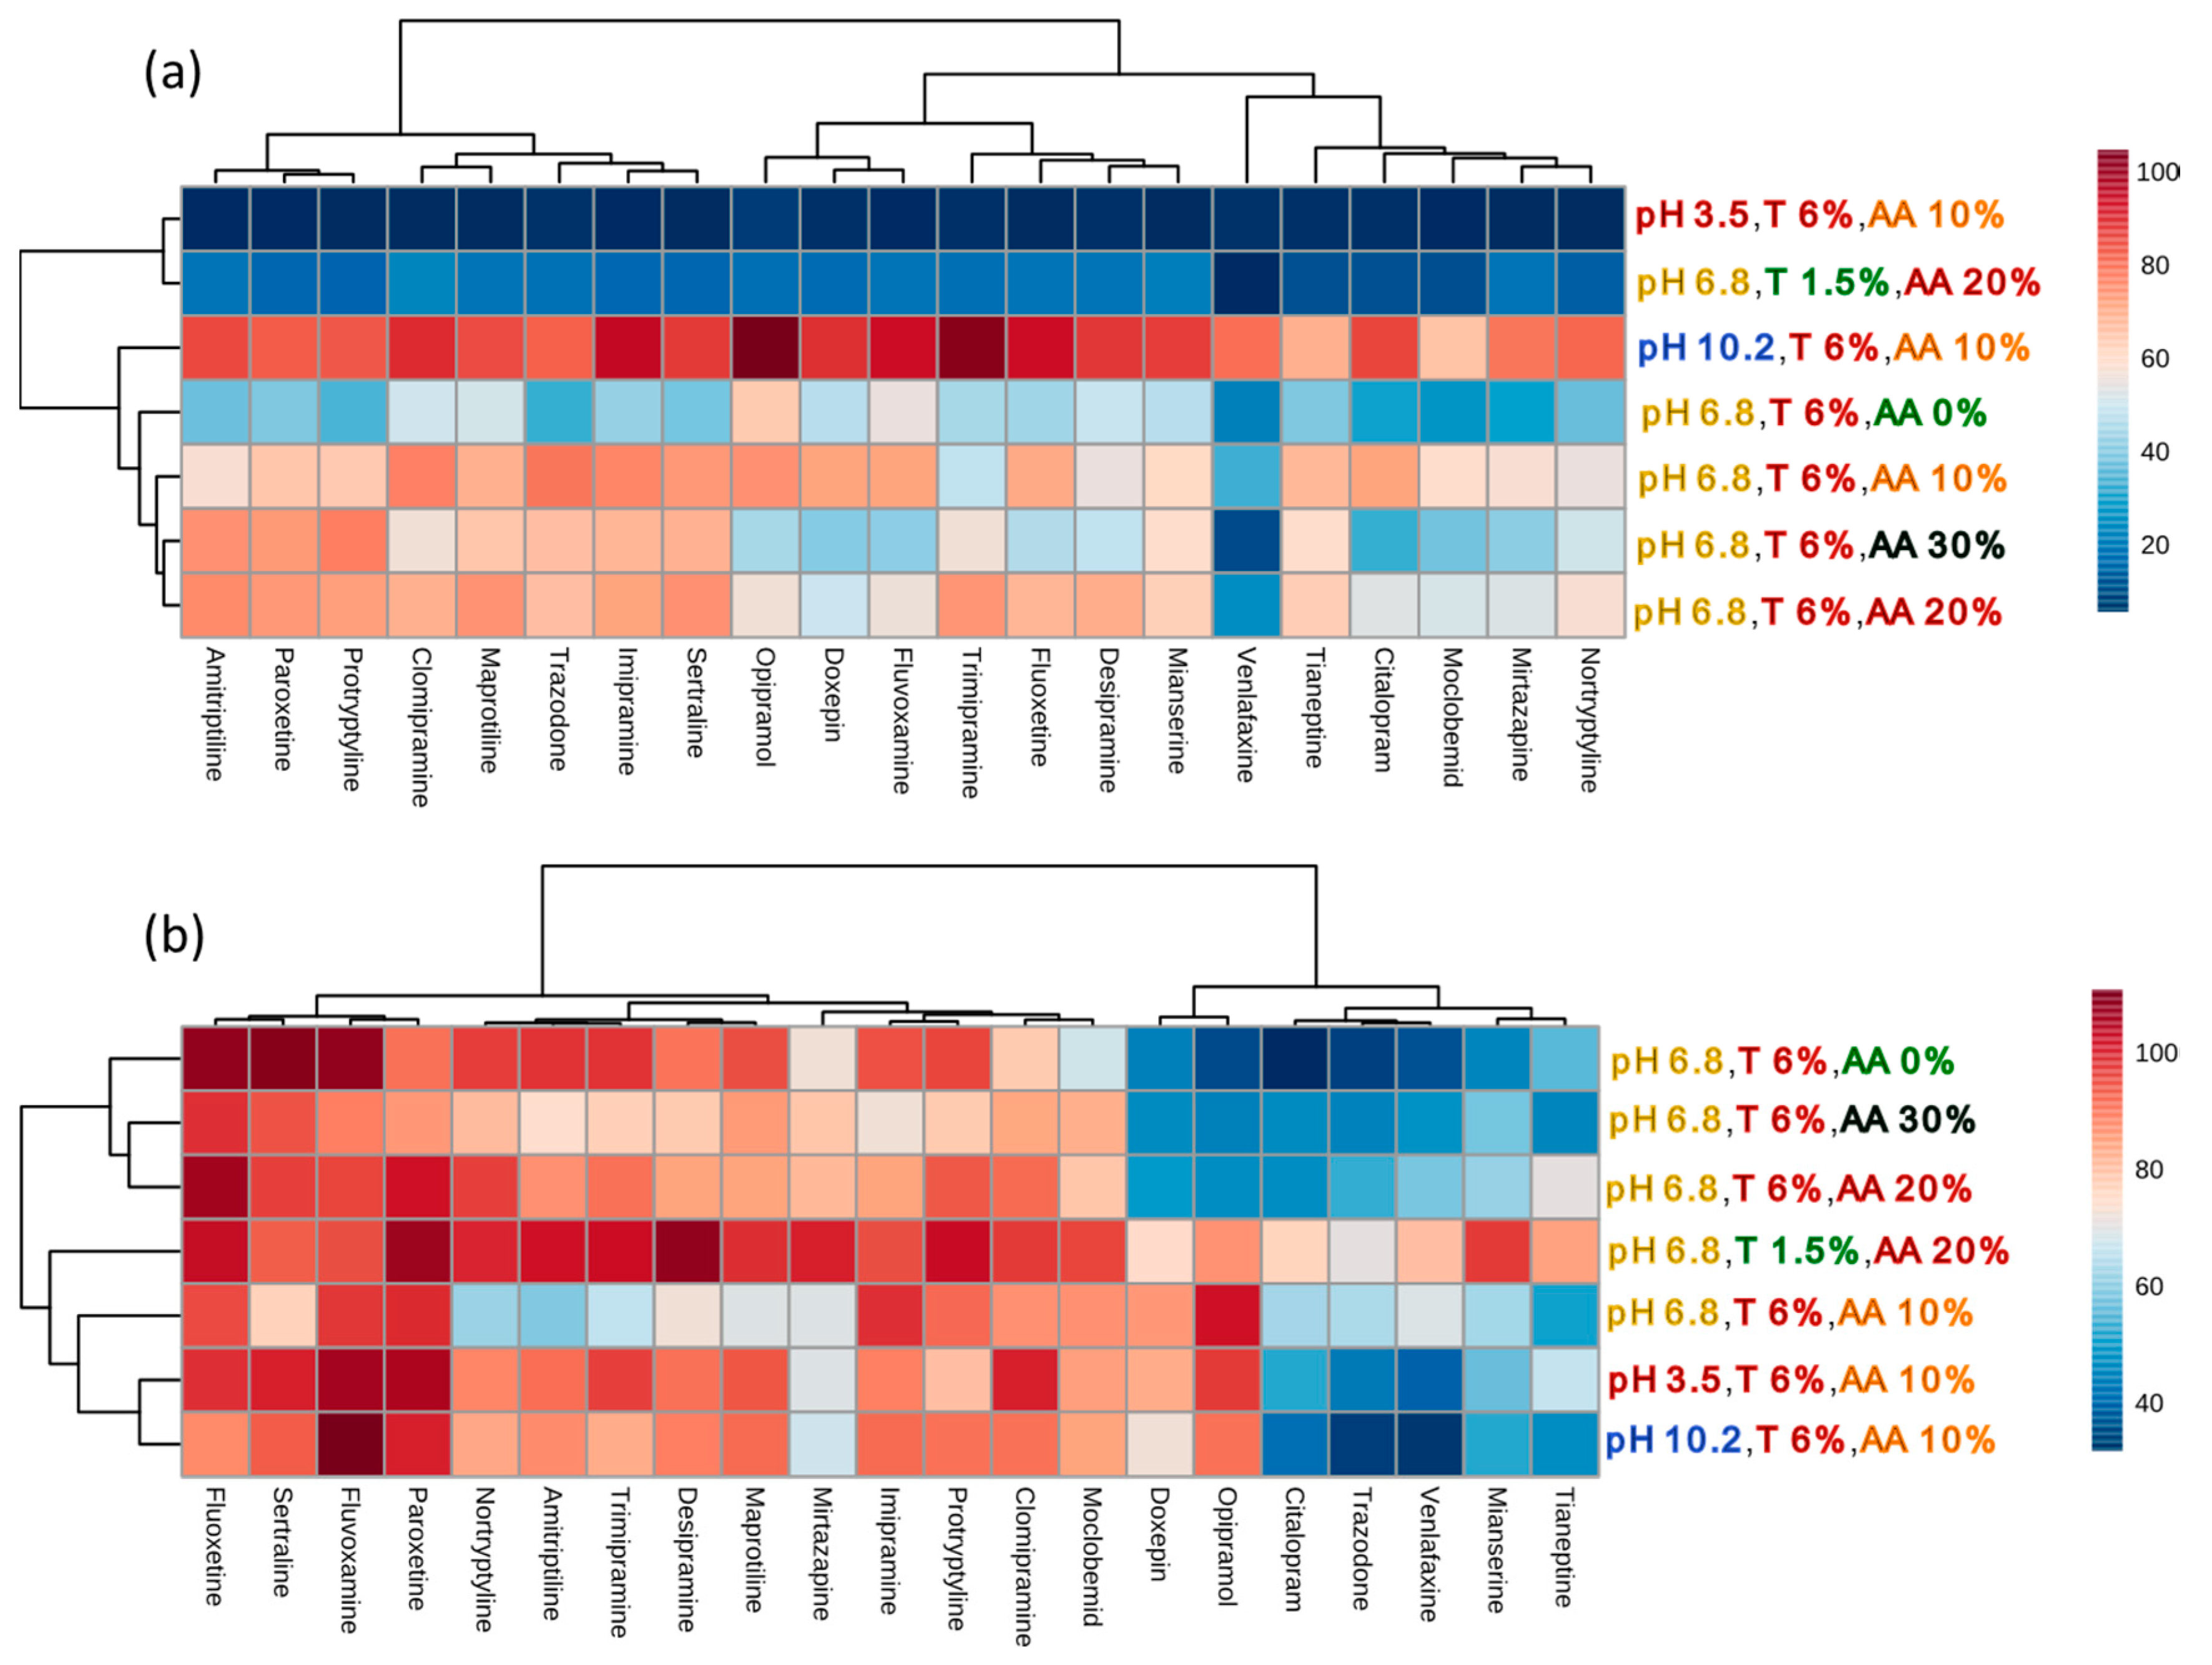
2.1.1. The Effects of Triton X-114

The concentration of Triton X-114, used as the surfactant in CPE, was very carefully selected. This was because the overly low concentration of Triton X-114 decreases recovery and prevents effective separation of the aqueous and micellar phases. On the other hand, too high concentration of surfactant is associated with a high volume of the micelle-rich phase, and the unwanted dilution of the analyte [5,10,32]. The range of tested Triton X-114 concentrations, added to samples in multi-compound determination, varied from 1.5 to 9% (w/v) [1,2,4,5,8,32], with the most frequently used concentration being 4% [32]. In this study, two variants of Triton concentration (1.5 and 6%) were studied. The effects of the surfactant concentration on recovery and MEA are shown in Figure 2.
The volume of the micellar rich phase was about 100 μL, and the initial volume of the sample was 1 mL, so the analytes were concentrated about 10 times. Over twofold increases in recovery at higher Triton X-114 concentration were noted for CLO, DOX, FLV, IMI, MAP, MIR, SER, and TRA; over threefold increases for AMI, CIT, DES, FLX, MOC, NOR, OPI, PAR, PRO, and TIA; and the highest for VEN (4.5 times). A lower than twofold increase was noted only for MIA. Higher recoveries at 6% Triton were expected based on the partition coefficient equation. The partition coefficient is characteristic for the compound and the extraction conditions (e.g., type of surfactant, pH). It is calculated as the ratio of antidepressant concentration in the surfactant to that in the aqueous phase [34]. Thus, with the increase of the surfactant rich phase volume, the mass of the extracted compound increases as well.
Significant MEA values were observed for four (CIT, DOX, TRA, and VEN) and nine antidepressants (CIT, DES, DOX, MAP, MIA, MOC, OPI, TRA, and VEN) out of 21 analyzed at 1.5 and 6% Triton X-114, respectively. In contrast to 6%, at 1.5% Triton X-114 concentration, MEA was not observed for DES, MAP, MIA, MOC, and OPI. Higher surfactant concentration is related to a higher risk of MEA, as reported previously [31]. The possible reason is the interference of surfactant with droplet evaporation or higher recovery not only of analytes, but also impurities of samples that interfere with the analyte ionization. However, in the current study, the differences in the occurrence of MEA for all 21 antidepressants between the two surfactant concentrations were not statistically significant (p = 0.182). The concentration of 6% (w/v) Triton X-114 was selected as optimal considering higher mean recovery for 21 antidepressants and comparable MEA.

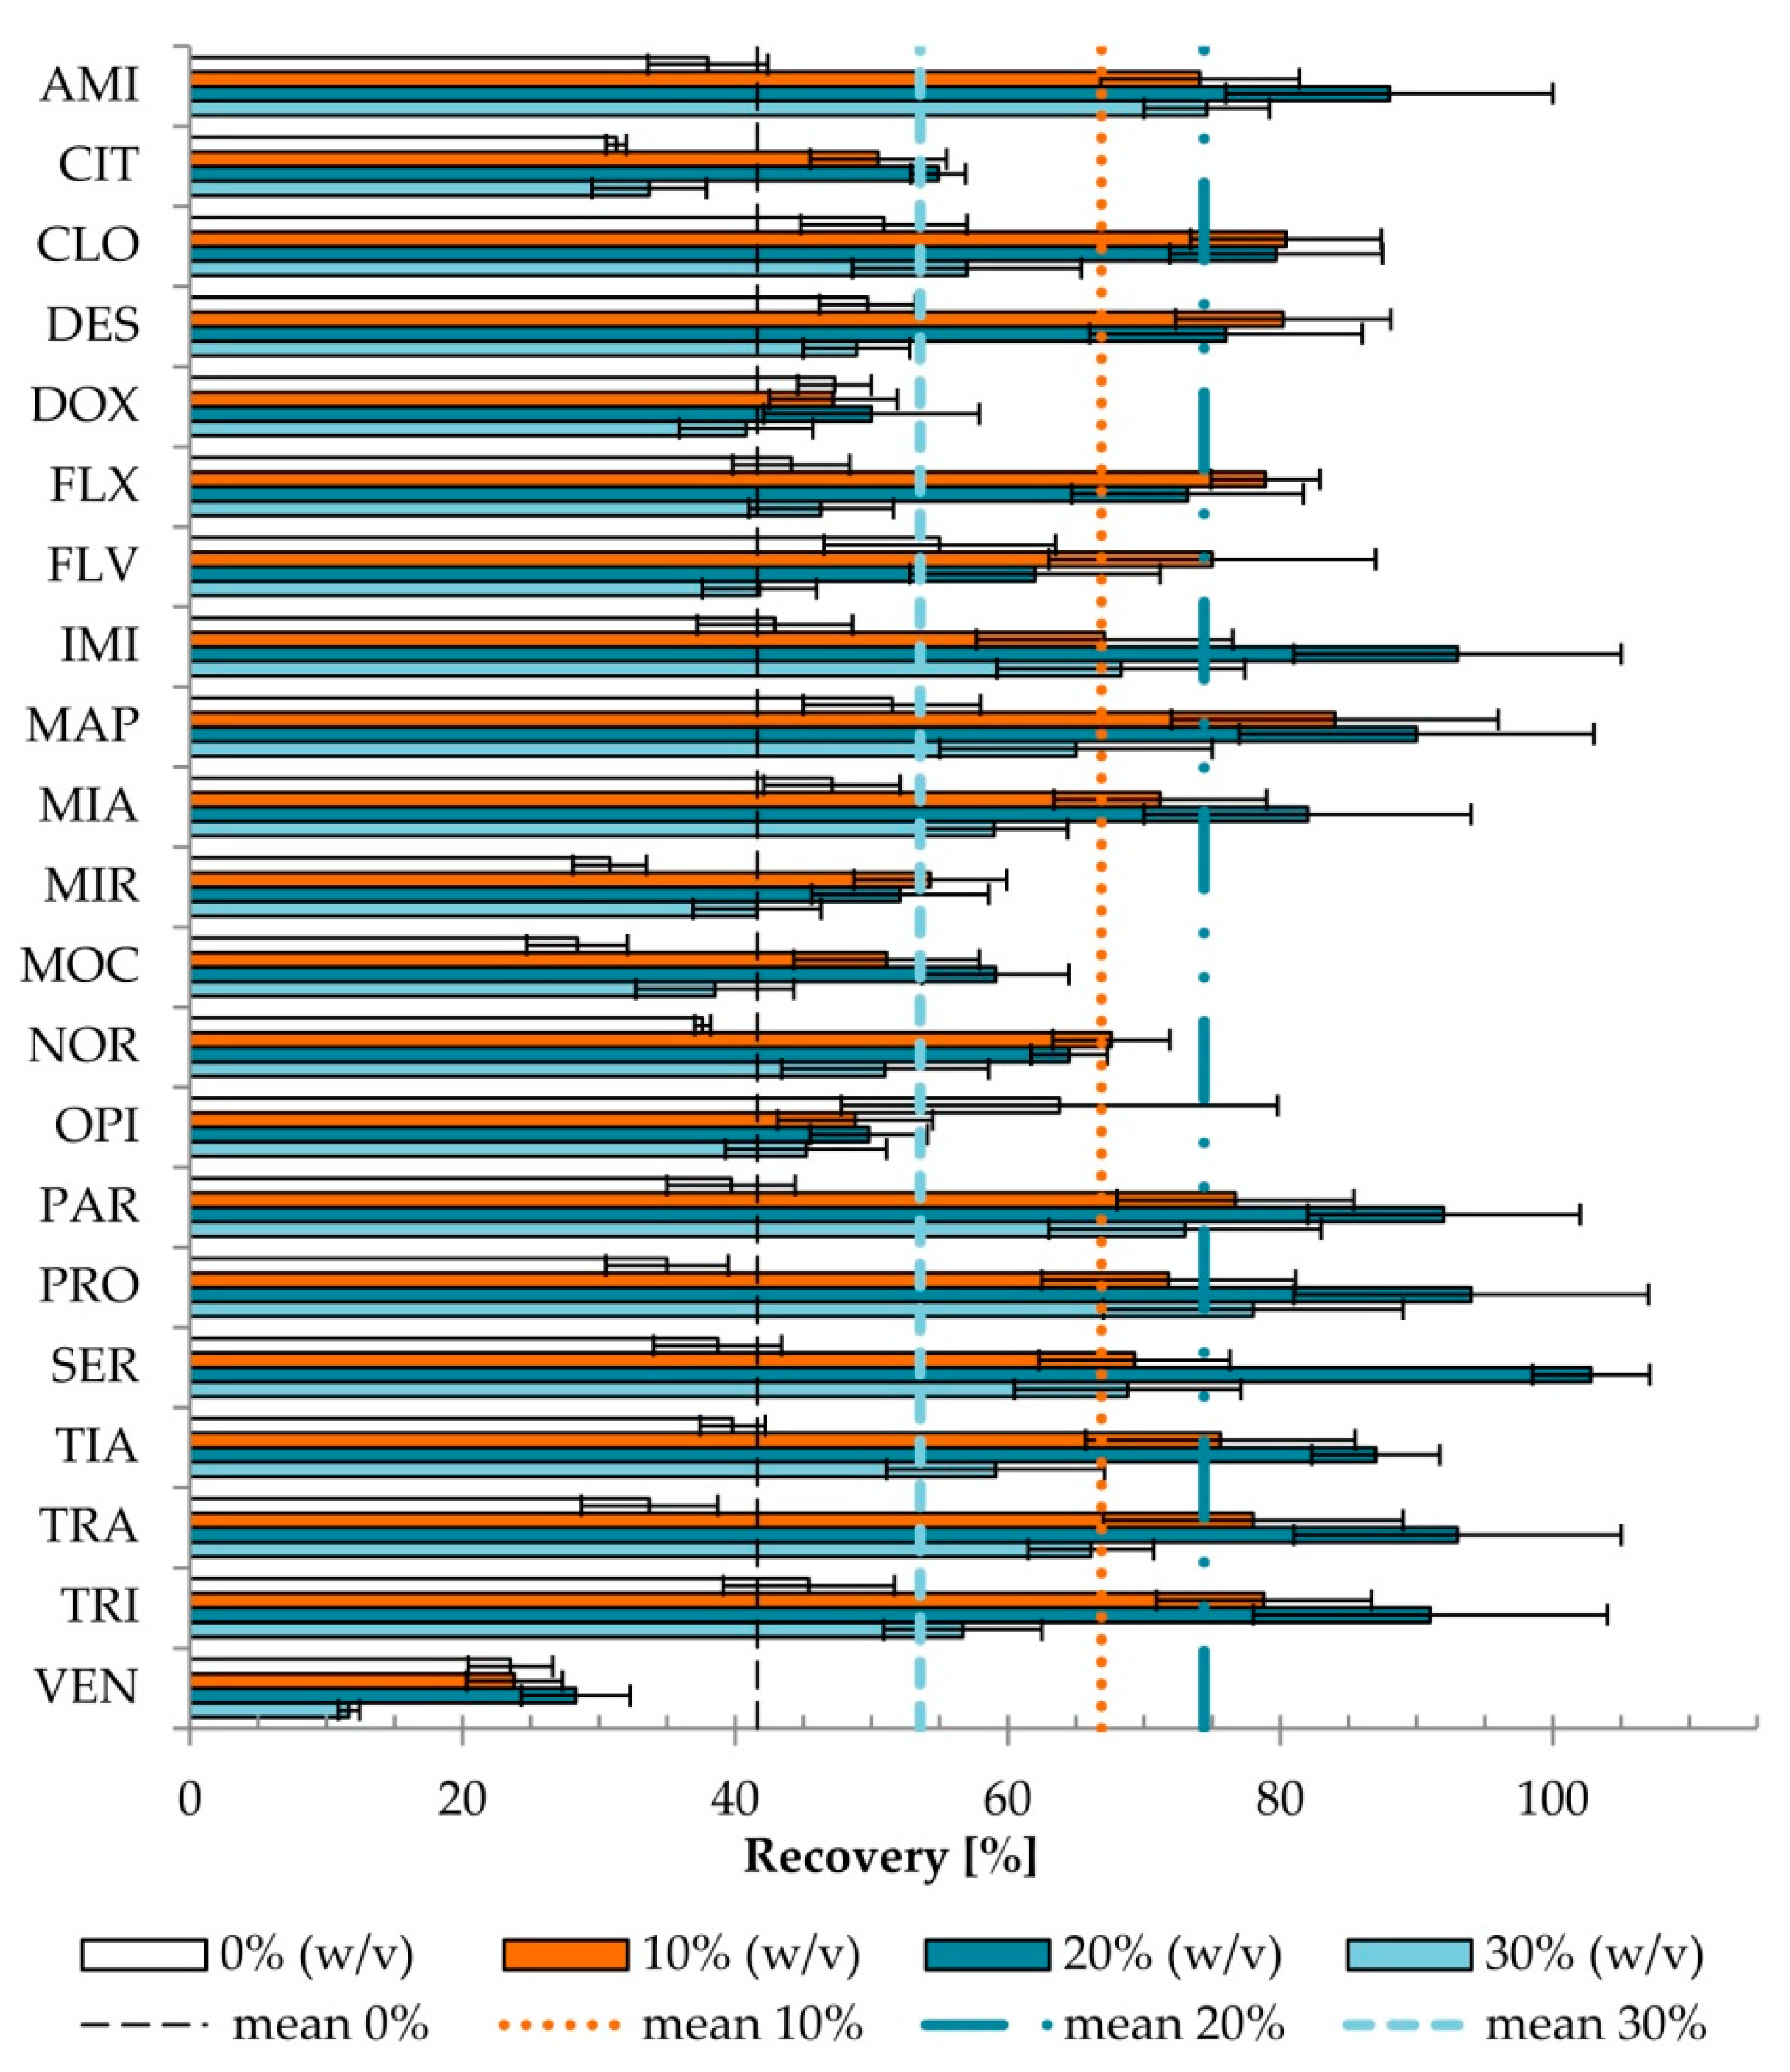
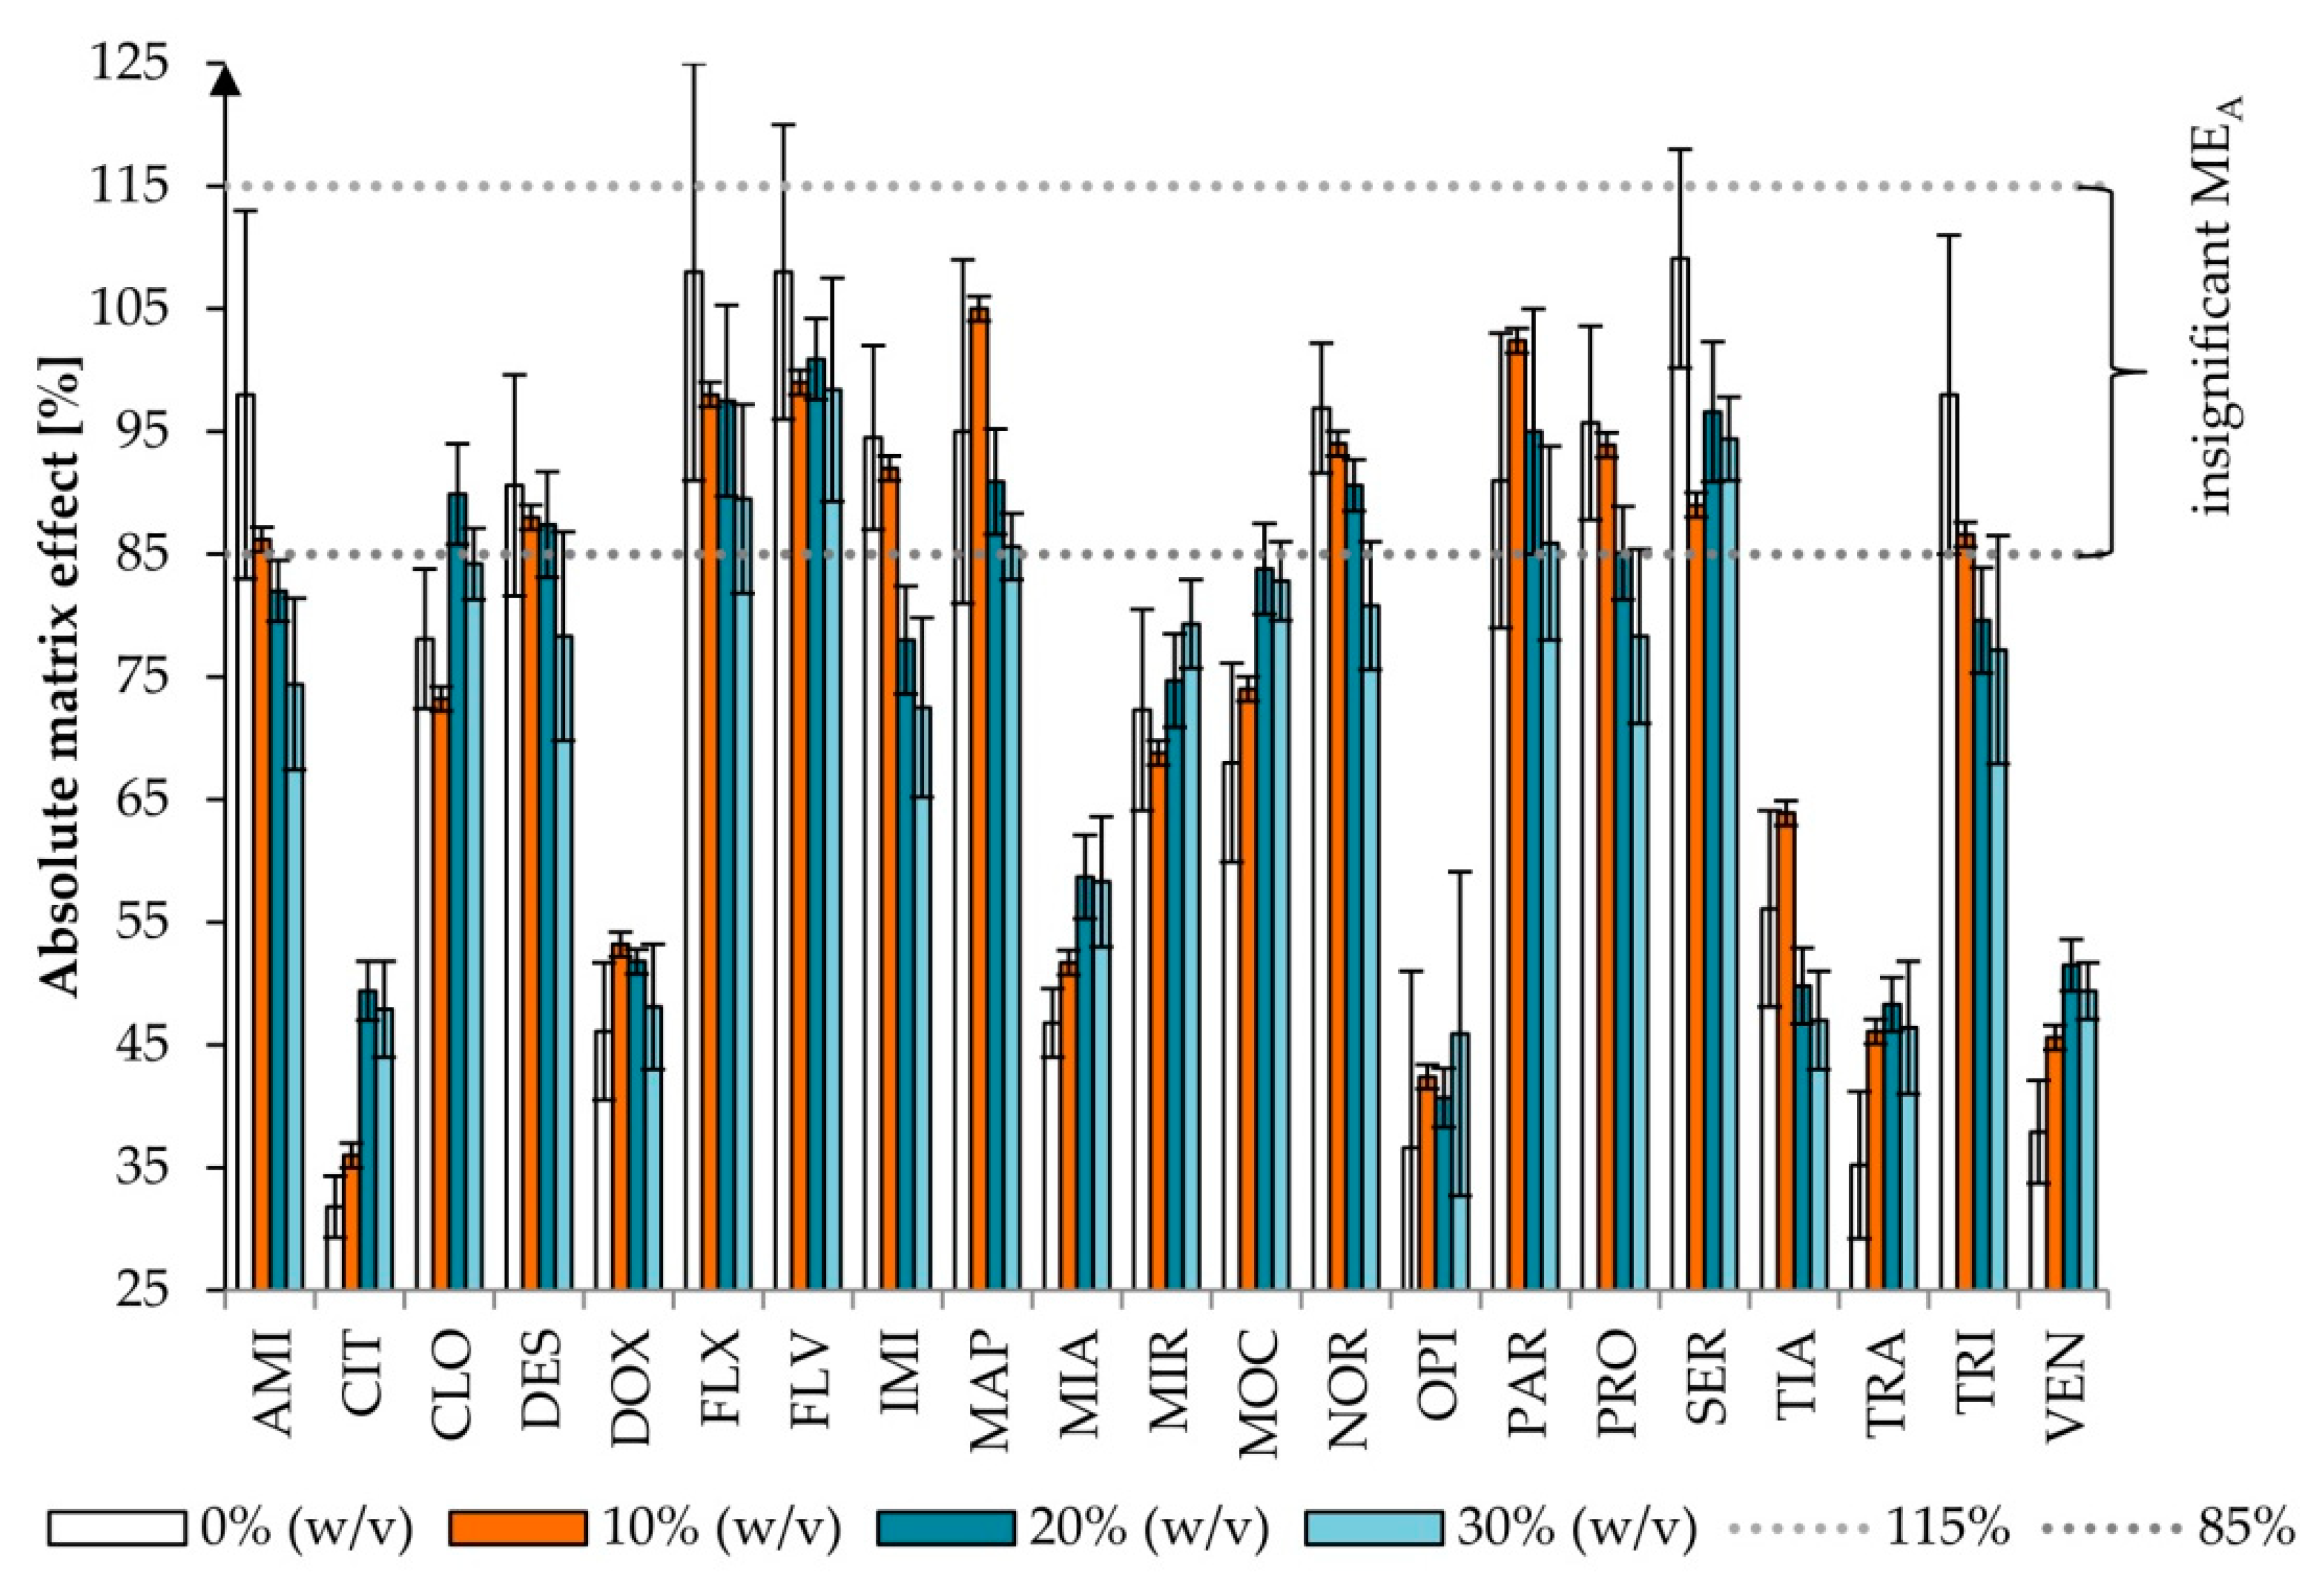
2.1.2. The Effects of Salt Addition

Salts affect the extraction efficiency by decreasing or increasing the analyte concentration in the aqueous phase and CMC. Effects of salt addition depend on the concentrations of salts and the type of surfactant used. For the nonionic surfactants, such as Triton X-114, the value of CMC decreases with an increasing concentration of the electrolyte [35,36,37,38,39,40]. The anions (i.e., Cl- and SO42-) are likely to decrease self-association of water molecules, whereas the cation (i.e., Na+) may decrease the cloud point by dehydration of the polyoxyethylene chain [39,41]. Electrolytes support demulsification, which is needed to limit the amount of impurities in the final surfactant-rich phase [40]. The other important effects of electrolytes are the decrease in the cloud point temperature and promotion of phase separation by increasing the density of aqueous phase [8,41]. However, overly large amounts of salts can cause the formation of three phases, as observed in our study [8].
The most frequently used concentration of different salts is 4–6% [32], increasing the recovery of the analyte by 10–20%. The opposite effect was observed if the salt concentration ranged from 7 to 10%. Improvement of extraction efficiency associated with salt addition was probably due to the salting-out effect, which reduces the amount of water to dissolve the analyte. While the overly high concentration of salt will competitively carry substances into the protein deposition, it can lower the concentration of drug in the solution and will have an impact on the recovery [41]. Even if the addition of salt increases the recovery, non-volatile salts contaminate the ion source in LC–MS. Thus, we tested the addition of the volatile salt (AA) in three variants: 10, 20, and 30% (w/v) (sample pH 6.8, 6% (w/v) of Triton X-114). The influences of various concentrations of salt added on the recovery and MEA were evaluated (Figure 3 and Figure 4).
There was a statistically significant difference (p < 0.001) in recovery depending on the concentration of AA used in the tested conditions (sample pH 6.8, 6% Triton X-114). The differences occurred between all sample variants. The addition of 10% (w/v) AA increased recovery 1.64 times on average (range 0.87–2.31), while 20% (w/v) AA increased recovery 1.85 times on average (range 0.88–2.76), compared with the sample without the addition of AA.
The addition of 30% (w/v) AA resulted in lower recovery than the addition of 10% or 20% (w/v) of AA. Moreover, for 20 and 30% (w/v) of AA, three phases were observed (from the bottom of the tube: an aqueous phase, a micelle-rich phase, an aqueous phase), unlike for 0 and 10% (w/v) of AA, for which only two phases were formed (lower layer—micelle-rich phase; and aqueous surfactant—lean phase above). To separate the micelle-rich phase, an upper surfactant-lean phase was decanted. In the cases of 20 and 30% (w/v) of AA, the microsyringe should be used to remove the lower aqueous surfactant-lean phase from the bottom of the test tube. Thus, although the mean recovery was higher for 20% (w/v) AA, the addition of 10% (w/v) AA was selected as the most convenient concentration. Similar observations of the influence of electrolytes on the location of the micellar phases in the tube were reported [35].
MEA can be observed as signal suppression (below 100%) or an enhancement (above 100%) in the presence of a matrix. Significant MEA <85% or >115% was observed for 10, 10, 12, and 16 out of 21 studied drugs for 0, 10, 20, and 30% (w/v) of AA, respectively. The differences were not statistically significant (χ2 test, p = 0.198), nor were they in statistical analysis performed only for the compounds with significant MEA (p = 0.244). In all variants of AA, insignificant MEA was observed for five compounds: FLX, FLV, MAP, PAR, and SER. For 0 and 10% (w/v) of AA, that was additionally observed for AMI, IMI, and TRI, whereas for 0, 10, and 20% (w/v) of AA, that was the case for DES, NOR, and PRO.
The effect of salt adding (sodium chloride) on the recovery of only one antidepressant venlafaxine in the CPE procedure was reported for the concentration range 0.1–0.5 M. The concentration of NaCl 0.3 M was chosen as optimal [8]. In this work, AA was used first time in CPE procedure combined with LC–MS not only for venlafaxine determination but also other 20 antidepressants. As the optimal concentration of salt, 1.3 M AA (10% (w/v) of AA) was selected.

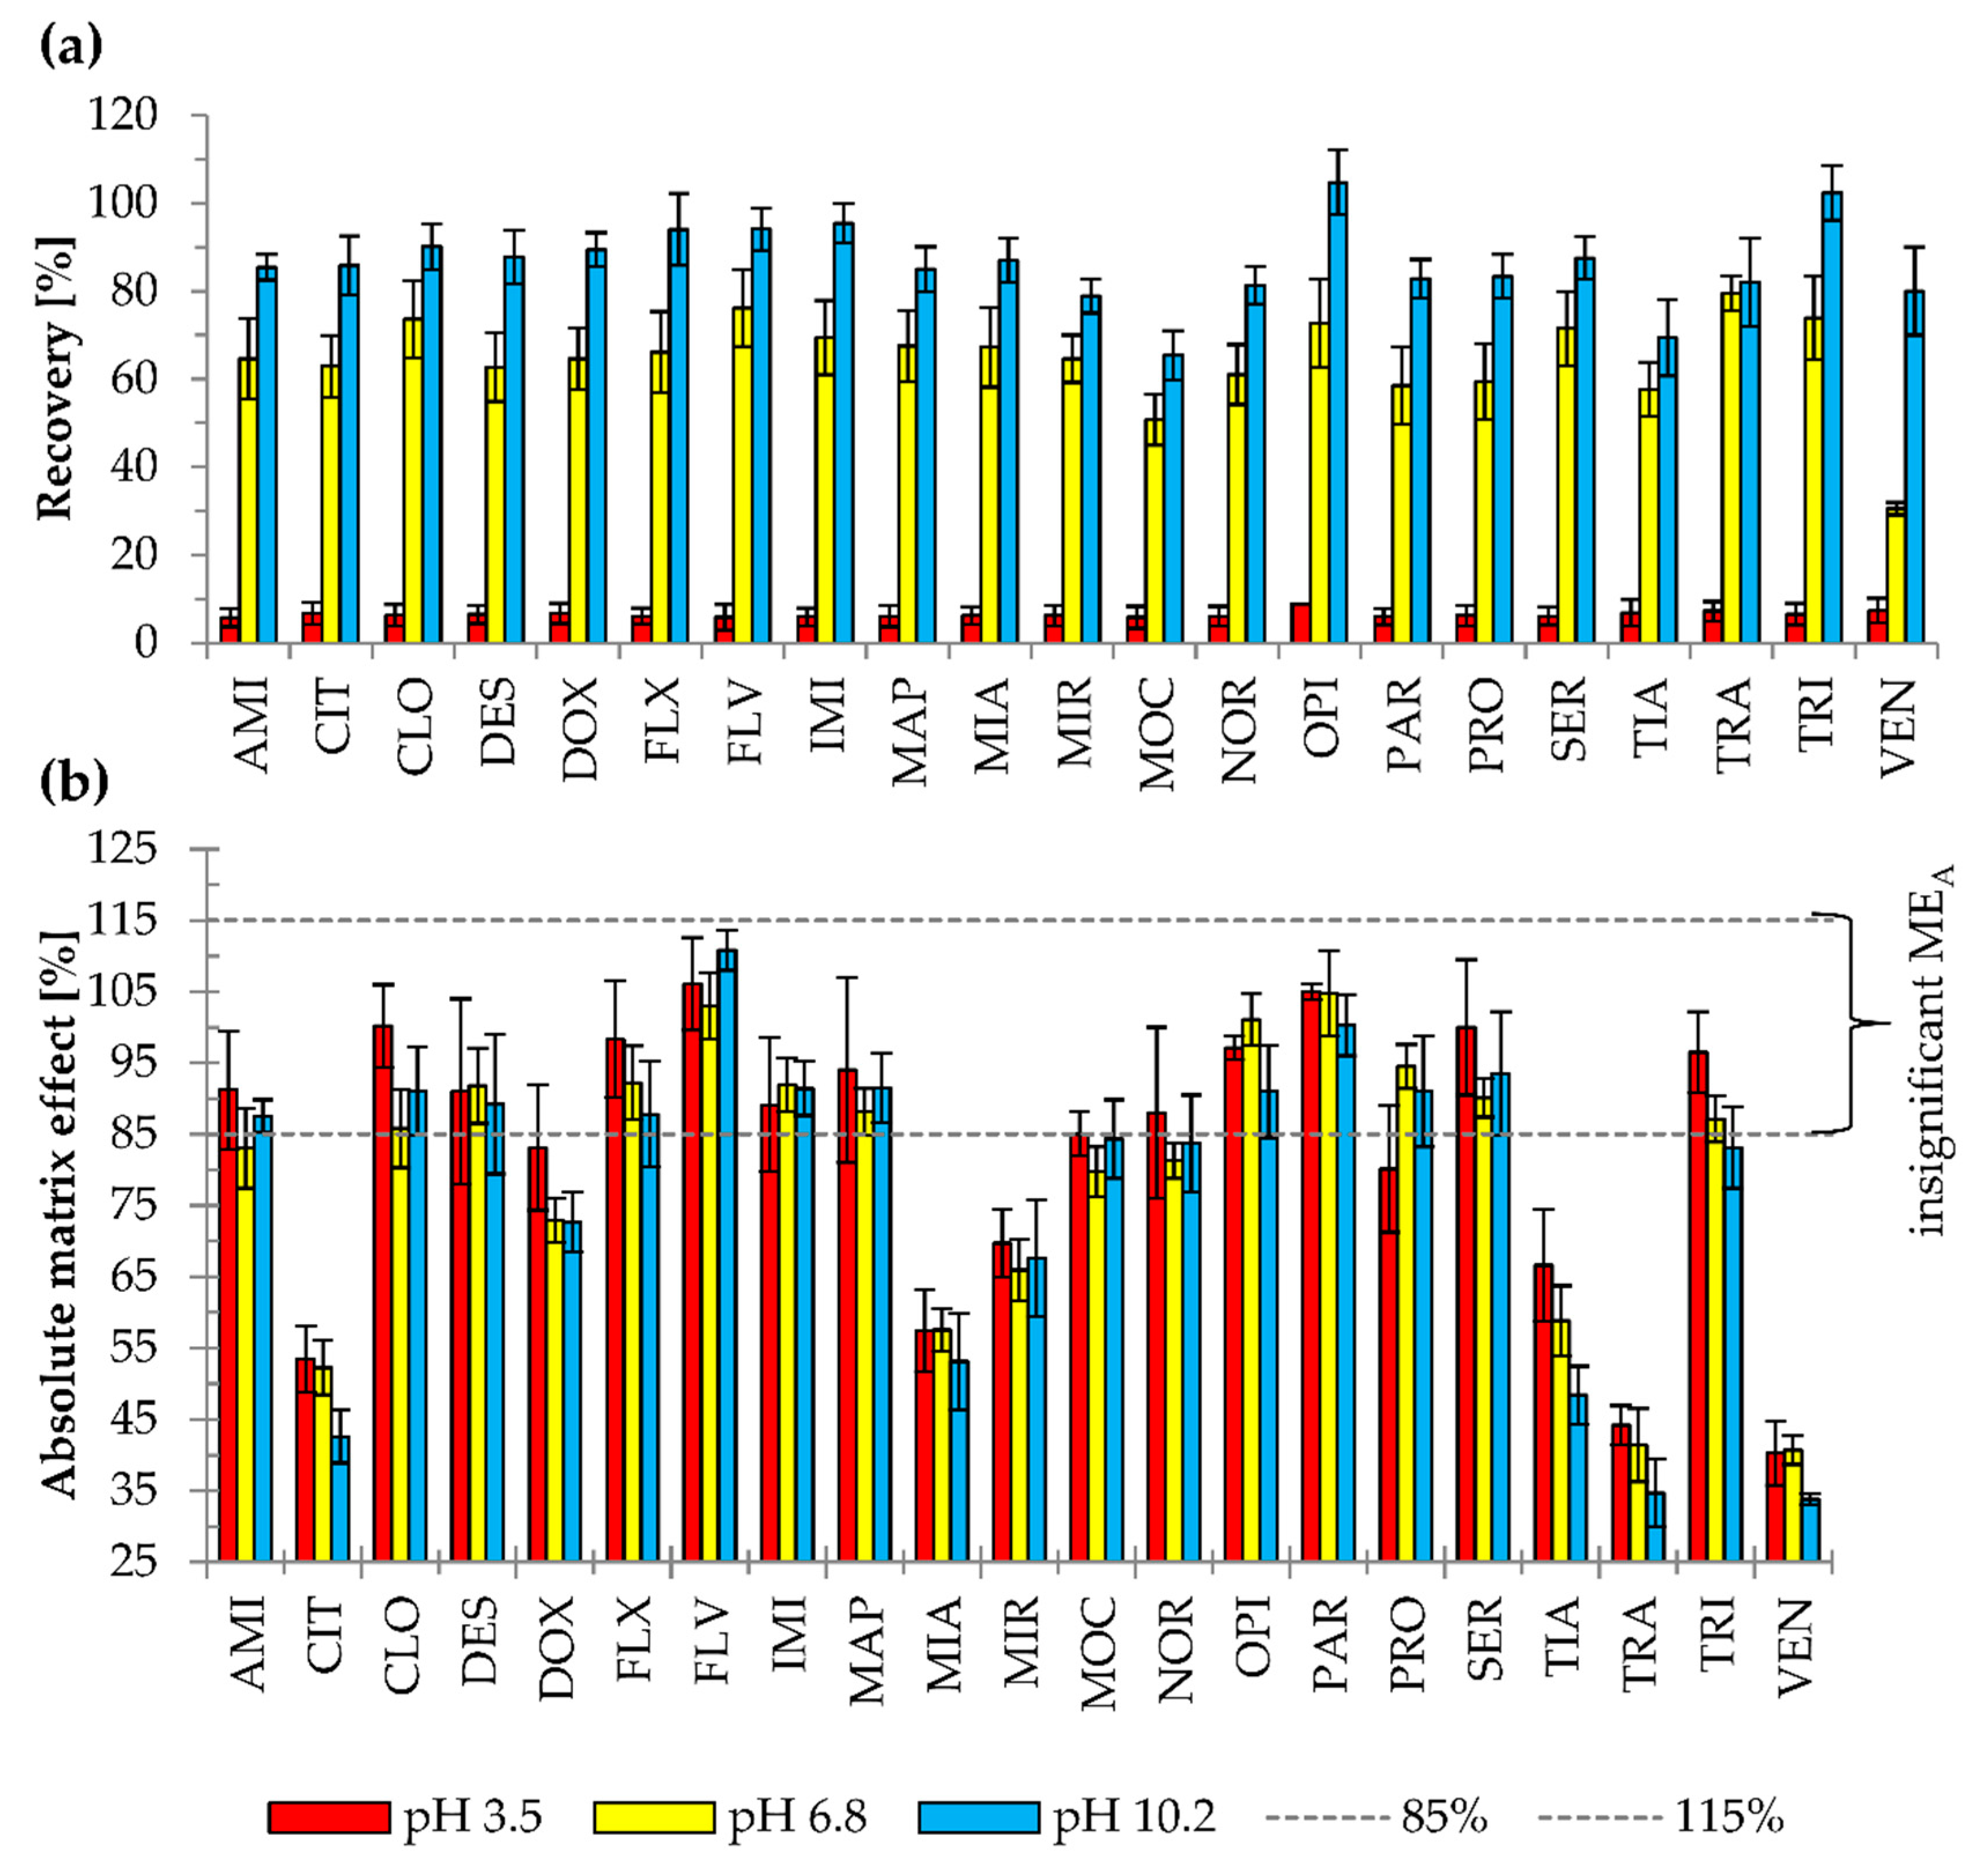
2.1.3. The Effects of pH

Depending on the sample pH, analytes can be either charged or uncharged. That also depends on the chemical properties of said analytes. The interaction of the analyte with the micellar aggregate formed by a nonionic surfactant is weaker for ionic than the neutral form. Thus, the highest recovery can be observed at pH where all analytes are uncharged and partitioned into the rich-micellar phase of Triton X-114 or another nonionic surfactant [37,42].
The effect of sample pH was examined using 6% (w/v) Triton X-114 and 10% (w/v) AA at pH 3.5, 6.8, and 10.2 (Figure 5). The mean recoveries were 6.4, 64.7, and 86.2% for acidic, neutral, and alkaline conditions, respectively. The majority of antidepressants studied have basic and lipophilic properties. In alkaline pH, more particles occur in molecular form; thus, higher affinity to nonionic micelles and higher extraction recovery were observed. At acidic pH, the majority of the antidepressants were in ionic form and had their lowest affinity for nonionic micelles. That resulted in the loss of some of the analytes during phase separation and low extraction efficiency. Moreover, the separation of two phases—the aqueous and micelle-rich ones—in the acidic and neutral pHs, was not as pronounced as in alkaline pH.
Statistical analysis (p < 0.001) indicated significant differences in recovery of the extraction performed at various pH values. However, no relationship between the pH of the extraction environment and the number of compounds exhibiting significant MEA was observed (test χ2; p = 0.514). Statistical analysis carried out for compounds with significant MEA (ANOVA, p = 0.013) showed statistically significant differences in MEA between pHs. The results of the post hoc test revealed that these differences occurred between the alkaline and acidic environment (p = 0.004). The mean MEA was 6.1% lower for samples with a pH of 3.5 than those of pH 10.2. However, it should be emphasized that in acidic conditions, the basic compounds have less affinity to nonionic surfactant micelles, which resulted in the lower analytical signal and lower recovery. Moreover, the separation into two phases was not distinct in acidic pH or neutral pH, which caused the loss of analytes during phases separation. Thus, pH 10.2 was selected as optimal to use in the final method.
Madej and Persona [2] developed a CPE to extract basic compounds (pKa 9.0−9.5) at pH 12, with Triton X-114 at 3.25% (w/v), without salt addition. The recoveries were 26.2, 81.4, 77.3, and 98.5% for paracetamol, amitriptyline, clomipramine, and promazine, respectively [2]. In this paper, the number of isolated compounds from plasma in the basic environment (pH 10.2) was much higher (n = 21 vs. n = 4) and the pKa range was wider (pKa 6.0−10.5). A higher mean recovery (86.2%) was observed than in the reported experiment (70.9%). Compared to the recovery of particular compounds, higher recoveries were achieved for AMI (81.4 vs. 85.4%) and CLO (77.3% vs. 90.1%). OPI was extracted as a neutral compound at pH 6, which resulted in 21.8% recovery, while in this study at pH 10.2, the recovery was 102.5% [2]. Thus, the extraction at pH 10.2 and the addition of AA allow for efficient isolation of antidepressants from biological matrices by the CPE method. Additionally, the extraction environment does not significantly affect the number of compounds exhibiting a matrix effect.

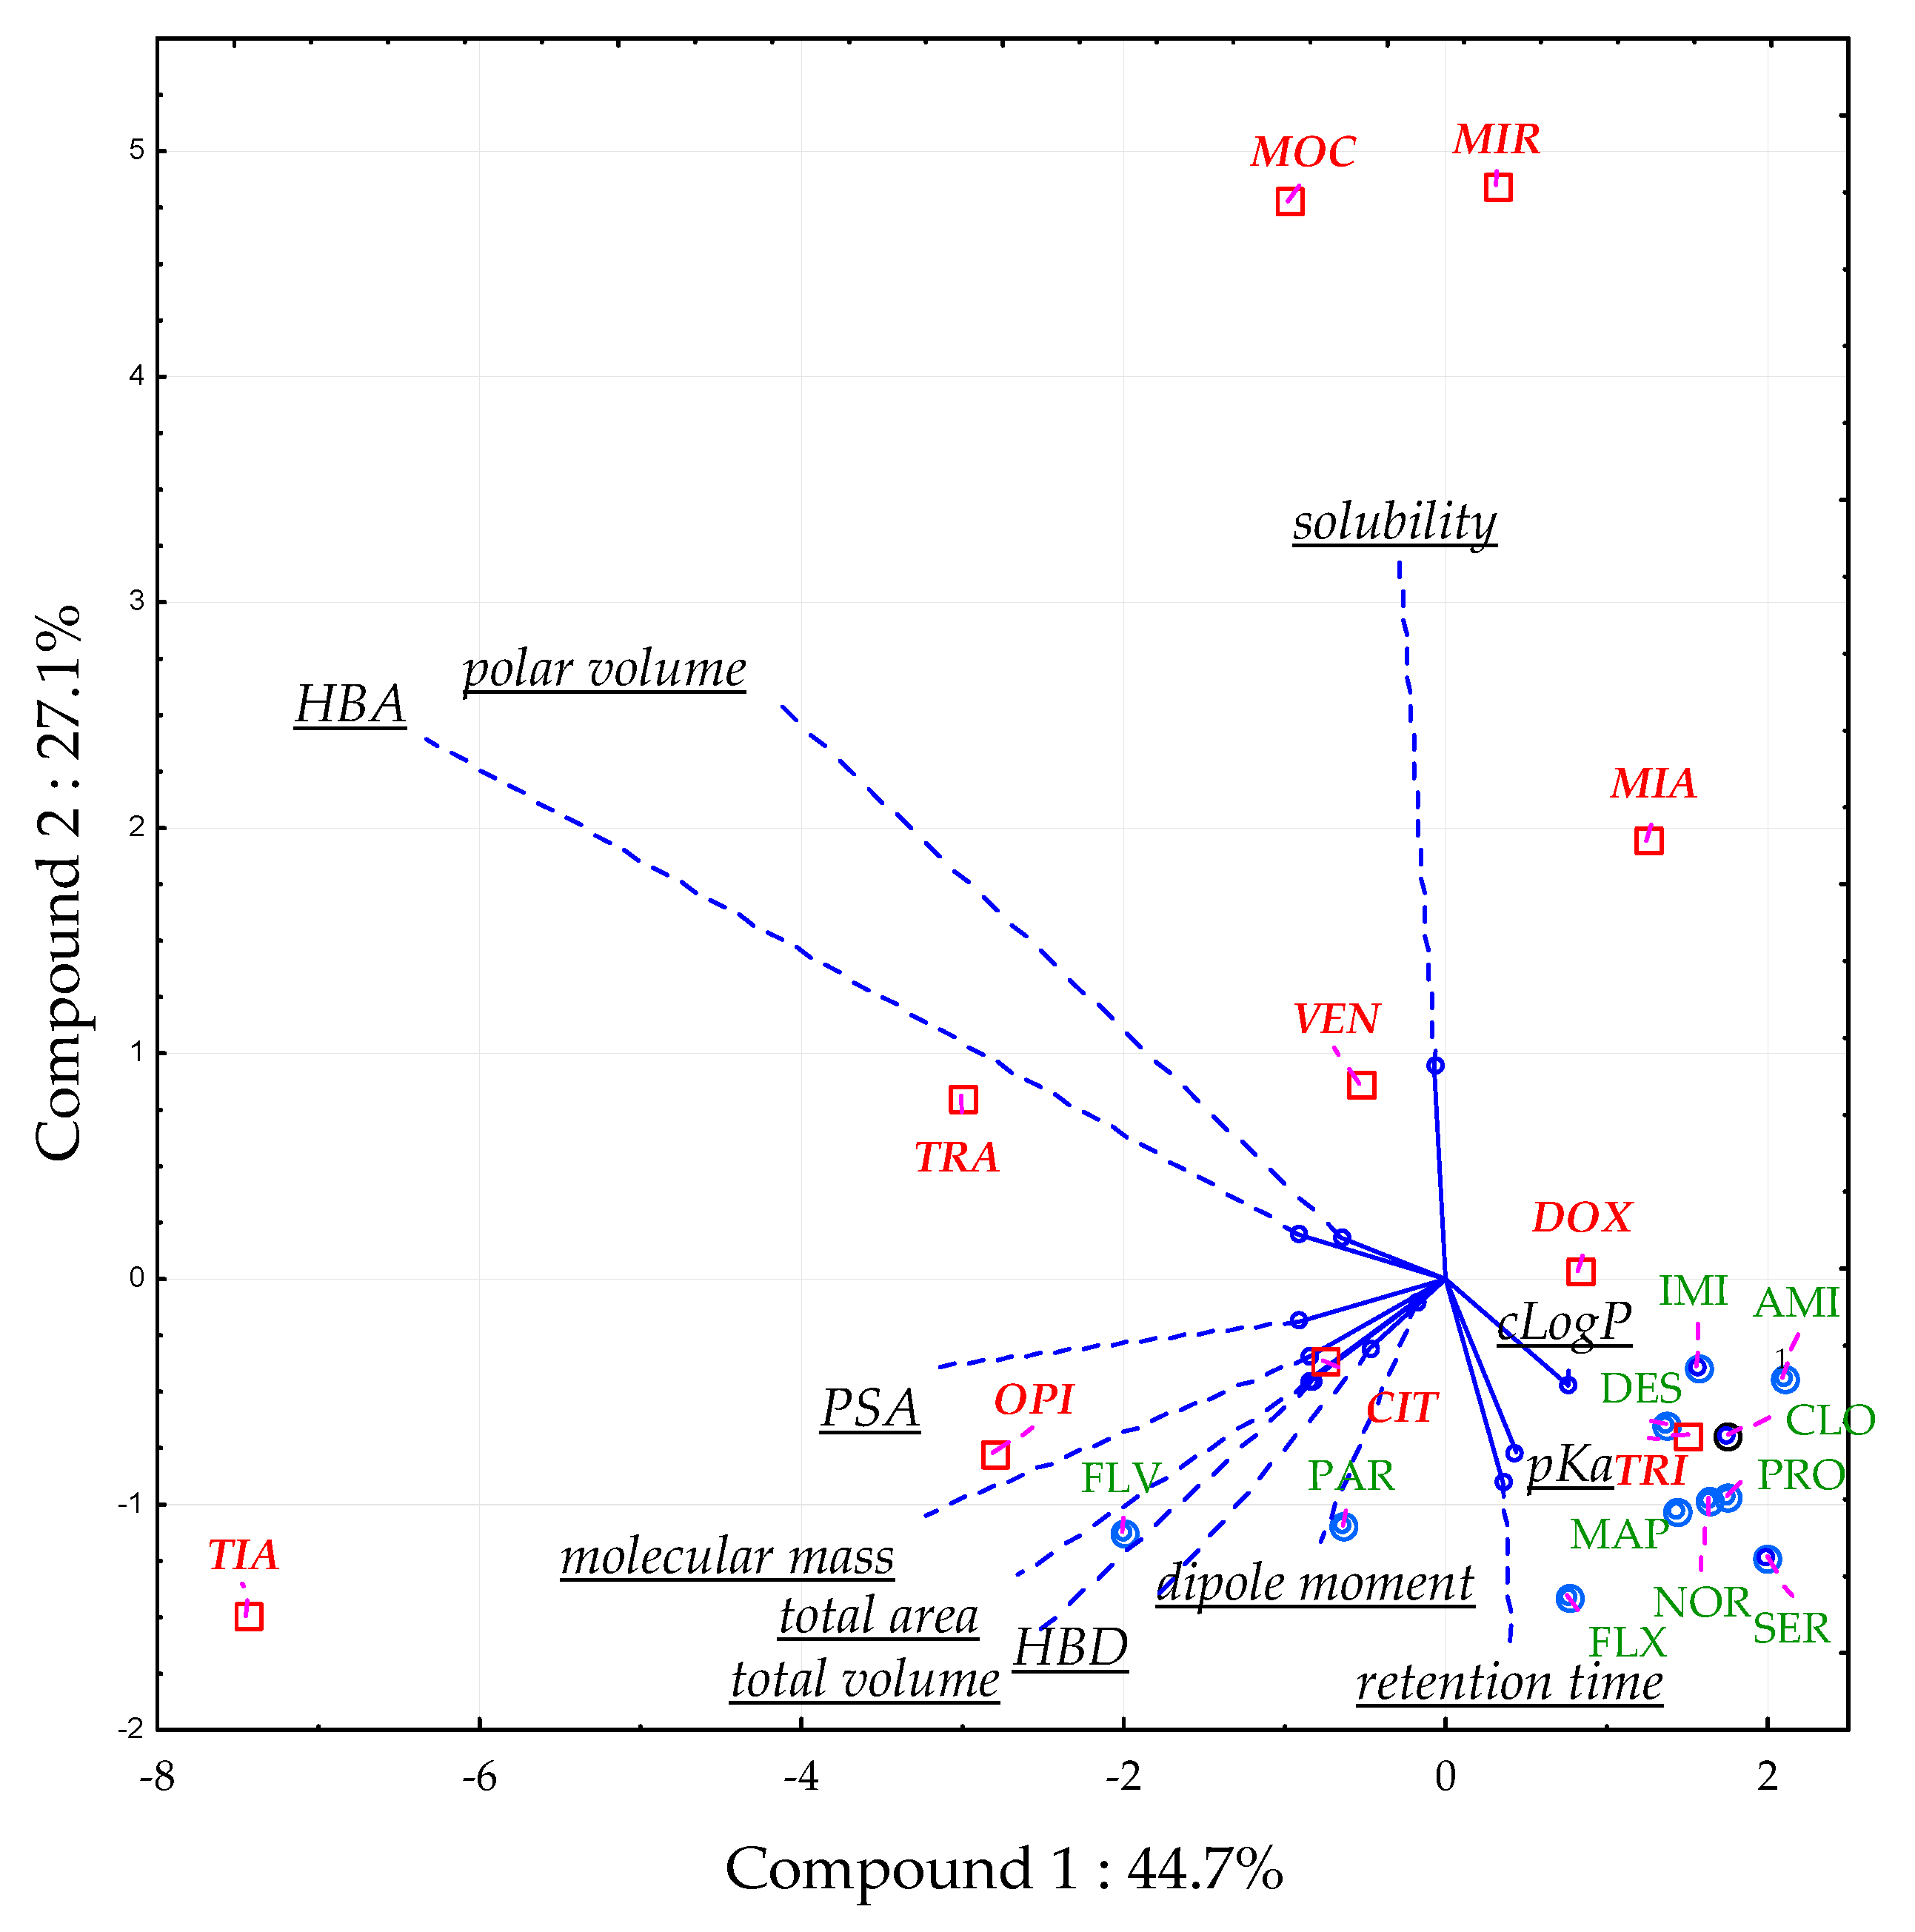
2.1.4. Principal Component Analysis (PCA)

Some compounds revealed significant MEA in all tested conditions (CIT, DOX, TRA, VEN). All of them showed a significant surfactant effect (the ratio of peak area of the analyte in a solvent with the surfactant to that without the surfactant) previously [31]. That means that the MEA observed is not related to impurities extracted from plasma, but the presence of Triton in the sample. PCA was used to determine which molecular descriptors (polar volume, pKa, cLogP, dipole moment, number of hydrogen bond acceptors (HBA), number of hydrogen bond donors (HBD), total volume, molecular mass, total area, polar surface area (PSA)) influenced the MEA in optimal conditions [31]. Retention time and predicted water solubility were also added to the analysis. Three principal components (PC) accounted for 82.4% of the total variation. PC1 (44.7% of the total variation) was correlated mainly with the number of HBA (−0.91), PSA (−0.90), total area (−0.85), molecular mass (−0.85), and total volume (−0.83). In turn, PC2 (27.1% of the total variation) was correlated with the retention time (−0.90), pKa (−0.77) and solubility (0.94), and PC3 (10.6% of the total variation) with the dipole moment (0.78) and HBD (0.58). The best predictors of MEA occurrence were PC1 (PSA, total area, total volume, molecular mass, and the number of HBA) and PC2 (retention time, pKa, and predicted solubility) (Figure 7).
Low polar volume; few HBA; low solubility; and high values of retention time, pKa, and cLogP indicated that the MEA should not be expected. Compounds with lower lipophilicity (low cLogP and high polar volume) and low pKa were prone to significant MEA [31].

2.2. Analytical Performance of the Proposed Method

After development, the analytical method’s performance was evaluated in terms of linearity, accuracy, precision, the lower limit of quantification (LLOQ = 10 ng/mL), and stability (autosampler, short-term, freeze and thaw). The interference from metabolites was not studied, since it occurs rarely in mass spectrometry. Due to different masses, metabolites were differentiated from parent compounds using LC–MS (Table A1). In some cases, European Medicines Agency (EMA) guidelines recommend the evaluation of the possibility of back-conversion of a metabolite into the parent analyte during the successive steps of the analysis. However, it is performed only when relevant (i.e., in case of potentially unstable metabolites—e.g., acidic metabolites to esters, unstable N-oxides, or glucuronide metabolites, lactone-ring structures) [43]. It is not an issue in the case of antidepressants.

2.2.1. Linearity

Calibration standards of eight concentrations of all analytes were prepared in blank plasma. The curves (n = 6) were obtained by weighted linear regression analysis with w = 1/x. The regression parameters for all analytes were described by the equation: y = ax + b. The values of a, b, and r2 for all analytes are presented in Table A2. Good linearities covered the range of 10–750 ng/mL with a coefficient of determination (r2) > 0.990 were obtained for all analytes regarding the peak area ratio of every analyte to internal standard (IS)versus the nominal concentration.
The linearity range of the method corresponds to therapeutic concentrations of determined antidepressants in human plasma and is similar to the reported ranges [20,21,22,28,29].

2.2.2. Limit of Quantification, Precision, and Accuracy

Intra-run and between-run accuracy and precision of the method for LLOQ (10 ng/mL) and QC (quality control; 16, 375, and 625 ng/mL) samples for all analytes were determined. For each LLOQ, a signal-to-noise ratio (S/N) higher than five (from 7.0 to 76.1) was observed. The accuracy was within the acceptance criteria of 85–115 and 80–120% for each QC sample and LLOQ, respectively. The precision was within the acceptance criteria, < 15 and < 20% for QC and LLOQ respectively. Precision was in the range 0.6–14.0%, and accuracy was from 85 to 114% (Table 1). Chromatograms of the analyzed antidepressants extracted from blank plasma and high QC are presented in Figure A1.
The results were repeatable and reproducible and met the criteria of the EMA [43] and the U.S. Food and Drug Administration [44] in the guidelines on bioanalytical method validation. The obtained precision is comparable to the reported values for the other extraction methods of isolating the antidepressants from plasma [20,21].

2.2.3. Stability

All analytes and IS were stable under all tested conditions: autosampler stability (stability in the extract, 48 h at 4°C); and stability in human plasma, i.e., short-term stability (3 h at room temperature), and freeze-thaw stability (3 cycles at −20 °C). The QC (16 and 625 ng/mL) samples showed no significant changes in comparison to nominal concentrations. In all cases, accuracy and precision were found to be within the acceptable limits of ± 15% in both cases, as shown in Table A3.

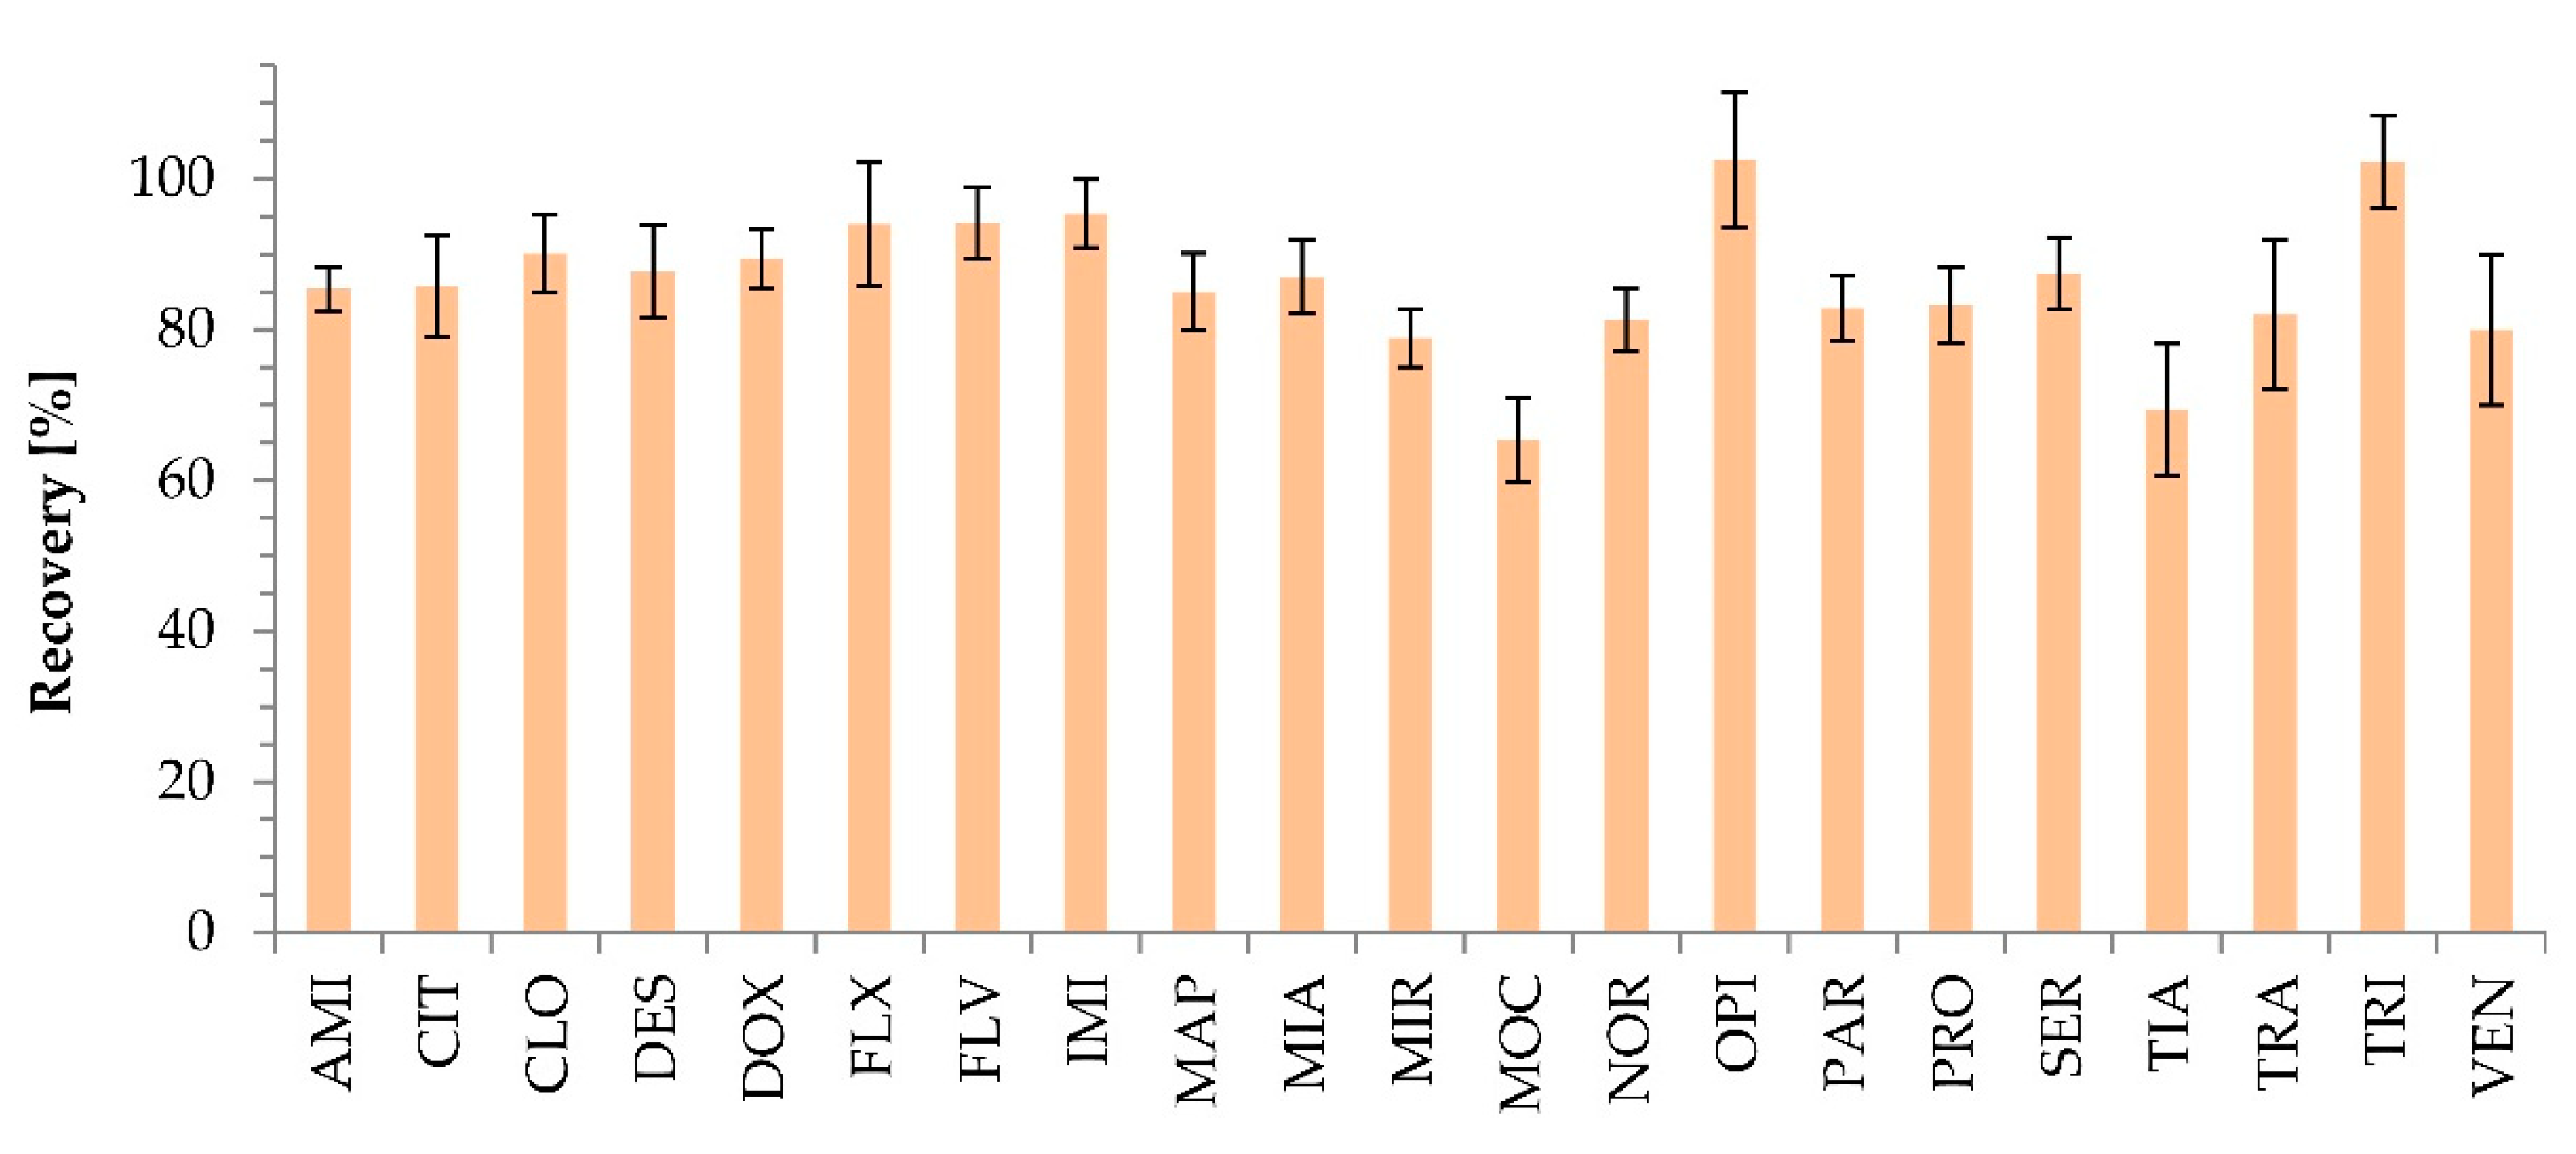
2.2.4. Matrix Effect and Recovery

The significant matrix effect was observed for eight and seven out of 21 antidepressants, for 16 and 625 ng/mL, respectively. However, since the effect was compensated by the addition of the internal standard, it did not affect the method’s accuracy and precision. It was proven by the variability of relative matrix factor (MF). The calculated coefficient of variation (CV) of the IS-normalized MF did not exceed 15% for all tested compounds (Table A4). The mean CV values were 10.2% (5.7%–15.0%) and 7.1% (2.6%–13.9%) for the concentrations of 16 and 625 ng/mL, respectively. The maximum mean CV equal to 15.0% was obtained for MIA and VEN for low QC (Table A4). The hemolysis and lipemia did not influence the method reliability.
We compared the mean MEA with the values reported using other extraction techniques. The values were 122% (96–156%) and 110% (101–125%) for LLE [20], and 93.5% (47.5–115.6%) and 88.1% (48.0–107.8%) for CPE for 17 compounds at lower and higher concentrations, respectively. For five compounds extracted using SPE, the values were 102% (88–121%) and 102% (99–108%) [22] compared to 99.6% (58.2−115.6%) and 92% (54.2–107.8%) for CPE at lower and higher concentrations, respectively. The mean matrix effect of 89% (82-94%) for 12 compounds extracted using on-line SPE (1000 ng/mL) [21] was observed, whereas for CPE (625 ng/mL) was 93.2% (44.5–107.8%). Thus, CPE has a comparable mean MEA to the other extraction methods, such as LLE or SPE. However, some compounds revealed significant ion suppression.
The efficiency of the extraction is determined by recovery. Recovery higher than 80% was noted for 85% of the test compounds (Figure A2). Thirteen out of 21 compounds, AMI, CIT, CLO, DES, DOX, FLX, FLV, IMI, MAP, MIA, OPI, SER, and TRI, showed satisfactory (85 to 115%) recovery. The lowest extraction efficiency was obtained jointly for MOC (65.4%) and TIA (69.4%).
In comparison to the classic LLE developed by Fernández et al. (2012) including AMI, CIT, CLO, DES, DOX, FLX, FLV, IMI, MAP, MIA, MIR, MOC, NOR, PAR, SER, TRA, and VEN [20], mean recovery obtained for the CPE method in our study was 10.6% higher. The SPE extraction for SSRIs such as CIT, FLX, FLV, PAR, and SER provided recovery within 71–85% (mean 80%) [22], while the developed CPE extraction of these compounds was 83–94% (mean 89%). In another modification of the SPE method for AMI, CIT, CLO, DES, FLX, FLV, IMI, NOR, PAR, TRA, and VEN, the recovery was 99.6–99.9% (mean 99.8%) [21]. The CPE method developed guarantees the recovery of these compounds at the level of 80.0–95.4%, on average 87.2% (Table 2).

3. Materials and Methods

3.1. Materials

Four lots of human plasma with EDTA as an anticoagulant were obtained from the Regional Blood Donation and Blood Therapy Centre (Warsaw, Poland). Besides, plasma with visible hemolysis and plasma with visible lipemia were obtained from the Public Central Teaching Hospital (Warsaw, Poland).

3.2. Reference Standards and Chemicals

Reference standards (n = 21, purity ≥ 98%) (AMI, CIT, CLO, DES, DOX, FLX, FLV, IMI, MAP, MIA, MIR, MOC, NOR, OPI, PAR, PRO, SER, TIA, TRA, TRI, and VEN) were purchased from Sigma-Aldrich (St. Louis, MO, US = Merck KGaA, Darmstadt, Germany). The isotope-labeled standard (purity ≥ 98%) FLX-d5 and SER-d3 were purchased from Toronto Research Chemicals, VEN-d6 (0.1 mg/mL in methanol) from LoGiCal (LGC, Luckenwalde, Germany). Ammonia solution 25% and ethyl alcohol 96% were obtained from Avantor Performance Materials (Gliwice, Poland). Methanol and acetic acid glacial (anhydrous for analysis, EMSURE®) were purchased from Merck KGaA (Darmstadt, Germany). Ammonium acetate was obtained from Chempur (Piekary Śląskie, Poland). Surfactant TritonTMX-114 was obtained from Sigma-Aldrich Co (Merck KGaA, Darmstadt, Germany).

3.3. Chromatographic and Mass Spectrometric Conditions

Instrumental analysis was performed on an Agilent 1260 Infinity (Agilent Technologies, Santa Clara, CA, US), equipped with an autosampler, degasser, and binary pump coupled to a hybrid triple quadrupole/linear ion trap mass spectrometer QTRAP 4000 (ABSciex, Framingham, MA, US). The Turbo Ion Spray source was operated in the positive mode. The ion spray voltage and source temperatures were 5000 V and 600 °C, respectively. The curtain gas, ion source gas 1, ion source gas 2, and collision gas were set at 345 kPa, 207 kPa, 276 kPa, and ”high” instrument units, respectively [4]. The target compounds were optimized and analyzed in the Multiple Reaction Monitoring (MRM) mode (Table 3).
Chromatographic separation was achieved with a Kinetex C18 column (100 mm × 4.6 mm, 5μm, Phenomenex, Milford, US) and gradient elution: (%B) 0 min 20%, 1 min 20%, 3 min 95%, 9 min 95%. [4,31]. Phase A consisted of HPLC grade water with 0.1% (v/v) formic acid, whereas phase B was methanol and 0.1% (v/v) formic acid. The flow rate was 0.75 mL/min. Total time of chromatographic analysis was 11 min, including 2 min for re-equilibration. The injection volume was 10 μL.

3.4. Preparation of Solutions

The surfactant Triton X-114 solutions were prepared at 5 and 20% (w/v) and were used to obtain final surfactant concentrations of 1.5 and 6%, respectively. The standard stock solutions of antidepressants were made by dissolving 10 mg of the reference standard in 10 mL of methanol and were stored at −39 °C. The standard working solutions of 25 μg/mL for the validation and 500 ng/mL for development were prepared by mixing equal volumes of 21 different stock solutions and the appropriate volumes of water.
The internal standard stock solutions SER-d3, FLX-d5 (1 mg/mL), and VEN-d6 (0.1 mg/mL) were prepared in methanol. Each internal standard working solution (500 ng/mL) was prepared by mixing the internal standard stock solution with an appropriate volume of water.
FLX-d5 was an internal standard for AMI, DES, DOX, FLX, FLV, IMI, MAP, MIR, OPI, PAR, PRO, and TRI; SER-d3 was an internal standard for CLO, MIA, MOC, NOR, and SER, and VEN-d6 was an internal standard for CIT, TIA, TRA, and VEN.

3.5. Sample Preparation

The experiment consisted of the method development and validation part. All the experiments were performed in human plasma with EDTA as an anticoagulant. Tested parameters are shown in Table 4 and Figure A3. The method of extraction was the method of Kojro (2019) [31] with our modifications of Triton X-114 concentration (step a), the addition of AA (step b), and pH (step c), which was selected during the development part.

3.5.1. CPE Procedure—Development

The development was carried out in one source of plasma in 3 kinds of sample fortified by antidepressant standard-mix (50 µL of 500 ng/mL aqueous solution without the isotope-labeled standard) for all 21 analytes at a concentration corresponding to 100 ng/mL in plasma in 5 repetitions: sample A (fortified lower phase after diluting with ethanol), sample B (fortified neat ethanol), and sample C (fortified plasma before extraction). Samples A and B were used to calculate the absolute matrix effect MEA [33], also called matrix factor [43] (Equation (1) in Section 3.6). The final concentrations of analytes in sample A and sample B were all the same. Samples A and C were used to assess recovery (Equation (3) in Section 3.6).
In the first step of development, Triton X-114 at concentrations 1.5 and 6% (w/v) was tested. In the second step, the concentrations of extraction salt AA—0, 10, 20, and 30 % (w/v)—were examined; and in the third step—pHs of 3.5, 6.8, and 10.2 were tested. At every step of development, samples A, B, and C were prepared with various modifications of the studied parameters, as described in Table 4 and Figure A3.
Sample A: An aliquot of 250 μL of plasma was placed in a 1.5 mL Eppendorf tube. Then, 50 μL of water was added. The sample was vortexed for 30 s. Afterwards, 300 μL of the surfactant solution, Triton X-114 (5% or 20% to obtain the final concentration of 1.5 or 6%); 400 μL of 100% acetic acid, water, or 25% ammonia solution; and 0, 100, 200, or 300 mg AA (to obtain concentration of 0, 10, 20 or 30% (w/v)) were added. The sample was vortexed at low speed for 5 min and incubated in a water bath for 20 min at 60 °C. After that, the phase separation was accelerated by centrifugation (10,000 g, 5 min, 25 °C). The surfactant-lean aqueous phase was decanted to obtain the surfactant-rich phase, which was diluted with an aliquot of 500 μL of ethanol and incubated for 5 min at –80 °C. Then, the sample was centrifuged (10,000 g, 5 min, 25 °C); 200 μL of supernatant was diluted with 650 µL water and mixed together with 50 µL 500 ng/mL aqueous solution mix of the antidepressants standard without internal standards.
Sample B: 200 μL of 75%-ethanol, 650 μL water, and 50 μL 500 ng/mL aqueous solution of standard-mix were added.
Sample C: Like sample A with modifications: (1) instead of 50 μL water, 50 μL of a 500 ng/mL aqueous solution of antidepressant standard-mix was added to 250 μL plasma; (2) finally, to the vial, 700 μL of water was added instead of 650 μL water and 50 μL of antidepressants standard-mix solution.

3.5.2. CPE Procedure—Validation

An aliquot of 250 μL of human plasma fortified with a solution of mixed standards of 21 antidepressants in appropriate concentrations from QC samples and calibration samples was placed in a 1.5 mL Eppendorf tube. Then, 50 μL of 500 ng/mL aqueous internal standard solution was added. The sample was vortexed for 30 s. Afterward, 300 μL of the surfactant 20% Triton X-114, 400 μL of the 25% ammonia solution, and 100 mg AA (to final concentration of 10% (w/v)) were added. The sample was vortexed at low speed for 5 min and incubated in a water bath for 20 min at 60 °C. The phases were centrifuged and separated (10,000 g, 5 min, 25 °C); the surfactant-lean phase was decanted. The surfactant-rich phase was mixed with a 500 μL aliquot of ethanol and incubated for 5 min at −80 °C. Then, the sample was centrifuged (10,000 g, 5 min, 25 °C). An aliquot of 200 μL of supernatant was diluted with 700 µL of water and analyzed.

3.5.3. Preparation of Calibration Standards and Quality Samples for Validation Optimal CPE Conditions

The calibration standards contained all analytes at eight concentrations ranging from 10 to 750 ng/mL. The quality control samples were prepared at concentrations of 16, 375, and 625 ng/mL. All calibration standards and the quality control samples were prepared via the appropriate dilutions of blank human plasma spiked with all analytes in working solutions and were stored at ≤−39 °C. The precision was calculated as the ratio of standard deviation/mean (%). The accuracy was calculated as the determined value divided by the nominal value and expressed in percent.
Samples A and B for the matrix effect and samples A and C for the recovery test were prepared at two concentrations for all analyte standards and for IS at the working concentration in blank human plasma samples derived from six sources.

3.6. Matrix Effect and Recovery Calculation

ME calculated as MEA [33], also called matrix factor (MF) (Equation (1)) [43], was regarded as insignificant if included between 85 and 115%. In development, the samples for matrix effect were prepared from blank human plasma from one source at a level corresponding to a plasma concentration of 100 ng/mL, so the matrix factors were calculated as MEA. The preparation of samples A, B, and C was described in Section 3.5.1. In validation, the MF were calculated as the ratios of the instrument response for substances in sample A and sample B at two concentrations (16 and 625 ng/mL) for all analyte standards and for IS in the working concentration in 6 different sources, including haemolyzed and hyperlipidaemic plasma. The CV of the IS-normalized matrix factor (Equation (2)) should not exceed 15%.
Recovery was calculated by dividing the analytical signal pre-extraction spiked sample plasma (sample C) by post-extraction spiked sample plasma (sample A) (Equation (3)). Sample C concentrations were calculated on account of the volume of the rich-micellar phase.
ME A = MF = peak   area   of   the   analyte   in   a   matrix   ( sample   A )   peak   area   of   the   analyte   in   a   solvent   ( sample   B ) ×   100 %
IS - normalised   MF = MFanalyte MF IS
During development, recovery was calculated according to Equation (3).
Recovery = peak   area   of   the   analyte   in   variant   sample   C peak   area   of   the   analyte   invariant   sample   A × 100 %

3.7. Statistical Analysis

The statistical analysis of the results was performed with the STATISTICA version 12 for Windows (TIBCO Software Inc., Palo Alto, CA, USA). The normal distribution of the results was evaluated by the Shapiro–Wilk test. For the normal distribution, the t-Student test and ANOVA were used.
The one-way ANOVA followed by the LSD post hoc test for multiple comparisons of the dependent group was applied. Differences between two nominal variables were tested using the chi-square test (χ2). A p-value below 0.05 was considered significant.
PCA was used to find molecular descriptors that divided the studied group into prone and not prone to the ME.

4. Conclusions

The use of a volatile salt (1.3 M–10% (w/v) of AA) is a promising modification of the CPE procedure for LC–MS applications, since the mean recovery of studied antidepressants increased almost two-fold. The procedure can be applied to other groups of analytes to develop reliable and environmentally friendly screening methods. In the future, other volatile salts such as ammonium formate can be used for comparisons. Non-volatile salts can be applied in CPE-LC/MS when the discharge of the initial part of the chromatographic course is possible. The modified CPE method is an alternative for LLE and SPE for sample preparation prior to LC–MS, giving comparable recovery and matrix effect. Using ethanol instead of methanol or acetonitrile in CPE to reduce the sample viscosity at the last point of sample preparation makes the method more friendly to the environment. The selected conditions of CPE extraction of antidepressants were as follows: 6% (w/v) Triton X-114, 10% (w/v) AA, and pH 10.2. The developed CPE–LC–MS method was proven to be precise, accurate, and reliable, and can be applied for the simultaneous determination of various antidepressants in human plasma in clinical and forensic toxicology.
Limitation of the study: The method was not applied to clinical samples. Not all parameters that can influence the method performance were tested, e.g., extraction temperature, equilibration time, types of volatile salts, and anticoagulants used in blood sample collection.

Author Contributions

Conceptualization, J.G; methodology, J.G.; software, G.K. and N.K.; validation, J.G., N.K., and G.K.; formal analysis, G.K.; investigation, J.G., N.K., G.K., and E.G.; resources, J.G.; data curation, J.G, E.G., and N.K.; writing—original draft preparation, E.G.; writing—review, and editing. N.K., J.G; visualization, E.G.; supervision, J.G.; project administration, J.G.; funding acquisition, J.G. and E.G. All authors have read and agreed to the published version of the manuscript.

Funding

This research was funded by the Ministry of Science and Higher Education contract number: DWD/3/6/2019 dated 21.11.2019. The APC was funded by the Medical University of Warsaw.

Acknowledgments

The authors are grateful to Ryszard Marszałek for technical assistance in LC–MS/MS analyses.

Conflicts of Interest

The authors declare no conflict of interest.

Appendix A

Figure A1. Multiple reaction monitoring (MRM) chromatogram peaks of the analyzed antidepressants extracted from (a) blank plasma; (b) quality control at a concentration of 625 ng/mL using cloud-point extraction. The MS parameters of MRM mode are presented in Table 3.
Pharmaceuticals 13 00458 g0a1
Figure A2. Recovery in the selected CPE method conditions (pH 10.2, 6% Triton X-114, 10% (w/v) ammonium acetate) determined for 6 different sources of plasma.
Pharmaceuticals 13 00458 g0a2
Figure A3. Variants of samples tested during CPE development.
Pharmaceuticals 13 00458 g0a3
Table A1. Comparison of MRM transitions of the analyzed antidepressants with those of their metabolites determined in other papers using LC–MS/MS.
Drug NameParent ion [m/z] [M+H+]Daughter ion [m/z]MetaboliteParent ion [m/z] [M+H+]Daughter ion [m/z]SourceBiofluid
Amitriptyline278233Nortriptyline26490[25]human plasma
Citalopram325109Desmethylcitalopram311109[45,46]human plasma whole blood
262
Citalopram N-oxide341262human plasma whole blood
109
Clomipramine31586Norclomipramine30172[47]human plasma
Demetylclomipramine302243
271
[48]whole blood
Hydroxydesipramine282252
Doxepin280107Nordoxepin266107[49]human plasma
Fluoxetine31044Norfluoxetine296134[47]human plasma
Imipramine28186Desipramine26772This studyhuman plasma
Maprotiline278250N-desmethylmaprotiline264117[46]human whole blood
169
Mirtazapine266195Desmethyl mirtazapine252195[50]human bile
8-Hydroxydesmethylmirtazapine282211
Nortriptyline26423310-
hydroxynortriptyline
280.1262.2[51]human plasma
Paroxetine3301924-hydroxy-3-methoxy332192[52]human plasma
Sertraline306158N-Desmethyl sertraline292.32275.1[46]human whole blood
Tianeptine437292MC5409292[53]rat plasma
228
Trazodone372176m-Chlorophenylpiperazine197118[49]human plasma
Trimipramine295100Desmethyltrimipramine28186[54]human hair
2-Hydroxytrimipramine311100
2-Hydroxydesmethyltrimipramine29786
Venlafaxine27858O-Desmethyl venlafaxine26458[46]whole blood
246
There is no reported MRM methods for metabolites of other analyzed antidepressants.
Table A2. The parameters of the calibration curve for all 21 analytes (n = 6).
CompoundR2Linear Equation
y = ax + b
Standard Deviation aStandard Deviation b
Amitriptyline0.998y = 0.001731x + 0.01000.0000620.0016
Citalopram0.993y = 0.001895x + 0.00160.0000520.0011
Clomipramine0.997y= 0.000728x + 0.0027470.0000170.000940
Desipramine0.996y = 0.002608 ± 0.00080.0000510.0015
Doxepin0.994y= 0.001895x + 0.01190.0000640.0075
Fluoxetine0.997y = 0.002061x+ 0.00300.0000750.0030
Fluvoxamine0.994y = 0.000679x + 0.00790.0000300.0032
Imipramine0.997y = 0.00395x + 0.00540.000120.0057
Maprotiline0.995y = 0.002716x + 0.01590.0000500.0031
Mianserin0.996y = 0.0002657x + (-0.000142)0.00000770.000265
Mirtazapine0.997y = 0.003092x + (-0.0013)0.0000810.0050
Moclobemide0.990y = 0.0026x + (-0.0014)0.00110.0019
Nortriptyline0.996y = 0.001011x + 0.0000200.0000270.000936
Opipramol0.997y = 0.0260x + (-0.010)0.00440.017
Paroxetine0.996y = 0.0001912x + 0.00500.00000630.0027
Protriptyline0.997y = 0.002013x + 0.00500.0000480.0040
Sertraline0.998y = 0.000591x + 0.00350.0000120.0015
Tianeptine0.995y = 0.002512x + 0.00260.0000840.0032
Trazodone0.996y = 0.002249x + (-0.0026)0.0000950.0025
Trimipramine0.998y = 0.00573x + 0.00330.000230.0046
Venlafaxine0.999y = 0.002268x + 0.00140.0000860.0032
The uncertainty (standard deviation) was rounded up to two significant figures. The mean was rounded to have the same number of decimal places as the uncertainty.
Table A3. Sample stability—autosampler, short-term, and freeze and thaw stability; mean accuracy [%] (n = 5) for low and high QC.
Test NameAutosampler StabilityShort-Term StabilityFreeze and Thaw Stability
(48h at 4°C)(3h at Room Temperature)(−20°C)
Drug Name16CV
(%)
625
ng/mL
CV
(%)
16CV
(%)
625
ng/mL
CV
(%)
16CV
(%)
625
ng/mL
CV
(%)
ng/mLng/mLng/mL
Amitriptyline112.21398.11096991.94103.2888.413
Citalopram92.91491.71296.96102.6489.5296.38
Clomipramine102.8196.34101.2498.35102997.24
Desipramine108.7699.11392.7693.13101.5592.35
Doxepin110.3990.61194.1391.1291.3786.512
Fluoxetine104.91498.8997.7594.21110790.98
Fluvoxamine106.79102.5598.311100791.51398.95
Imipramine110.61298.4897.11392.4395.9391.96
Maprotiline1049106.26113.3298.47110.5396.47
Mianserin106.91391.1695.2399.4491.5291.36
Mirtazapine107.21092.4992.71194.6699.71388.312
Moclobemide108990.81099.3898.1799.6991.14
Nortriptyline112.66105.59110.510100.35113.3697.68
Opipramol101.51491.710102.2391.5499.5589.18
Paroxetine109.3694.26108.58101.69107.1991.313
Protriptyline111.44101.19102.1591.94103.23887
Sertraline99.61199.41296.96100.36109.2999.23
Tianeptine961090.41293.57102.76936100.89
Trazodone97.2596.61299.77104.7592.18100.38
Trimipramine1101295.9689.64102.62101.71190.34
Venlafaxine101.28100.4795.87104.7997.91299.88
Table A4. Matrix effect values of tested compounds for low and high QC.
QC SamplesLow QC (16 ng/mL)High QC (625 ng/mL)
Drug NameMF AnalyteIS-Normalized MFCV IS-Norm. MF [%]MF AnalyteIs-Normalized MFCV IS-Norm. MF [%]
Amitriptyline98.792.510.094.894.66.1
Citalopram58.2123.314.654.2129.812.1
Clomipramine108.3106.29.395.199.12.7
Desipramine95.690.214.695.495.58.9
Doxepin79.273.313.773.973.76.5
Fluoxetine106.399.19.396.696.510.0
Fluvoxamine108.8101.47.9107.8107.87.7
Imipramine100.193.06.794.093.84.4
Maprotiline102.195.79.497.797.52.6
Mianserin64.863.115.058.761.08.9
Mirtazapine72.668.114.870.470.43.3
Moclobemide88.987.16.889.093.25.3
Nortriptyline94.292.25.792.696.83.6
Opipramol107.9101.410.9102.4102.47.7
Paroxetine115.6111.86.7107.1107.17.6
Protriptyline104.397.89.297.797.65.1
Sertraline109.1106.97.294.498.52.8
Tianeptine73.8142.16.364.3153.913.9
Trazodone53.2108.012.448.0108.111.9
Trimipramine101.795.07.788.788.56.8
Venlafaxine47.596.515.044.5105.511.6

References

  1. Giebułtowicz, J.; Kojro, G.; Piotrowski, R.; Kułakowski, P.; Wroczyński, P. Cloud-point extraction is compatible with liquid chromatography coupled to electrospray ionization mass spectrometry for the determination of antazoline in human plasma. J. Pharm. Biomed. 2016, 128. [Google Scholar] [CrossRef]
  2. Madej, K.; Persona, K. Drug screening in human plasma by cloud-point extraction and HPLC. J. Open Chem. 2013, 11, 94. [Google Scholar] [CrossRef]
  3. Wentao, L.; Bi, K.; Liu, X.; Zhao, J.; Chen, X. Cloud-Point Extraction Combined with LC–MS for Analysis of Memantine in Rat Plasma. Chromatographia 2009, 69, 837–842. [Google Scholar] [CrossRef]
  4. Giebułtowicz, J.; Kojro, G.; Buś - Kwaśnik, K.; Rudzki, P.; Marszałek, R.; Leś, A.; Wroczyński, P. Cloud-point extraction is compatible with liquid chromatography coupled to electrospray ionization mass spectrometry for the determination of bisoprolol in human plasma. J. Chromatogr. A 2015, 1423. [Google Scholar] [CrossRef] [PubMed]
  5. Hunzicker, G.A.; Hein, G.J.; Hernández, S.R.; Altamirano, J.C. Cloud point extraction for analysis of antiretrovirals in human plasma by UFLC-ESI-MS/MS. Anal. Chem. Res. 2015, 6, 1–8. [Google Scholar] [CrossRef] [Green Version]
  6. Rukhadze, M.D.; Tsagareli, S.K.; Sidamonidze, N.S.; Meyer, V.R. Cloud-point extraction for the determination of the free fraction of antiepileptic drugs in blood plasma and saliva. Anal. Biochem. 2000, 287, 279–283. [Google Scholar] [CrossRef]
  7. Tabrizi, A.B.; Naini, S.; Parnian, K.; Mohammadi, S.; Emami zad, F.; Anvarian, S.P.; Abdollahi, A. Determination of triamterene in human plasma and urine after its cloud point extraction. Quím. Nova 2014, 37, 1182–1187. [Google Scholar] [CrossRef]
  8. Qin, X.Y.; Meng, J.; Li, X.Y.; Zhou, J.; Sun, X.L.; Wen, A.D. Determination of venlafaxine in human plasma by high-performance liquid chromatography using cloud-point extraction and spectrofluorimetric detection. J. Chromatogr. B. 2008, 872, 38–42. [Google Scholar] [CrossRef]
  9. Zhao, Q.; Ding, J.; Jin, H.; Ding, L.; Ren, N.-Q. A Green Method Using a Micellar System for Determination of Andrographolide and Dehydroandrographolide in Human Plasma. J. Chromatogr. Sci. 2012, 51. [Google Scholar] [CrossRef] [Green Version]
  10. Filik, H.; Şener, İ.; Cekiç, S.; Kilic, E.; Apak, R. Spectrophotometric determination of paracetamol in urine with tetrahydroxycalix[4]arene as a coupling reagent and preconcentration with Triton X-114 using cloud point extraction. Chem. Pharm. Bull. 2006, 54, 891–896. [Google Scholar] [CrossRef] [Green Version]
  11. Wang, C.C.; Luconi, M.O.; Masi, A.N.; Fernández, L. Determination of terazosin by cloud point extraction-fluorimetric combined methodology. Talanta 2007, 72, 1779–1785. [Google Scholar] [CrossRef] [PubMed]
  12. Zhao, J.; Wang, J.; Yang, Y.; Lu, Y. The Determination of Nitrate and Nitrite in Human Urine and Blood by High-Performance Liquid Chromatography and Cloud-Point Extraction. J. Chromatogr. Sci. 2015, 53, 1169–1177. [Google Scholar] [CrossRef] [PubMed] [Green Version]
  13. World Health Organization. Depression. Available online: https://www.who.int/news-room/fact-sheets/detail/depression (accessed on 8 August 2020).
  14. Methling, M.; Krumbiegel, F.; Hartwig, S.; Parr, M.K.; Tsokos, M. Toxicological findings in suicides — frequency of antidepressant and antipsychotic substances. Forensic Sci. Med. Pathol. 2019, 15, 23–30. [Google Scholar] [CrossRef] [PubMed]
  15. Pompili, M.; Serafini, G.; Innamorati, M.; Ambrosi, E.; Giordano, G.; Girardi, P.; Tatarelli, R.; Lester, D. Antidepressants and Suicide Risk: A Comprehensive Overview. Pharmaceuticals 2010, 3, 2861–2883. [Google Scholar] [CrossRef] [PubMed]
  16. Hawton, K.; Bergen, H.; Simkin, S.; Cooper, J.; Waters, K.; Gunnell, D.; Kapur, N. Toxicity of antidepressants: Rates of suicide relative to prescribing and non-fatal overdose. Br. J. Psychiatry 2010, 196, 354–358. [Google Scholar] [CrossRef] [PubMed]
  17. Jia, E.; Bartlett, M. Recent Advances in Liquid Chromatographic Methods for the Determination of Selective Serotonin Reuptake Inhibitors (SSRI) and Serotonin Norepinephrine Reuptake Inhibitors (SNRI). Biomed. Chromatogr. 2019, 34. [Google Scholar] [CrossRef]
  18. Vaghar-Lahijani, G.; Aberoomand-Azar, P.; Saber-Tehrani, M.; Soleimani, M. Application of ionic liquid-based ultrasonic-assisted microextraction coupled with HPLC for determination of citalopram and nortriptyline in human plasma. J. Liq. Chromatogr. Relat. 2017, 40, 1–7. [Google Scholar] [CrossRef]
  19. Duverneuil, C.; de la Grandmaison, G.L.; de Mazancourt, P.; Alvarez, J.-C. A high-performance liquid chromatography method with photodiode-array UV detection for therapeutic drug monitoring of the nontricyclic antidepressant drugs. Ther. Drug Monit. 2003, 25, 565–573. [Google Scholar] [CrossRef]
  20. Del Mar Ramírez Fernández, M.; Wille Sm Fau-Samyn, N.; Samyn, N. Quantitative method validation for the analysis of 27 antidepressants and metabolites in plasma with ultraperformance liquid chromatography-tandem mass spectrometry. Ther. Drug Monit. 2012, 34, 11–24. [Google Scholar] [CrossRef]
  21. De Castro, A.; Fernandez, M.d.M.R.; Laloup, M.; Samyn, N.; De Boeck, G.; Wood, M.; Maes, V.; López-Rivadulla, M. High-throughput on-line solid-phase extraction–liquid chromatography–tandem mass spectrometry method for the simultaneous analysis of 14 antidepressants and their metabolites in plasma. J. Chromatogr. A 2007, 1160, 3–12. [Google Scholar] [CrossRef]
  22. Ansermot, N.; Brawand-Amey, M.; Eap, C.B. Simultaneous quantification of selective serotonin reuptake inhibitors and metabolites in human plasma by liquid chromatography—Electrospray mass spectrometry for therapeutic drug monitoring. J. Chromatogr. B 2012, 885–886, 117–130. [Google Scholar] [CrossRef] [PubMed]
  23. Petrides, A.K.; Moskowitz, J.; Johnson-Davis, K.L.; Jannetto, P.J.; Langman, L.J.; Clarke, W.; Marzinke, M.A. The development and validation of a turbulent flow-liquid chromatography-tandem mass spectrometric method for the simultaneous quantification of citalopram, sertraline, bupropion and hydroxybupropion in serum. Clin. Biochem. 2014, 47, 73–79. [Google Scholar] [CrossRef] [PubMed]
  24. Santos, M.G.; Tavares, I.M.; Barbosa, A.F.; Bettini, J.; Figueiredo, E.C. Analysis of tricyclic antidepressants in human plasma using online-restricted access molecularly imprinted solid phase extraction followed by direct mass spectrometry identification/quantification. Talanta 2017, 163, 8–16. [Google Scholar] [CrossRef] [PubMed]
  25. Berm, E.J.J.; Paardekooper, J.; Brummel-Mulder, E.; Hak, E.; Wilffert, B.; Maring, J.G. A simple dried blood spot method for therapeutic drug monitoring of the tricyclic antidepressants amitriptyline, nortriptyline, imipramine, clomipramine, and their active metabolites using LC-MS/MS. Talanta 2015, 134, 165–172. [Google Scholar] [CrossRef] [PubMed]
  26. Nielsen, M.K.; Johansen, S.S. Simultaneous determination of 25 common pharmaceuticals in whole blood using ultra-performance liquid chromatography-tandem mass spectrometry. J. Anal. Toxicol. 2012, 36, 497–506. [Google Scholar] [CrossRef] [PubMed] [Green Version]
  27. Santos-Neto, A.J.; Bergquist, J.; Lanças, F.M.; Sjöberg, P.J.R. Simultaneous analysis of five antidepressant drugs using direct injection of biofluids in a capillary restricted-access media-liquid chromatography-tandem mass spectrometry system. J. Chromatogr. A 2008, 1189, 514–522. [Google Scholar] [CrossRef] [PubMed]
  28. De Souza, I.D.; Domingues, D.S.; Queiroz, M.E.C. Hybrid silica monolith for microextraction by packed sorbent to determine drugs from plasma samples by liquid chromatography–tandem mass spectrometry. Talanta 2015, 140, 166–175. [Google Scholar] [CrossRef]
  29. Remane, D.; Meyer, M.R.; Wissenbach, D.K.; Maurer, H.H. Full validation and application of an ultra high performance liquid chromatographic-tandem mass spectrometric procedure for target screening and quantification of 34 antidepressants in human blood plasma as part of a comprehensive multi-analyte approach. Anal. Bioanal. Chem. 2011, 400, 2093. [Google Scholar] [CrossRef]
  30. Roemmelt, A.T.; Steuer, A.E.; Kraemer, T. Liquid Chromatography, In Combination with a Quadrupole Time-of-Flight Instrument, with Sequential Window Acquisition of All Theoretical Fragment-Ion Spectra Acquisition: Validated Quantification of 39 Antidepressants in Whole Blood As Part of a Simultaneous Screening and Quantification Procedure. Anal. Chem. 2015, 87, 9294–9301. [Google Scholar] [CrossRef]
  31. Kojro, G.; Rudzki, P.J.; Pisklak, D.M.; Giebułtowicz, J. Matrix effect screening for cloud-point extraction combined with liquid chromatography coupled to mass spectrometry: Bioanalysis of pharmaceuticals. J. Chromatogr. A 2019, 1591, 44–54. [Google Scholar] [CrossRef]
  32. Kojro, G.; Wroczyński, P. Cloud Point Extraction in the Determination of Drugs in Biological Matrices. J. Chromatogr. Sci. 2020, 58, 151–162. [Google Scholar] [CrossRef] [PubMed]
  33. Matuszewski, B.K.; Constanzer, M.L.; Chavez-Eng, C.M. Strategies for the Assessment of Matrix Effect in Quantitative Bioanalytical Methods Based on HPLC−MS/MS. Anal. Chem. 2003, 75, 3019–3030. [Google Scholar] [CrossRef] [PubMed]
  34. More, P.R.; Arya, S.S. A novel, green cloud point extraction and separation of phenols and flavonoids from pomegranate peel: An optimization study using RCCD. J. Environ. Chem. Eng. 2019, 7, 103306. [Google Scholar] [CrossRef]
  35. Koshy, L.; Saiyad, A.H.; Rakshit, A.K. The effects of various foreign substances on the cloud point of Triton X 100 and Triton X 114. Colloid Polym. Sci. 1996, 274, 582–587. [Google Scholar] [CrossRef]
  36. Quina, F.H.; Hinze, W.L. Surfactant-Mediated Cloud Point Extractions:  An Environmentally Benign Alternative Separation Approach. Ind. Eng. Chem. Res 1999, 38, 4150–4168. [Google Scholar] [CrossRef]
  37. Madej, K. Microwave-assisted and cloud-point extraction in determination of drugs and other bioactive compounds. Trends Anal. Chem. 2009, 28, 436–446. [Google Scholar] [CrossRef]
  38. Sayem Alam, M.; Mandal, A.B. The clouding phenomena of mixed surfactant (non-ionic Triton X-114+cationic gemini 16-5-16) solutions: Influence of inorganic and organic additives on the cloud point. J. Mol. Liq. 2015, 212, 237–244. [Google Scholar] [CrossRef]
  39. Pourreza, N.; Elhami, S. Spectrophtometric determination of malachite green in fish farming water samples after cloud point extraction using nonionic surfactant Triton X-100. Anal. Chim. Acta 2007, 596, 62–65. [Google Scholar] [CrossRef]
  40. Kori, S. Cloud point extraction coupled with back extraction: A green methodology in analytical chemistry. Forensic Sci. Res. 2019, 1–15. [Google Scholar] [CrossRef] [Green Version]
  41. Zhang, H.; Choi, H.-K. Analysis of meloxicam by high-performance liquid chromatography with cloud-point extraction. Anal. Bioanal. Chem. 2008, 392, 947–953. [Google Scholar] [CrossRef]
  42. Han, F.; Yin, R.; Shi, X.-l.; Jia, Q.; Liu, H.-z.; Yao, H.-m.; Xu, L.; Li, S.-m. Cloud point extraction-HPLC method for determination and pharmacokinetic study of flurbiprofen in rat plasma after oral and transdermal administration. J. Chromatogr. B 2008, 868, 64–69. [Google Scholar] [CrossRef] [PubMed]
  43. Guideline on bioanalytical method validation. Committee for Medicinal Products for Human Use (CHMP), EMEA/CHMP/EWP/192217/2009, EuropeanMedicines Agency. 2011. Available online: https://www.ema.europa.eu/en/documents/scientific-guideline/guideline-bioanalytical-method-validation_en.pdf (accessed on 5 October 2020).
  44. Guidance for Industry: Bioanalytical Method Validation. Food and Drug Administration. Center for Drug Evaluation and Research and Center for Veterinary Medicine. 2001. Available online: http://academy.gmp-compliance.org/guidemgr/files/4252FNL.PDF (accessed on 5 October 2020).
  45. Jiang, T.; Rong, Z.; Peng, L.; Chen, B.; Xie, Y.; Chen, C.; Sun, J.; Xu, Y.; Lu, Y.; Chen, H. Simultaneous determination of citalopram and its metabolite in human plasma by LC–MS/MS applied to pharmacokinetic study. J. Chromatogr. B 2010, 878, 615–619. [Google Scholar] [CrossRef] [PubMed]
  46. Zhu, R.; Dong, X.; Zhang, D.; Liu, X.; Ye, Y.; Jiang, Y. Simultaneous Quantification of 38 Psychotropic Drugs and Relevant Metabolites in Blood using LC–MS-MS. J. Anal. Toxicol. 2020. [Google Scholar] [CrossRef] [PubMed]
  47. De Castro, A.; Concheiro, M.; Quintela, O.; Cruz, A.; López-Rivadulla, M. LC–MS/MS method for the determination of nine antidepressants and some of their main metabolites in oral fluid and plasma: Study of correlation between venlafaxine concentrations in both matrices. J. Pharm. Biomed. 2008, 48, 183–193. [Google Scholar] [CrossRef]
  48. Titier, K.; Castaing, N.; Le-Déodic, M.; Le-bars, D.; Moore, N.; Molimard, M. Quantification of Tricyclic Antidepressants and Monoamine Oxidase Inhibitors by High-Performance Liquid Chromatography-Tandem Mass Spectrometry in Whole Blood. J. Anal. Toxicol. 2007, 31, 200–207. [Google Scholar] [CrossRef] [Green Version]
  49. Patel, B.N.; Sharma, N.; Sanyal, M.; Shrivastav, P.S. High throughput and sensitive determination of trazodone and its primary metabolite, m-chlorophenylpiperazine, in human plasma by liquid chromatography–tandem mass spectrometry. J. Chromatogr. B 2008, 871, 44–54. [Google Scholar] [CrossRef]
  50. Wenzel, S.; Aderjan, R.; Mattern, R.; Pedal, I.; Skopp, G. Tissue distribution of mirtazapine and desmethylmirtazapine in a case of mirtazapine poisoning. Forensic Sci. Int. 2006, 156, 229–236. [Google Scholar] [CrossRef]
  51. Hotha, K.K.; Ravindranath, L.K.; Veera, K.N.J.; Kumar, K.K.; Reddy, Y.R.; Jagadeesh, B.; Rao, D.V.N.; Bharathi, D.V.; Mullangi, R. Development and validation of a highly sensitive LC-MS/MS method for simultaneous quantitation of nortriptyline and 10-hydroxynortriptyline in human plasma: Application to a human pharmacokinetic study. Biomed. Chromatogr. 2010, 24, 1113–1119. [Google Scholar] [CrossRef]
  52. Segura, M.; Ortuño, J.; Farré, M.; Pacifici, R.; Pichini, S.; Joglar, J.; Segura, J.; Torre, R.d.l. Quantitative determination of paroxetine and its 4-hydroxy-3-methoxy metabolite in plasma by high-performance liquid chromatography/electrospray ion trap mass spectrometry: Application to pharmacokinetic studies. Rapid Commun. Mass Spectrom. 2003, 17, 1455–1461. [Google Scholar] [CrossRef] [Green Version]
  53. Szafarz, M.; Wencel, A.; Pociecha, K.; Fedak, F.A.; Wlaź, P.; Wyska, E. Pharmacokinetic study of tianeptine and its active metabolite MC5 in rats following different routes of administration using a novel liquid chromatography tandem mass spectrometry analytical method. Naunyn-Schmiedeberg’s Arch. Pharmacol. 2018, 391, 185–196. [Google Scholar] [CrossRef] [Green Version]
  54. Doherty, B.; Rodriguez, V.; Leslie, J.C.; McClean, S.; Smyth, W.F. An electrospray ionisation tandem mass spectrometric investigation of selected psychoactive pharmaceuticals and its application in drug and metabolite profiling by liquid chromatography/electrospray ionisation tandem mass spectrometry. Rapid Commun. Mass Spectrom. 2007, 21, 2031–2038. [Google Scholar] [CrossRef] [PubMed]
Figure 1. Chemical structures of antidepressants studied in the experiment.
Pharmaceuticals 13 00458 g001
Figure 2. Effects of Triton X-114 concentration on (a) recovery (p < 0.001), (b) absolute matrix effect (MEA) (p = 0.182). Extraction conditions: equilibrium temperature—60°C; equilibrium time—20 min; sample pH 6.8; ammonium acetate content—20% (w/v). Antidepressants level corresponds to a plasma concentration of 100 ng/mL Higher mean recovery was observed with higher Triton X-114 concentration (the experiment was repeated three times) (p < 0.001). Results are presented as means and standard deviations.
Pharmaceuticals 13 00458 g002
Figure 3. The effect of ammonium acetate concentration (0, 10, 20, and 30% (w/v)) on recovery (p < 0.001). Extraction conditions: equilibrium temperature—60 °C; equilibrium time—20 min; sample pH, 6.8; concentration of Triton X-114–6% (w/v). Antidepressants level corresponds to a plasma concentration of 100 ng/mL. Results are presented as means and standard deviations. Mean recoveries for 0% AA (dashed line), 10% AA (dotted line), 20% AA (dotted-dashed line), and 30% AA (bold dashed) are shown.The highest increases of recovery, as a result of AA addition, were observed for AMI, PAR, PRO, TIA, and TRA, whereas the weakest effect was recorded for both FLV and MIA. No increase in recovery for VEN or decrease for OPI was observed. The increase of recovery (10% vs. 0 % (w/v)) was correlated (rs = 0.465, p = 0.034) with the calculated octanol–water partition coefficient (cLogP).
Pharmaceuticals 13 00458 g003
Figure 4. Effect of the addition of ammonium acetate on the absolute matrix effect (MEA) (p = 0.198). Extraction conditions: equilibrium temperature—60°C; equilibrium time—20 min; sample pH—6.8; concentration of Triton X-114—6% (w/v). Antidepressants level corresponds to a plasma concentration of 100 ng/mL. Results are presented as means and standard deviations. MEA between 85% (dotted line) and 115% (dotted line) was considered insignificant.
Pharmaceuticals 13 00458 g004
Figure 5. The effects of different pH of a sample on (a) recovery (p < 0.001), (b) absolute matrix effect (MEA) (p = 0.514). Results are presented as means and standard deviations. MEA between 85% (dashed line) and 115% (dashed line) was considered as insignificant. Extraction conditions: Triton X-114 at 6% (w/v); ammonium acetate at 10% (w/v); equilibrium temperature—60°C; equilibrium time—20 min. Antidepressants level corresponds to plasma concentration of 100 ng/mL.
Pharmaceuticals 13 00458 g005
Figure 6. The effects of cloud-point extraction conditions on (a) the recoveries and (b) the absolute matrix effects of 21 antidepressants determined using liquid chromatography coupled with mass spectrometry. T—Triton concentration (w/v), AA—ammonium acetate concentration (w/v).
Pharmaceuticals 13 00458 g006
Figure 7. Distribution of the analyzed compounds on a score plot (principal component 2 vs. component 1) in a principal component analysis (PCA). The results are presented for the optimal CPE variant (pH 10.2; 6% Triton X-114, 10% (w/v) ammonium acetate; equilibrium temperature 60°C; equilibrium time 20 min). HBA—number of hydrogen bond acceptors, HBD—number of hydrogen bond donors, PSA—polar surface area. Compounds labelled with green text exhibited insignificant MEA, whereas compounds labeled with red—significant MEA.
Pharmaceuticals 13 00458 g007
Table 1. Precision and accuracy intra-run (n = 5) and between-run (n = 15) in human plasma for lower limit of quantification (LLOQ), low QC, medium QC, and high QC.
LLOQ
10 ng/mL
Low
16 ng/mL
Medium QC
375 ng/mL
High QC
625 ng/mL
PrecisionAccuracy PrecisionAccuracy PrecisionAccuracy PrecisionAccuracy
Compound [%][%][%][%][%][%][%][%]
Amitriptylineintra-run1.5925.51075.9865.498
between-run8.21046.41032.3881.599
Citalopramintra- run6.1934.8907.7896.1109
between-run2.6933.4905.3861099
Clomipramineintra- run6.7883.798101049.1105
between-run91005.4983.31013108
Desipramineintra- run5.11065.610111925.695
between-run141026.9993894.199
Doxepinintra-run3.41046.8997.61108.4113
between-run6.21103962.51035109
Fluoxetineintra-run6.71085.41098.1910.897
between-run0.81090.61080.3910.498
Fluvoxamineintra-run5.91089.61027.81085.6109
between-run11854.3951.31009112
Imipramineintra-run4.3943.3997.7856.7104
between-run9.38913924.3890.3112
Maprotilineintra-run2.7966.18912927.1104
between-run7.9975.2881.2930.7105
Mianserinintra-run3.81133.91018.81141193
between-run2.91123.596149711105
Mirtazapineintra-run6.2971310111955100
between-run121026.21042.8937.2107
Moclobemideintra-run2.41024.38511901198
between-run111107.9894.4861.696
Nortriptylineintra-run8.7936.91028.11024.1110
between-run9.69514996.71090.2110
Opipramolintra-run5.6935.2903.2929.2105
between-run101013.6873.5894.7110
Paroxetineintra-run7.51057.4101121001191
between-run4.51062.91020.8996.797
Protriptylineintra-run3.7944.89711907.394
between-run9.51048.5952.1886.8100
Sertralineintra-run4.410921043.21075.3105
between-run6.11092.510171001.5107
Tianeptineintra-run21033.29311939111
between-run3.21062.9971.8955.8105
Trazodoneintra-run2.41114.1886.1895.6105
between-run91033.3921.6912.7102
Trimipramineintra-run6.1853.7986885.3100
between-run111003.71010.2871.9102
Venlafaxineintra-run5.31062.41009.7923.3103
between-run3.410231046874.898
Table 2. Comparison of the reported recoveries of antidepressants using various methods. The arrows indicate the differences in recoveries in comparison to this study.
StudyThis studydel Fernández et al. 2012 [20]Madej and Persona 2013 [2]Qin et al. 2008 [8]Ansermot et al. 2012 [22]de Castro et al. 2007 [21]
ExtractionCPELLE CPECPESPEon-Line SPE
Analytical MethodLC/MSLC/MSLC/DADLC/FLLC/MSLC/MS
QC Low High
Amitryptyline85.470 6770- - 99.9
Citalopram85.885 81- - 8399.9
Clomipramine90.164 66- - - 99.7
Desipramine87.772 74- - - 99.8
Doxepine89.470 60- - -
Fluoxetine94.074 72- - 8299.9
Fluvoxamine94.170 71- - - 99.7
Imipramine95.476 78- - - 99.9
Maprotyline85.077 74- - -
Mianserine87.086 83- - -
Mirtazapine78.983 84- - -
Moclobemide65.471 73- - -
Nortryptyline81.371 73- - 8599.6
Opipramol102.5- - 25- -
Paroxetine82.869 73- - 7499.8
Protryptiline83.3- - - - -
Sertraline87.563 70- - 8099.9
Tianeptine69.4- - - - -
Trazodone82.087 88- - - 99.9
Trimipramine102.3- - - - -
Venlafaxine80.083 81- 89- 99.8
Mean86.275 75 48 89 81 99.8
Range65.4–102.563–87 60–88 25–70 74–85 99.6–99.9
Table 3. The optimized parameters of MRM mode of antidepressant determination in ESI+.
Drug NameParent Ion [m/z] [M+H+]Daughter Ion
[m/z]
DP [V]CE [V]CXP [V]
Amitriptyline278233912520
Citalopram32510986398
Clomipramine3158681296
Desipramine26772813112
Doxepin28010771336
Fluoxetine3104456376
Fluoxetine-d53154471416
Fluvoxamine3197171334
Imipramine2818676256
Maprotiline278250862716
Mianserin265208963112
Mirtazapine266195463710
Moclobemide269182762710
Nortriptyline264233712314
Opipramol364171913114
Paroxetine330192513114
Protriptyline264191964114
Sertraline 306159513512
Sertraline-d3 309275561716
Tianeptine43729261258
Trazodone372176813710
Trimipramine29510071256
Venlafaxine27858564710
Venlafaxine-d628464664910
Table 4. Variants of samples tested during CPE development and validation—different variants of final concentration of surfactant Triton X-114, concentration of ammonium acetate (AA), and sample pH. Samples were incubated in a water bath for 20 min at 60 °C.
Part 1. Development—Changes in Each Part
VariantTriton X-114 in Sample [% (w/v)]Sample pH AA [% (w/v)]
Concentration of surfactant (a)(a1) 1.5
(a2) 6
6.8 120
Concentration of salt (b)66.8 1(b1) 0
(b2) 10
(b3) 20
(b4) 30
Sample pH (c)6(c1) 3.5 2(c2) 6.8 1
(c3) 10.2 3
10
Part 2. Validation method on sample C
Optimal method 6 10.2 310
1 water; 2 by acetic acid 100%; 3 by ammonia solution 25%.
Publisher’s Note: MDPI stays neutral with regard to jurisdictional claims in published maps and institutional affiliations.

