Molecular Determinants of the Response of Tumor Cells to Boswellic Acids


Abstract
: Frankincense (Boswellia serrata, B. carterii) is used as traditional remedy to treat inflammatory diseases. The molecular effects of the active ingredients, the boswellic acids, on the immune system have previously been studied and verified in several clinical studies. Boswellic acids also inhibit cancer cell growth in vitro and in vivo. The molecular basis of the cytotoxicity of boswellic acids is, however, not fully understood as yet. By mRNA-based microarray, COMPARE, and hierarchical cluster analyses, we identified a panel of genes from diverse functional groups, which were significantly associated with sensitivity or resistance of α- or β-boswellic acids, such as transcription factors, signal transducers, growth regulating genes, genes involved in RNA and protein metabolism and others. This indicates that boswellic acids exert profound cytotoxicity on cancer cells by a multiplicity of molecular mechanisms.1. Introduction
Boswellia serrata Roxb. et Colebr. and Boswellia carterii Birdw. (syn. B. sacra) are deciduous trees growing in China, India, the Arab peninsula, and some African countries (Somalia, Ethiopia). The resin gum of these trees is called frankincense or olibanum and is used not only for religious rituals, but also for medicinal purposes in different civilizations [1]. The active principles of frankincense are the boswellic acids, which are pentacyclic triterpenic acids. Since ancient times, frankincense has been used as a remedy to treat inflammatory diseases. The cellular and molecular mechanisms of boswellic acids on the immunological functions in the body have been unraveled since the 1980s and verified in several clinical studies, as recently reviewed [2,3]. Several studies have indicated that boswellic acids also exert growth inhibitory activity towards cancer cells in vitro and in vivo [4-7].
In recent years, it became evident that molecular mechanisms of inflammatory processes are also relevant for carcinogenesis [8-10]. The connection between inflammation and cancer based on common molecular modes of action raises the question, whether boswellic acids might act against cancer cells by similar mechanisms as those that confer their anti-inflammatory effects. The molecular basis of the cytotoxic action of boswellic acids towards cancer cells is, however, not fully understood as yet.
The aim of the present investigation was, therefore, to analyze the mechanisms of boswellic acids in cancer cells in more detail. For this reason, we were interested to identify possible determinants of sensitivity and resistance of tumor cells towards boswellic acids. We correlated the transcriptomic microarray-based mRNA expression of the cell line panel of the U.S. National Cancer Institute (NCI), with the IC50 values for boswellic acids by means of bioinformatic approaches to identify novel molecular determinants for response towards these compounds.
2. Experimental Section
2.1. Phytochemicals
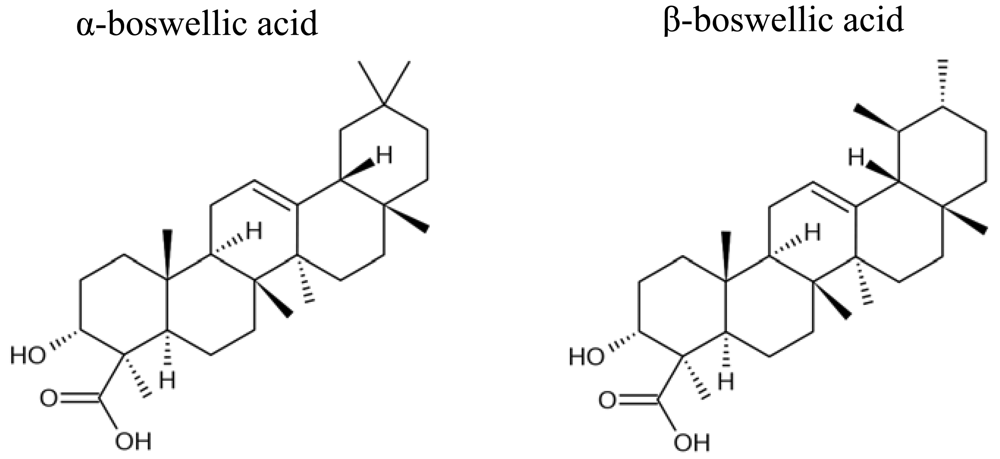
Boswellic acids were obtained from Sigma-Aldrich (Taufkirchen, Germany). The chemical structures are shown in Figure 1.
2.2. Cell Lines
The panel of human tumor cell lines of the Developmental Therapeutics Program of NCI consists of leukemia, melanoma, non-small cell lung cancer, colon cancer, renal cancer, ovarian cancer cells, tumor cells of the central nervous system, prostate carcinoma, and breast cancer. Their origin and processing have previously been described [11]. These cell lines were employed to determine the cytotoxicity of α- and β-boswellic acids in comparison to other constituents of Boswellia carterii (syn. B. sacra) (dipentene, farnesol, and borneol) and to established anticancer drugs (melphalan, teniposide, doxorubicin, vincristine, paclitaxel, and methotrexate).
2.3. Sulforhodamine B Assay
The cytotoxicity of phytochemical compounds towards the NCI cell line panel was evaluated by determining the IC50 (concentration resulting in 50% inhibition) using a modification of the sulforhodamine B assay [12] ( http://dtp.nci.nih.gov/branches/btb/ivclsp.html): Cells were inoculated into 96 well microtiter plates in 100 μL at plating densities ranging from 5,000 to 40,000 cells/well depending on the doubling time of individual cell lines. Microtiter plates were incubated at 37 °C, 5% CO2 for 24 h prior to addition of boswellic acids. Then, two plates of each cell line were fixed in situ with trichloroacetic acid (TCA) to represent a measurement of the cell population for each cell line at the time of drug addition (Tz). Following addition of boswellic acid, the plates were incubated for an additional 48 h at 37 °C and 5% CO2. For adherent cells, the assay is terminated by the addition of 50 μL of cold 50% (w/v) TCA and incubated for 60 min at 4 °C. The supernatant was discarded, and the plates were washed and air dried. Sulforhodamine B (SRB, Sigma, USA;) solution (100 μL) at 0.4% (w/v) in 1% acetic acid was added to each well, and plates were incubated for 10 min at room temperature. Unbound dye was removed by washing with 1% acetic acid and the plates were air dried. Bound stain was subsequently solubilized with 10 mM Trizma base, and the absorbance was read on an automated plate reader at a wavelength of 515 nm. For suspension cells, the methodology was the same except that the assay is terminated by fixing settled cells at the bottom of the wells by gently adding 50 μL of 80% TCA. Using the seven absorbance measurements [time zero, (Tz), control growth, (C), and test growth in the presence of drug at the five concentration levels (Ti)], the percentage growth was calculated as:
Growth inhibition of 50% (GI50) was calculated from [(Ti-Tz)/(C-Tz)] × 100 = 50, which was the drug concentration resulting in a 50% reduction in the net protein increase (as measured by SRB staining) in control cells during the drug incubation. The drug concentration resulting in total growth inhibition (TGI) was calculated from Ti = Tz.
2.4. Statistical Analyses
The mRNA microarray hybridization of the NCI cell line panel has been described [13,14] and the data has been deposited at the NCI website ( http://dtp.nci.nih.gov). For hierarchical cluster analysis, objects were classified by calculation of distances according to the closeness of between-individual distances by means of. All objects were assembled into cluster trees (dendrograms). Previously, cluster models have been validated for gene expression profiling and for approaching molecular pharmacology of cancer [13,15]. Hierarchical cluster analyses applying the WARD method were done with the WinSTAT program (Kalmia, Cambridge, MA, USA). Missing values were automatically omitted by the program, and the closeness of two joined objects was calculated by the number of data points they contained. In order to calculate distances between all variables included in the analysis, the program automatically standardizes the variables by transforming the data with a mean = 0 and a variance = 1.
For COMPARE analysis, the mRNA expression values of genes of interest and IC50 values for α- and β-boswellic acids were selected from the NCI database. The mRNA expression has been determined by microarray analyses as reported [13]. COMPARE analyses were performed to produce rank-ordered lists of genes expressed in the NCI cell lines. The methodology has been previously described in detail [16]. Briefly, every gene of the NCI microarray database was ranked for similarity of its mRNA expression to the IC50 values for the corresponding compound. To derive COMPARE rankings, a scale index of correlations coefficients (R-values) was created. In the standard COMPARE approach, greater mRNA expression in cell lines correlate with enhanced drug resistance, whereas in reverse COMPARE analyses greater mRNA expression in cell lines indicated drug sensitivity. Pearson's correlation test was used to calculate significance values and rank correlation coefficients as relative measure for the linear dependency of two variables. This test was implemented into the WinSTAT Program (Kalmia).
3. Results and Discussion
3.1. Cytotoxicity of Boswellic Acids towards a Panel of 60 NCI Cell Lines
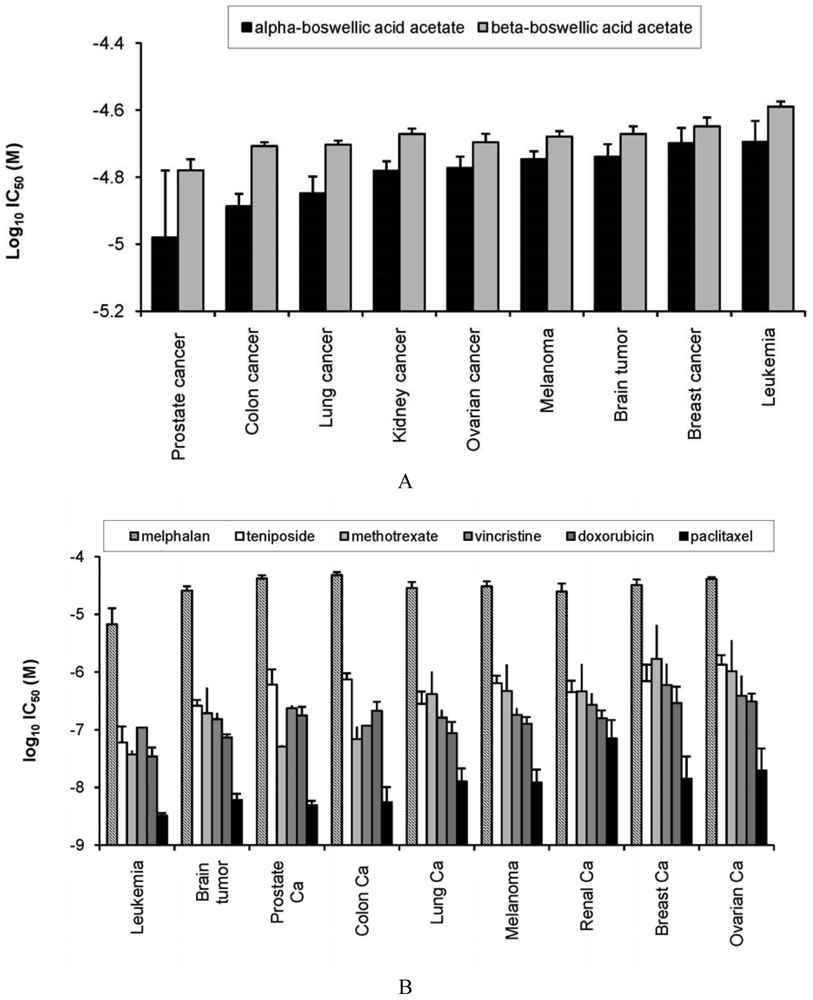
As a first step, we investigated the activity of α- and β-boswellic acid towards 60 cell lines of different tumor origin. The IC50 values for both compounds have been determined over a dose range of 10−8 to 10−4 M in the cell line panel and deposited at the database of the NCI's Developmental Therapeutics Program. The log10 IC50 mean values for these cell lines grouped according to their tumor type are shown in Figure 2A. Across all tumor types, α-boswellic acid was more cytotoxic than β-boswellic acid. Prostate cancer cell lines were most sensitive towards both boswellic acids, whereas breast cancer and leukemia cell lines were most resistant. Cell lines from colon, lung, kidney, or ovarian cancer, melanoma, or brain tumors showed intermediate sensitivity (Figure 2A). The profile of boswellic acids was compared with the response of the cell line panel towards standard anticancer agents (melphalan, teniposide, doxorubicin, vincristine, paclitaxel, and methotrexate). As shown in Figure 2B, two major differences were observed. First, established anticancer drugs inhibited cell lines at lower concentrations (log10 IC50 values of −8 to −5 M) than boswellic acids (log10 IC50 values of −5 to −4.5 M). Second, leukemia cell lines were most sensitive to standard anticancer agents, but were most resistant towards boswellic acids. On the other hand, prostate cancer which were most sensitive to boswellic acids, were only intermediate responsive towards standard agents (Figure 2B).
As reported in Duke's Phytochemical and Ethnobotanical Database ( http://www.ars-grin.gov/duke/) Boswellia carterii (syn. B. sacra) contains a number of other phytochemicals in addition to boswellic acids. Among them dipentene, farnesol, and borneol are also deposited in the NCI database. This allowed us to subject the IC50 values of α- and β-boswellic acid and those of dipentene, farnesol, and borneol to Pearson's correlation test and to investigate the cross-resistance of cell lines towards these five phytochemicals. Although the correlation of IC50 values for α-boswellic acid and those for β-boswellic acid reached a significance level of P < 0.001, the correlation coefficient was rather weak (R < 0.55; Table 1). The IC50 values for α-boswellic acid were associated with the IC50 values for farnesol and borneol at significance values of P < 0.05, however, the correlation coefficients were weak. Other significant correlations were not found indicating that cross-resistance of these compounds was weakly or not expressed in this panel of cell lines.
3.2. mRNA Microarray and COMPARE Analyses
We further investigated the microarray-based transcriptomic mRNA expression by COMPARE analyses to test whether sensitivity and resistance to the boswellic acids were correlated with expression of similar or different sets of genes. We mined the genome-wide mRNA expression database of the NCI and correlated the expression data with the IC50 values for α- and β-boswellic acid. This represents a hypothesis-generating bioinformatical approach, which allows the identification of novel putative molecular determinants of cellular response towards arsenic trioxide. First, standard COMPARE analyses were performed. Lowest IC50 values of cell lines were correlated with the lowest mRNA expression levels of genes. Then, a reverse COMPARE analysis was done which correlated lowest IC50 values with the highest gene expression level. Genes with correlation coefficients of R > 0.55 (standard COMPARE) and R < −0.55 (reverse COMPARE) are listed in Table 2.
Among the genes which associated with cellular response to α-boswellic acid were genes from diverse functional groups such as transcription factors and signal transduction (PML, GLI1, PHKA1), RNA and protein metabolism (MRPS16, FBOX21, LSM12, SIRT3) and others (NEBL, TYSND1, SLC25A46). Genes associated with sensitivity or resistance towards β-boswellic acid were also transcriptional factors and signal transducers (TFCP2, ZNF562, SP7, RAB1, TACC2, TBC1D1), growth regulators (PHLDA2, U50277, RPA2, DLGAP5, CEP350) or others (SPR, MLL2, SLC25A39, APCS, CYLC1, MYL3) (Table 2).
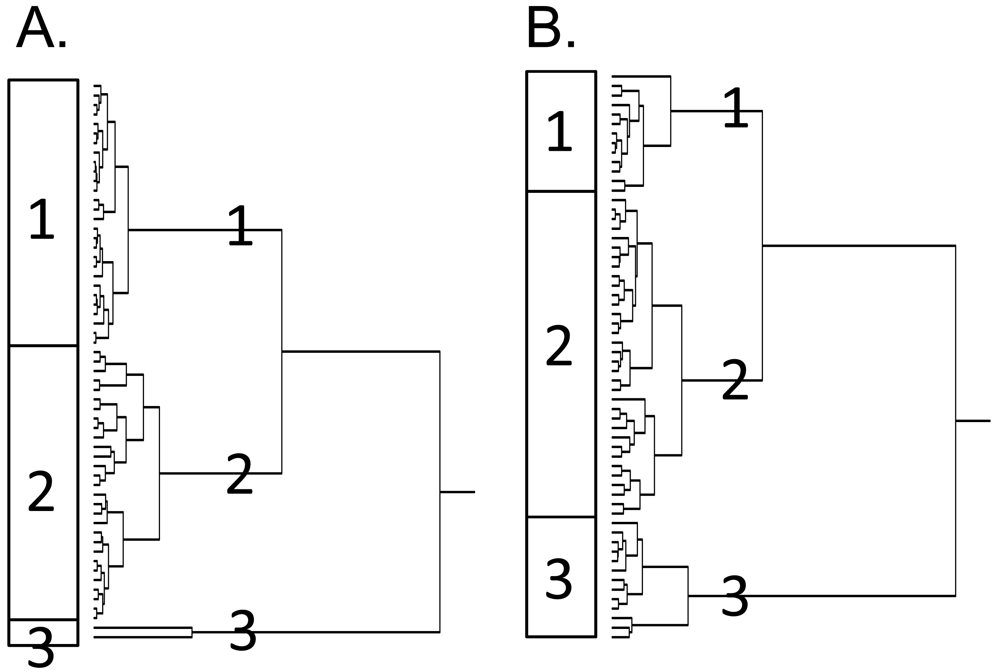
Next, the genes identified by standard and reverse COMPARE analyses were subjected to hierarchical cluster analysis. The dendrograms both for α-boswellic acid (Figure 3A) and β-boswellic acid (Figure 3B) obtained by this procedure can be divided into each three major branches (clusters). To examine whether these clusters were associated with the response to the boswellic acids, these clusters were correlated to the IC50 data for these compounds that had not been included before the cluster analysis. Indeed, the distribution of cell lines being sensitive or resistant to the compounds was significantly different between the branches of the dendrograms. The distribution of cell lines among the dendrogram in Figure 3A predicted resistance to α-boswellic acid with significance (P = 4.622 × 10⁻⁷; χ2-test), but not towards β-boswellic acid or other phytochemicals of Boswellia carterii (Table 3). Similarly, the distribution of cell lines among the dendrogram in Figure 3B predicted cellular response to β-boswellic acid with significance (P = 1.350 × 10⁻⁵; χ2-test) (Table 4). While sensitivity or resistance to α-boswellic acid was also significantly predicted by this dendrogram, this was not the case for the other constituents of Boswellia carterii tested in this investigation (Table 4).
In the present investigation, we analyzed the response of cancer cells towards boswellic acids. A comparison of the IC50 values in 60 tumor cell lines showed that boswellic acids inhibited cell lines at higher concentrations than established anticancer drugs. This may indicate that boswellic acids are less effective than classical cytostatic drugs. However, the final efficacy is not only determined by the cytotoxicity of a compound, but also by the concentration window affecting tumor cells in comparison to normal cells. A major disadvantage of most established anticancer drugs is their severe toxicity on normal organs. In contrast, boswellic acids are well tolerated and severe side effects are rare events as pointed out in a recent meta-analysis of clinical trials on Boswellia preparations [17].
Another interesting feature of boswellic acids was that prostate cancer cell lines were more sensitive towards these compounds than other cell lines of other tumor types. In many cases, leukemia cells lines are more sensitive to cytotoxic compounds than cell lines from solid cancer types. From these in vitro results, it could be speculated that boswellic acids are favorable for the treatment of prostate cancer, albeit clinical experiences are still missing supporting this point of view.
Frankincense gum resin preparations are commercially available rather than isolated boswellic acids. Therefore, the question arises, whether other compounds in addition to α- and β-boswellic acids may also exert cytotoxicity towards cancer cells. While the boswellic derivatives, acetyl-ß-boswellic acid, acetyl-boswellic acid, 11-keto-ß-boswellic acid, and acetyl-11-ß-boswellic acid, are not deposited in the NCI database, the IC50 values for dipentene borneol, farnesol were available. Therefore, we have chosen these five phytochemicals to exemplarily analyze cross-resistance among these compounds. Interestingly, we observed that the 60 tumor cell lines did not exert cross-resistance between α- and β-boswellic acid on the one hand and dipentene, borneol, farnesol on the other hand. The development of drug resistance is a tremendous problem in clinical oncology. A general concept of drug resistance has been described by Goldie and Coldman [18]. Starting point of this seminal work were observations with bacterial strains, which acquired resistance towards viruses by spontaneous mutations [19]. Goldie and Coldman and later on other groups developed mathematical models, which explained drug resistance of tumors on the basis of spontaneous mutations of single cells. Upon drug treatment, such resistant cells have a survival advantage compared to the majority of non-mutated sensitive cells and overgrow the entire tumor cell population [20]. Sublethal drug concentrations act as an evolutionary selection pressure for the development of resistant tumors. This can be prevented by the simultaneous treatment with a second drug. The assumption is that small subpopulations resistant to one drug are not resistant at the same time to a second drug. Therefore, they are killed by the second drug and development of resistance to the first drug is avoided. This is the basic principle of combination chemotherapy for tumors developed in the 1970s and 1980s and still well established in clinical oncology up to now. Transferring this concept to medicinal plants, e.g., B. carterii provides a similar scenario: small subpopulations resistant to boswellic acids do not survive when they are treated with dipentene, borneol, or farnesol. Hence, boswellic acid resistance of the entire tumor cell population may be avoided. The point of view that phytotherapeutical preparations represent combination therapies, because they contain a multitude of different bioactive phytochemicals, has not been extensively discussed in the literature. Recently, we made comparable observations for different compounds of another medicinal herb, Artemisia annua L. [21]. It can be hypothesized that phytochemical preparations with defined contents of phytochemicals may be useful to prevent the emergence of resistance to single compounds.
Furthermore, we analyzed molecular determinants of sensitivity and resistance of cancer tumor cell lines towards α- and β-boswellic acids. By microarray-based gene expression and COMPARE analyses, we correlated the IC50 values for both compounds of 60 tumor cell lines with transcriptomic mRNA expression levels of this cell line panel [13]. This approach has been successfully used to unravel the mode of action of novel compounds [22]. Cluster and COMPARE analyses are also useful for comparing gene expression profiles with IC50 values for investigational drugs to identify candidate genes for drug resistance [23] and to identify prognostic expression profiles in clinical oncology [24].
We identified genes from diverse functional groups, which were tightly associated with the response of tumor cells to boswellic acids such as transcription factors and signal transducers, growth regulating genes, genes involved in RNA and protein metabolism and others. Although these genes have not yet been associated with cellular response to boswellic acids, the results can be reconciled with a proposed role of boswellic acid in a growth inhibitory activity towards cancer cells. The gene-hunting approach applied by us delivered several novel candidate genes that may regulate the response of cancer cells to boswellic acids. These results merit further investigation to prove the contribution of these genes to boswellic acid resistance. Remarkably, inflammation-related genes did not appear in our analysis. Cancer development is frequently preceded by inflammatory processes [8-10], and boswellic acids are known for their anti-inflammatory activity [2,3]. The fact that inflammation-related genes did not appear in our microarray-based COMPARE analysis indicates that the activity of boswellic acids towards cancer cells might primarily not be linked to inflammation-related mechanisms.
4. Conclusions
The fact that genes associated with sensitivity or resistance against α- and β-boswellic acid were from diverse functional groups speaks for the multiplicity of mechanisms whereby boswellic acids exert their inhibitory effects towards cancer cells. Multiplicity of mechanisms can mean that boswellic acids either have multiple targets leading to multiple effects, or one target leading to activation or inactivation of multiple mechanisms downstream of this target. A general feature of natural products is their multi-specificity. Rather than acting on one single target, multiple targets and pathways are affected [25]. Multi-specificity prevents the development of resistance towards one bioactive compounds which turned out to be an important selection advantage during evolution of life [25].


| β-Boswellic acid | Dipentene | Farnesol | Borneol | ||
|---|---|---|---|---|---|
| α-Boswellic acid | R-Value | 0.412 | −0.085 | −0.303 | 0.276 |
| P-Value | 2.11 × 10⁻⁴ | 0.261 | 0.015 | 0.021 | |
| β-Boswellic acid | R-Value | −0.061 | −0.219 | 0.096 | |
| P-Value | 0.324 | 0.058 | 0.242 | ||
| Dipentene | R-Value | −0.017 | 0.056 | ||
| P-Value | 0.455 | 0.358 | |||
| Farnesol | R-Value | −0.169 | |||
| P-Value | 0.122 | ||||
| COMPARE coefficient | Genebank Acc No. | Symbol | Name | Function | |
|---|---|---|---|---|---|
| α-boswellic acid | |||||
| Standard COMPARE: | |||||
| 0.628 | BE965646 | unknown | unknown | unknown | |
| 0.599 | NM_006393 | NEBL | Nebulette | structural constituent of muscle | |
| 0.593 | H18472 | TYSND1 | Trypsin domain containing 1 | peroxisome enzyme | |
| 0.592 | X73874 | PHKA1 | Phosphorylase kinase, alpha 1 (muscle) | phosphorylase kinase of troponin I, binds calmodulin | |
| 0.586 | AI806379 | LSM12 | LSM12 homolog (S. cerevisiae) | protein binding | |
| 0.582 | AB020682 | FBOX21 | F-box protein 21 | ubiquitin-protein ligase | |
| 0.576 | NM_016065 | MRPS16 | Mitochondrial ribosomal protein S16 | structural constituent of ribosome | |
| 0.576 | AI870951 | C17orf96 | Chromosome 17 open reading frame 96 | unknown | |
| 0.571 | NM_005269 | GLI1 | GLI family zinc finger 1 | RNA polymerase II transcription factor | |
| 0.569 | AF083108 | SIRT3 | Sirtuin 3 | NAD-dependent protein deacetylase | |
| Reverse COMPARE: | |||||
| −0.522 | R55296 | PML | Promyelocytic leukemia | transcription factor | |
| −0.509 | N70280 | C2orf60 | Chromosome 2 open reading frame 60 | unknown | |
| −0.509 | R78631 | SLC25A46 | Solute carrier family 25, member 46 | transmembrane transport | |
| β-boswellic acid | |||||
| Standard COMPARE: | |||||
| 0.661 | M76231 | SPR | Sepiapterin reductase (7,8-dihydrobiopterin:NADP+ oxidoreductase) Myeloid/lymphoid or mixed-lineage | oxidoreductase in tetra-hydrobiopterin biosynthesis | |
| 0.574 | AF010403 | MLL2 | leukemia 2 | Histone methyltransferase | |
| 0.567 | AF097738 | unknown | unknown | unknown | |
| 0.563 | AI354351 | SLC25A39 | Transcribed locus, similar to NP_057100.1 solute carrier family 25 member 39 isoform b | unknown | |
| 0.558 | U03494 | TFCP2 | Transcription factor CP2 | ||
| 0.545 | AF035444 | PHLDA2 | Pleckstrin homology-like domain, family A, member 2 | placenta growth regulation | |
| 0.54 | H79005 | ZNF652 | Zinc finger protein 652 | transcriptional repressor | |
| 0.534 | NM_001639 | APCS | Amyloid P component, serum | sugar, metal, and protein binding protein | |
| 0.534 | M28209 | RAB1A | RAB1A, member RAS oncogene family | GTPase | |
| 0.533 | AF220152 | TACC2 | Transforming, acidic coiled-coil containing protein 2 | nuclear hormone receptor | |
| Reverse COMPARE: | |||||
| −0.588 | U50277 | unknown | Breast cancer suppressor element Ishmael Upper CP1 | tumor suppressor? | |
| −0.576 | W27118 | RPA2 | Replication protein A2, 32kDa | replication and DNA repair | |
| −0.574 | D13633 | DLGAP5 | Discs, large (Drosophila) homolog-associated protein 5 | cell cycle regulator in carcinogeneisis | |
| −0.565 | W28183 | C16orf80 | Chromosome 16 open reading frame 80 | unknown | |
| −0.555 | AW020776 | SP7 | Sp7 transcription factor | transcription factor | |
| −0.553 | Z22780 | CYLC1 | Cylicin, basic protein of sperm head cytoskeleton 1 | structural molecule | |
| −0.553 | NM_014810 | CEP350 | Centrosomal protein 350kDa | centriole growth regulator | |
| −0.549 | AI061288 | unknown | unknown | unknown | |
| −0.544 | N92340 | MYL3 | Myosin, light chain 3, alkali; ventricular, skeletal, slow | structural constituent of muscle | |
| −0.543 | AW043925 | TBC1D1 | TBC1 (tre-2/USP6, BUB2, cdc16) domain family, member 1 | Rab GTPase activator | |
Information on gene functions was taken from the OMIM database, NCI, USA ( http://www.ncbi.nlm.nih.gov/Omim/) and from the GeneCard database of the Weizman Institute of Science, Rehovot, Israel. http://bioinfo.weizmann.ac.il/cards/index.html).
| Partition | Cluster 1 | Cluster 2 | Cluster 3 | χ2 Test | ||
|---|---|---|---|---|---|---|
| α-Boswellic acid | sensitive | < −4.780 | 3 | 23 | 2 | |
| resistant | ≥ −4.780 | 25 | 6 | 0 | P = 4.622 × 10⁻⁷ | |
| β-Boswellic acid | sensitive | < −4.676 | 11 | 16 | 2 | |
| resistant | ≥ −4.676 | 17 | 13 | 0 | P = 0.167 | |
| Dipentene | sensitive | < −3.036 | 15 | 9 | 0 | |
| resistant | ≥ −3.036 | 8 | 16 | 1 | P = 0.079 | |
| Farnesol | sensitive | < −4.646 | 13 | 10 | 1 | |
| resistant | ≥ −4.646 | 10 | 16 | 1 | P = 0.448 | |
| Borneol | sensitive | < −4.0 | 8 | 7 | 1 | |
| resistant | ≥ −4.0 | 18 | 20 | 0 | P = 0.277 |
| Partition | Cluster 1 | Cluster 2 | Cluster 3 | χ2 Test | ||
|---|---|---|---|---|---|---|
| β-Boswellic acid | sensitive | < −4.676 | 12 | 18 | 0 | |
| resistant | ≥ −4.676 | 1 | 16 | 13 | P = 1.350 × 10⁻⁵ | |
| α-Boswellic acid | sensitive | < −4.780 | 8 | 19 | 1 | |
| resistant | ≥ −4.780 | 5 | 14 | 12 | P = 0.005 | |
| Dipentene | sensitive | < −3.036 | 4 | 13 | 7 | |
| resistant | ≥ −3.036 | 7 | 14 | 4 | P = 0.437 | |
| Farnesol | sensitive | < −4.646 | 2 | 15 | 8 | |
| resistant | ≥ −4.646 | 8 | 16 | 3 | P = 0.054 | |
| Borneol | sensitive | < −4.0 | 5 | 5 | 5 | |
| resistant | ≥ −4.0 | 8 | 24 | 7 | P = 0.174 |
Conflict of Interest
The authors declare no conflict of interest.
References
- Martinez, D.; Lohs, K.; Janzen, J. Weihrauch und Myrrhe. Kulturgeschichte und Wirtschaftliche Bedeutung. Botanik, Chemie, Medizin (Germany); Wissenschaftliche Verlagsgesellschaft: Stuttgart, Germany, 1989. [Google Scholar]
- Ammon, H.P.T. Boswellic acids in chronic inflammatory diseases. Planta Med. 2006, 72, 1100–1116. [Google Scholar]
- Ammon, H.P.T. Modulation of the immune.
- Shao, Y.; Ho, C.T.; Chin, C.K.; Badmaev, V.; Ma, W. Huang, system by Boswellia serrata extracts and boswellic acids. Phytomedicine 2010, 17, 862–867. [Google Scholar]M., T. Inhibitory activity of boswellic acids from Boswellia serrata against human leukemia HL-60 cells in culture. Planta Med. 1998, 64, 328–331. [Google Scholar]
- Glaser, T.; Winter, S.; Groscurth, P.; Safayhi, H.; Sailer, E.R.; Ammon, H.P.; Schabet, M.; Weller, M. Boswellic acids and malignant glioma: Induction of apoptosis but no modulation of drug sensitivity. Br. J. Cancer 1999, 80, 756–765. [Google Scholar]
- Hoernlein, R.F.; Orlikowsky, T.; Zehrer, C.; Niethammer, D.; Sailer, E.R.; Simmet, T.; Dannecker, G.E.; Ammon, H.P.T. Acetyl-11-keto-b-boswellic acid induces apoptosis in HL-60 and CCRF-CEM cells and inhibits Topoisomerase I. J. Pharmacol. Exp. Ther. 1999, 288, 613–619. [Google Scholar]
- Winking, M.; Sarikaya, S.; Rahmanian, A.; Jodicke, A.; Boker, D.K. Boswellic acids inhibit glioma growth: A new treatment option. J. Neurooncol. 2000, 46, 97–103. [Google Scholar]
- Balkwill, F. Cancer and the chemokine network. Nat. Rev. Cancer 2004, 4, 540–550. [Google Scholar]
- de Marzo, A.M.; Platz, E.A.; Sutcliffe, S.; Xu, J.; Grönberg, H.; Drake, C.G.; Nakai, Y.; Isaacs, W.B.; Nelson, W.G. Inflammation in prostate carcinogenesis. Nat. Rev. Cancer 2007, 7, 256–269. [Google Scholar]
- Thorsteinsdottir, S.; Gudjonsson, T.; Nielsen, O.H.; Vainer, B.; Seidelin, J.B. Pathogenesis and biomarkers of carcinogenesis in ulcerative colitis. Nat. Rev. Gastroenterol. Hepatol. 2011, 8, 395–404. [Google Scholar]
- Alley, M.C.; Scudiero, D.A.; Monks, A.; Hursey, M.L.; Czerwinski, M.J.; Fine, D.L.; Abbott, B.J.; Mayo, J.G.; Shoemaker, R.H.; Boyd, M.R. Feasibility of drug screening with panels of human tumor cell lines using a microculture tetrazolium assay. Cancer Res. 1988, 48, 589–601. [Google Scholar]
- Monk, A.; Scudiero, D.; Skehan, P.; Shoemaker, R.; Paull, K.; Vistica, D.; Hose, C.; Langley, J.; Cronise, P.; Vaigro-Wolff, A. Feasibility of a high-flux anticancer drug screen using a diverse panel of cultured human tumor cell lines. J. Natl. Cancer Inst. 1991, 83, 757–766. [Google Scholar]
- Scherf, U.; Ross, D.T.; Waltham, M.; Smith, L.H.; Lee, J.K.; Tanabe, L.; Kohn, K.W.; Reinhold, W.C.; Myers, T.G.; Andrews, D.T.; et al. A gene expression database for the molecular pharmacology of cancer. Nat. Genet. 2000, 24, 236–244. [Google Scholar]
- Amundson, S.A.; Do, K.T.; Vinikoor, L.C.; Lee, R.A.; Koch-Paiz, C.A.; Ahn, J.; Reimers, M.; Chen, Y.; Scudiero, D.A.; Weinstein, J.N.; et al. Integrating global gene expression and radiation survival parameters across the 60 cell lines of the National Cancer Institute Anticancer Drug Screen. Cancer Res. 2008, 68, 415–424. [Google Scholar]
- Efferth, T.; Fabry, U.; Osieka, R. Apoptosis and resistance to daunorubicin in human leukemic cells. Leukemia 1997, 11, 1180–1186. [Google Scholar]
- Wosikowski, K.; Schuurhuis, D.; Johnso, K.; Paull, K.D.; Myers, T.G.; Weinstein, J.N.; Bates, S.E. Identification of epidermal growth factor receptor and erbB2 pathway inhibitors by correlation with gene expression patterns. J. Natl. Cancer Inst. 1997, 89, 1505–1515. [Google Scholar]
- Ernst, E. Frankincense: Systematic review. BMJ 2008, 337, a2813. [Google Scholar]
- Goldie, J.H.; Coldman, A.J. A model for tumor response to chemotherapy: An integration of the stem cell and somatic mutation hypotheses. Cancer Invest. 1985, 3, 553–564. [Google Scholar]
- Luria, S.E.; Delbrück, M. Mutations of bacteria from virus sensitivity to virus resistance. Genetics 1943, 28, 491–511. [Google Scholar]
- Dy, G.K.; Adjei, A.A. Systemic cancer therapy: Evolution over the last 60 years. Cancer 2008, 113, 1857–1887. [Google Scholar]
- Efferth, T.; Herrmann, F.; Tahrani, A.; Wink, M. Cytotoxic activity towards cancer cells of arteanuine B, artemisitene, scopoletin and 1,8-cineole derived from Artemisia annua L. in comparison to artemisinin. Phytomedicine 2011. In Press. [Google Scholar]
- Leteurtre, F.; Kohlhagen, G.; Paull, K.D.; Pommier, Y. Topoisomerase II inhibition and cytotoxicity of the anthrapyrazoles DuP 937 and DuP 941 (Losoxantrone) in the National Cancer Institute preclinical antitumor drug discovery screen. J. Natl. Cancer Inst. 1994, 86, 1239–1244. [Google Scholar]
- Efferth, T.; Gebhart, E.; Ross, D.D.; Sauerbrey, A. Identification of gene expression profiles predicting tumor cell response to l-alanosine. Biochem. Pharmacol. 2003, 66, 613–621. [Google Scholar]
- Efferth, T.; Olbrich, A.; Bauer, R. mRNA expression profiles for the response of human tumor cell lines to the antimalarial drugs artesunate, arteether, and artemether. Biochem. Pharmacol. 2002, 64, 617–623. [Google Scholar]
- Efferth, T.; Koch, E. Complex interactions between phytochemicals. The multi-target therapeutic concept of phytotherapy. Curr. Drug Targets 2011, 12, 122–132. [Google Scholar]
© 2011 by the authors; licensee MDPI, Basel, Switzerland. This article is an open access article distributed under the terms and conditions of the Creative Commons Attribution license (http://creativecommons.org/licenses/by/3.0/).
Share and Cite
Eichhorn, T.; Greten, H.J.; Efferth, T. Molecular Determinants of the Response of Tumor Cells to Boswellic Acids. Pharmaceuticals 2011, 4, 1171-1182. https://doi.org/10.3390/ph4081171
Eichhorn T, Greten HJ, Efferth T. Molecular Determinants of the Response of Tumor Cells to Boswellic Acids. Pharmaceuticals. 2011; 4(8):1171-1182. https://doi.org/10.3390/ph4081171
Chicago/Turabian StyleEichhorn, Tolga, Henry Johannes Greten, and Thomas Efferth. 2011. "Molecular Determinants of the Response of Tumor Cells to Boswellic Acids" Pharmaceuticals 4, no. 8: 1171-1182. https://doi.org/10.3390/ph4081171