Article

Novel Marine Phenazines as Potential Cancer Chemopreventive and Anti-Inflammatory Agents

1
College of Pharmacy, University of Hawaii at Hilo, 34 Rainbow Drive, Hilo, HI 96720, USA
2
Department of Medicinal Chemistry and Pharmacognosy, College of Pharmacy, University of Illinois at Chicago, Chicago, IL 60612, USA
3
Center for Marine Biotechnology and Biomedicine, Scripps Institution of Oceanography, University of California-San Diego, La Jolla, CA 92093, USA
*
Author to whom correspondence should be addressed.
Mar. Drugs 2012, 10(2), 451-464; https://doi.org/10.3390/md10020451
Submission received: 27 December 2011 / Revised: 8 February 2012 / Accepted: 13 February 2012 / Published: 16 February 2012

Abstract

:
Two new (1 and 2) and one known phenazine derivative (lavanducyanin, 3) were isolated and identified from the fermentation broth of a marine-derived Streptomyces sp. (strain CNS284). In mammalian cell culture studies, compounds 1, 2 and 3 inhibited TNF-α-induced NFκB activity (IC50 values of 4.1, 24.2, and 16.3 μM, respectively) and LPS-induced nitric oxide production (IC50 values of >48.6, 15.1, and 8.0 μM, respectively). PGE2 production was blocked with greater efficacy (IC50 values of 7.5, 0.89, and 0.63 μM, respectively), possibly due to inhibition of cyclooxygenases in addition to the expression of COX-2. Treatment of cultured HL-60 cells led to dose-dependent accumulation in the subG1 compartment of the cell cycle, as a result of apoptosis. These data provide greater insight on the biological potential of phenazine derivatives, and some guidance on how various substituents may alter potential anti-inflammatory and anti-cancer effects.

Graphical Abstract

1. Introduction

Modulation of molecular targets that control cancer development and progression is one approach for chemoprevention. For example, transcriptional regulation of NFκB has been intensely studied. Major cellular targets for NFκB are chemokines, immune receptors, adhesion molecules, stress response genes, regulators of apoptosis, transcription factors, growth factors, enzymes, and cell cycle regulators [1,2,3]. These include the anti-apoptosis genes bcl-2 and bcl-xl, cylcooxygenase (COX)-2, matrix metalloproteinase-9 (MMP-9), genes encoding adhesion molecules, chemokines, inflammatory cytokines, and cell cycle-regulatory genes [4,5,6]. In addition, the NFκB pathway is central in inducible nitric oxide synthase (iNOS) induction [7]. Activity of iNOS is tightly regulated and includes activation of IκB and mitogen-activated protein kinases (MAPKs) kinases [8,9,10]. In principle, agents that can suppress NFκB activation and iNOS have the potential of suppressing carcinogenesis [11].
In response to various external stimuli, such as proinflammatory cytokines, bacterial lipopolysaccharide (LPS), UV, ROS and phorbol ester, COX-2 is transiently elevated in certain tissues, and serves as an interface between inflammation and cancer [12,13]. Abnormally elevated COX-2 causes promotion of cellular proliferation, suppression of apoptosis, and enhancement of angiogenesis and invasiveness, which accounts for its oncogenic function [14]. Elevated levels of PGE2, generated by COX-2, mediate inflammatory responses [15]. In various types of human cancers, elevated PGE2 levels promote cell proliferation and tumor-associated neovascularization, and inhibit cell death, thereby favoring tumor growth [16].
An additional consideration is cellular homeostasis. Cancer may be viewed as an example wherein the normal mechanisms of cell cycle regulation are dysfunctional, with either an over proliferation of cells and/or decreased removal of cells [17]. In fact, suppression of apoptosis during carcinogenesis is thought to play a central role in the development and progression of some cancers [18,19].
We report here the isolation and biological evaluation of two new phenazine derivatives (1 and 2) as well as lavanducyanin (3) from a marine derived Streptomyces. Metabolites of this type have been isolated from terrestrial Streptomyces, Pseudomonas, and a variety of marine microorganisms [20,21,22,23,24]. These compounds are generally formed by microorganisms when they have stopped dividing. Metabolism is slow and it has been noted that phenazine-producing organisms survive longer in their natural environment compared to non-producing species [24]. It is likely that phenazine production serves to protect against other microorganisms and microbial competitors [25]. In addition to normal physiological function, various biological activities have been explored that might be of value for the treatment of human ailments [25,26,27]. For example, it has been shown that lavanducyanin strongly inhibits the growth of P388 and L1210 cells in culture [28]. Conversely, the potential of phenazines and lavanducyanin to promote cellular growth has been reported [29]. Growth promoting action was confirmed by the MTT assay, as well as an increase in cell number and DNA synthesis [30]. Lavanducyanin competitively inhibits 5-α-reductase derived from rat, dog and human prostate [31].
In earlier investigations [23,27], based on inhibition of NFκB activity and cellular proliferation, Streptomyces sp. strain CNS284 was selected for activity-guided fractionation. This resulted in the isolation of a diversity of phenazine derivatives, including some with modest activity against NFκB. Phenazines with bromine substituents were discovered to increased inhibitory activity; molecules with two bromine atoms were even more active, and bromine-substituted hydroxyphenazines demonstrated higher activity than their methylated analogues [23]. Simultaneously, these compounds induced quinone reductase 1 (NQ01, QR1) and inhibited quinone reductase 2 (NQ02, QR2) as well as iNOS. With QR1 and QR2, several of the phenazine derivatives displayed IC50 in the nanomolar range. In particular, 2,4-dibromo-1-hydroxyphenazine was found to activate QR1 and glutathione S-transferase (GST) in cell culture, but in vivo activity of the compound was low as a result of poor bioavailability [27]. We now report related pharmacological studies conducted with two new bromine containing terpenoid phenazines (1 and 2) and lavanducyanin (3) produced by the marine bacterium Streptomyces sp. (strain CNS284).

2. Results and Discussion

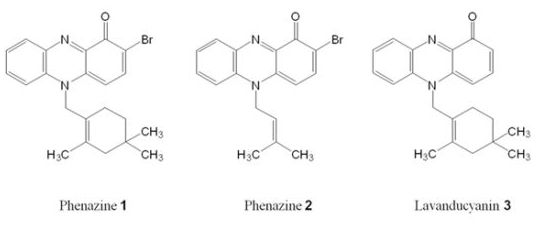
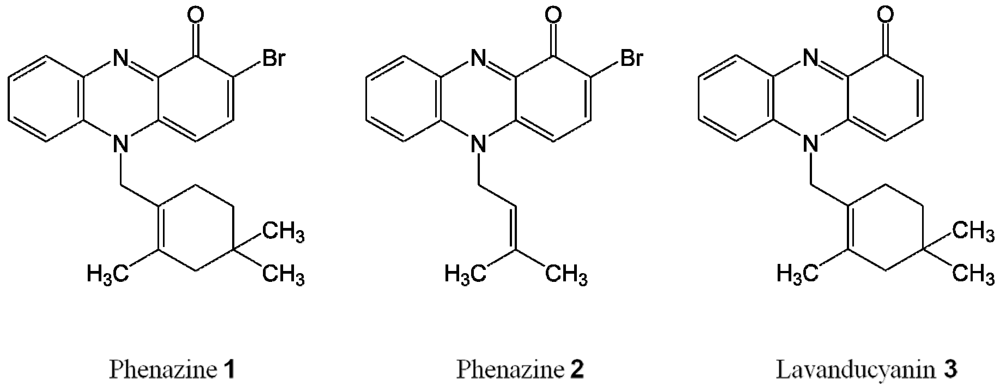
2.1. Phenazines Isolation

Fractionation of the fermentation broth of the marine-derived Streptomyces sp. (strain CNS284) resulted in the isolation of a complex mixture of brominated, terpenoid phenazines [32]. Among these were brominated terpenpoid phenazines 1 and 2 and also the known phenazine lavanducyanin (3) (Figure 1). All compounds belong to the terpenoid-substituted phenazines: compound 1: N-substituted brominated monoterpene phenazine; compound 2: N-substituted isoprenylated phenazine; compound 3: lavanducyanin, an N-monoterpenoid first discovered and isolated from Streptomyces aeriouvifer [28,29].
Figure 1. Chemical structures of phenazines 13.
Marinedrugs 10 00451 g001

2.2. Phenazines Inhibit TNF-α-Induced NFκB Activity

Activation of NFκB may promote cell proliferation or prevent cell death through apoptosis. Inhibition of NFκB signaling has potential application for the treatment or prevention of cancer; some inhibitors are known [33,34,35,36,37,38,39,40]. Using stably-transfected human embryonic kidney cells 293 (Panomics, Fremont, CA) that express a NFκB reporter when treated with tumor necrosis factor-α (TNF-α), treatment with phenazines 1, 2 and 3 led to dose-dependent inhibition with IC50 values of 4.1 ± 0.3, 24.2 ± 2.6, and 16.3 ± 0.9 μM, respectively. Earlier we demonstrated that 2-bromo-1-hydroxyphenazine isolated from Streptomyces strain CNS284 and synthesized by a short and flexible route showed moderate inhibition of NFκB with an IC50 of 73 μM [23]. These results suggest inhibitory activity is influenced by the N-substituent pattern as well as bromination at C-2. With the same treatment protocol, positive controls N-tosyl-L-phenylalanyl chloromethyl ketone (TPCK) [39] BAY-11-7082 [40], and resveratrol yielded IC50 values of 30 ± 4.2, 2 ± 0.28 and 2.5 ± 0.3 µM, respectively.

2.3. Transcriptional Regulation of iNOS and COX-2 by Phenazines

One of the key down-stream targets of NFκB is NOS, which catalyzes the oxidative deamination of L-arginine, producing NO, an important pro-inflammatory mediator [41]. Sustained high concentrations of NO contribute to carcinogenesis [42]. The bactericidal capacity of macrophages is in part mediated by the production of ROS and NO. In response to LPS and/or interferon-γ (IFN-γ), macrophages up-regulate iNOS, which catalyzes the oxidation of L-arginine to L-citrulline and NO. A second important down-stream target of NFκB is COX-2. This inducible form of cyclooxigenase generates prostaglandins, which are key players in the inflammatory response [15,43].
Figure 2. Effect of phenazines on COX-2 (black) and iNOS (gray) mRNA expression in RAW 264.7 cells. Total RNA was isolated using the TRIZOL® Reagent method (Invitrogen) from RAW 264.7 cells (2 × 10⁵ cells/well) after treatment with samples. cDNA was synthesized using the RT2 First Strand Kit (C-03, SA Biosciences) protocol. cDNA was used for quantitative real time PCRs with fluorescent Power SyBR® Green PCR master mix (Applied Biosystems), employing GAPDH, iNOS, COX-2 specific primers, and a 7300 Real Time PCR System (Applied Biosystems). The results were derived from two independent RNA preparations employing identical triplicates in each analysis and quantitated using GAPDH as the internal control, following the manufacturer’s instructions. (A) GAPDH standard curve for quantitation of iNOS and COX-2 expression; (B) Levels of COX-2 (black) and iNOS (gray) mRNA expression. The concentration and duration of treatment had no significant effect on the viability of Raw 264.7 cells.
Marinedrugs 10 00451 g002
As shown in Figure 2, LPS-treated RAW 264.7 cells were used as a model to assess the potential of phenazines 1, 2 and 3 to inhibit the expression of COX-2 and iNOS. Total mRNA samples were isolated, and cDNA was amplified with specific primers, using GAPDH as housekeeping gene. LPS induced the expression of COX-2 and iNOS mRNA by approximately 11- and 24-fold, respectively. Co-incubation with phenazines 1, 2 and 3 (50 µM) suppressed expression of iNOS mRNA by 21, 43, and 46% respectively, and COX-2 expression by 40, 50 and 51%, respectively (Figure 2). These inhibitory results are not very discriminating, but do indicate transcriptional regulation, perhaps working in concern with NFκB.

2.4. Inhibition of NO and PGE2 Production in LPS-Induced RAW 264.7 Cells

Since the test phenazines (13) inhibited the NFκB signaling pathway, the effects on NO and PGE2 levels were determined with LPS-treated RAW 264.7 cells. As shown in Table 1, when treated with a fixed concentration of 50 µM, phenazines 2 and 3 inhibited NO production by over 90%. Dose-response studies yielded corresponding IC50 values of 15.1 and 8.0 µM. Phenazine 1 was less active with 40% inhibition of NO production at 50 µM and a high IC50 value. The highest concentration of phenazines (50 µM) was somewhat cytotoxic with RAW 264.7 cells, but this effect was eliminated at concentrations in a range close to the IC50 values. All three phenazines reduced LPS-induced PGE2 production in a dose-dependent manner, with IC50 values 7.15, 0.89, 0.63 µM, respectively. Resveratrol, used as a standard drug, inhibited the production of both NO and PGE2 with IC50 values of 31.9 and 2.5 µM, respectively. Previously it was shown that a phenazine compound lacking N-substitution (2-bromo-1-hydroxyphenazine) did not inhibit iNOS activity [23], so N-substitution plays an important role in the inhibition of NO production.
Table 1. The effect of phenazines 13 on LPS-induced NO and PGE2 production in RAW 264.7 cells.
CompoundNONONOPGE2PGE2
% inhibition (50 µM)% cell survivalIC50, µM% inhibition (50 µM)IC50, µM
Phenazine 140.1 ± 568.9 ± 3.8>48.672.5 ± 16.37.15 ± 2.03
Phenazine 298.1 ± 0.556.0 ± 5.115.1 ± 2.786.9 ± 12.90.89 ± 0.22
Lavanducyanin 397 ± 0.758.3 ± 4.68.0 ± 0.3980.6 ± 18.40.63 ± 0.16
Resveratrol93.0 ± 0.886.9 ± 3.931.9 ± 1.870.2 ± 13.92.5 ± 0.43

2.5. Direct Inhibition of COX-1 and COX-2 Activity

As described above, phenazines 2 and 3 strongly reduce the production of PGE2 with LPS-treated RAW 264.7 cells, but this does not directly correlate with the potency of inhibiting NFκB activity or COX-2 expression. Radical scavenging is one feature of phenazines [24]. However, based on the 2,2-diphenyl-1-picrylhydrazyl (DPPH) radical assay, none of the three phenazines demonstrate inhibition of greater than 15% when tested at a concentration of 200 μg/mL (data not shown). Another possible explanation could be the direct inhibition of cyclooxygenase. As shown in Table 2, all three phenazines inhibited both enzymes with IC50 values in µM range. The IC50 of phenazine 1 was approximately 3-fold lower with COX-2 than COX-1, but the IC50 values were not sufficient to explain the dramatic reduction of PGE2. Indomethacin was used as the positive control for ovine COX-1 (IC50 0.42 ± 0.21 µM) and Celebrex® (celecoxib) was used as the positive for human COX-2 (IC50 0.05 ± 0.03 µM).
Table 2. Phenazines inhibit ovine COX-1 and human COX-2 activities.
COX-1, IC50, µMCOX-2, IC50, µMSelectivity COX-1/COX-2
Phenazine 111.0 ± 0.534.0 ± 0.412.75
Phenazine 25.6 ± 0.617.2 ± 0.130.78
Lavanducyanin 330.0 ± 1.0834.0 ± 1.10.88
Indomethacin0.42 ± 0.21ND
CelecoxibND0.05 ± 0.03
ND: not determined.

2.6. Phenazines Induce Apoptosis

Apoptosis is a protective mechanism against the development of tumors. It eliminates damaged cells that may be wrongly induced to proliferate by different stimuli. When a cell reaches the G1 check-point, it can enter S phase or, if there is evidence of damage, it can initiate the apoptotic process [44]. Apoptosis can be induced by physiological activators, oncogenes, chemotherapeutic drugs, and ultraviolet or gamma radiation [45]. As shown in Figure 3, after a 24 h incubation period with various concentrations of phenazines 1, 2 and 3, HL-60 cells accumulated in the subG1 phase of the cell cycle, indicative of apoptosis. This was confirmed by using a Phoenix Flow Systems, Inc. APO-BRDU™ kit, a two color TUNEL (Terminal deoxynucleotide transferase dUTP Nick End Labeling) assay for labeling DNA breaks and total cellular DNA (data not shown). The results suggest all three phenazines are active in this process, with phenazine 3 demonstrating the greatest potency, followed by 1 and then 2. Resveratrol was applied as a positive control.
Figure 3. NIM-DAPI cell cycle analysis of HL-60 cells. HL-60 cells (2 × 10⁵ cells/well) were treated with different concentrations of the indicated compounds for 24 h. The media were discarded, and 4',6-diamidino-2-phenylindole solution (NIM-DAPI; Beckman Coulter) was added just before the measurement using a Cell Lab Quanta™ SC (Beckman Coulter) flow cytometer. NIM-DAPI-stained cells were analyzed after excitation. The distribution of cells in each phase of cell cycle was exhibited in a DNA histogram and percentage in subG1 was analyzed. Results are representative of two experiments in triplicate.
Marinedrugs 10 00451 g003

3. Experimental Section

3.1. Cell Lines and Reagents

Methanol (HPLC grade), ethyl acetate (HPLC grade), marine broth, actinomycetes agar, cyclohexamide, agar, dimethyl sulfoxide (DMSO), lipopolysaccharide (LPS), sulfanilamide, 0.1% N-(1-naphthyl)ethylenediamine, sulforhodamine B (SRB), tetradecanoylphorbol 13-acetate (TPA), 2,2-diphenyl-1-picrylhydrazyl (DPPH), non-essential amino acids, and thiazolyl blue tetrazolium bromide (MTT) were purchased from Sigma-Aldrich, Inc. (St. Louis, MO, USA). Dulbecco’s Modified Eagle’s Medium (DMEM), antibiotic-antimycotic, Hygromycin B, MEM, sodium pyruvate, and Roswell Park Memorial Institute (RPMI) 1640 medium, were purchased from Invitrogen (Carlsbad, CA, USA). Reporter Lysis Buffer Luciferase Assay System was purchased from Promega (Madison, WI, USA). Tumor necrosis factor-α (TNF-α) was purchased from Calbiochem (Gibbstown, NJ, USA). All other chemicals were purchased from commercial sources and were of the highest grade and purity.

3.2. NFκB Assay

We employed human embryonic kidney cells 293 Panomic (Fremont, CA, USA) for monitoring changes occurring along the NFκB pathway. Stable constructed cells were seeded into sterile 96-well plate at 20 × 103 cells per well. Cells maintained in Dulbecco’s modified Eagle’s medium (DMEM) Invitrogen Co. (Carlsbad, CA, USA), supplemented with 10% FBS, 100 units/mL penicillin, 100 µg/mL streptomycin, 2 mM L-glutamine. After 48 h incubation, the medium was replaced and cells were treated with various concentration of test substances dissolved in PBS. TNF-α (Human, Recombinant, E. coli, Calbiochem, Gibbstown, NJ, USA) was used as an activator at a concentration of 2 ng/mL (0.14 nM). The plate was incubated for 6 h. Spent medium was discarded and the cells were washed once with PBS. Cells were lysed using 50 µL (for 96-well plate) Reporter Lysis Buffer from Promega, by incubating for 5 min on a shaker, and stored at −80 °C. The luciferase assay was performed using the Luc assay system from Promega (Madison, WI, USA) [46]. The gene product, luciferase enzyme, reacts with luciferase substrate, emitting light which was detected using a luminometer (LUMIstar Galaxy BMG). Data for NFκB constructs are expressed as IC50 values (i.e., concentration required to inhibit TNF-activated NFκB activity by 50%). As a positive control, two NFκB inhibitors were used: TPCK, IC50 = 3.8 µM and BAY-11, IC50 = 2.0 µM.

3.3. Nitric Oxide (NO) Synthase Assay

NO has a short half-life and is subsequently oxidized to the stable end product nitrite. The amount of nitrite was measured using the Griess reagent to assess the NO production [47,48]. RAW 264.7 cells (1 × 10⁵ cells/well) were incubated in a 96-well culture plate for 24 h. The cells were treated with various concentrations of compounds dissolved in phenol-red free DMEM for 30 min followed by 1 μg/mL of LPS treatment for 24 h. Nitrite in the media from cultured macrophages in each well was reacted with the Griess reagent [1:1 mixture (v/v) of 1% sulfanilamide in 2.5% H3PO4 and 0.1% N-(1-naphthyl)ethylenediamine in 2.5% H3PO4] and the absorbance was measured at 540 nm. The standard curve was created by using known concentrations of sodium nitrite.

3.4. Cell Viability Assay

The cytotoxicity of the test substances (13) toward different cancer cells was determined as described previously [49,50,51]. Briefly, various concentrations of test compounds in DMSO were transferred to 96-well plates and incubated for 72 h at 37 °C in a CO2 incubator. The incubation was ended by the addition of trichloroacetic acid. The cells were then washed, air-dried, stained with SRB solution, and optical densities were determined at 515 nm using a ELx800NB Universal Microplate Reader, Bio-Tek Instruments. In each case, a zero-day control was performed by adding an equivalent number of cells to several wells, incubating at 37 °C for 30 min, and processing as described above. Percent cell survival was calculated using the formula:
Percent cell survival = (ODcells+tested compound − ODday 0)/ODcells+10% DMSO − ODday 0) × 100

3.5. Determination of PGE2

RAW 264.7 cells (1 × 10⁵ cells/well, 200 µL) were incubated in a 96-well culture plate in the presence of 5% CO2 at 37 °C for 24 h. The medium was changed to non-colored DMEM containing 5% FBS, and the cells were treated with various concentrations of compounds for 30 min followed by 1 μg/mL of LPS treatment for 24 h. Cell media were collected, diluted 18-times and used for measuring PGE2. Nunc-Immuno 96-well plates were coated with secondary antibody (goat anti-mouse IgG) affinity purified (Jackson Immuno Research Laboratories). Aliquots of cell media were added to the immune plate with primary PGE2 monoclonal antibody (Cayman Chemical) and a tracer PGE2-acetylcholinesterase (Cayman Chemical) and incubated overnight at room temperature in the dark. The next day, the wells were aspirated, washed, 200 µL of Elman’s reagent was added in each well, and incubated 2–5 h at 37 °C out of direct light until control wells reach an optical density 0.4–0.5. Gentle rotating/shaking was used to decrease the time required for color development. Absorbance was read at 412 nm [52]. The PGE2 concentration of each sample was calculated from a PGE2 standard curve (PGE2 from Cayman Chemical). The percent inhibition as a function of the inhibitor concentration was graphed to determine the IC50 values (concentration at which there was 50% inhibition).

3.6. COX-1 and COX-2 Inhibition Assays

Each COX reaction was initiated by adding 20 µL of arachidonic acid in Tris-HCl (pH 8.0) buffer to give a final concentration of 5 µM. The reaction was terminated after 2 min by adding 20 µL of 2.0 M HCl. The surrogate standard PGE2-d4 was added to correct for errors or degradation during sample handling and for variation in injection volume or instrument response during LC-MS/MS. After 30 min, PGE2 and its surrogate standard were extracted from each incubation mixture using 800 µL of hexane/ethyl acetate (50:50, v/v). The organic phase was removed, evaporated to dryness, and reconstituted in 100 µL methanol/water (50:50, v/v) for analysis using LC-MS/MS with an Applied Biosystems AP4000 triple quadrupole mass spectrometer as described previously [53,54]. The concentration of PGE2 in each sample was measured using LC-MS/MS, and the percent of COX inhibition by each test solution was determined by comparing the amount of PGE2 produced in the experiment with that produced in the negative control incubation. For IC50 value determination, 12 different concentrations of each inhibitor were assayed three times. The IC50 value of each inhibitor toward COX-1 or COX-2 was determined by plotting and analyzing the inhibition curve data using Graph Pad Prism 5 software [55]. The selectivity of each inhibitor was calculated as the ratio of the IC50 values (COX-1/COX-2) [53].

3.7. Cell Cycle Analysis

HL-60 cells (2 × 10⁵ cells/well) were treated with samples for 24 h. The media were discarded and nuclear isolation medium (4',6-diamidino-2-phenylindole, NIM-DAPI; Beckman Coulter) was added just before the measurement using a Cell Lab Quanta™ SC (Beckman Coulter) flow cytometer. NIM-DAPI-stained cells were analyzed after excitation. The distribution of cells in each phase of cell cycle was exhibited in a DNA histogram and percentage in subG1 was analyzed [56].

3.8. Detection of Apoptosis

HL-60 cells at a concentration of 2 × 10⁶ cells/mL were incubated with testing phenazines at different concentrations for 24 h. The cells were fixed with 1% paraformaldehyde in PBS and treated with ethanol to permiabilize the cells. Positive and negative control cells were provided already fixed. The DNA labeling reaction was carried out at 22–24 °C overnight. This assay was run on a Cell Lab Quanta™ SC, Beckman Coulter flow cytometer equipped with a 488 nm Argon laser as the light source. Propidium Iodide (total cellular DNA) and Fluorescein (apoptotic cells) were used. Propidium Iodide (PI) fluoresces at about 623 nm and Fluorescein at 520 nm when excited at 488 nm. Following the manufacturer’s instructions, an APO-BRDU™ Kit (Phoenix Flow Systems, Inc.) with a two color TUNEL (Terminal deoxynucleotide transferase dUTP Nick End Labeling) capability for labeling DNA breaks and total cellular DNA to detect apoptotic cells was used [57].

3.9. Real Time Quantitative PCR

RAW 264.7 cells (2 × 10⁵ cells/well) were treated with test samples and total RNA was isolated with TRIZOL® Reagent (Invitrogen). RNA concentrations were measured using Nanodrop (ND 1000 V.3.1.0) and partially dissolved RNA samples had an A260/280 ratio <1.6. cDNA was synthesized using a RT2 First Strand Kit (C-03, SA Biosciences) protocol. cDNA was used in quantitative real time PCRs, using fluorescent Power SyBR® Green PCR master mix (Applied Biosystems) and 7300 Real Time PCR System (Applied Biosystems). The results were derived from two independent RNA preparations employing identical triplicates in each analysis and quantified using GAPDH as the internal control, following the manufacturer’s instructions. The fluorescence intensity (Rn) corresponding to the cycle of threshold value (Ct) is used to quantitate a given mRNA, employing the GAPDH standard curve (Figure 3A). The equation Y = −3.9408 X + 31.791 was used to quantify the relative mRNA content, where Y represents the number of cycles corresponding to the Ct (i.e., fluorescence intensity for a given mRNA species), and X represents the log copy number (C0) from which the relative content of mRNA was quantitated. PCR was performed on the cDNA using the following sense and antisense primers (Invitrogen) [58,59].
GAPDH
Forward: 5′-ACA GTC AGC CGC ATC TTC-3′,
Reverse: 5′-GTC CTT CCA CGA TAC CA-3′.
β-Actin
Forward: 5′-GCT ACA GCT TCA CCA CCA CAG-3′,
Reverse: 5′-GGT CTT TAC GGA TGT CAA CGT C-3′.
COX-2
Forward: 5-′GAA GTC TTT GGT CTG GTG CCT G-3′,
Reverse: 5′-GTC TGC TGG TTT GGA ATA GTT GC-3’.
iNOS
Forward: 5′-GGA GCG AGT TGT GGA TTG TC-3′,
Reverse: 5′-GTG AGG GCT TGG CTG AGT GAG-3′.

3.10. Evaluation of Antioxidant Capacity

To evaluate antioxidant capacity, 2,2-diphenyl-1-picrylhydrazyl (DPPH) free radical scavenging was performed according to the method of Lee et al. [60]. Briefly, 95 µL of DPPH radical solution (316 µM) was added in a 96-well plate containing 5 µL of each compound dissolved in 100% DMSO, and incubated for 30 min at 37 °C. The absorbance of each well was measured at 515 nm using a microplate reader. The DPPH radical scavenging activity of each sample was evaluated by calculating % of inhibition as follows:
% inhibition = (1 − Asample/Acontrol) × 100

3.11. Statistical Analysis

The results were expressed as the mean ± SD of triplicate experiments. Statistically significant values were compared using Student-Newman-Keuls and p-values less than 0.05 were considered statistically significant.

4. Conclusions

Natural products have proven to be a useful source of cancer therapeutic and chemopreventive agents. Thus far, terrestrial plants have been most widely studied, with the marine environment remaining largely unexplored. In previous studies, the chemotherapeutic potential of lavanducyanin (3) was investigated [28,29,30,31]. We now report the ability of this substance to inhibit the activity of NFκB, COX-1 and COX-2, as well as the production of NO and PGE2. In addition, and perhaps as a consequence, cellular apoptosis is induced.
Beyond lavanducyanin, two new brominated terpenoid phenazines are reported along with their corresponding biological activity. Consistent with previous results [23], bromination at position-2 (phenazine 1) enhanced NFκB inhibitory activity by approximately 4-fold. This did not correlate with a greater reduction of NO or PGE2 production, but the compound did appear to induce apoptosis with greater efficacy, and inhibition of the catalytic activity of COX-2 was enhanced nearly 10-fold.
On the other hand, potent (sub-µM) inhibition of PGE2 production was observed with phenazine 2 and lavanducyanin (3). Additional definition of the mechanism of this response would be of interest since a strong correlation with the other activities monitored in this report was not apparent. This could be unique. In addition, the compounds are of interest due to the potential of modulating multiple targets. Although activity is generally not highly potent, this is not a prerequisite for effective chemopreventive activity. Another interesting aspect is the disparate activities mediated by structurally similar molecules, suggesting evaluation of a mixture could yield a better response with fewer side-effects than a single compound.

Acknowledgements

This work was supported by program project grant P01 CA48112 (to JP) and CA44848 (to WF) awarded by the National Cancer Institute.

References

  1. Tergaonkar, V. NFκB pathway: A good signaling paradigm and therapeutic target. Intern. J. Biochem. Cell Biol. 2006, 38, 1647–1653. [Google Scholar]
  2. Aggarwal, B.B.; Sethi, G.; Nair, A.; Ichikawa, H. Nuclear Factor-κB a holy grail in cancer prevention and therapy. Curr. Sign. Transd. Ther. 2006, 1, 25–52. [Google Scholar]
  3. Melisi, D.; Chiao, P.J. NF-κB as a target for cancer therapy. Expert Opin. Ther. Targets 2007, 11, 133–144. [Google Scholar]
  4. Kim, H.J.; Hawke, N.; Baldwin, A.S. NF-κB and IKK as therapeutic targets in cancer. Cell Death Differ. 2006, 13, 738–747. [Google Scholar]
  5. Pikarsky, E.; Ben-Neriah, Y. NF-κB inhibition: A double-edged sword in cancer? Eur. J. Cancer 2006, 42, 779–784. [Google Scholar] [CrossRef]
  6. Luqman, S.; Pezzuto, J.M. NFκB: A promising target for natural products in cancer chemoprevention. Phytother. Res. 2010, 24, 949–963. [Google Scholar]
  7. Yamamoto, Y.; Gaynor, R.B. Therapeutic potential of inhibition of the NF-κB pathway in the treatment of inflammation and cancer. J. Clin. Invest. 2001, 107, 135–142. [Google Scholar]
  8. Gonda, T.A.; Tu, S.; Wang, T.C. Chronic inflammation, the tumor microenvironment and carcinogenesis. Cell Cycle 2009, 8, 2005–2013. [Google Scholar]
  9. Murakami, A. Chemoprevention with phytochemicals targeting inducible nitric oxide synthase. Forum Nutr. 2009, 61, 193–203. [Google Scholar]
  10. Aktan, F. iNOS-mediated nitric oxide production and its regulation. Life Sci. 2004, 75, 639–653. [Google Scholar]
  11. Inoue, J.; Gohda, J.; Akiyama, T.; Semba, K. NF-κB activation in development and progression of cancer. Cancer Sci. 2007, 98, 268–274. [Google Scholar]
  12. Aggarwal, B.B.; Shishodia, S.; Sandur, S.K.; Pandey, M.K.; Sethi, G. Inflammation and cancer: How hot is the link? Biochem. Pharmacol. 2006, 72, 1605–1621. [Google Scholar]
  13. Surh, Y.J.; Kundu, J.K. Cancer preventive phytochemicals as speed breakers in inflammatory signaling involved in aberrant COX-2 expression. Curr. Cancer Drug Targets 2007, 7, 447–458. [Google Scholar]
  14. Kundu, J.K.; Surh, Y.J. Inflammation: Gearing the journey to cancer. Mutat. Res. 2008, 659, 15–30. [Google Scholar]
  15. Cuendet, M.; Pezzuto, J.M. The role of cyclooxygenase and lipoxygenase in cancer chemoprevention. Drug Metabol. Drug Interact. 2001, 17, 109–157. [Google Scholar]
  16. Mann, J.R.; DuBois, R.N. Cyclooxygenase-2 and gastrointestinal cancer. Cancer J. 2004, 10, 145–152. [Google Scholar]
  17. King, K.L.; Cidlowski, J.A. Cell cycle regulation and apoptosis. Annu. Rev. Physiol. 1998, 60, 601–617. [Google Scholar]
  18. Kerr, J.F.; Winterford, C.M.; Harmon, B.V. Apoptosis. Its significance in cancer and cancer therapy. Cancer 1994, 73, 2013–2026. [Google Scholar] [CrossRef]
  19. Kam, P.C.A.; Ferch, N.I. Apoptosis: Mechanisms and clinical implications. Anesthesia 2000, 55, 1081–1093. [Google Scholar]
  20. Price-Whelan, A.; Dietrich, L.E.; Newman, D.K. Rethinking “secondary” metabolism: Physiological roles for phenazine antibiotics. Nat. Chem. Biol. 2006, 2, 71–78. [Google Scholar]
  21. Li, D.; Wang, F.; Xiao, X.; Zeng, X.; Gu, Q.Q.; Zhu, W. A new cytotoxic phenazine derivative from a deep sea bacterium Bacillus sp. Arch. Pharm. Res. 2007, 30, 552–555. [Google Scholar]
  22. Mitova, M.I.; Lang, G.; Wiese, J.; Imhoff, J.F. Subinhibitory concentrations of antibiotics induce phenazine production in a marine Streptomyces sp. J. Nat. Prod. 2008, 71, 824–827. [Google Scholar]
  23. Conda-Sheridan, M.; Marler, L.; Park, E.-J.; Kondratyuk, T.P.; Jermihov, K.; Mesecar, A.D.; Pezzuto, J.M.; Asolkar, R.N.; Fenical, W.; Cushman, M. Potential chemopreventive agents based on the structure of the lead compound 2-bromo-1-hydroxyphenazine, isolated from Streptomyces species, strain CNS284. J. Med. Chem. 2010, 53, 8688–8699. [Google Scholar]
  24. Laursen, J.; Nielsen, J. Phenazine natural products: Biosynthesis, synthetic analogues, and biological activity. Chem. Rev. 2004, 104, 1663–1685. [Google Scholar]
  25. Kerr, J.R. Phenazine pigments: Antibiotics and virulence factors. Infect. Dis. Rev. 2000, 2, 184–194. [Google Scholar]
  26. Shin-Ya, K.; Shimizu, S.; Kunigami, T.; Furihata, T.; Hayakawa, Y.; Seto, H. Novel neuronal cell protecting substances, aestivophoenins A and B, produced by Streptomyces purpeofuscus. J. Antibiot. 1995, 48, 1378–1381. [Google Scholar]
  27. Marler, L.; Conda-Sheridan, M.; Cinelli, M.A.; Morrell, A.E.; Cushman, M.; Chen, L.; Huang, K.; van Breemen, R.B.; Pezzuto, J.M. Cancer chemopreventive potential of aromathecins and phenazines, novel natural product derivatives. Anticancer Res. 2010, 30, 4873–4882. [Google Scholar]
  28. Imai, S.; Furihata, K.; Hayakawa, Y.; Noguchi, T.; Seto, H. Lavanducyanin, a new antitumor substance produced by Streptomyces sp. J. Antibiot. 1989, 42, 1196–1198. [Google Scholar]
  29. Imai, S.; Noguchi, T.; Seto, H. Studies on cell growth stimulating substances of low molecular weight. Part 2. Exfoliazone and lavanducyanin, potent growth promoting substances of rat liver cell line, RLN-8, produced by Streptomyces exfoliatus and Streptomyces aeriouvifer. J. Antibiot. 1993, 46, 1232–1238. [Google Scholar]
  30. Matsumoto, M.; Seto, H. Stimulation of mammalian cell proliferation by lavanducyanin. J. Antibiot. 1991, 44, 1471–1473. [Google Scholar]
  31. Nakayama, O.; Arakawa, H.; Yagi, M.; Tanaka, M.; Kiyoto, S.; Okuhara, M.; Kohsaka, M. WS-9659 A and B, novel testosterone 5 alpha-reductase inhibitors isolated from a Streptomyces. III. Biological characteristics and pharmacological characteristics. J. Antibiot. 1989, 42, 1235–1240. [Google Scholar]
  32. Asolkar, R.; Jensen, P.R.; Fenical, W. Marinophenazines, brominated antitumor-antibiotics from a marine bacterium related to the genus Streptomyces. J. Nat. Prod. submitted for publication.
  33. Maiti, A.; Cuendet, M.; Kondratyuk, T.; Croy, V.L.; Pezzuto, J.M.; Cushman, M. Synthesis and cancer chemopreventive activity of zapotin, a natural product from Casimiroa edulis. J. Med. Chem. 2007, 50, 350–355. [Google Scholar]
  34. Asolkar, R.N.; Freel, K.C.; Jensen, P.R.; Fenical, W.; Kondratyuk, T.P.; Park, E.J.; Pezzuto, J.M. Arenamides A–C, cytotoxic NF-κB inhibitors from the marine actinomycete Salinispora arenicola. J. Nat. Prod. 2009, 72, 396–402. [Google Scholar]
  35. Choi, I.K.; Shin, H.J.; Lee, H.S.; Kwon, H.J. Streptochlorin, a marine natural product, inhibits NF-κB activation and suppresses angiogenesis in vitro. J Microb. Biotechnol. 2007, 17, 1338–1343. [Google Scholar]
  36. Folmer, F.; Jaspars, M.; Dicato, M.; Diederich, M. Marine natural products as targeted modulators of the transcription factor NF-κB. Biochem. Pharmacol. 2008, 75, 603–617. [Google Scholar]
  37. Ohsugi, T.; Horie1, R.; Kumasaka, T.; Ishida, A.; Ishida, T.; Yamaguchi, K.; Watanabe, T.; Umezawa, K.; Urano, T. In vivo antitumor activity of the NF-kB inhibitor dehydroxymethylepoxyquinomicin in a mouse model of adult T-cell leukemia. Carcinogenesis 2005, 26, 1382–1388. [Google Scholar]
  38. Chopra, P.; Bajpai, M.; Dastidar, S.G.; Ray, A. Development of a cell death-based method for the screening of nuclear factor-κB inhibitors. J. Immunol. Meth. 2008, 335, 126–131. [Google Scholar]
  39. Frydrych, I.; Mlejnek, P. Serine protease inhibitors N-tosyl-L-lysinyl-chloromethylketone (TLCK) and N-tosyl-L-phenylalaninyl-chloromethylketone (TPCK) are potent inhibitors of activated caspase proteases. J. Cell. Biochem. 2008, 103, 1646–1656. [Google Scholar]
  40. García, M.G.; Alaniz, L.; Lopes, E.C.; Blanco, G.; Hajos, S.E.; Alvarez, E. Inhibition of NF-κB activity by BAY 11-7082 increases apoptosis in multidrug resistant leukemic T-cell lines. Leuk. Res. 2005, 29, 1425–1434. [Google Scholar]
  41. Chung, H.T.; Choi, B.M.; Kwon, Y.G.; Kim, Y.M. Interactive relations between nitric oxide (NO) and carbon monoxide (CO): Heme oxygenase-1/CO pathway is a key modulator in NO-mediated antiapoptosis and anti-inflammation. Meth. Enzymol. 2008, 441, 329–338. [Google Scholar]
  42. Hofseth, L.J.; Hussain, S.P.; Wogan, G.N.; Harris, C.C. Nitric oxide in cancer and chemoprevention. Free Rad. Biol. Med. 2003, 34, 955–968. [Google Scholar]
  43. Bhat, K.P.; Pezzuto, J.M. Cancer chemopreventive activity of resveratrol. Ann. NY Acad. Sci. 2002, 957, 210–229. [Google Scholar]
  44. Santini, M.T.; Rainaldi, G.; Indovina, P.L. Apoptosis, cell adhesion and the extracellular matrix in the three-dimensional growth of multicellular tumor spheroids. Crit. Rev. Oncol. Hematol. 2000, 36, 75–87. [Google Scholar]
  45. Weigert, A.; Jennewein, C.; Brune, B. The liaison between apoptotic cells and macrophages—the end programs the beginning. Biol. Chem. 2009, 390, 379–390. [Google Scholar]
  46. Hoshino, J.; Park, E.J.; Kondratyuk, T.P.; Marler, L.; Pezzuto, J.M.; van Breemen, R.B.; Mo, S.; Li, Y.; Cushman, M. Selective synthesis and biological evaluation of sulfate-conjugated resveratrol metabolites. J. Med. Chem. 2010, 53, 5033–5043. [Google Scholar]
  47. Kim, Y.; Min, H.Y.; Park, H.J.; Lee, E.J.; Park, E.J.; Hwang, H.J.; Jin, C.; Lee, Y.S.; Lee, S.K. Suppressive effects of nitric oxide production and inducible nitric oxide synthase (iNOS) gene expression by Calystegia soldanella methanol extract on lipopolysaccharide-activated RAW 264.7 cells. Eur. J. Cancer Prev. 2004, 13, 419–424. [Google Scholar] [CrossRef]
  48. Park, E.-J.; Cheenpracha, S.; Chang, L.C.; Kondratyuk, T.P.; Pezzuto, J.M. Inhibition of lipopolysaccharide-induced cyclooxygenase-2 and inducible nitric oxide synthase expression by 4-[(2'-O-acetyl-α-L-rhamnosyloxy)benzyl]isothiocyanate from Moringa oleifera. Nutr. Cancer 2011, 63, 971–982. [Google Scholar]
  49. Skehan, P.; Storeng, R.; Scudiero, D.; Monks, A.; McMahon, J.; Vistica, D.; Warren, J.T.; Bodesch, H.; Kenney, S.; Boyd, M.R. New colorimetric cytotoxicity assay for anticancer-drug screening. J. Nat. Cancer Inst. 1990, 82, 1107–1112. [Google Scholar]
  50. You, M.; Wickramaratne, D.B.; Silva, G.L.; Chai, H.; Chagwedera, T.E.; Farnsworth, N.R.; Cordell, G.A.; Kinghorn, A.D.; Pezzuto, J.M. Roemerine, an aporphine alkaloid from Annona senegalensis that reverses the multidrug-resistance phenotype with cultured cells. J. Nat. Prod. 1995, 58, 598–604. [Google Scholar]
  51. Mi, Q.; Cui, B.; Silva, G.L.; Lantvit, D.; Lim, E.; Chai, H.; You, M.; Hollingshead, M.G.; Mayo, J.G.; Kinghorn, A.D.; et al. Pervilleine A, a novel tropane alkaloid that reverses the multidrug-resistance phenotype. Cancer Res. 2001, 61, 4030–4037. [Google Scholar]
  52. Cuendet, M.; Mesecar, A.D.; DeWitt, D.L.; Pezzuto, J.M. An ELISA method to measure inhibition of the COX enzymes. Nat. Protoc. 2006, 1, 1915–1921. [Google Scholar]
  53. Cao, H.; Yu, R.; Tao, Y.; Nikolic, D.; van Breemen, R.B. Measurement of cyclooxygenase inhibition using liquid chromatography-tandem mass spectrometry. J. Pharm. Biomed. Anal. 2011, 54, 230–235. [Google Scholar]
  54. Yu, R.; Xiao, L.; Zhao, G.; Christman, J.W.; van Breemen, R.B. Competitive enzymatic interactions determine the relative amounts of prostaglandins E2 and D2. J. Pharmacol. Exp. Ther. 2011, 339, 716–725. [Google Scholar]
  55. Prism 5 for Mac OSX, version 5.0c, GraphPad Software, Inc.: Mountain View, CA, USA, 2009.
  56. Krishna, A.; Cabana, R. Flow cytometric analysis of electronic nuclear volume and DNA content in normal mouse tissues. Cell Cycle 2004, 3, 380–383. [Google Scholar]
  57. Li, X.; Darzynkiewicz, Z. Labeling DNA strand breaks with BrdUTP. Detection of apoptosis and cell proliferation. Cell Prolif. 1995, 28, 572–579. [Google Scholar]
  58. Zhao, L.; Tao, J.-Y.; Zhang, S.-L.; Jin, F.; Pang, R.; Dong, J.-H. N-butanol extract from Melilotus Suaveolens Ledeb affects pro- and anti-inflammatory cytokines and mediators. Evid. Based Complement Alternat. Med. 2010, 7, 97–106. [Google Scholar]
  59. Tsai, S.-H.; Lin-Shiau, S.-Y.; Lin, J.-K. Suppression of nitric oxide synthase and the down-regulation of the actvation of NFκB in macrophages by resveratrol. Br. J. Pharm. 1999, 126, 673–680. [Google Scholar]
  60. Lee, S.K.; Mbwambo, Z.H.; Chung, H.S.; Luyengi, L.; Gamez, E.J.C.; Mehta, R.G.; Kinghorn, A.D.; Pezzuto, J.M. Evaluation of the antioxidant potential of natural products. Comb. Chem. High Throughput Screen. 1998, 1, 35–46. [Google Scholar]
  • Samples Availability: Available from the authors.

