Chemical Diversity as a Function of Temperature in Six Northern Diatom Species


Abstract
:1. Introduction
2. Results and Discussion

| Species | Strain ID | Duration (days) 0.5/8.5 °C | Origin |
|---|---|---|---|
| Attheya longicornis (Al) Crawford and Gardner | AMB20.1 | 14/10 | North Norwegian coast (69.5) |
| Chaetoceros socialis (Cs) Lauder | AMB80 | 21/10 | Barents Sea (74.5) |
| Chaetoceros furcellatus (Cf) Bailey | AMB61 | 10/10 | Barents Sea (77.8) |
| Skeletonema marinoi (Sm) Sarno and Zingone | AMB39 | 17/10 | North Norwegian coast (69.5) |
| Thalassiosira gravida (Tg) Cleve | AMB85 | 10/10 | Ramfjord (69.4) |
| Porosira glacialis (Pg) (Grunow) Jørgensen | AMB49.2D | 10/10 | Tromsøysund (69.4) |
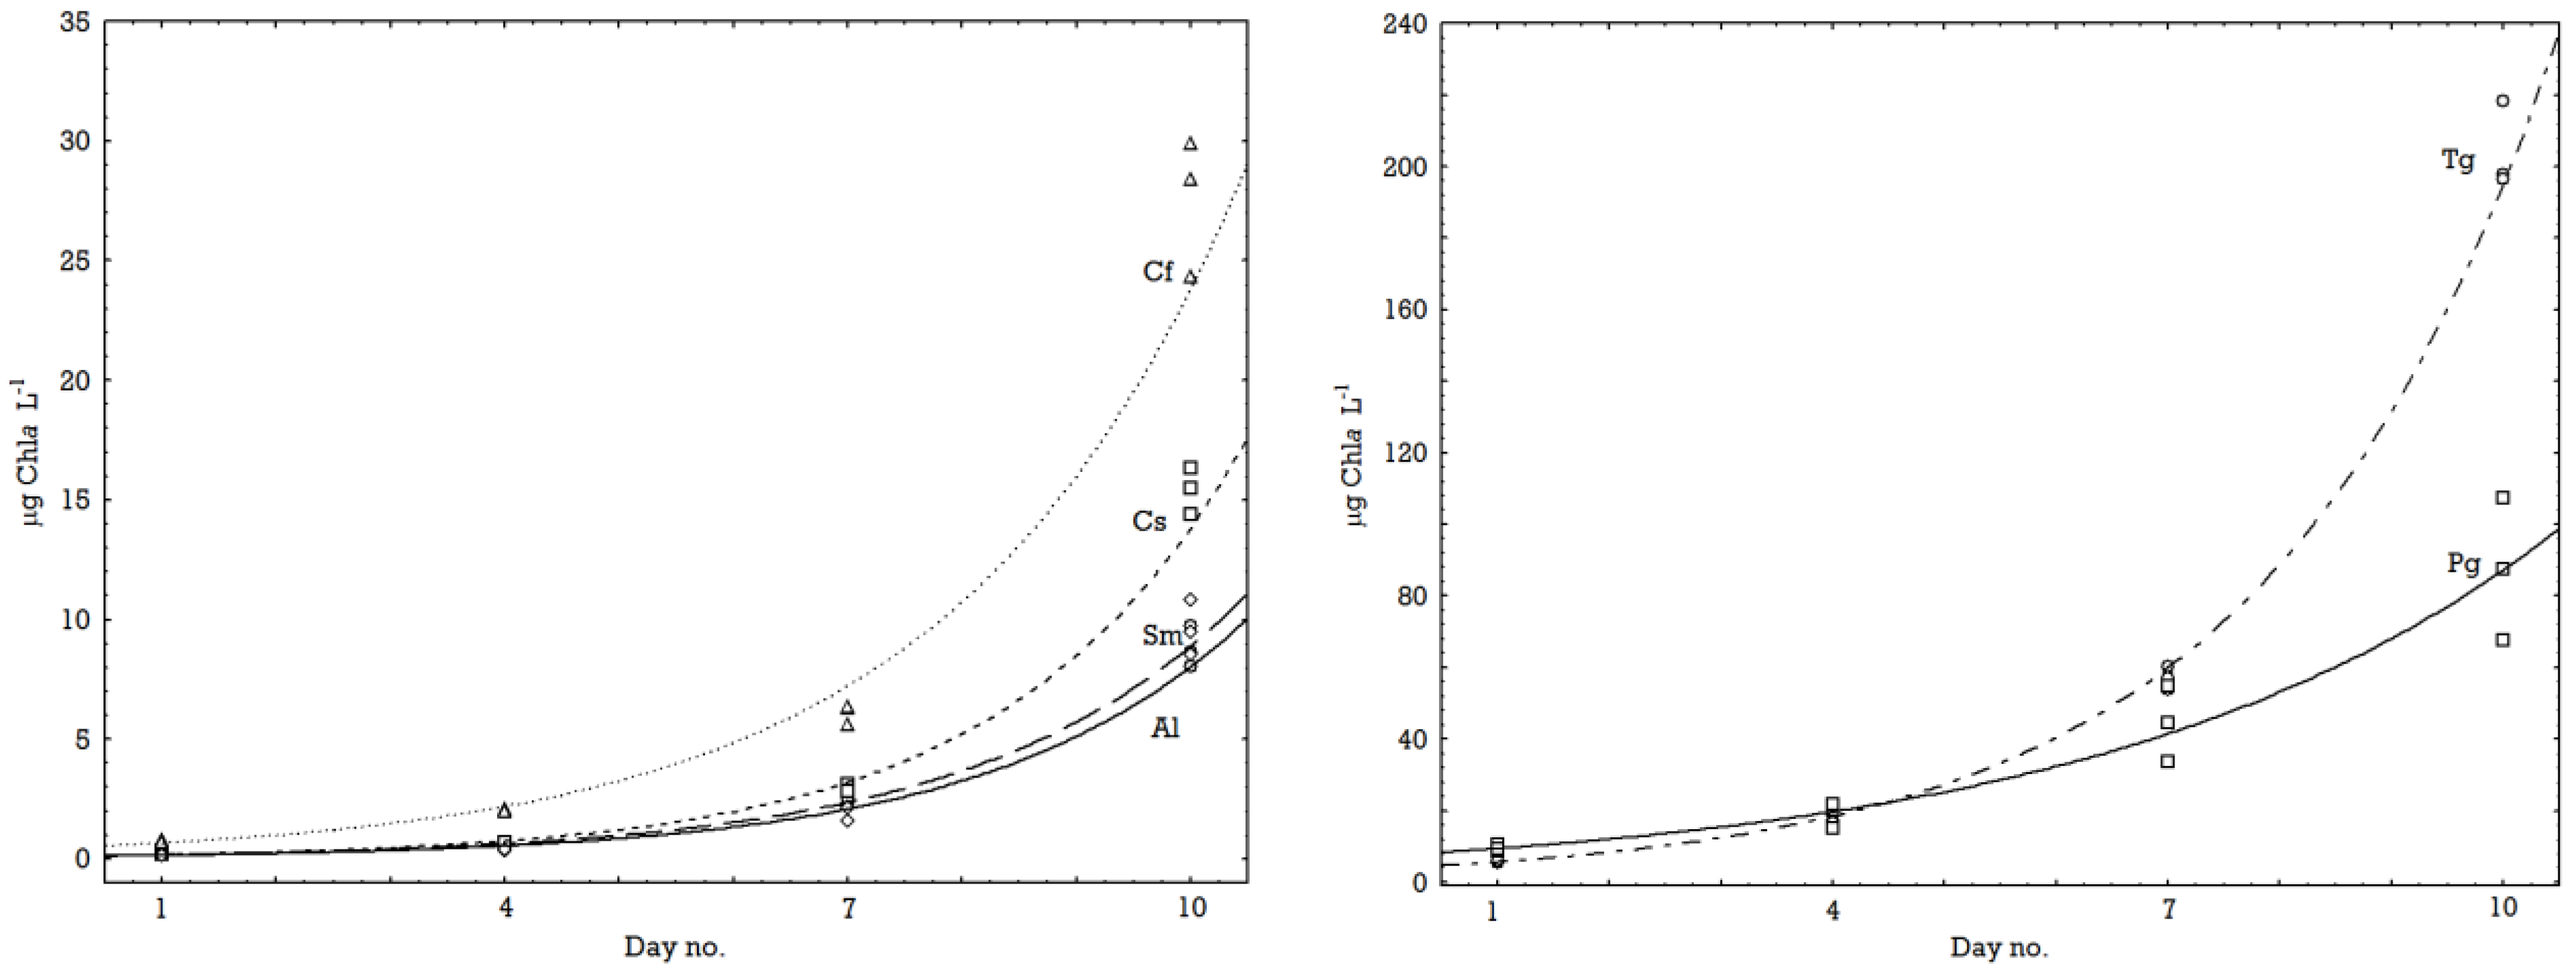
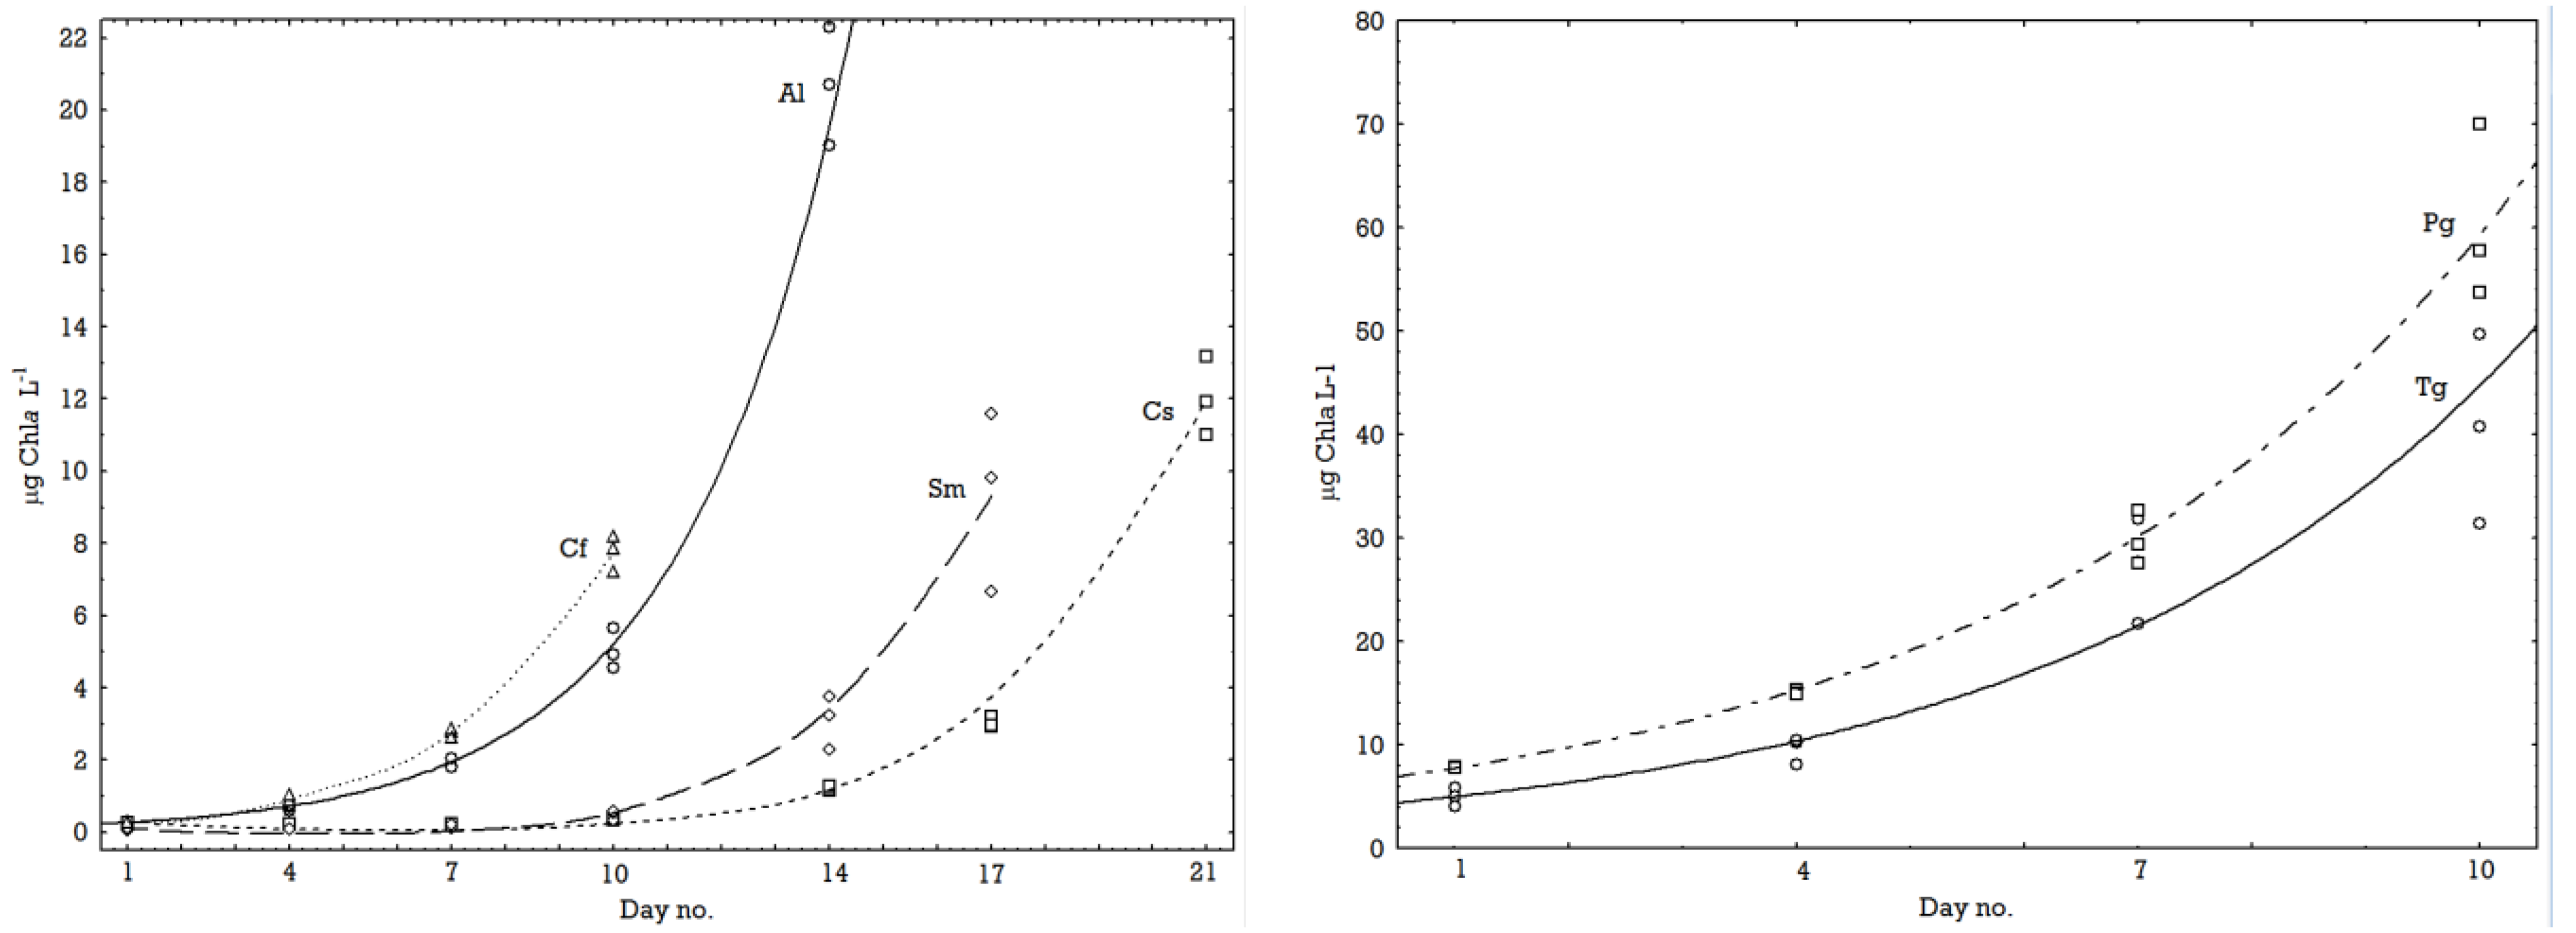
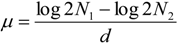
2.1. Growth Rates
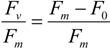
| °C | Species (Acronyms) | µ-Chla | Fv/Fm start | Fv/Fm stop |
|---|---|---|---|---|
| 0.5 | Attheya longicornis (Al) | 0.44 | 0.598 | 0.674 |
| 0.5 | Chaetoceros socialis (Cs) | 0.27 | 0.452 | 0.683 |
| 0.5 | Chaetoceros furcellatus (Cf) | 0.48 | 0.631 | 0.720 |
| 0.5 | Skeletonema marinoi (Sm) | 0.39 | 0.489 | 0.694 |
| 0.5 | Thalassiosira gravida (Tg) | 0.30 | 0.645 | 0.711 |
| 0.5 | Porosira glacialis (Pg) | 0.29 | 0.714 | 0.734 |
| 0.5 | Mean for temperature | 0.36 | 0.588 | 0.703 |
| 8.5 | Attheya longicornis (Al) | 0.56 | 0.736 | 0.674 |
| 8.5 | Chaetoceros socialis (Cs) | 0.62 | 0.627 | 0.738 |
| 8.5 | Chaetoceros furcellatus (Cf) | 0.52 | 0.704 | 0.736 |
| 8.5 | Skeletonema marinoi (Sm) | 0.57 | 0.445 | 0.692 |
| 8.5 | Thalassiosira gravida (Tg) | 0.51 | 0.670 | 0.715 |
| 8.5 | Porosira glacialis (Pg) | 0.32 | 0.711 | 0.711 |
| 8.5 | Mean for temperature | 0.52 | 0.649 | 0.711 |

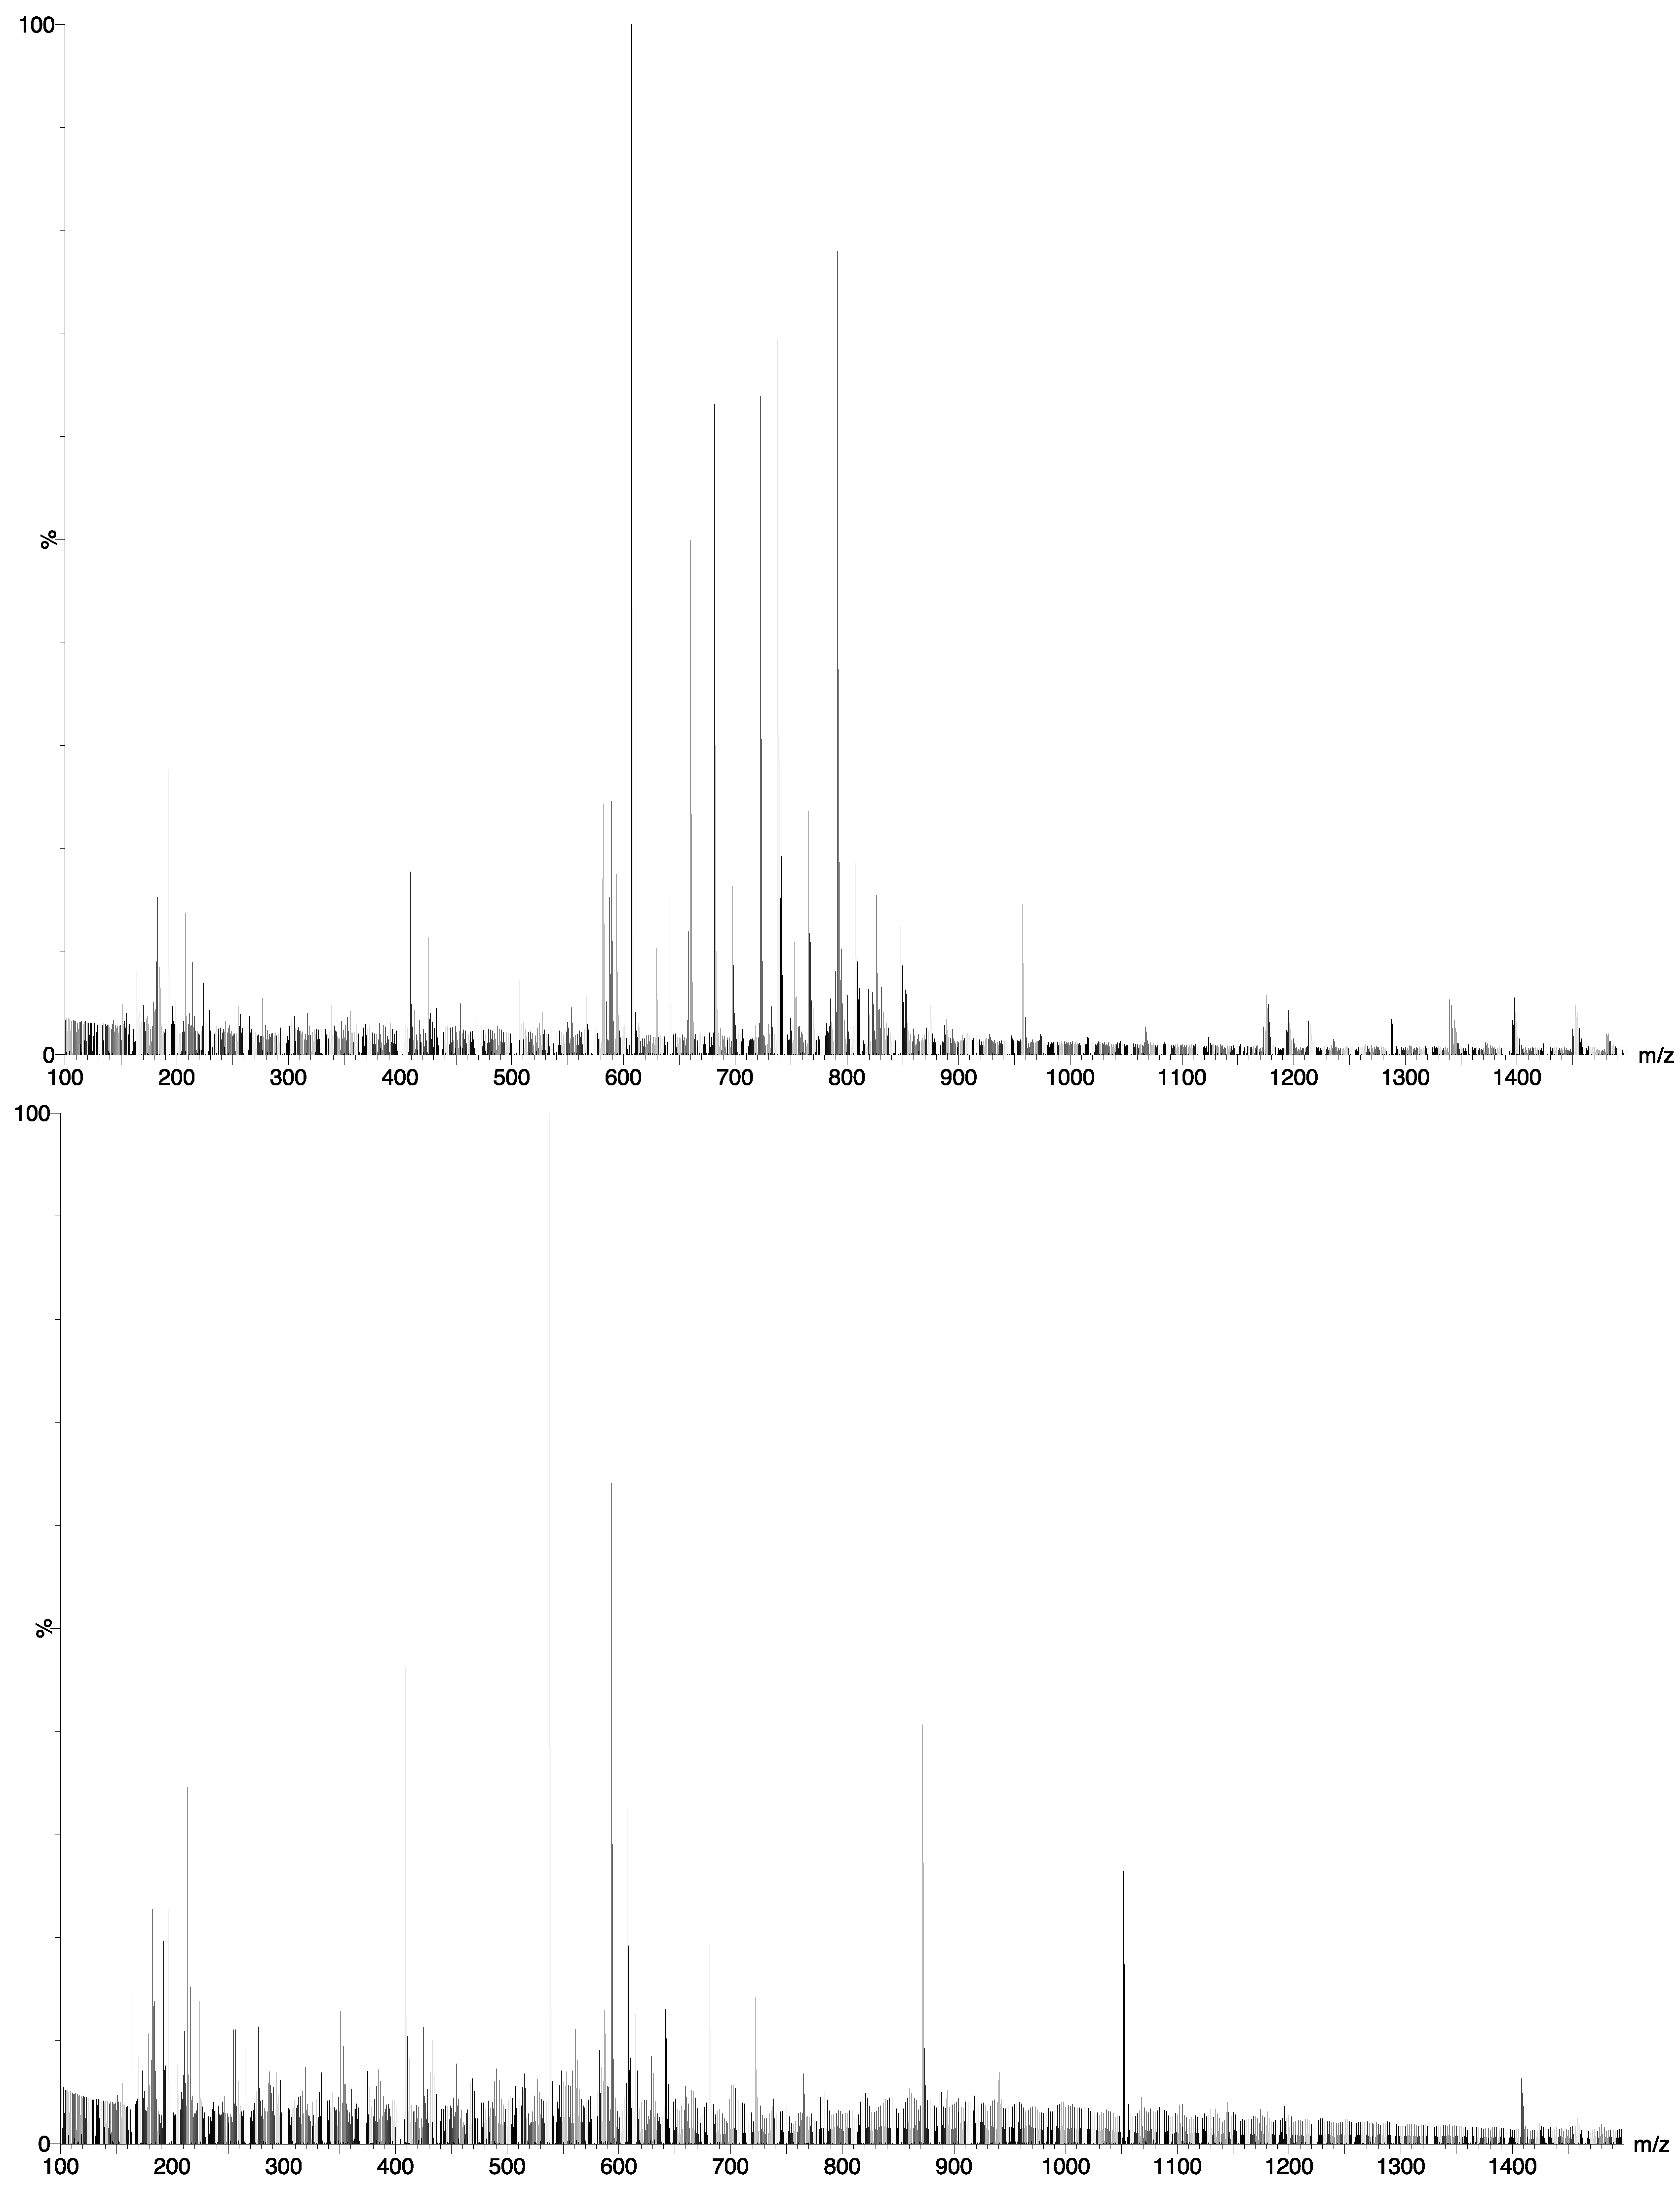
2.2. Chemical Composition

- I.
- When we tested the number of similar markers within one species (P. glacialis) for each temperature separately the mean value was ca. 90% (Table 3).
- II.
- When the markers from each temperature (all species included) were tested against each other (independent students t-test), the two groups proved statistically different at p-level 0.00013 (mean 0.5 °C = 46%, 8.5 °C = 55%).
- III.
- Tests where replicates from one temperature were tested against replicates from the other temperature for each species separately showed a mean similarity in markers of ca. 60%. The species that differed most in detected markers were P. glacialis and C. furcellatus (both 31%) and C. socialis (52%). The species that had the highest similarity in markers were S. marinoi (92%), A. longicornis (81%) and T. gravida (74%) (Table 3).
- IV.
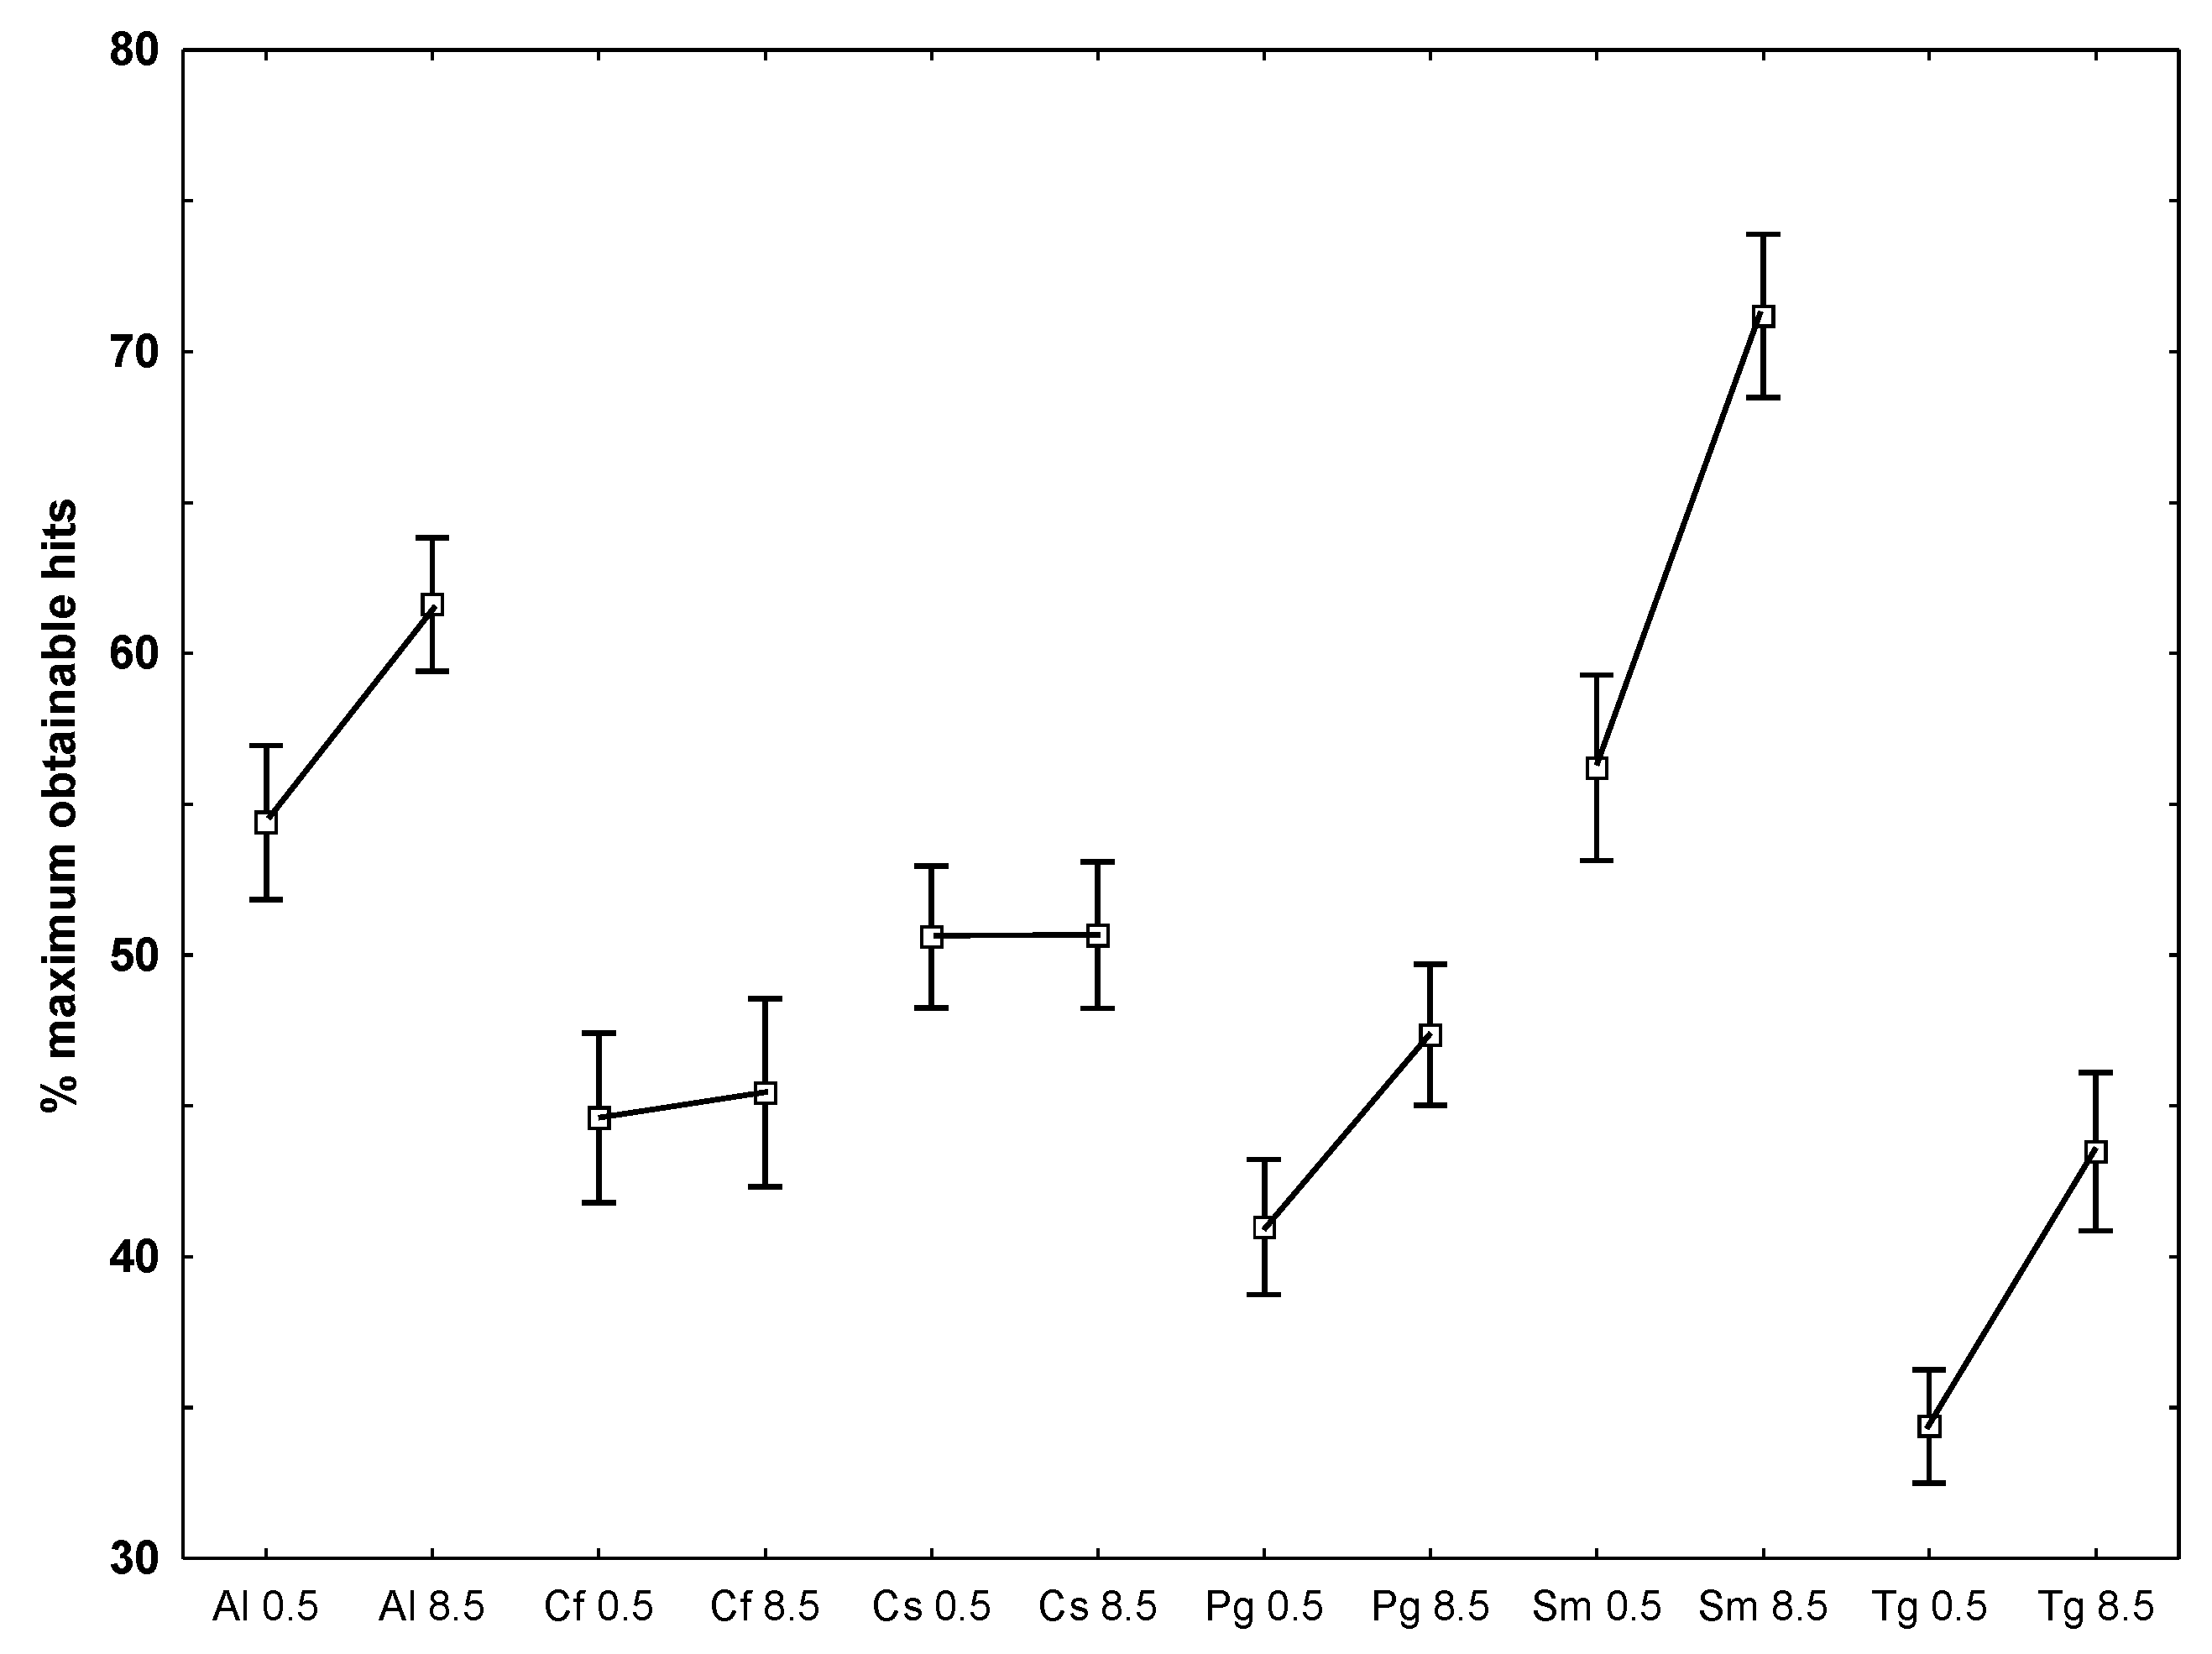
- To examine which of the temperatures that caused the largest deviation from the optimal obtainable 90% similarity, the number of hits for each species at each temperature against all other species at both temperatures, it appeared that lower hit rates at the lowest temperature was present for A. longicornis, P. glacialis, S. marinoi and T. gravida while the two Chaetoceros species did not differ between temperatures (Figure 4).
| °C | Species | n | % of maximum obtainable hit number (SE in %) |
|---|---|---|---|
| 0.5 | Porosira glacialis (Pg) | 36 | 91.3 (2.1) |
| 8.5 | Porosira glacialis (Pg) | 36 | 88.4 (2.9) |
| 0.5 vs. 8.5 | Attheya longicornis (Al) | 9 | 81 (2.7) |
| 0.5 vs. 8.5 | Chaetoceros socialis (Sc) | 9 | 41 (3.3) |
| 0.5 vs. 8.5 | Chaetoceros furcellatus (Cf) | 9 | 31 (2.2) |
| 0.5 vs. 8.5 | Skeletonema marinoi (Sm) | 9 | 92 (4.7) |
| 0.5 vs. 8.5 | Thalassiosira gravida (Tg) | 9 | 74 (3.1) |
| 0.5 vs. 8.5 | Porosira glacialis (Pg) | 9 | 31 (6.5) |

3. Experimental Section
3.1. Cultivation of Diatom Samples
3.2. Extraction and Preparation for Mass Spectrometry (MS)
3.3. Flow-Injection Electrospray Mass Spectrometry (FIE-MS)
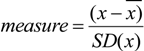
3.4. MS-Data Analysis
4. Conclusions
Acknowledgments
References
- Colwell, R.R. Biotechnology in the marine sciences. Science 1983, 222, 19–24. [Google Scholar]
- Rogers, L.J.; Gallon, J.R. Biochemistry of the Algae and Cyanobacteria; Academic Press: London, UK, 1988; Volume 28. [Google Scholar]
- Stewart, W.D.P. Algal Physiology and Biochemistry; Blackwell: Oxford, UK, 1974. [Google Scholar]
- Redfield, A.C. On the Proportions of Organic Derivations in Sea Water and Their Relation to Composition of Plankton. In James Johnson Memorial Volume; Daniel, R.J., Ed.; Liverpool University Press: Liverpool, UK, 1934; pp. 176–192. [Google Scholar]
- Sarthou, G.; Timmermans, K.R.; Blain, S.; Treguer, P. Growth physiology and fate of diatoms in the ocean: A review. J. Sea Res. 2005, 53, 25–42. [Google Scholar]
- Ho, T.Y.; Quigg, A.; Finkel, Z.V.; Milligan, A.J.; Wyman, K.; Falkowski, P.G.; Morel, F.M.M. The elemental composition of some marine phytoplankton. J. Phycol. 2003, 39, 1145–1159. [Google Scholar]
- Bolling, C.; Fiehn, O. Metabolite profiling of Chlamydomonas reinhardtii under nutrient deprivation. Plant Physiol. 2005, 139, 1995–2005. [Google Scholar] [CrossRef]
- Barofsky, A.; Vidoudez, C.; Pohnert, G. Metabolic profiling reveals growth stage variability in diatom exudates. Limnol. Oceanogr. Meth. 2009, 7, 382–390. [Google Scholar] [CrossRef]
- Bowler, C.; Allen, A.E.; Badger, J.H.; Grimwood, J.; Jabbari, K.; Kuo, A.; Maheswari, U.; Martens, C.; Maumus, F.; Otillar, R.P.; et al. The Phaeodactylum genome reveals the evolutionary history of diatom genomes. Nature 2008, 456, 239–244. [Google Scholar]
- Wood, A.M.; Leatham, T.; Manhart, J.R.; Mccourt, R.M. The species concept in phytoplankton ecology. J. Phycol. 1992, 28, 723–729. [Google Scholar]
- Lakeman, M.B.; von Dassow, P.; Cattolico, R.A. The strain concept in phytoplankton ecology. Harmful Algae 2009, 8, 746–758. [Google Scholar] [CrossRef]
- Durbin, E.G. Studies on autecology of marine diatom Thalassiosira nordenskioeldii. II. Influence of cell-size on growth-rate, and carbon, nitrogen, Chlorophyll-a and silica content. J. Phycol. 1977, 13, 150–155. [Google Scholar]
- Raven, J.A.; Geider, R.J. Temperature and algal growth. New Phytol. 1988, 110, 441–461. [Google Scholar] [CrossRef]
- Montagnes, D.J.S.; Franklin, D.J. Effect of temperature on diatom volume, growth rate, and carbon and nitrogen content: Reconsidering some paradigms. Limnol. Oceanogr. 2001, 46, 2008–2018. [Google Scholar] [CrossRef]
- Kates, M.; Volcani, B.E. Lipid components of diatoms. Biochim. Biophys. Acta 1966, 116, 264–278. [Google Scholar]
- Vidoudez, C.; Pohnert, G. Comparative metabolomics of the diatom Skeletonema marinoi in different growth phases. Metabolomics 2012, 8, 654–669. [Google Scholar] [CrossRef]
- Scholz, B.; Liebezeit, G. Compatible solutes and fatty acid composition of five marine intertidal microphytobenthic Wadden Sea diatoms exposed to different temperature regimes. Diatom Res. 2013, 28. [Google Scholar] [CrossRef]
- Huseby, S.; Degerlund, M.; Zingone, A.; Hansen, E. Metabolic fingerprinting reveals differences between northern and southern strains of the cryptic diatom Chaetoceros socialis. Eur. J. Phycol. 2012, 47, 480–489. [Google Scholar] [CrossRef]
- Sasso, S.; Pohnert, G.; Lohr, M.; Mittag, M.; Hertweck, C. Microalgae in the postgenomic era: A blooming reservoir for new natural products. FEMS Microbiol. Rev. 2012, 36, 761–785. [Google Scholar] [CrossRef]
- Degerlund, M.; Huseby, S.; Zingone, A.; Sarno, D.; Landfald, B. Functional diversity in cryptic species of Chaetoceros socialis Lauder (Bacillariophyceae). J. Plankton Res. 2012, 34, 416–431. [Google Scholar] [CrossRef]
- Sorhannus, U.; Fox, M.G. Phylogenetic analyses of a combined data set suggest that the Attheya lineage is the closest living relative of the pennate diatoms (Bacillariophyceae). Protist 2012, 163, 252–262. [Google Scholar] [CrossRef]
- Rampen, S.W.; Schouten, S.; Panoto, F.E.; Brink, M.; Andersen, R.A.; Muyzer, G.; Abbas, B.; Damste, J.S.S. Phylogenetic position of Attheya longicornis and Attheya septentrionalis (Bacillariophyta). J. Phycol. 2009, 45, 444–453. [Google Scholar] [CrossRef]
- Gilstad, M.; Sakshaug, E. Growth-Rates of 10 diatom species from the Barents Sea at different irradiances and day lengths. Mar. Ecol. Prog. Ser. 1990, 64, 169–173. [Google Scholar] [CrossRef]
- Costello, J.C.; Chisholm, S.W. The influence of cell size on the growth rate of Thalassiosira weissflogii. J. Plankton Res. 1981, 3, 415–419. [Google Scholar] [CrossRef]
- Parkhill, J.P.; Maillet, G.; Cullen, J.J. Fluorescence-based maximal quantum yield for PSII as a diagnostic of nutrient stress. J. Phycol. 2001, 37, 517–529. [Google Scholar] [CrossRef]
- Bissinger, J.E.; Montagnes, D.J.S.; Sharples, J.; Atkinson, D. Predicting marine phytoplankton maximum growth rates from temperature: Improving on the Eppley curve using quantile regression. Limnol. Oceanogr. 2008, 53, 487–493. [Google Scholar]
- Eppley, R.W. Temperature and phytoplankton growth in sea. Fish. Bull. Nat. Ocean. Atmos. Adm. 1972, 70, 1063–1085. [Google Scholar]
- Goldman, J.C. Temperature effects on steady-state growth, phosphorus uptake, and the chemical composition of a marine phytoplankter. Microbial. Ecol. 1979, 5, 153–166. [Google Scholar] [CrossRef]
- Olenina, I.; Hajdu, S.; Edler, L.; Andersson, A.; Wasmund, N.; Busch, S.; Göbel, J.; Gromisz, S.; Huseby, S.; Huttunen, M.; et al. Biovolumes and Size-Classes of Phytoplankton in the Baltic Sea; Baltic Sea Environment Proceedings No. 106; Helsinki Commission—Baltic Marine Environment Protection Commission: Helsinki, Finland, 2006; p. 144. [Google Scholar]
- Holm Hansen, O.; Riemann, B. Chlorophyll a determination: Improvements in methodology. Oikos 1978, 30, 438–447. [Google Scholar] [CrossRef]
- Cumming, G.; Fidler, F.; Vaux, D.L. Error bars in experimental biology. J. Cell Biol. 2007, 177, 7–11. [Google Scholar]
- Chauton, M.S.; Optun, O.I.; Bathen, T.F.; Volent, Z.; Gribbestad, I.S.; Johnsen, G. HR MAS H-1 NMR spectroscopy analysis of marine microalgal whole cells. Mar. Ecol. Prog. Ser. 2003, 256, 57–62. [Google Scholar] [CrossRef]
- Yoder, J.A. Effect of temperature on light-limited growth and chemical composition of Skeletonema costatum (Bacillariophyceae). J. Phycol. 1979, 15, 362–370. [Google Scholar]
- Goldman, J.C.; Mann, R. Temperature-influenced variations in speciation and chemical-composition of marine-phytoplankton in outdoor mass-cultures. J. Exp. Mar. Biol. Ecol. 1980, 46, 29–39. [Google Scholar] [CrossRef]
- Redalje, D.G.; Laws, E.A. The effects of environmental-factors on growth and the chemical and biochemical-composition of marine diatoms. I. Light and temperature effects. J. Exp. Mar. Biol. Ecol. 1983, 68, 59–79. [Google Scholar] [CrossRef]
- Kudo, I. Change in the uptake and cellular Si:N ratio in diatoms responding to the ambient Si:N ratio and growth phase. Mar. Biol. 2003, 143, 39–46. [Google Scholar] [CrossRef]
© 2013 by the authors; licensee MDPI, Basel, Switzerland. This article is an open access article distributed under the terms and conditions of the Creative Commons Attribution license (http://creativecommons.org/licenses/by/3.0/).
Share and Cite
Huseby, S.; Degerlund, M.; Eriksen, G.K.; Ingebrigtsen, R.A.; Eilertsen, H.C.; Hansen, E. Chemical Diversity as a Function of Temperature in Six Northern Diatom Species. Mar. Drugs 2013, 11, 4232-4245. https://doi.org/10.3390/md11114232
Huseby S, Degerlund M, Eriksen GK, Ingebrigtsen RA, Eilertsen HC, Hansen E. Chemical Diversity as a Function of Temperature in Six Northern Diatom Species. Marine Drugs. 2013; 11(11):4232-4245. https://doi.org/10.3390/md11114232
Chicago/Turabian StyleHuseby, Siv, Maria Degerlund, Gunilla K. Eriksen, Richard A. Ingebrigtsen, Hans Chr. Eilertsen, and Espen Hansen. 2013. "Chemical Diversity as a Function of Temperature in Six Northern Diatom Species" Marine Drugs 11, no. 11: 4232-4245. https://doi.org/10.3390/md11114232