Computational Studies of Marine Toxins Targeting Ion Channels

Abstract
:1. Introduction
2. Computational Methods
2.1. Complex Structure Prediction from Docking and MD Simulations
2.2. Free Energy Calculations


3. Potassium Channel Toxins

| Turret | Pore helix | Filter | Extended region | |||
|---|---|---|---|---|---|---|
| Shaker | 418 | EAGSENSFFK | SIPDAFWWAVVTMT | TVGYG | DMT PVGVW | 454 |
| Kv1.1 | 348 | EAEEAESHFS | SIPDAFWWAVVSMT | TVGYG | DMYPV T I G | 384 |
| Kv1.2 | 350 | EADERDSQFP | SIPDAFWWAVVSMT | TVGYG | DMVPT T I G | 386 |
| Kv1.3 | 373 | EADDPSSGFN | SIPDAFWWAVVTMT | TVGYG | DMHPV T I G | 409 |

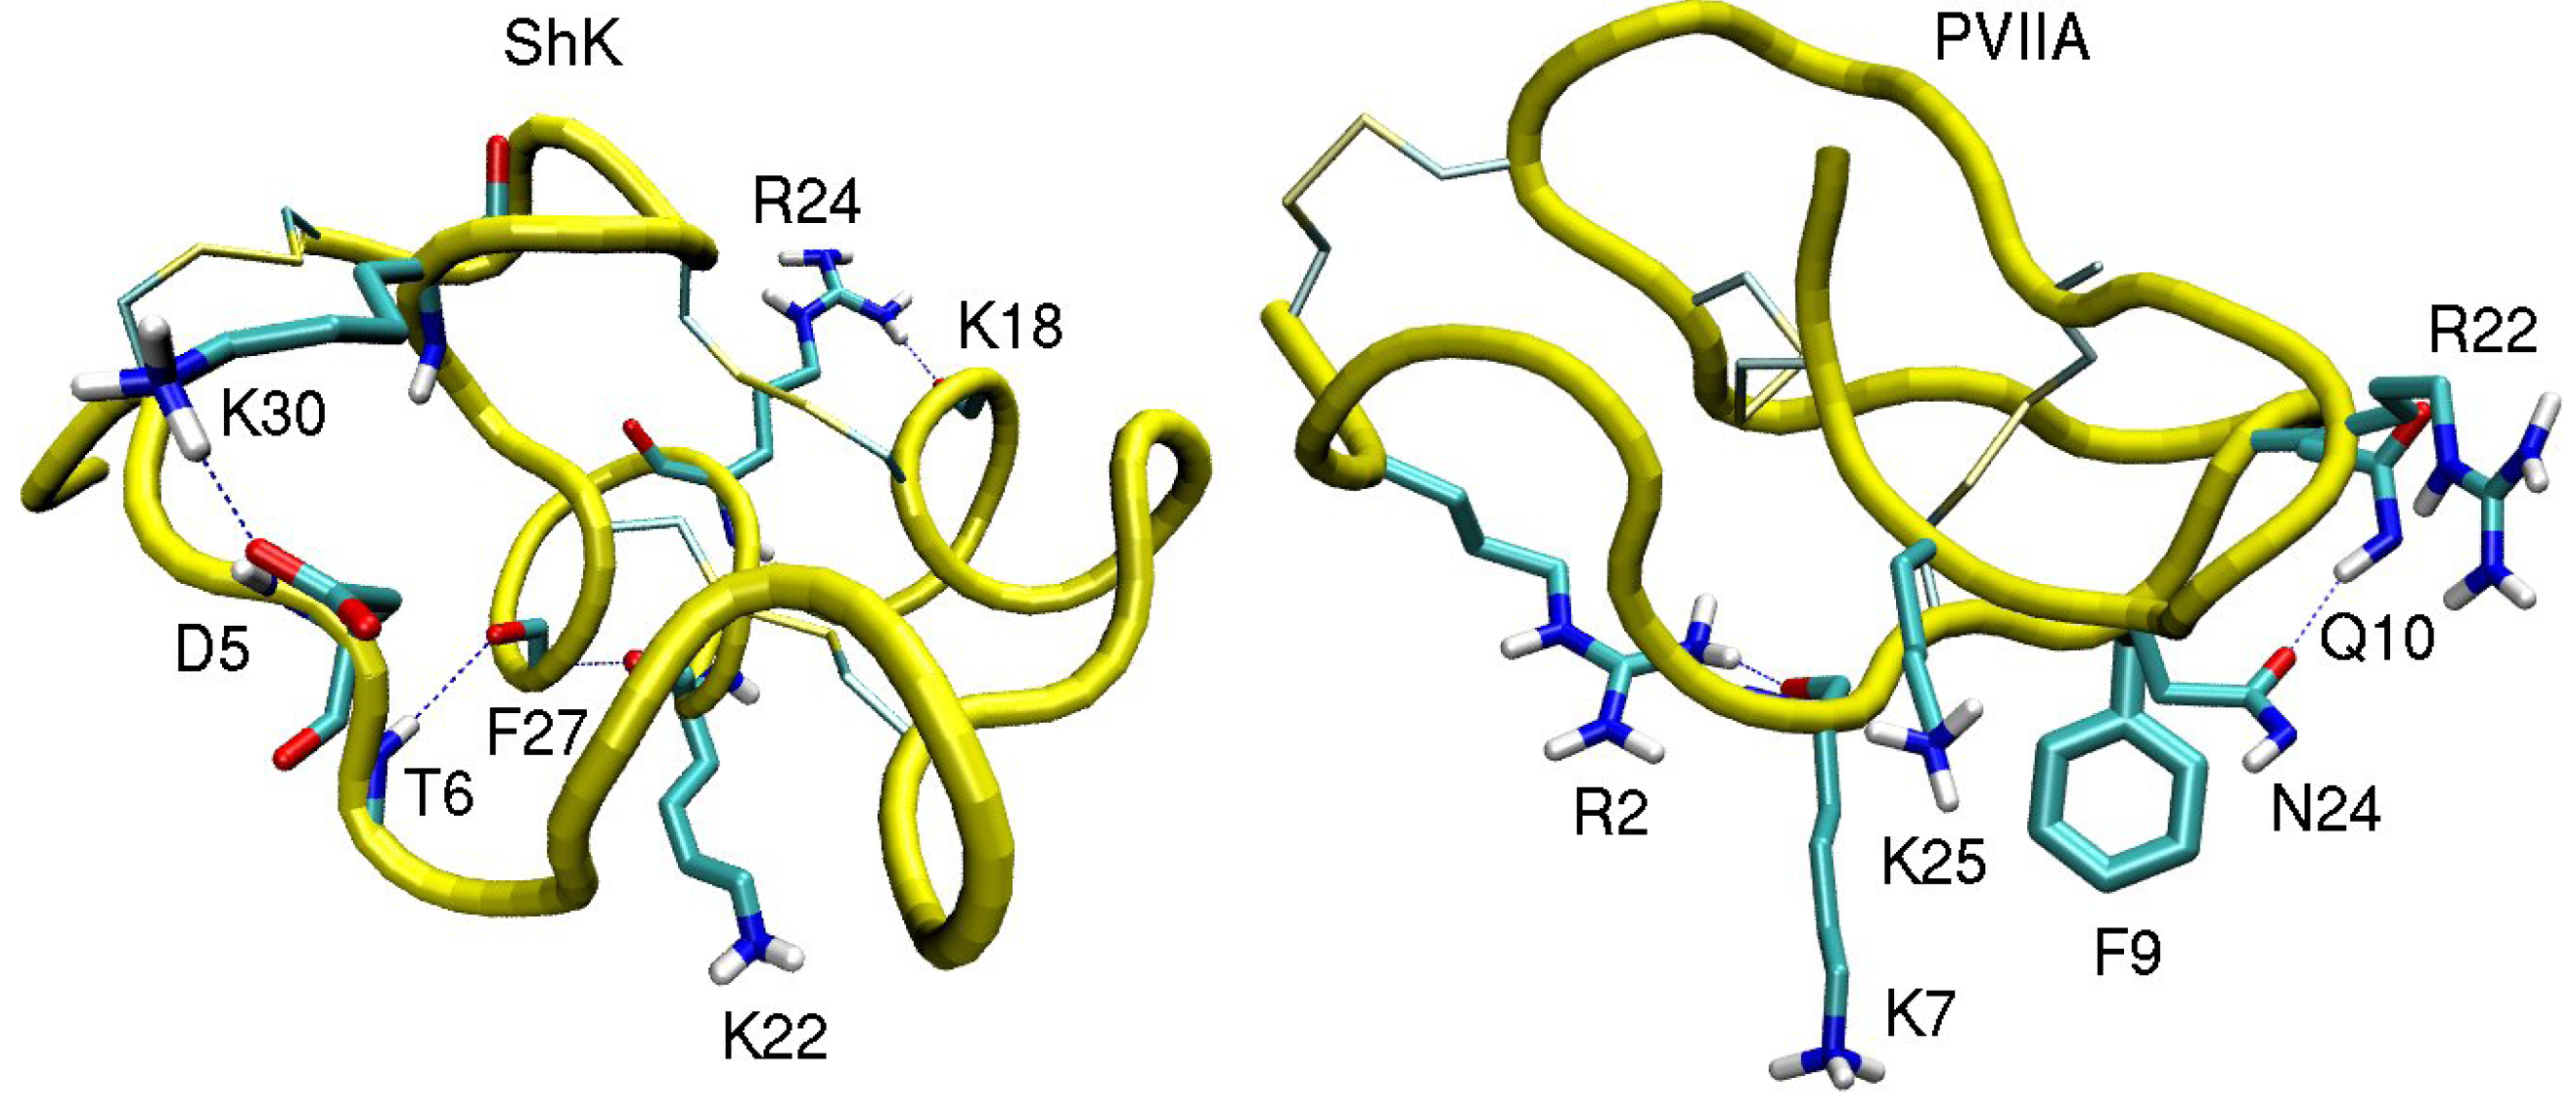
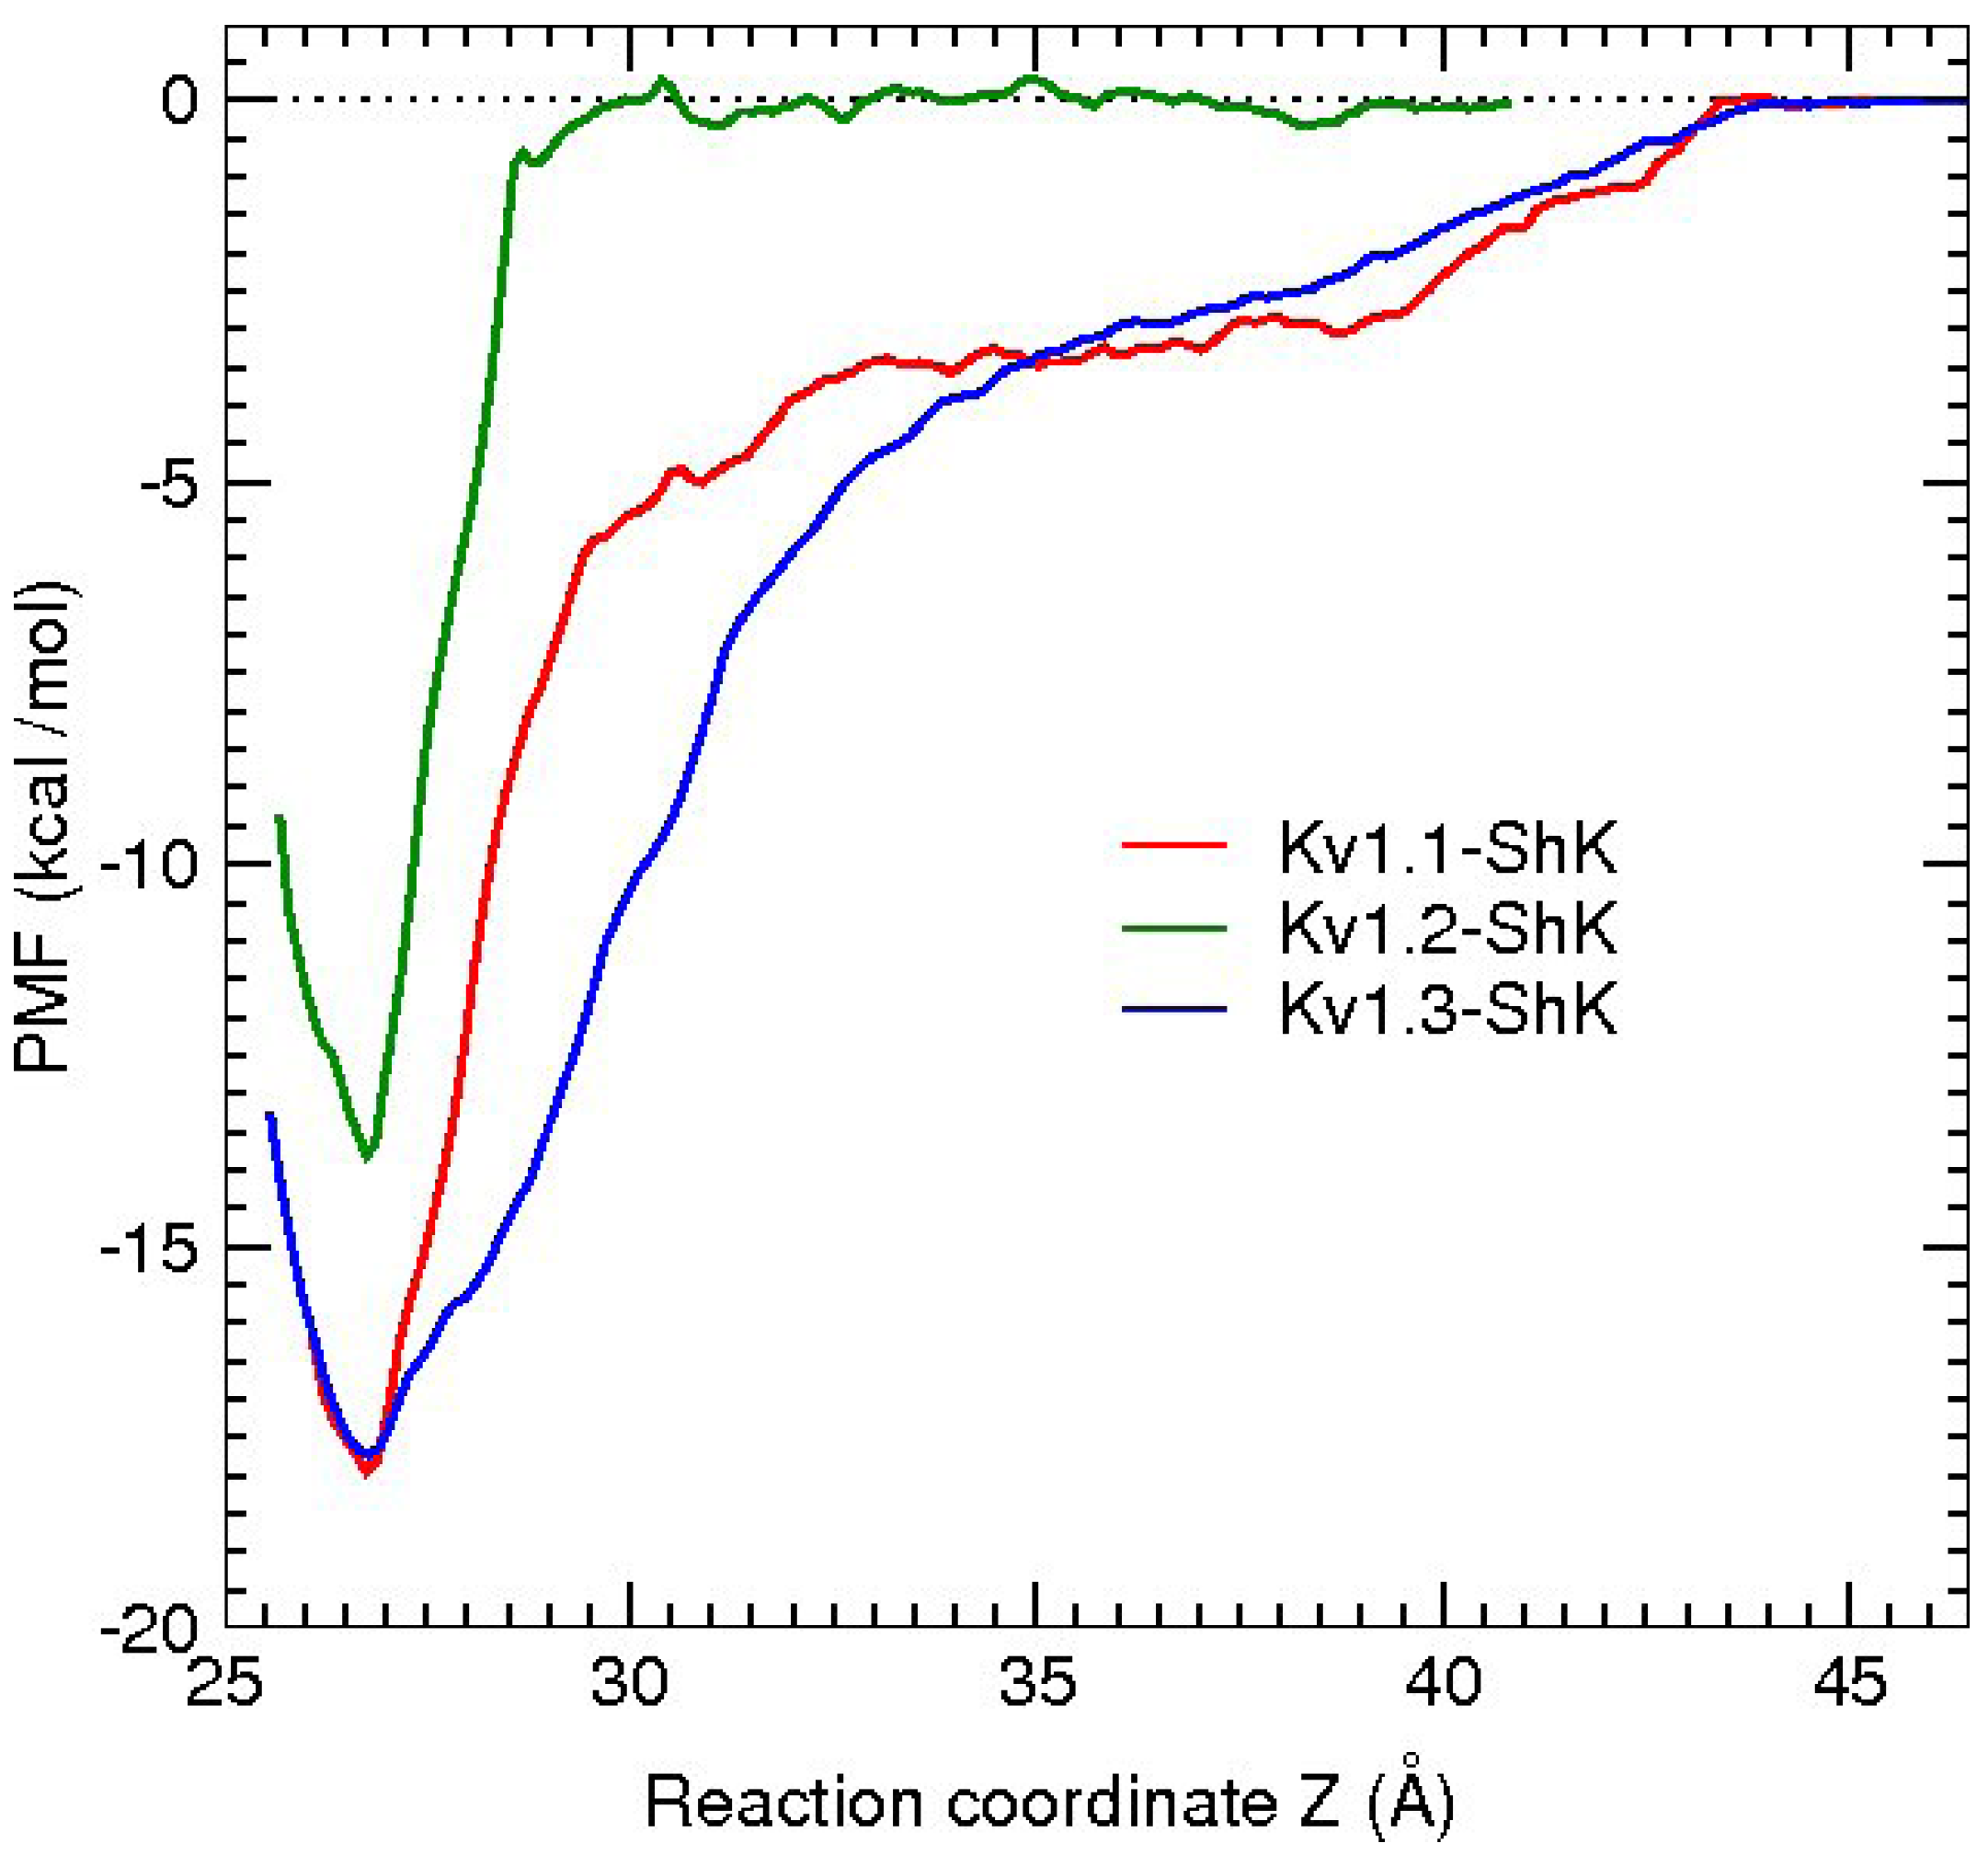
3.1. ShK Toxin
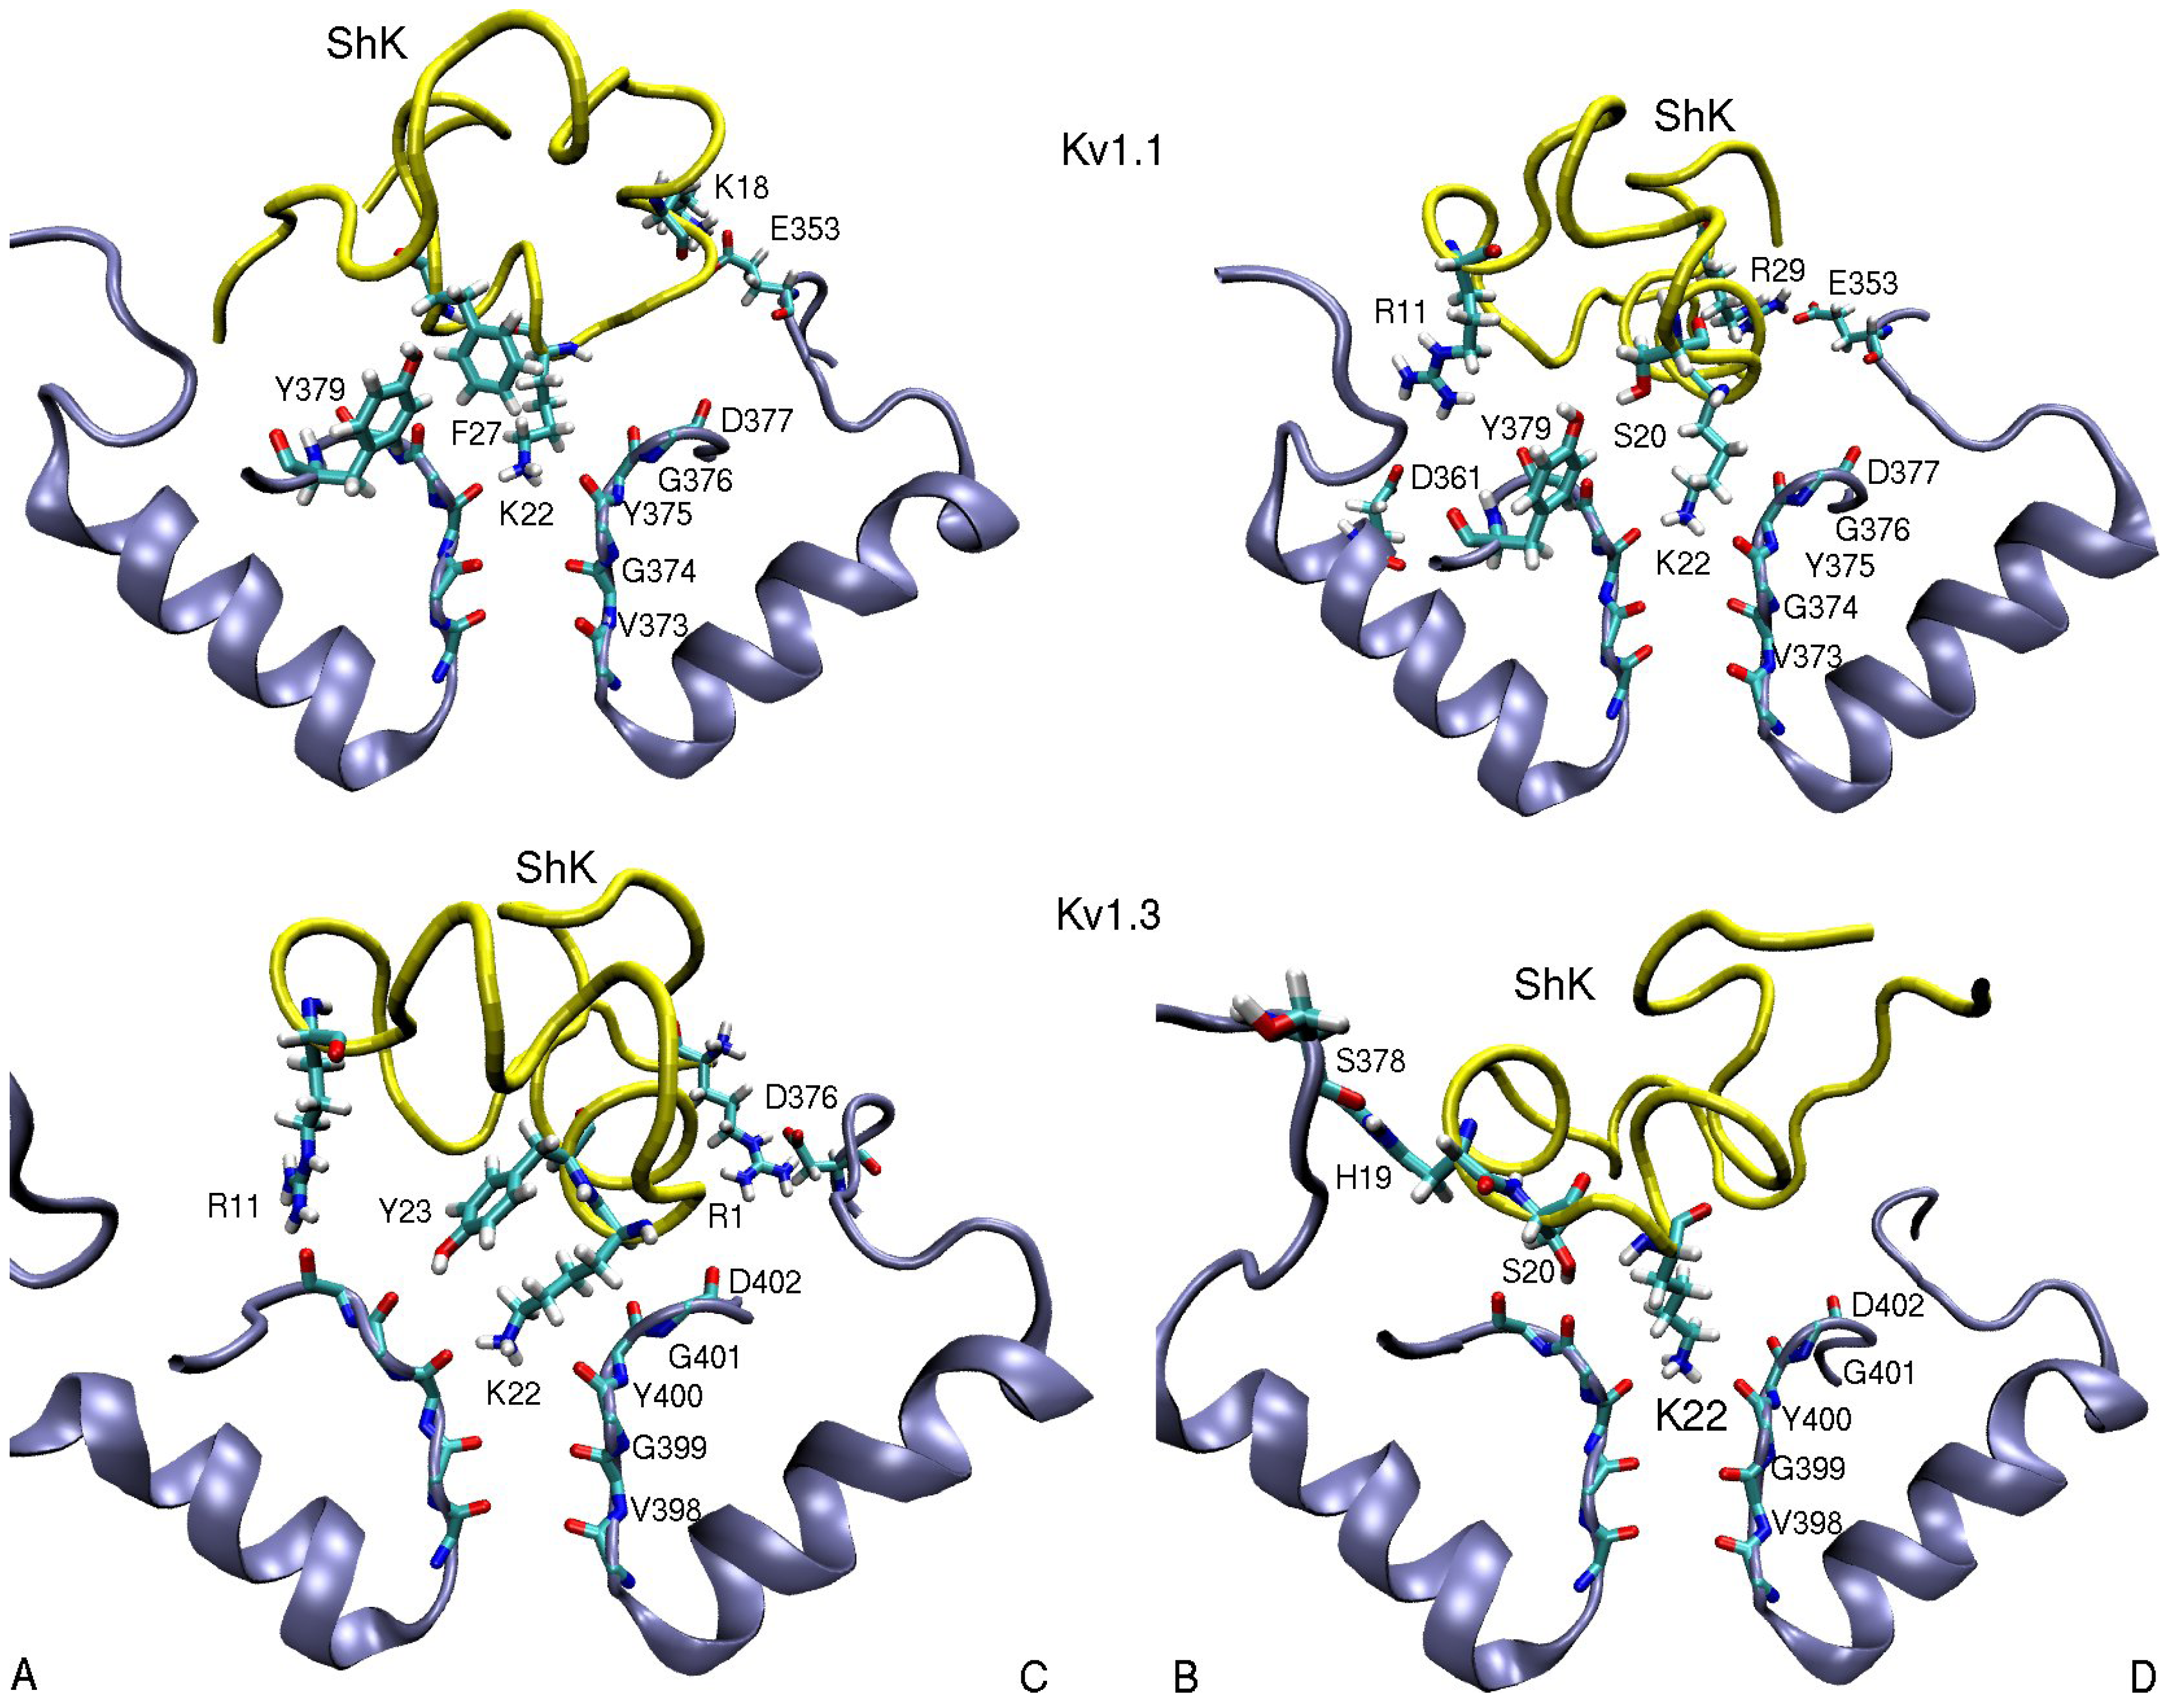
| ShK–Kv1.1 | dist. | ShK–Kv1.2 | dist. | ShK–Kv1.3 | dist. |
|---|---|---|---|---|---|
| R1(N1)–D376(O1)C | 4.5 | ||||
| R11(N2)–D361(O2)B | 5.5 | S10(OH)–D353(O2)B | 2.8 | R11(N2)–D402(O)A | 3.5 |
| K18(N1)–E353(O2)C | 2.7 | H19(N)–S378(O)B | 3.0 | ||
| S20(OH)–Y379(OH)B | 3.0 | M21(N)–D379(O)D | 3.1 | S20(OH)–G401(O)B | 2.7 |
| M21(Cγ)–V381(Cγ2)D | 3.8 | M21(Cε)–V406(Cγ1)B | 4.7 | ||
| K22(N1)–Y375(O) | 2.7 | K22(N1)–Y377(O) | 2.7 | K22(N1)–Y400(O) | 2.7 |
| Y23(OH)–G401(O)A | 3.5 | ||||
| F27(Cε2)–Y379(Cε1)A | 3.6 | F27(Cε1)–H404-Cγ)C | 3.6 | ||
| R29(N2)–E353(O2)D | 2.5 | R29(N1)–D355(O1)A | 2.7 | R29(N1)–D376(O1)C | 10.2 |

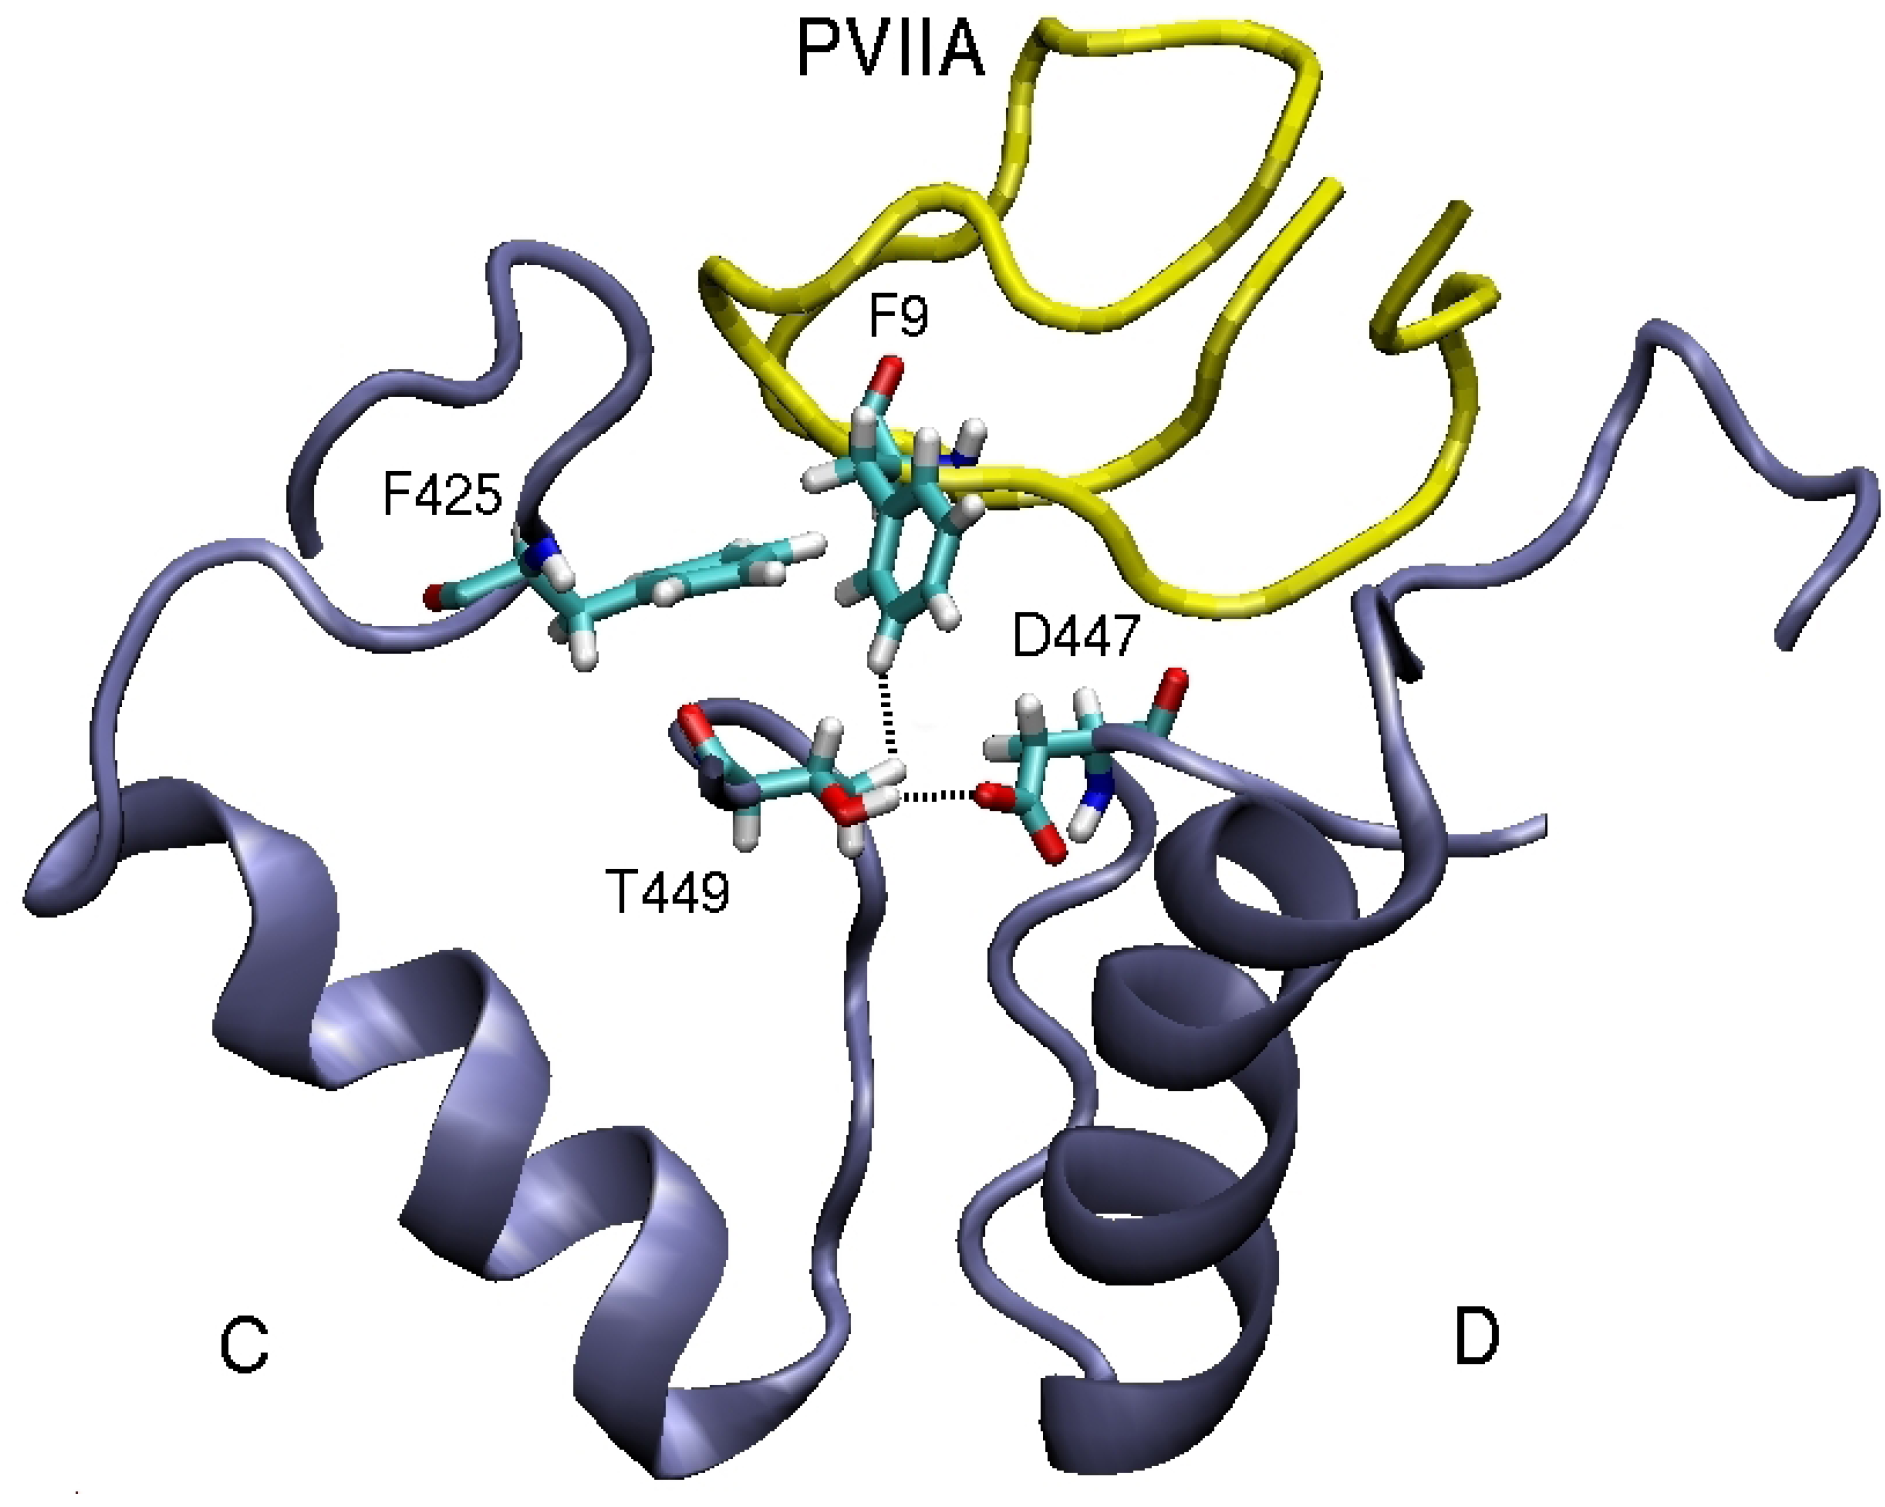
3.2. κ-conotoxin PVIIA
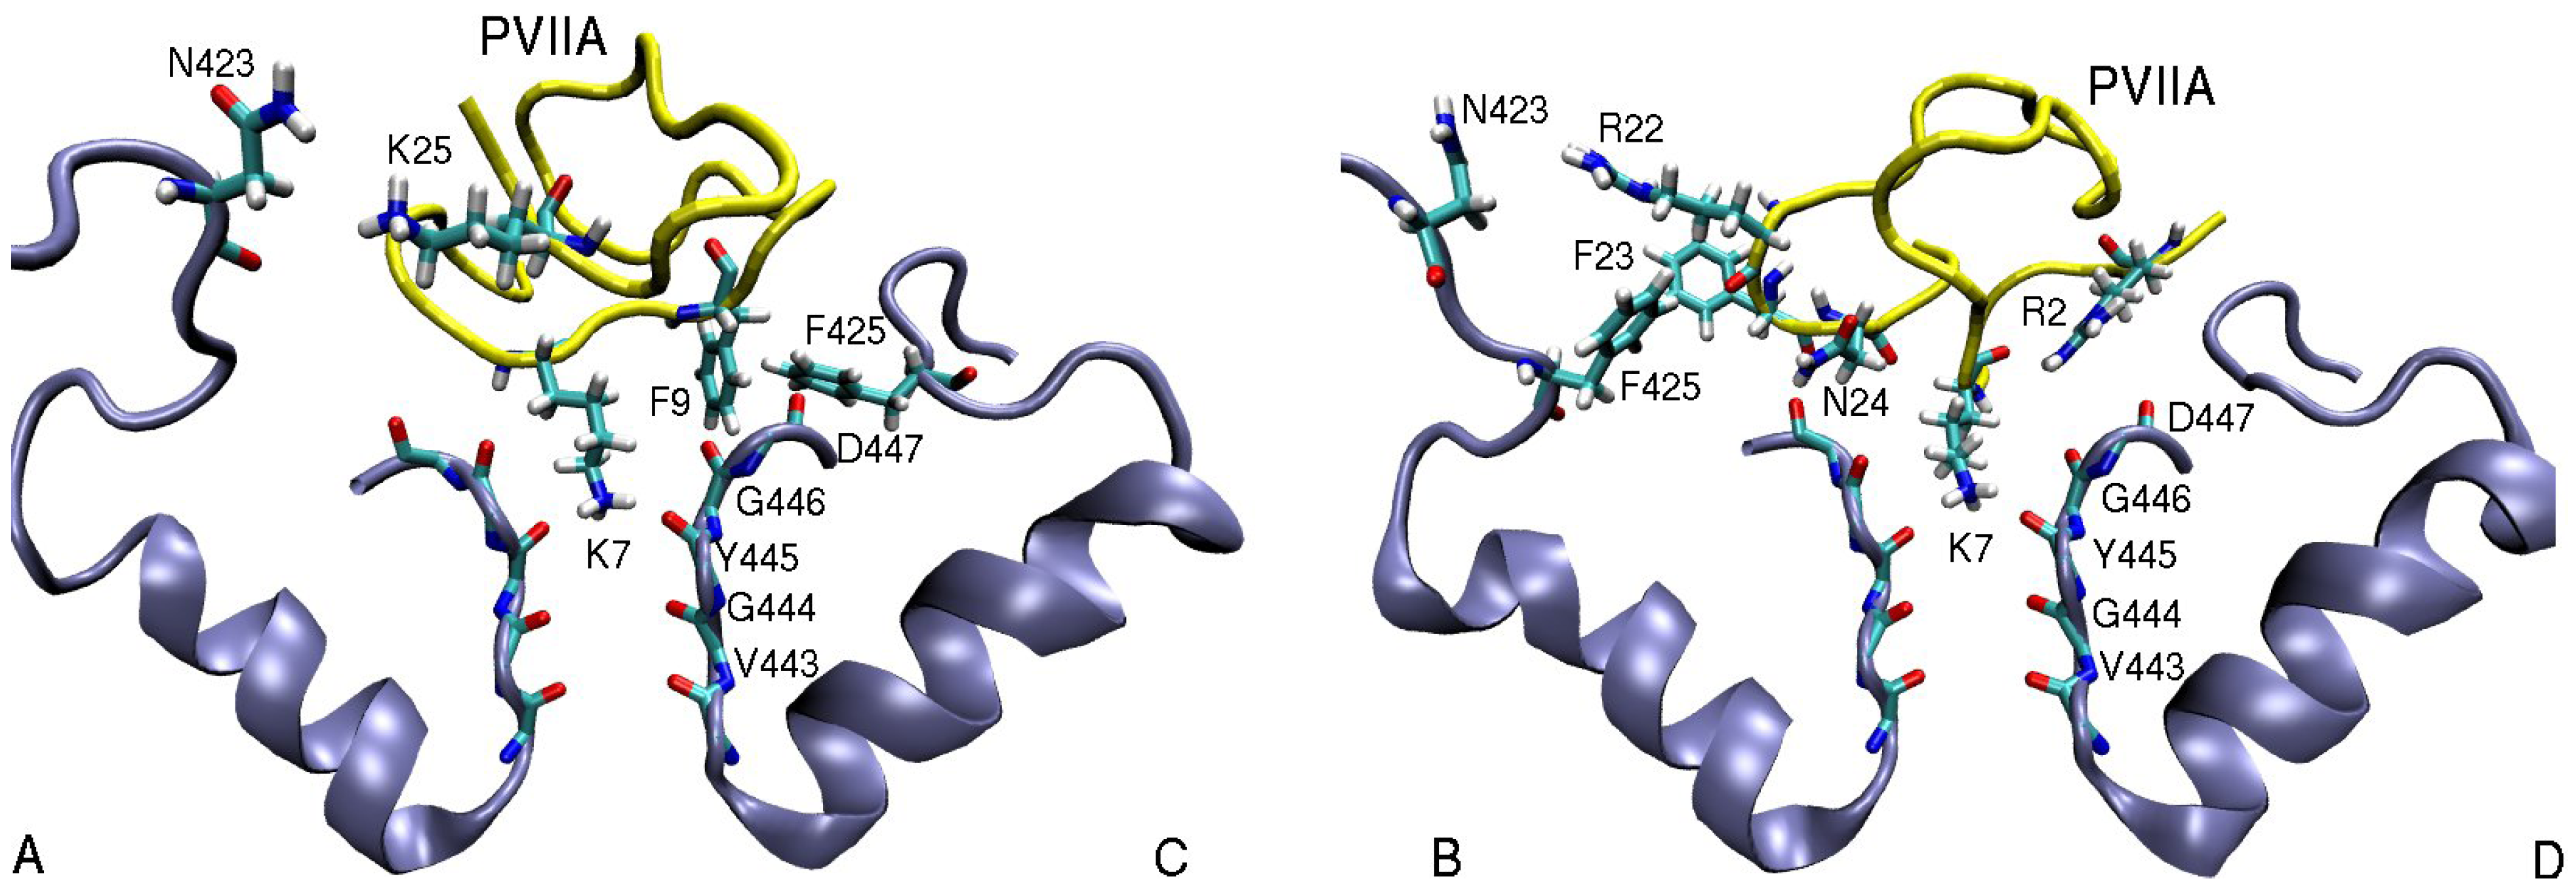
| κ-PVIIA–Shaker | dist. | κ-PVIIA–Kv1.1 | dist. | κ-PVIIA–Kv1.2 | dist. |
|---|---|---|---|---|---|
| R2(N1)–D447(O)D | 3.9 | R2(N2)–D377(O)A | 5.0 | R2(N2)–D379(O)D | 3.7 |
| Q6(N1)–D447(O)A | 4.7 | Q6(N1)–D377(O)A | 5.1 | Q6(N1)–D379(O)A | 3.2 |
| K7(N1)–Y445(O) | 2.7 | K7(N1)–Y375(O) | 2.8 | K7(N1)–Y377(O) | 2.7 |
| F9(Cζ )–T449(Cγ2)C | 4.4 | F9(Cδ2)–Y379(Cє2)C | 3.9 | F9(Cє1)–V381(Cγ1)C | 4.7 |
| F9(Benz)–F425(Cζ )C | 3.6 | ||||
| R22(N1)–N423(O1)B | 6.2 | R22(N2)–E351(O2)B | 3.0 | R22(N2)–D355(O1)B | 3.5 |
| F23(Benz)–F425(Cζ )B | 5.0 | ||||
| N24(N1)–D447(O)B | 3.0 | N24(N1)–D377(O)C | 3.8 | N24(N1)–D379(O)C | 2.9 |
| K25(N1)–D447(O1)B | 6.1 | K25(N1)–Y379(O1)A | 4.7 | K25(N1)–D379(O)B | 2.9 |
| K25(N1)–N423(O1)A | 5.0 |

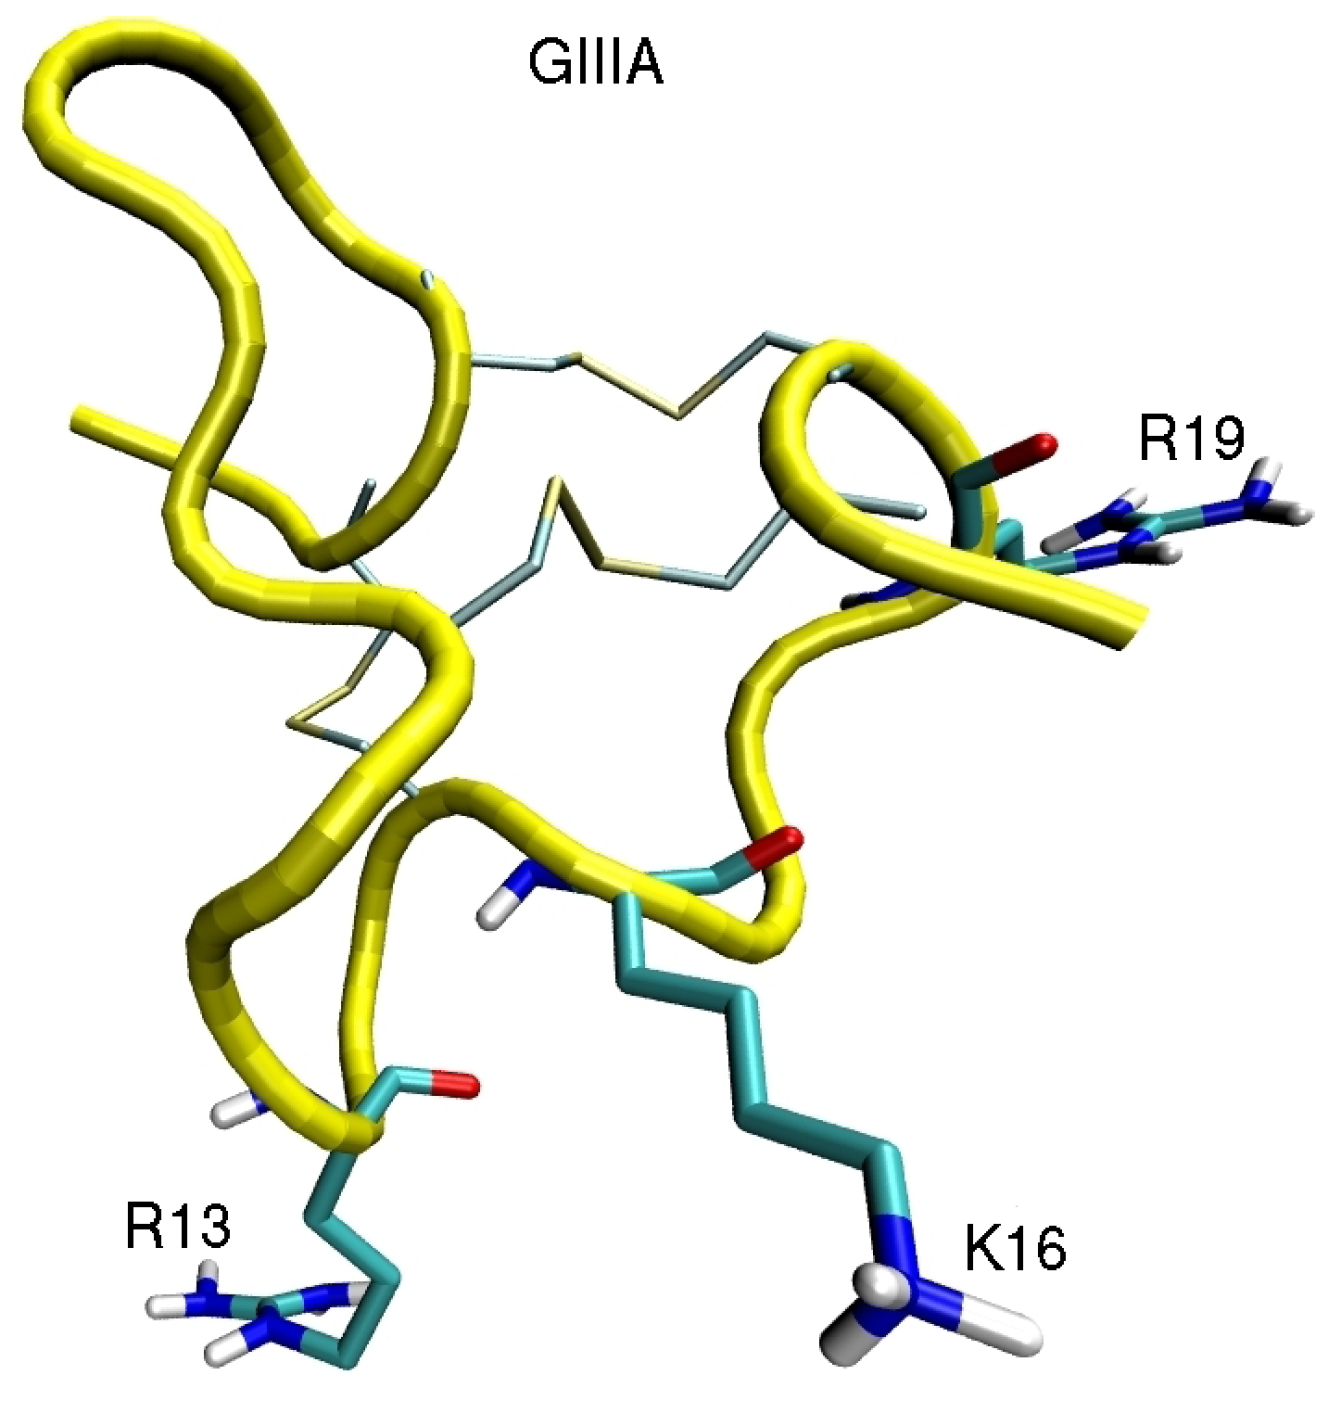
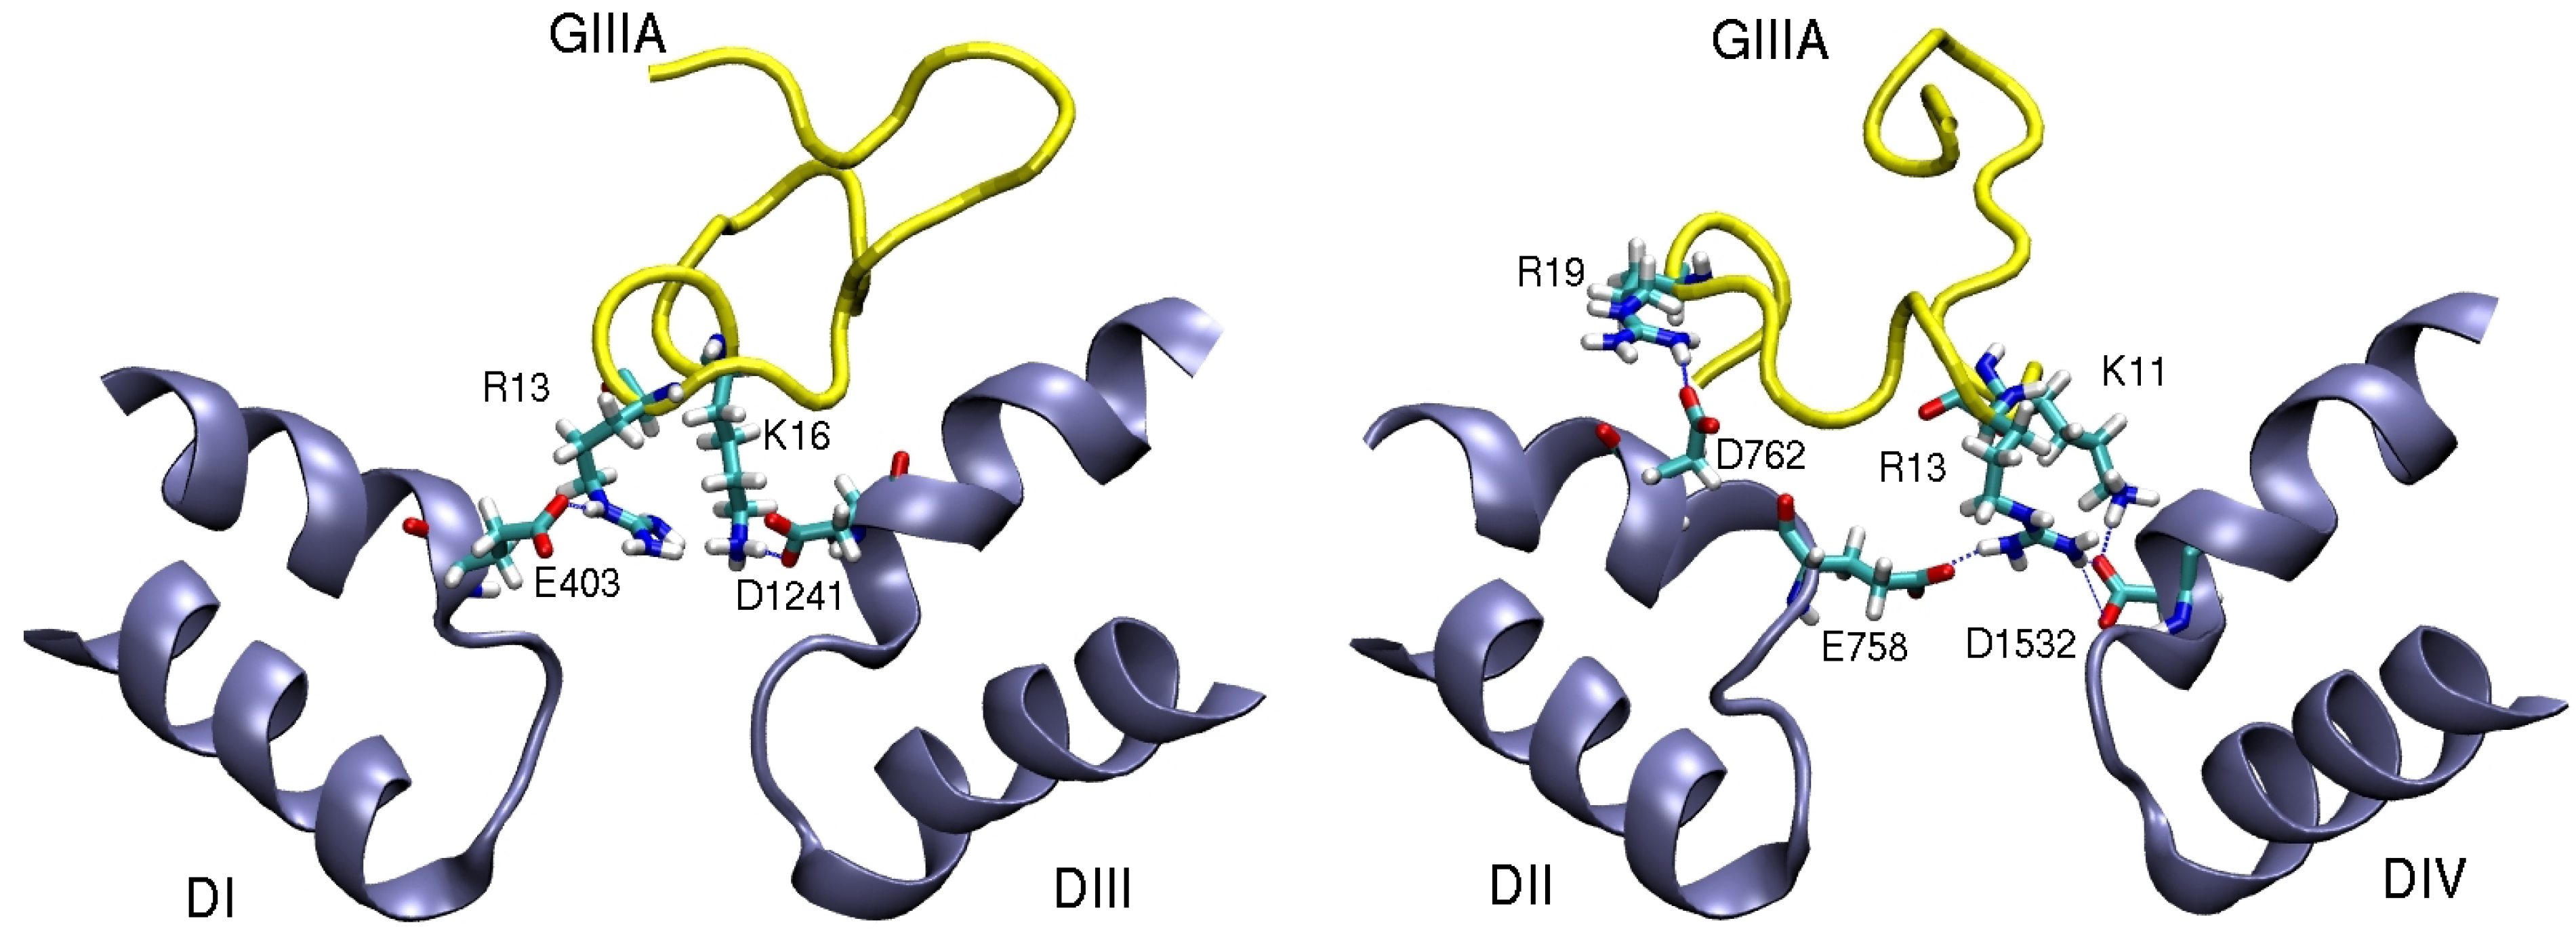
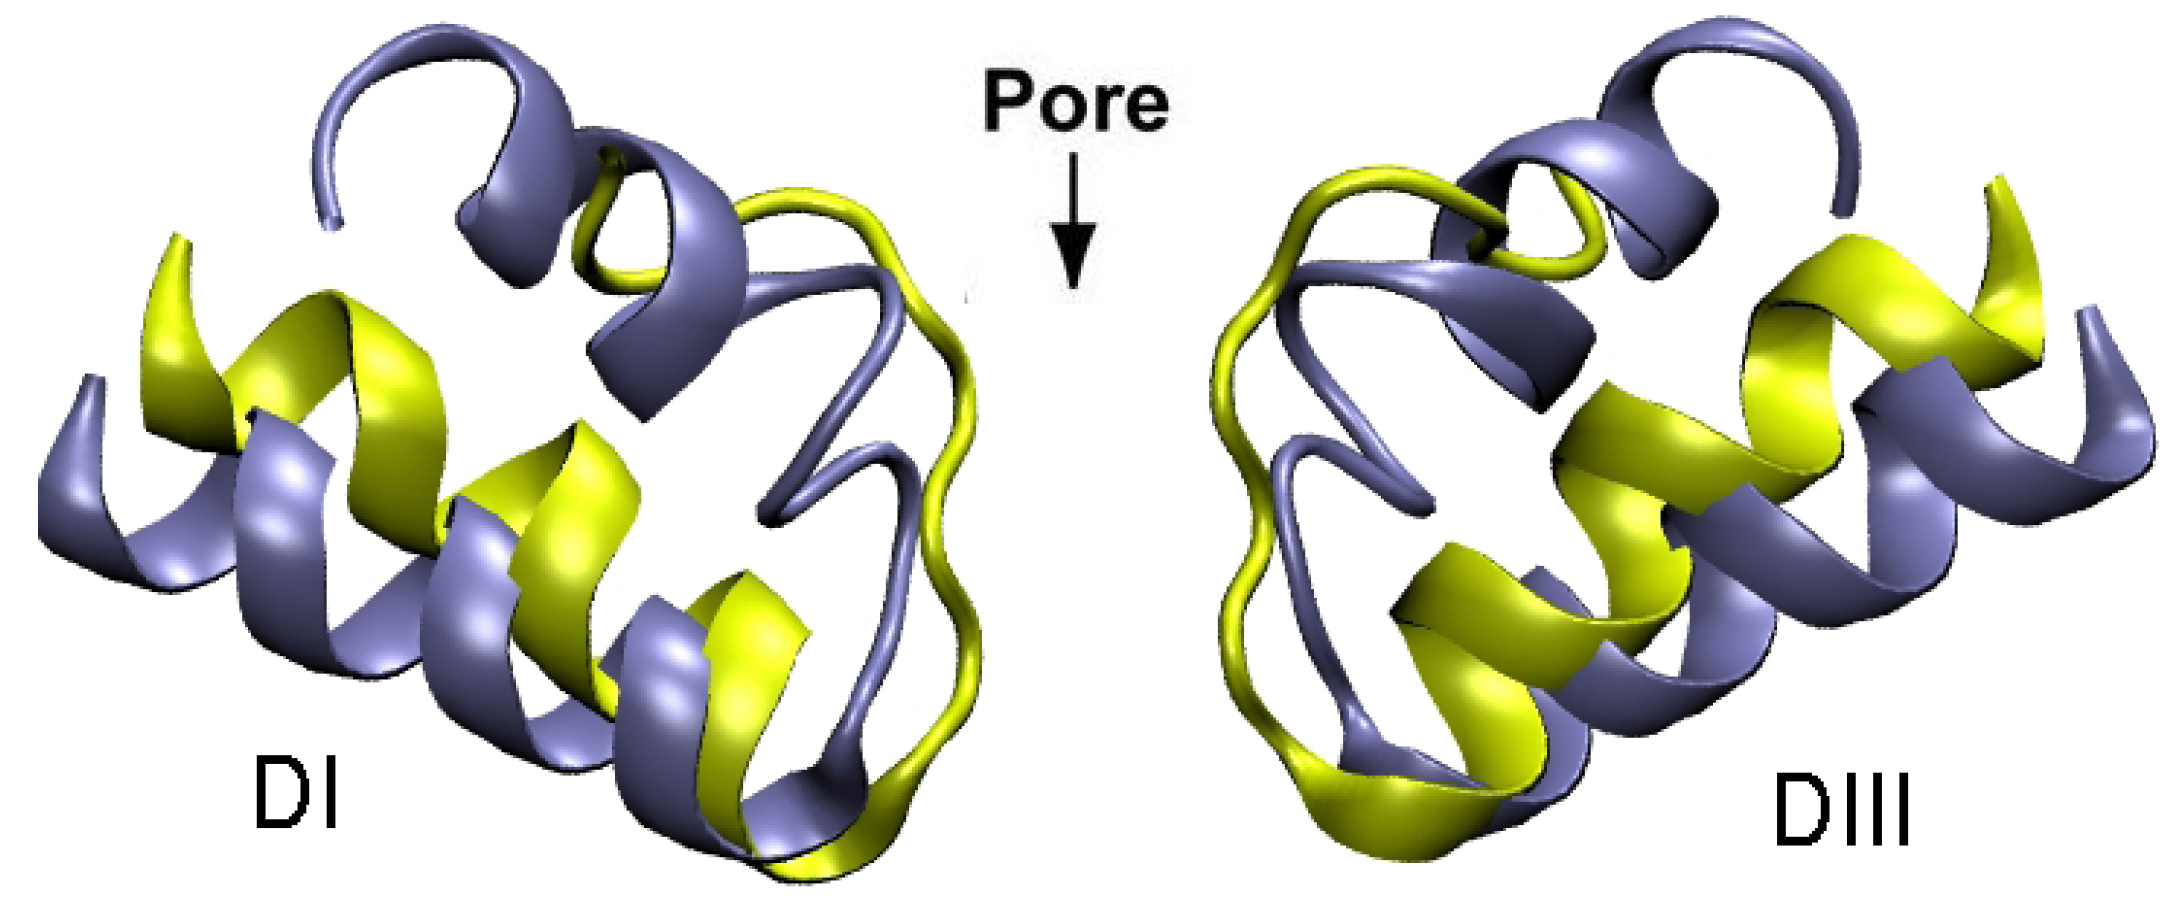
4. Sodium Channel Toxins

5. Conclusions
Acknowledgements
References
- Hille, B. Ionic Channels of Excitable Membranes, 3rd ed.; Sinauer Associates: Sunderland, MA, USA, 2001. [Google Scholar]
- Ashcroft, F.M. Ion Channels and Disease: Channelopathies; Academic Press: San Diego, CA, USA, 2000. [Google Scholar]
- Terlau, H.; Olivera, B.M. Conus venoms: A rich source of novel ion channel-targeted peptides. Physiol. Rev. 2004, 84, 41–68. [Google Scholar] [CrossRef]
- Al-Sabi, A.; McArthur, J.; Ostroumov, V.; French, R.J. Marine toxins that target voltage-gated sodium channels. Mar. Drugs 2006, 4, 157–192. [Google Scholar] [CrossRef]
- Lewis, R.J.; Garcia, M.L. Therapeutic potential of venom peptides. Nat. Rev. Drug Discov. 2003, 2, 790–802. [Google Scholar] [CrossRef]
- French, R.J.; Terlau, H. Sodium channel toxins-receptor targeting and therapeutic potential. Current Med. Chem. 2004, 11, 3053–3064. [Google Scholar] [CrossRef]
- Wulff, H.; Castle, N.A.; Pardo, L.A. Voltage-gated potassium channels as therapeutic targets. Nat. Rev. Drug Disc. 2009, 8, 982–1001. [Google Scholar] [CrossRef]
- Norton, R.S. μ-Conotoxins as leads in the development of new analgesics. Molecules 2010, 15, 2825–2844. [Google Scholar] [CrossRef]
- Beeton, C.; Pennington, M.W.; Norton, R.S. Analogs of the sea anemone potassium channel blocker ShK for the treatment of autoimmune diseases. Inflamm. Allergy Drug Targets 2011, 10, 313–321. [Google Scholar] [CrossRef]
- Chi, V.; Pennington, M.W.; Norton, R.S.; Tarcha, E.J.; Londono, L.M.; Sims-Fahey, B.; Upadhyay, S.K.; Lakey, J.T.; Iadonato, S.; Wulff, H.; et al. Development of a sea anemone toxin as an immunomodulator for therapy of autoimmune diseases. Toxicon 2012, 59, 529–546. [Google Scholar] [CrossRef]
- Doyle, D.A.; Cabral, J.M.; Pfuetzner, R.A.; Kuo, A.; Gulbis, J.M.; Cohen, S.L.; Chait, B.T.; MacKinnon, R. The structure of the potassium channel: Molecular basis of K+ conduction and selectivity. Science 1998, 280, 69–77. [Google Scholar] [CrossRef]
- MacKinnon, R. Potassium channels and the atomic basis of selective ion conduction. Angew. Chem. Int. Ed. 2004, 43, 4265–4277. [Google Scholar] [CrossRef]
- Long, S.B.; Tao, X.; Campbell, E.B.; MacKinnon, R. Atomic structure of a voltage-dependent K+ channel in a lipid membrane-like environment. Nature 2007, 450, 376–382. [Google Scholar] [CrossRef]
- Payandeh, J.; Scheuer, T.; Zheng, N.; Catterall, W.A. The crystal structure of a voltage-gated sodium channel. Nature 2011, 475, 353–358. [Google Scholar] [CrossRef]
- Pearlman, D.A; Case, D.A.; Caldwell, J.W.; Ross, W.S.; Cheatham, T.E.; DeBolt, S.; Ferguson, D.; Seibel, G.; Kollman, P.A. AMBER, a package of computer programs for applying molecular mechanics, normal mode analysis, molecular dynamics, and free energy calculations to simulate the structural and energetic properties of molecules. Comp. Phys. Commun. 1995, 91, 1–41. [Google Scholar] [CrossRef]
- MacKerell, A.D., Jr.; Bashford, D.; Bellott, M.; Dunbrack, R.L., Jr.; Evanseck, J.D.; Field, M.J.; Fisher, S.; Gao, J.; Guo, H.; Ha, S.; et al. All-atom empirical potential for molecular modeling and dynamics studies of proteins. J. Phys. Chem. B 1998, 102, 3586–3616. [Google Scholar] [CrossRef]
- Lindahl, E.; Hess, B.; van der Spoel, D. GROMACS 3.0: A package for molecular simulation and trajectory analysis. J. Mol. Model. 2001, 7, 306–317. [Google Scholar]
- Alonso, H.; Bliznyuk, A.A.; Gready, J.E. Combining docking and molecular dynamic simulations in drug design. Med. Res. Rev. 2006, 26, 531–568. [Google Scholar] [CrossRef]
- Gilson, M.K.; Zhou, H.X. Calculation of protein-ligand binding energies. Ann. Rev. Biophys. Biomol. Struct. 2007, 36, 21–42. [Google Scholar] [CrossRef]
- Deng, Y.; Roux, B. Computations of standard binding free energies with molecular dynamics simulations. J. Phys. Chem. B 2009, 113, 2234–2246. [Google Scholar] [CrossRef]
- Christ, C.D.; Mark, A.E.; van Gunsteren, W.F. Basic ingredients of free energy calculations. J. Comput. Chem. 2010, 31, 1569–1582. [Google Scholar]
- Steinbrecher, T.; Labahn, A. Towards accurate free energy calculations in ligand-protein binding studies. Curr. Med. Chem. 2010, 17, 767–785. [Google Scholar] [CrossRef]
- Halperin, I.; Ma, B.; Wolfson, H.; Nussinov, R. Principles of docking: An overview of search algorithms and a guide to scoring functions. Proteins 2002, 47, 409–443. [Google Scholar] [CrossRef]
- Brooijmans, N.; Kuntz, I.D. Molecular recognition and docking algorithms. Ann. Rev. Biophys. Biomol. Struct. 2003, 32, 335–373. [Google Scholar] [CrossRef]
- Warren, G.L.; Andrews, C.W.; Capelli, A.M.; Clarke, B.; LaLonde, J.; Lambert, M.H.; Lindvall, M.; Nevins, N.; Semus, S.F.; Senger, S.; et al. A critical assessment of docking programs and scoring functions. J. Med. Chem. 2006, 49, 5912–5931. [Google Scholar] [CrossRef]
- Morris, G.M.; Goodsell, D.S.; Halliday, R.S.; Huey, R.; Hart, W.E.; Belew, R.K.; Olson, A.J. Automated docking using a Lamarckian genetic algorithm and empirical binding free energy function. J. Comput. Chem. 1998, 19, 1639–1662. [Google Scholar] [CrossRef]
- Mintseris, J.; Pierce, B.; Wiehe, K.; Anderson, R.; Chen, R.; Weng, Z. Integrating statistical pair potentials into prtotein complex prediction. Proteins 2007, 69, 511–520. [Google Scholar] [CrossRef]
- Patra, S.M.; Bastug, T.; Kuyucak, S. Binding of organic cations to gramicidin: A channel studied with AutoDock and molecular dynamics simulations. J. Phys. Chem. B 2007, 111, 11303–11311. [Google Scholar] [CrossRef]
- Ander, M.; Luzhkov, V.B.; Aqvist, J. Ligand binding to the voltage-gated Kv1.5 potassium channel in the open state—Docking and computer simulations of a homology model. Biophys. J. 2007, 94, 820–831. [Google Scholar] [CrossRef]
- Yi, H.; Qiu, S.; Cao, Z.J.; Wu, Y.L.; Li, W.X. Molecular basis of inhibitory peptide maurotoxin recognizing Kv1.2 channel explored by ZDOCK and molecular dynamic simulations. Proteins 2008, 70, 844–854. [Google Scholar]
- Chen, P.C.; Kuyucak, S. Mechanism and energetics of charybdotoxin unbinding from a potassium channel from molecular dynamics simulations. Biophys. J. 2009, 96, 2577–2588. [Google Scholar] [CrossRef]
- Chen, P.C.; Kuyucak, S. Developing a comparative docking protocol for the prediction of peptide selectivity profiles: Investigation of potassium channel toxins. Toxins 2012, 4, 110–138. [Google Scholar] [CrossRef]
- Yu, L.P.; Sun, C.H.; Song, D.Y.; Shen, J.W.; Xu, N.; Gunasekera, A.; Hajduk, P.J.; Olejniczak, E.T. Nuclear magnetic resonance structural studies of a potassium channel-charybdotoxin complex. Biochemistry 2005, 44, 15834–15841. [Google Scholar] [CrossRef]
- Dominguez, C.; Boelens, R.; Bonvin, A.M. HADDOCK: A protein-protein docking approach based on biochemical or biophysical information. J. Am. Chem. Soc. 2003, 125, 1731–1737. [Google Scholar] [CrossRef]
- De Vries, S.J.; van Dijk, A.D.; Krzeminski, M.; van Dijk, M.; Thureau, A.; Hsu, V.; Wassenaar, T.; Bonvin, A.M. HADDOCK versus HADDOCK: New features and performance of HADDOCK2.0 on the CAPRI targets. Proteins 2007, 69, 726–733. [Google Scholar] [CrossRef]
- Bastug, T.; Kuyucak, S. Importance of the peptide backbone description in modeling the selectivity filter in potassium channels. Biophys. J. 2009, 96, 4006–4012. [Google Scholar] [CrossRef]
- Bastug, T.; Kuyucak, S. Comparative study of the energetics of ion permeation in Kv1.2 and KcsA potassium channels. Biophys. J. 2011, 100, 629–636. [Google Scholar] [CrossRef]
- Humphrey, W.; Dalke, A.; Schulten, K. VMD—Visual molecular dynamics. J. Mol. Graph. 1996, 14, 33–38. [Google Scholar] [CrossRef]
- Phillips, J.C.; Braun, R.; Wang, W.; Gumbart, J.; Tajkhorshid, E.; Villa, E.; Chipot, C.; Skeel, R.D.; Kale, L.; Schulten, K. Scalable molecular dynamics with NAMD. J. Comput. Chem. 2005, 26, 1781–1802. [Google Scholar] [CrossRef]
- MacKerell, A.D.; Feig, M.; Brooks, C.L. Extending the treatment of backbone energetics in protein force fields. J. Comput. Chem. 2004, 25, 1400–1415. [Google Scholar] [CrossRef]
- Allen, M.P.; Tildesley, D.J. Computer Simulation of Liquids; Oxford University Press: London, UK, 1987. [Google Scholar]
- Frenkel, D.; Smit, B. Understanding Molecular Simulation: From Algorithms to Applications; Academic Press: San Diego, CA, USA, 1996. [Google Scholar]
- Leach, A.R. Molecular Modelling, Principles, Applications; Prentice Hall: New York, NY, USA, 2001. [Google Scholar]
- Bastug, T.; Kuyucak, S. Molecular dynamics simulations of membrane proteins. Biophys. Rev. 2012, 4, 271–282. [Google Scholar] [CrossRef]
- Woo, H.; Roux, B. Calculation of absolute protein-ligand binding free energy from computer simulations. Proc. Natl. Acad. Sci. USA 2005, 102, 6825–6830. [Google Scholar] [CrossRef]
- Bastug, T.; Kuyucak, S. Energetics of ion permeation, rejection, binding and block in gramicidin: A from free energy simulations. Biophys. J. 2006, 90, 3941–3950. [Google Scholar] [CrossRef]
- Torrie, G.M.; Valleau, J.P. Nonphysical sampling distributions in Monte Carlo free-energy estimation: Umbrella sampling. J. Comput. Phys. 1977, 23, 187–199. [Google Scholar] [CrossRef]
- Kumar, S.; Bouzida, D; Swensen, R.H.; Kollman, P.A.; Rosenberg, J.M. The weighted histogram analysis method for free-energy calculations on biomolecules. J. Comput. Chem. 1992, 13, 1011–1021. [Google Scholar] [CrossRef]
- Jarzynski, C. Nonequilibrium equality for free energy diffrences. Phys. Rev. Lett. 1997, 78, 2690–2693. [Google Scholar] [CrossRef]
- Park, S.; Schulten, K. Calculating potentials of mean force from steered molecular dynamics simulations. J. Chem. Phys. 2004, 120, 5946–5961. [Google Scholar] [CrossRef]
- Bastug, T.; Kuyucak, S. Application of Jarzynski's equality in simple versus complex systems. Chem. Phys. Lett. 2007, 436, 383–387. [Google Scholar] [CrossRef]
- Bastug, T.; Chen, P.C.; Patra, S.M.; Kuyucak, S. Potential of mean force calculations of ligand binding to ion channels from Jarzynski's equality and umbrella sampling. J. Chem. Phys. 2008, 128, 104–112. [Google Scholar]
- Chen, P.C.; Kuyucak, S. Accurate determination of the binding free energy for KcsA-Charybdotoxin complex from the potential of mean force calculations with restraints. Biophys. J. 2011, 100, 2466–2474. [Google Scholar] [CrossRef]
- Khabiri, M.; Nikouee, A.; Cwiklik, L.; Grissmer, S.; Ettrich, R. Charybdotoxin unbinding from the mKv1.3 potassium channel: A combined computational and experimental study. J. Phys. Chem. B 2011, 115, 11490–11500. [Google Scholar] [CrossRef]
- Chen, R.; Robinson, A.; Gordon, D.; Chung, S.H. Modeling the binding of three toxins to the voltage-gated potassium channel (Kv1.3). Biophys. J. 2011, 101, 2652–2660. [Google Scholar] [CrossRef]
- Chen, R.; Chung, S.H. Binding modes of μ-conotoxin to the bacterial sodium channel (NaVAb). Biophys. J. 2012, 102, 483–488. [Google Scholar] [CrossRef]
- Chen, R.; Chung, S.H. Structural basis of the selective block of Kv1.2 by maurotoxin from computer simulations. PLoS One 2012, 7, e47253. [Google Scholar]
- Chen, R.; Chung, S.H. Conserved functional surface of antimammalian scorpion β-toxins. J. Phys. Chem. B 2012, 116, 4796–4800. [Google Scholar]
- Rashid, M.H.; Kuyucak, S. Affinity and selectivity of ShK toxin for the Kv1 potassium channels from free energy simulations. J. Phys. Chem. B 2012, 116, 4812–4822. [Google Scholar]
- Pennington, M.W.; Rashid, M.H.; Tajhya, R.B.; Beeton, C.; Kuyucak, S.; Norton, R.S. A C-terminally amidated analogue of ShK is a potent and selective blocker of the voltage-gated potassium channel Kv1.3. FEBS Lett. 2012, 586, 3996–4001. [Google Scholar]
- Mahdavi, S.; Kuyucak, S. Why drosophila shaker K+ channel is not a good model for ligand binding to voltage-gated Kv1 channels. Biochemistry 2013, in press. [Google Scholar]
- Beveridge, D.L.; DiCapua, F.M. Free energy via molecular simulation: Applications to chemi-cal and biomolecular systems. Annu. Rev. Biophys. Biophys. Chem. 1989, 18, 431–492. [Google Scholar]
- Heinzelmann, G.; Bastug, T.; Kuyucak, S. Free energy simulations of ligand binding to the aspartate transporter GltPh. Biophys. J. 2011, 101, 2380–2388. [Google Scholar]
- Huang, X.; Dong, F.; Zhou, H.X. Electrostatic recognition and induced fit in the κ-PVIIA toxin binding to Shaker potassium channel. J. Am. Chem. Soc. 2005, 127, 6836–6849. [Google Scholar]
- Tudor, J.E.; Pallaghy, P.K.; Pennington, M.W.; Norton, R.S. Solution structure of ShK toxin, a novel potassium channel inhibitor from a sea anemone. Nat. Struct. Biol. 1996, 3, 317–320. [Google Scholar]
- Scanlon, M.J.; Naranjo, D.; Thomas, L.; Alewood, P.F.; Lewis, R.J.; Craik, D.J. Solution structure and proposed binding mechanism of a novel potassium channel toxin kappa-conotoxin PVIIA. Structure 1997, 5, 1585–1597. [Google Scholar]
- Wulff, H.; Calabresi, P.A.; Allie, R.; Yun, S.; Pennington, M.; Beeton, C.; Chandy, K.G. The voltage-gated Kv1.3 K+ channel in effector memory T cells as new target for MS. J. Clin. Invest. 2003, 111, 1703–1713. [Google Scholar]
- Beeton, C.; Wulff, H.; Standifer, N.E.; Azam, P.; Mullen, K.M.; Pennington, M.W.; Kolski-Andreaco, A.; Wei, E.; Grino, A.; Counts, D.R.; et al. Kv1.3 channels are a therapeutic target for T cell-mediated autoimmune diseases. Proc. Natl. Acad. Sci. USA 2006, 103, 17414–17419. [Google Scholar]
- Castaneda, O.; Sotolongo, V; Amor, A.M.; Stocklin, R.; Anderson, A.J.; Harvey, A.L.; Engstrom, A.; Wernstedt, C.; Karlsson, E. Characterization of a potassium channel toxin from the Caribbean Sea anemone Stichodactyla helianthus. Toxicon 1995, 33, 603–613. [Google Scholar]
- Pohl, J.; Hubalek, F.; Byrnes, M.E.; Nielsen, K.R.; Woods, A.; Pennington, M.W. Assignment of the three disulfide bonds in ShK toxin, a potent potassium channel blocker from the sea anemone Stichodactyla helianthus. Lett. Pept. Sci. 1994, 1, 291–297. [Google Scholar]
- Kalman, K.; Pennington, M.W.; Lanigan, M.D.; Nguyen, A.; Rauer, H.; Mahnir, V.; Paschetto, K.; Kem, W.R.; Grissmer, S.; Gutman, G.A. ShK-Dap22, a potent Kv1.3-specific immunosuppressive polypeptide. J. Biol. Chem. 1998, 273, 32697–32707. [Google Scholar]
- Beeton, C.; Pennington, M.; Wulf, H.; Singh, S.; Nugent, D.; Crossley, G.; Khaytin, I.; Calabresi, P.A.; Chen, C.Y.; Gutman, G.A.; Chandy, K.G. Targeting effector memory T cells with a selective peptide inhibitor of Kv1.3 channels for therapy of autoimmune diseases. Mol. Pharmacol. 2005, 67, 1369–1381. [Google Scholar]
- Pennington, M.W.; Beeton, C.; Galea, C.A.; Smith, B.J.; Chi, V.; Monaghan, K.P.; Garcia, A.; Rangaraju, S.; Giuffrida, A.; Plank, D.; et al. Engineering a stable and selective peptide blocker of the Kv1.3.3 channel in T lymphocytes. Mol. Pharmacol. 2009, 75, 762–773. [Google Scholar]
- Rauer, H.; Pennington, M.; Cahalan, M.; Chandy, K.G. Structural conservation of the pores of calcium-activated and voltage-gated potassium channels determined by a sea anemone toxin. J. Biol. Chem. 1999, 274, 21885–21892. [Google Scholar]
- Terlau, H.; Shon, K.J.; Grilley, M.; Stocker, M.; Stuhmer, W.; Olivera, B.M. Strategy for rapid immobilization of prey by a fish-hunting marine snail. Nature 1996, 381, 148–151. [Google Scholar]
- Shon, K.J.; Stocker, M.; Terlau, H.; Stuhmer, W.; Jacobsen, R.; Walker, C.; Grilley, M.; Watkins, M.; Hillyard, D.R.; Gray, W.R.; Olivera, B.M. κ-Conotoxin PVIIA is a peptide inhibiting the Shaker K+ channel. J. Biol. Chem. 1998, 273, 33–38. [Google Scholar]
- Jacobsen, R.B.; Koch, E.D.; Lange-Malecki, B.; Stocker, M.; Verhey, J.; van Wagoner, R.M.; Vyazovkina, A.; Olivera, B.M.; Terlau, H. Single amino acid substitutions in κ-conotoxin PVIIA disrupt interaction with the Shaker K+ channel. J. Biol. Chem. 2000, 275, 24639–24644. [Google Scholar]
- Garcia, E.; Scanlon, M.; Naranjo, D. A marine snail neurotoxin shares with scorpion toxins a convergn et mechanism of blockade on the pore of voltage-gated K channels. J. Gen. Physiol. 1999, 114, 141–157. [Google Scholar]
- Terlau, H.; Boccaccio, A.; Olivera, B.M.; Conti, F. The block of Shaker K+ channels by κ-conotoxin PVIIA is state dependent. J. Gen. Physiol. 1999, 114, 125–140. [Google Scholar]
- Boccaccio, A.; Conti, F.; Olivera, B.M.; Terlau, H. Binding of κ-conotoxin PVIIA to Shaker K+ channels reveals different K+ and Rb+ occupancies with the ion channel pore. J. Gen. Physiol. 2004, 124, 71–81. [Google Scholar]
- Olivia, C.; Gonzalez, V.; Naranjo, D. Slow inactivation in voltage gated potassium channels is insensitive to the binding of pore occluding peptide toxins. Biophys. J. 2005, 89, 1009–1019. [Google Scholar]
- Jouirou, B.; Mouhat, S.; Andreotti, N.; de Waard, M.; Sabatier, J.M. Toxin determinants required for interaction with voltage-gated K+ channels. Toxicon 2004, 43, 909–914. [Google Scholar]
- Rodriguez de la Vega, R.C.; Possani, L.D. Current views on scorpion toxins specific for K+-channels. Toxicon 2004, 43, 865–875. [Google Scholar]
- Zhang, X.; Ren, W.; DeCaen, P.; Yan, C.; Tao, X.; Tang, L.; Wang, J.; Hasegawa, K.; Kumasaka, T.; He, J.; et al. Crystal structure of an orthologue of the NaChBac voltage-gated sodium channel. Nature 2012, 486, 130–134. [Google Scholar]
- Payandeh, J.; Scheuer, T.; Zheng, N.; Catterall, W.A. Crystal structure of a voltage-gated sodium channel in two potentially inactivated states. Nature 2012, 486, 135–139. [Google Scholar]
- Tikhonov, D.B.; Zhorov, B.S. Modeling P-loops domain of sodium channel: Homology with potassium channels and interaction with ligands. Biophys. J. 2005, 88, 184–197. [Google Scholar] [CrossRef]
- Choudhary, G.; Aliste, M.P.; Tieleman, D.P.; French, R.J.; Dudley, S.C., Jr. Docking of μ-conotoxin GIIIA in the sodium channel outer vestibule. Channels 2007, 1, 344–352. [Google Scholar]
- Fozzard, H.A.; Lipkind, G.M. The tetrodotoxin binding site is within the outer vestibule of the sodium channel. Mar. Drugs 2010, 8, 219–234. [Google Scholar]
- Tikhonov, D.B.; Zhorov, B.S. Architecture and pore block of eukaryotic voltage-gated sodium channels in view of NavAb bacterial sodium channel structure. Mol. Pharmacol. 2012, 82, 97–104. [Google Scholar]
- Cruz, L.J.; Gray, W.R.; Olivera, B.M.; Zeikus, R.D.; Kerr, L.; Yoshikami, D.; Moczydlowski, E. Conus geographus toxins that discriminate between neuronal and muscle sodium channels. J. Biol. Chem. 1985, 260, 9280–9288. [Google Scholar]
- Sato, K.; Ishida, Y.; Wakamatsu, K.; Kato, R.; Honda, H.; Ohizumi, Y.; Nakamura, H.; Ohya, M.; Lancelin, J.M.; Kohda, D.; et al. Active site of μ-conotoxin GIIIA, a peptide blocker of muscle sodium channels. J. Biol. Chem. 1991, 266, 16989–16991. [Google Scholar]
- Becker, S.; Prusak-Sochaczewski, E.; Zamponi, G.; Beck-Sickinger, A.G.; Gordon, R.D.; French, R.J. Action of derivatives of μ-conotoxin GIIIA on sodium channels. Biochemistry 1992, 31, 8229–8238. [Google Scholar]
- Chang, N.S.; French, R.J.; Lipkind, G.M.; Fozzard, H.A.; Dudley, S., Jr. Predominant interactions between μ-conotoxin Arg-13 and the skeletal muscle Na+ channel localized by mutant cycle analysis. Biochemistry 1998, 37, 4407–4419. [Google Scholar]
- Dudley, S.C., Jr.; Chang, N.; Hall, J.; Lipkind, G.; Fozzard, H.A.; French, R.J. μ-Conotoxin GIIIA interactions with the voltage-gated Na+ channel predict a clockwise arrangement of the domains. J. Gen. Physiol. 2000, 116, 679–690. [Google Scholar]
- Li, R.A.; Ennis, I.L.; French, R.J.; Dudley, S.C., Jr.; Tomaselli, G.F.; Marban, E. Clockwise domain arrangement of the sodium channel revealed by μ-conotoxin (GIIIA) docking orientation. J. Biol. Chem. 2001, 276, 11072–11077. [Google Scholar]
- Hui, K.; Lipkind, G.; Fozzard, H.A.; French, R.J. Electrostatic and steric contributions to block of the skeletal muscle sodium channel by μ-conotoxin. J. Gen. Physiol. 2002, 119, 45–54. [Google Scholar]
- Xue, T.; Ennis, I.L.; Sato, K.; French, R.J.; Li, R.A. Novel interactions identified between μ-conotoxin and the Na+ channel domain I P-loop: Implications for toxin-pore binding geometry. Biophys. J. 2003, 85, 2299–2310. [Google Scholar]
- Wakamatsu, K.; Kohda, D.; Hatanaka, H.; Lancelin, J.M.; Ishida, Y.; Oya, M.; Nakamura, H.; Inagaki, F.; Sato, K. Structure-activity relationships of μ-conotoxin GIIIA: Structure determination of active and inactive sodium channel blocker peptides by NMR and simulated annealing calculations. Biochemistry 1992, 31, 12577–12584. [Google Scholar]
© 2013 by the authors; licensee MDPI, Basel, Switzerland. This article is an open access article distributed under the terms and conditions of the Creative Commons Attribution license (http://creativecommons.org/licenses/by/3.0/).
Share and Cite
Rashid, M.H.; Mahdavi, S.; Kuyucak, S. Computational Studies of Marine Toxins Targeting Ion Channels. Mar. Drugs 2013, 11, 848-869. https://doi.org/10.3390/md11030848
Rashid MH, Mahdavi S, Kuyucak S. Computational Studies of Marine Toxins Targeting Ion Channels. Marine Drugs. 2013; 11(3):848-869. https://doi.org/10.3390/md11030848
Chicago/Turabian StyleRashid, M. Harunur, Somayeh Mahdavi, and Serdar Kuyucak. 2013. "Computational Studies of Marine Toxins Targeting Ion Channels" Marine Drugs 11, no. 3: 848-869. https://doi.org/10.3390/md11030848