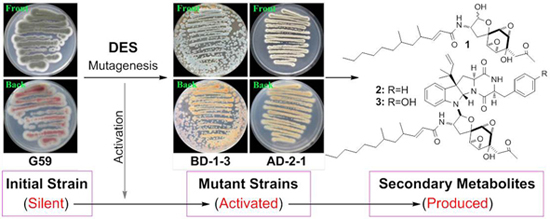
A Practical Strategy to Discover New Antitumor Compounds by Activating Silent Metabolite Production in Fungi by Diethyl Sulphate Mutagenesis

Abstract
:
1. Introduction

2. Results and Discussions
2.1. Modification of the DES Mutagenesis Procedure
2.2. DES Mutagenesis and Mutant Selection

| Groups | DES% (v/v) | Treatment Times at 4 °C | Dilution Ratio a |
|---|---|---|---|
| 20% (v/v) DMSO | 0.5, 1, 2 | 1–30 days | OSS:DMSO = 4:1 |
| 50% (v/v) DMSO | 0.5, 1, 2 | 1–30 days | OSS:DMSO = 1:1 |
| DMSO% (v/v) | DES% (v/v) | Numbers of Mutants Selected on the Days of DES-Treatment at 4 °C | ||||||
|---|---|---|---|---|---|---|---|---|
| 1st Day | 2nd Day | 7th Day | 10th Day | 15th Day | 30th Day | Total | ||
| 20% | 0.5 | 2 | 1 | 2 | 2 | 1 | 1 | 9 |
| 1 | 1 | 2 | 1 | 2 | NC | NC | 6 | |
| 2 | 1 | 1 | 1 | 2 | 1 | 1 | 7 | |
| Sum | 4 | 4 | 4 | 6 | 2 | 2 | 22 | |
| 50% | 0.5 | 2 | 2 | NC | 2 | 1 | NC | 7 |
| 1 | 2 | 2 | 1 | 3 | 1 | NC | 9 | |
| 2 | 2 | NC | 1 | 1 | NC | NC | 4 | |
| Sum | 6 | 4 | 2 | 6 | 2 | 0 | 20 | |
| Total | 10 | 8 | 6 | 12 | 4 | 2 | 42 | |
2.3. Estimation of Activated Production of Silent Metabolites by DES Mutagenesis by Bioassays
2.4. Chromatographic Analysis of Metabolite Production Induced by DES Mutagenesis
2.5. Isolation of 1–5 in the Mutant BD-1-3 Extract and Identification of the Known Compound 5
| Strain | Condition for Treating G59 Spores to Select Mutant | IR% at 100 µg/mL(Mean ± SD, n = 3) | ||
|---|---|---|---|---|
| DMSO% (v/v) | DES% (v/v) | Time (day) | ||
| G59 | — | — | — | 5.6 ± 3.5 |
| BD-1-1 | 20 | 0.5 | 10 | 43.7 ± 5.4 |
| BD-1-3 | 0.5 | 1 | 58.1 ± 3.6 | |
| BD-1-5 | 0.5 | 2 | 46.6 ± 18.8 | |
| BD-1-5′ | 1.0 | 10 | 43.9 ± 7.4 | |
| BD-1-6 | 0.5 | 7 | 49.0 ± 14.1 | |
| BD-2-5 | 1.0 | 7 | 44.3 ± 17.1 | |
| BD-3-1 | 2.0 | 1 | 55.8 ± 2.0 | |
| BD-3-5 | 2.0 | 7 | 32.6 ± 20.2 | |
| BD-1m-1 | 0.5 | 10 | 43.9 ± 25.0 | |
| BD-2m-2 | 1.0 | 10 | 47.0 ± 12.8 | |
| BD-3m-1 | 2.0 | 10 | 40.8 ± 11.1 | |
| BD-3m-2 | 2.0 | 10 | 38.3 ± 15.9 | |
| BD-1n-1 | 0.5 | 15 | 65.5 ± 20.5 | |
| BD-3n-1 | 2.0 | 15 | 55.5 ± 9.3 | |
| BD-3p-1 | 2.0 | 30 | 52.2 ± 11.6 | |
| AD-1-1 | 50 | 0.5 | 1 | 38.7 ± 17.5 |
| AD-1-2 | 0.5 | 1 | 47.4 ± 23.9 | |
| AD-1-5 | 0.5 | 1 | 44.9 ± 23.1 | |
| AD-2-1 | 1.0 | 1 | 49.8 ± 17.9 | |
| AD-2-2 | 1.0 | 1 | 44.7 ± 21.8 | |
| AD-2-3 | 1.0 | 2 | 37.3 ± 23.8 | |
| AD-2-4 | 1.0 | 2 | 38.5 ± 25.0 | |
| AD-2-5 | 0.5 | 1 | 27.9 ± 15.5 | |
| AD-1m-1 | 1.0 | 1 | 37.3 ± 9.1 | |
| AD-1m-2 | 0.5 | 10 | 41.3 ± 27.9 | |
| AD-2m-1 | 1.0 | 1 | 36.4 ± 7.7 | |
| AD-2m-2 | 1.0 | 2 | 47.6 ± 1.9 | |
| AD-2m-3 | 1.0 | 10 | 44.2 ± 29.7 | |
| AD-3m-1 | 2.0 | 10 | 53.7 ± 5.1 | |
| AD-1n-1 | 0.5 | 15 | 52.9 ± 13.2 | |
| AD-2n-1 | 1.0 | 2 | 40.4 ± 1.8 | |
2.6. Experimental Verification for the Newly Produced 1–5 in the Mutant BD-1-3 Extract
2.7. Structure Elucidation of New Compounds 1–4
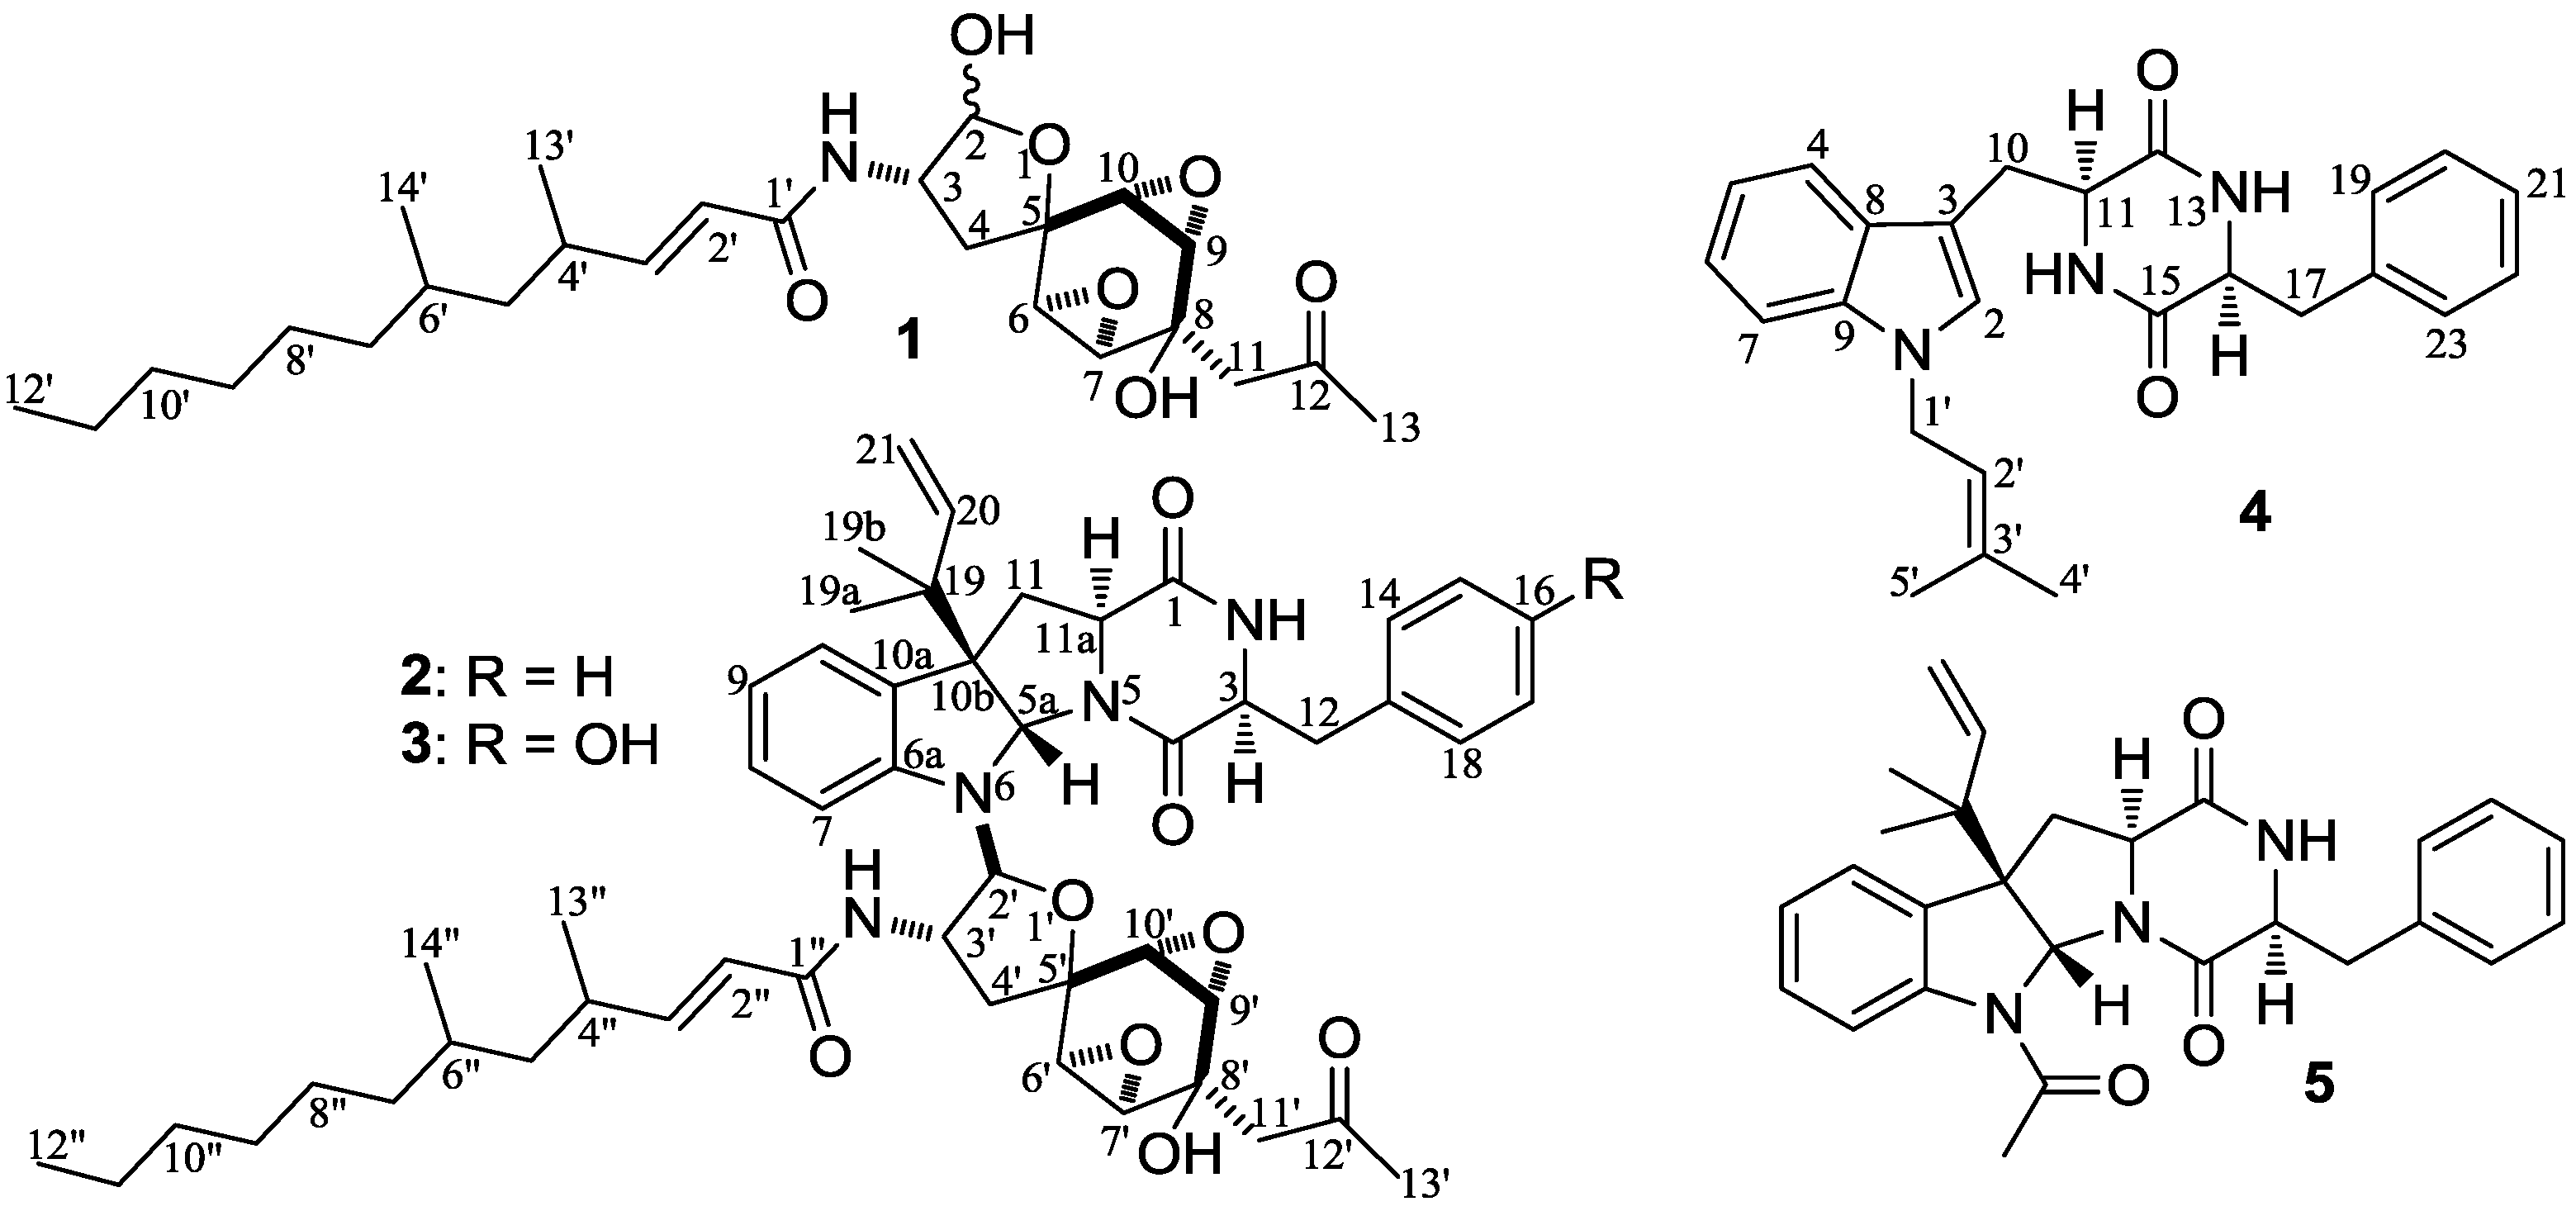
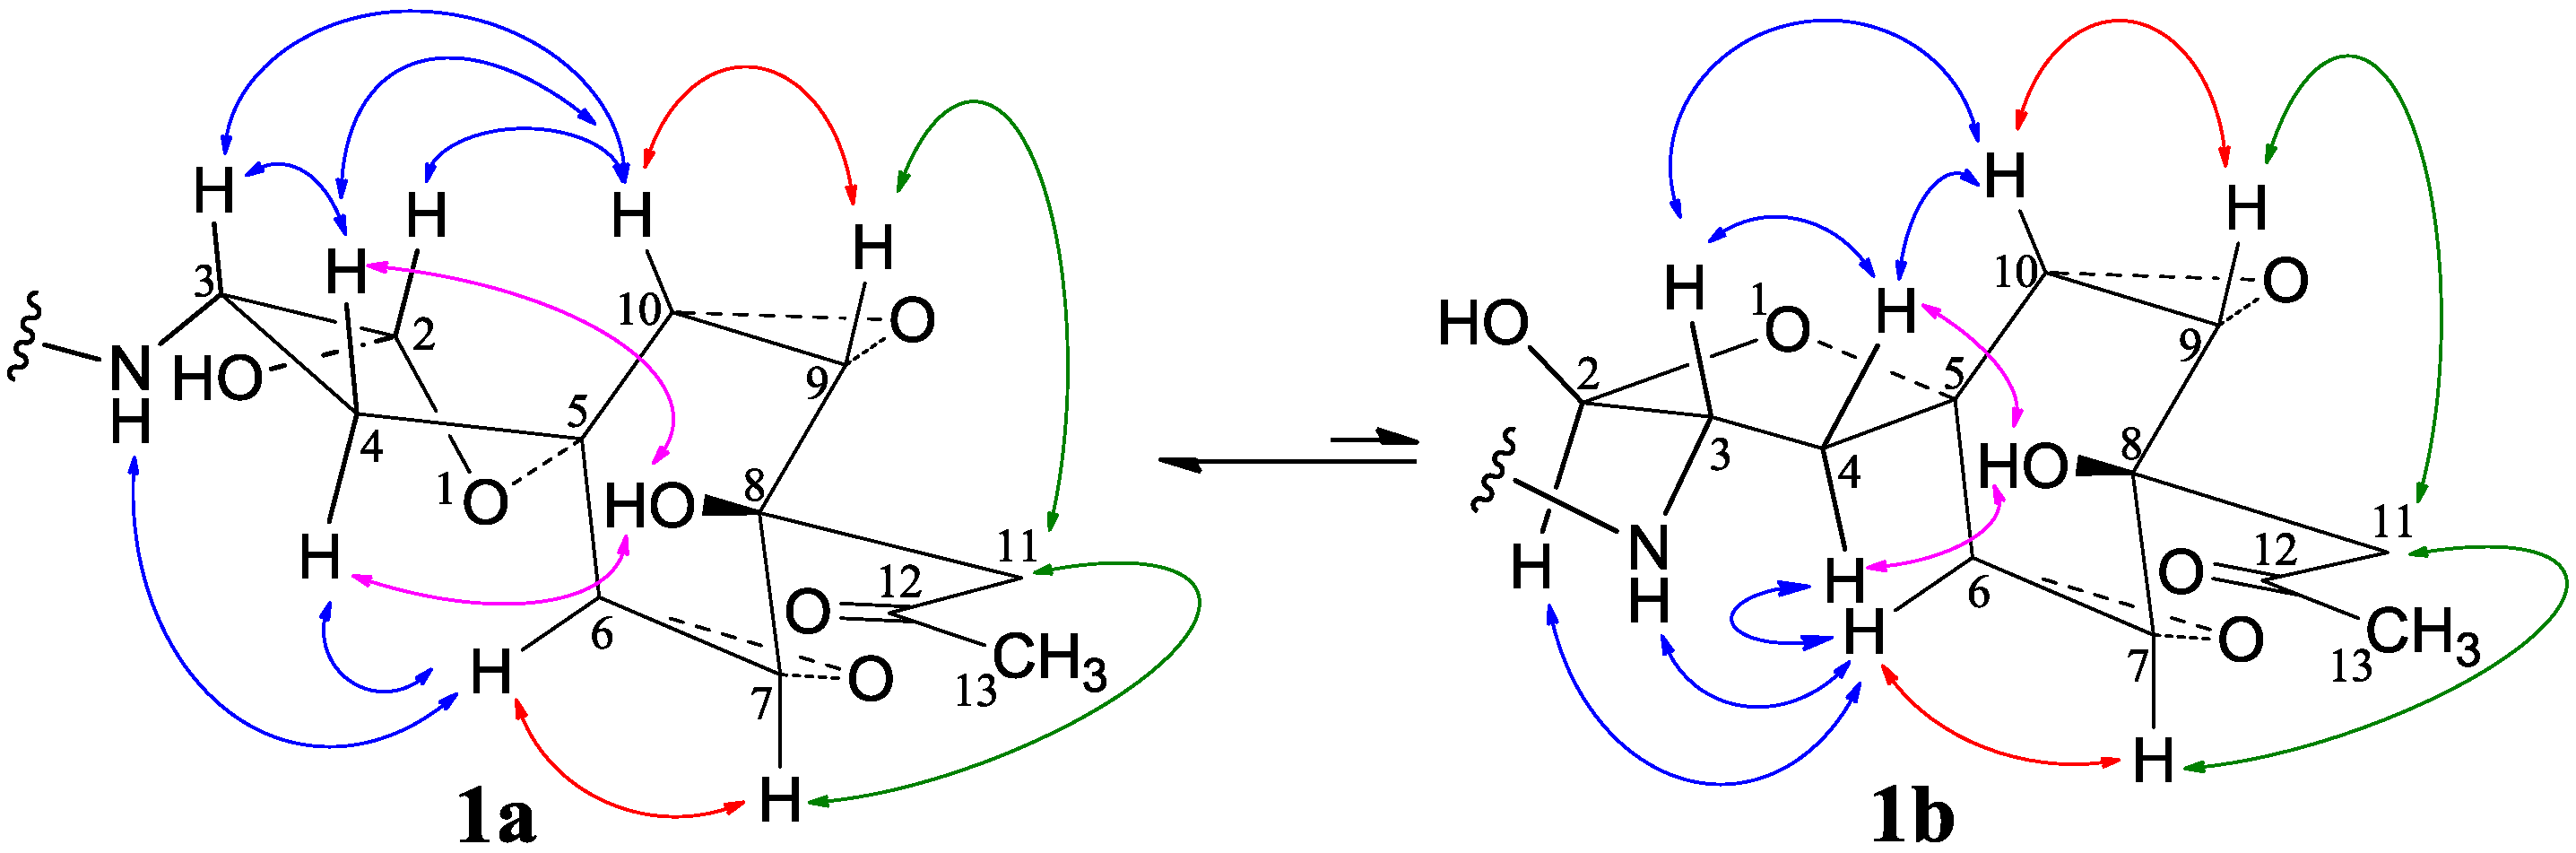
 −11.9 (c 1.0, MeOH), had the molecular formula C26H41NO7 by HRESIMS. The UV spectrum showed an end absorption at 215 nm (log ε 4.21) in MeOH, and the IR spectrum showed absorptions due to OH, CH3/CH2, C=O, NHCO, and C=C groups (see the IR spectrum in the SI). The NMR spectra gave two sets of 1H/13C signals in approximate ratios of 6.3:1 in CDCl3 and 1.8:1 in CD3OD. The ratio in CDCl3 changed from approximate 5.5:1 in the 1H-NMR spectrum measured soon after dissolving 1 in CDCl3 to the approximate ratio of 6.3:1 in the 1H-NMR spectrum measured after over a week in the CDCl3 solution, which appeared along with disappearance of two hydroxyl proton signals. These observations revealed the presence of dynamic isomerism in the solutions, which made the NMR spectra complicated, especially the 1H-NMR spectrum. Exhaustive analyses of the 1H and 13C-NMR spectra with the aid of DEPT, GOESY, 1H-1H COSY, HMQC, HMBC, and NOESY techniques resulted in the full signal assignments for the major isomer 1a and the miner isomer 1b both in CDCl3 (Table 4 and Table S1 in the SI) and CD3OD (Table S2 in the SI).
| No. | 1a (2,3-cis) | 1b (2,3-trans) | |||||||||||||
| δCb,c | δHb (J in Hz) | COSY d | NOE e | HMBC f | δCb,c | δHb (J in Hz) | COSY d | NOE e | HMBC f | ||||||
| 2 | 96.45 s | 5.55 t (4.3) | H-3, NH, Hα-4 | 2-OH, H-3,10, NH, Hβ-4 | C-3,4,5 | 102.61 s | 5.57 br d (3.7) | H-3, Hα-4 | 2-OH, H-3,6, NH, Hα-4 | C-3,4,5 | |||||
| 2-OH | — | 4.98 g br s | H-2 | — | 4.80 g br s | H-2 | |||||||||
| 3 | 52.11 d | 4.72 dtd (10.7, 8.4, 4.3) | H-2, NH, H2-4 | H-2, NH, Hβ-4, H-10 | C-2,4,1′ | 57.21 d | 4.59 m | H-2, NH, H2-4 | H-2, NH, Hβ-4, H-10 | C-2,5,1′ | |||||
| NH | — | 6.06 br d (8.0) | H-2, H-3 | H-2,3,6, Hα,β-4, H-2′ | C-2,3,1′,2′ | — | 5.95 br s | H-3 | H-2,3,6, Hα,β-4, H-2′ | ||||||
| 4 | 37.06 t | Hβ 2.58 dd (12.9, 8.4) Hα 2.00 ddd (12.9, 10.7, 4.3) | H-3, Hα-4 H-2, H-3, Hβ-4 | H-2,3, NH, Hα-4, H-10 NH, Hβ-4, H-6 | C-2,3,6,10 C-3,5,6,10 | 38.50 t | Hβ 2.63 br dd (12.5, 6.2) Hα 2.16 br d (12.5) | H-3, Hα-4 H-2, H-3, Hβ-4 | H-3, NH, Hα-4, H-10 H-2, NH, Hβ-4, H-6 | C-2,3,5,6,10 C-2,3,6,10 | |||||
| 5 | 79.05 s | — | — | — | — | 80.45 s | — | — | — | — | |||||
| 6 | 59.37 d | 3.31 dd (3.2, 2.6) | H-7, H-10 | NH, Hα-4 | C-4,5,7,10 | 59.55 d | 3.36 br s | H-7, H-10 | H-2, NH, Hα-4 | C-7,10 | |||||
| 7 | 58.63 d | 3.25 dd (3.3, 2.5) | H-6, H-9 | H2-11 | C-5,6,8,9,11 | 58.63 d | 3.25 dd (3.2, 2.6) | H-6, H-9 | H2-11 | C-6,8,9 | |||||
| 8 | 66.37 s | — | — | — | — | 66.32 s | — | — | — | — | |||||
| 8-OH | — | 4.67 g br s | H2-11 | C-7,8,9,11 | — | 4.67 g br s | H2-11 | C-7,8,9,11 | |||||||
| 9 | 58.08 d | 3.27–3.23 m | H-7, H-10 | H2-11 | C-5,7,8,10,11 | 58.29 d | 3.27-3.23 m | H-7, H-10 | H2-11 | C-7,8,10 | |||||
| 10 | 57.42 d | 3.19 dd (3.2, 2.5) | H-6, H-9 | H-2, H-3, Hβ-4 | C-4,5,6,9 | 57.81 d | 3.16 br s | H-6, H-9 | H-3, Hβ-4 | C-6,9 | |||||
| 11 | 47.29 t | Ha 3.09 d (18.1) Hb 3.05 d (18.1) | H3-13 H3-13 | H-7,9, HO-8, H3-13 H-7,9, HO-8, H3-13 | C-7,8,9,12 C-7,8,9,12 | 47.33 t | Ha 3.09 d (18.1) Hb 3.05 d (18.1) | H3-13 H3-13 | H-7,9, HO-8, H3-13 H-7,9, HO-8, H3-13 | C-7,8,9,12 C-7,8,9,12 | |||||
| 12 | 210.89 s | — | — | — | — | 210.86 s | — | — | — | — | |||||
| 13 | 31.65 q | 3H 2.28 s | H2-11 | H2-11 | C-11,12 | 31.67 q | 3H 2.26 s | H2-11 | H2-11 | C-11,12 | |||||
| 1′ | 166.12 s | — | — | — | — | 166.16 s | — | — | — | — | |||||
| 2′ | 121.41 d | 5.76 d (15.3) | H-3′, H-4′ | NH, H-4′, H3-13′ | C-1′,3′,4′ | 121.19 d | 5.74 d (15.0) | H-3′, H-4′ | NH, H-4′, H3-13′ | C-1′,4′ | |||||
| 3′ | 151.30 d | 6.73 br dd (15.3, 8.3) | H-2′, H-4′, H3-13′ | H-4′, Ha-5′, H3-13′ | C-1′,2′,4′,5′,13′ | 151.67 d | 6.74 br dd (15.0, 8.0) | H-2′, H-4′, H3-13′ | H-4′, Ha-5′, H3-13′ | C-1′,2′,4′,5′,13′ | |||||
| 4′ | 34.13 d | 2.44–2.33 m | H-2′,3′, H2-5′, H3-13′ | H-2′,3′, H2-5′, H3-13′,14′ | C-2′,3′,5′,6′,13′ | 34.11 d | 2.12-2.04 m | H-2′,3′, H2-5′,H3-13′ | H-2′,3′, H2-5′, H3-13′, 14′ | C-2′,3′,5′,6′,13′ | |||||
| 5′ | 44.05 t | Ha 1.39–1.33 m
Hb 1.14–1.07 m | H-4′, Hb-5′, H-6′ H-4′, Ha-5′, H-6′ | H-4′ H-4′ | C-3′,4′,6′,7′,13′,14′ C-3′,4′,6′,7′,13′,14′ | 44.05 t | Ha 1.39–1.33 m
Hb 1.14–1.07 m | H-4′, Hb-5′, H-6′ H-4′, Ha-5′, H-6′ | H-4′ H-4′ | C-3′,4′,6′,7′,13′,14′ C-3′,4′,6′,7′,13′,14′ | |||||
| 6′ | 30.45 d | 1.44‒1.36 m | H2-5′, H2-7′, H3-14′ | C-4′,5′,7′,8′,14′ | 30.45 d | 1.44‒1.36 m | H2-5′, H2-7′, H3-14′ | C-4′,5′,7′,8′,14′ | |||||||
| 7′ | 37.42 t | Ha 1.27–1.18 m Hb 1.11–1.05 m | H-6′, Hb-7′, H2-8′ H-6′, Ha-7′, H2-8′ | C-5′,6′,8′,9′,14′ C-5′,6′,8′,9′,14′ | 37.38 t | Ha 1.27–1.18 m Ha 1.11–1.05 m | H-6′, Hb-7′, H2-8′ H-6′, Ha-7′, H2-8′ | C-5′,6′,8′,9′,14′ C-5′,6′,8′,9′,14′ | |||||||
| 8′ | 26.84 t | 2H 1.28–1.21 m | H2-7′, H2-9′ | C-6′,7′,9′,10′ | 26.84 t | 2H 1.28–1.21 m | H2-7′, H2-9′ | C-6′,7′,9′,10′ | |||||||
| 9′ | 29.71 t | 2H 1.27-1.18 m | H2-8′, H2-10′ | C-7′,8′,10′,11′ | 29.71 t | 2H 1.27–1.18 m | H2-8′, H2-10′ | C-7′,8′,10′,11′ | |||||||
| 10′ | 31.93 t | 2H 1.28–1.21 m | H2-9′, H2-11′ | C-8′,9′,11′,12′ | 31.93 t | 2H 1.28–1.21 m | H2-9′, H2-11′ | C-8′,9′,11′,12′ | |||||||
| 11′ | 22.67 t | 2H 1.31–1.26 m | H2-10′, H3-12′ | C-9′,10′,12′ | 22.67 t | 2H 1.32–1.28 m | H2-10′, H3-12′ | C-9′,10′,12′ | |||||||
| 12′ | 14.08 q | 0.88 t (7.0) | H2-11′ | C-10′,11′ | 14.08 q | 0.83 t (7.0) | H2-11′ | C-10′,11′ | |||||||
| 13′ | 20.47 q | 1.03 dd (6.6, 0.8) | H-3′, H-4′ | H-2′,3′, 4′ | C-3′,4′,5′ | 20.43 q | 1.01 d (6.6) | H-4′ | H-2′,3′, 4′ | C-3′,4′,5′ | |||||
| 14′ | 19.56 q | 0.84 d (6.4) | H-6′ | H-4′ | C-5′,6′,7′ | 20.41 q | 0.82 d (6.4) | H-6′ | H-4′ | C-5′,6′,7′ | |||||
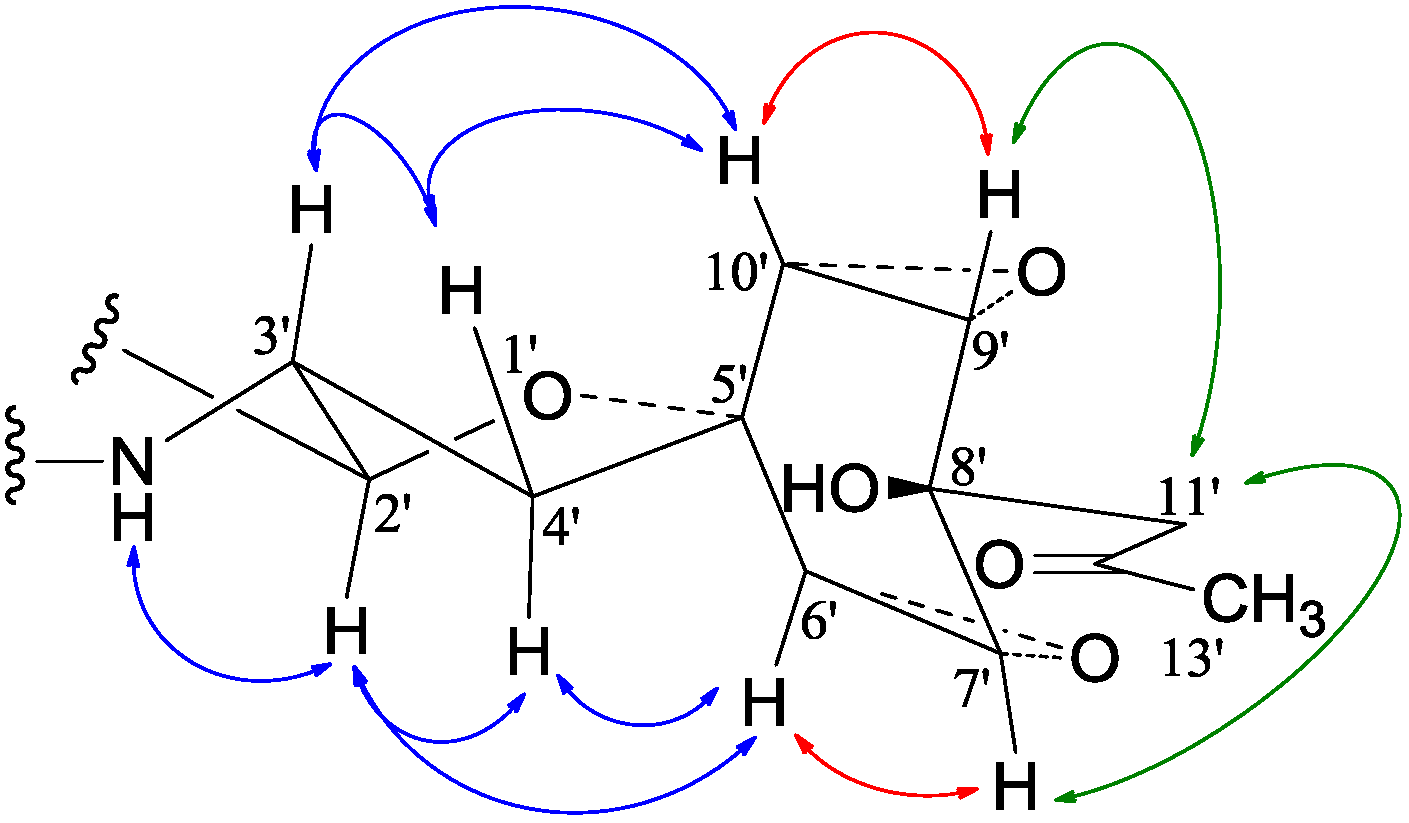
 −99.7 (c 0.5, MeOH) for 2 and mp 125–126 °C, −65.8 (c 0.2, MeOH) for 3. The molecular formulae, C51H66N4O8 for 2 and C51H66N4O9 for 3, were assigned by HRESIMS. The UV absorptions of 2 [λmax nm (log ɛ) in MeOH: 298 (3.47), 244 (4.10) and 209 (4.69)] and 3 [λmax nm (log ɛ) in MeOH: 297 (3.42), 243sh and 209 (4.64)] revealed the presence of an indoline chromophore [41,46,47,48,49,50]. Their IR spectra closely resembled each other and showed absorption bans due to OH/NH, CH3/CH2, and CO/NHCO groups (IR spectra in the SI). The NMR spectra of 2 in CDCl3 showed two sets of 1H and 13C signals (Table 5): One set was similar to those of 1 and the other set resembled signals from 5, although it lacked COCH3 signals [41]. Analyses of the 1H and 13C-NMR spectra with the DEPT, GOESY, 1H-1H COSY, HMQC, and HMBC techniques (Table S3 in the SI) established two structural parts in 2: The down-half part corresponding to 1 and the up-half part corresponding to the skeletal unit of 5 (Figure 1). The connection of the two structural parts between N-6 and C-2′ was established by the HMBCs on H-5a/C-2′, H-2′/C-5a, and H-2′/C-6a. Thus, the planar structure of 2 was deduced. The 1H and 13C-NMR spectra of 3 in CDCl3 closely resembled those of 2 except an additional hydroxyl proton 16-OH signal was detected. There were also changes in several 1H and 13C signals ascribed to the benzene ring numbered 13–18 (Table 5). These data revealed that 3 is a hydroxylated derivative of 2, and this was confirmed by analyses of the DEPT, GOESY, 1H–1H COSY, HMQC, and HMBC spectra (Table S4 in the SI). The 16-OH group in 3 was eventually attached to C-16 by the NOEs on 16-OH/H-15 and 16-OH/H-17 to complete its planar structure.
| No. | 2 | 3 | ||
|---|---|---|---|---|
| δC | δH (J in Hz) | δC | δH (J in Hz) | |
| 1 | 167.9 s | — | 168.2 s | — |
| 2 (NH) | — | 5.702 s | — | 5.99 br s |
| 3 | 56.1 d | 4.30 ddd (9.3, 3.3, 1.4) | 56.2 d | 4.22 ddd (8.7, 3.4, 1.3) |
| 4 | 164.1 s | — | 164.1 s | — |
| 5a | 79.8 d | 5.96 br s | 79.4 d | 5.96 br s |
| 6a | 148.1 s | — | 148.2 s | — |
| 7 | 108.8 d | 6.71 d (7.5) | 108.6 d | 6.70 d (7.8) |
| 8 | 128.8 d | 7.10 td (7.5, 0.8) | 128.8 d | 7.10 td (7.8, 0.9) |
| 9 | 119.8 d | 6.78 t (7.5) | 119.8 d | 6.77 t (7.8) |
| 10 | 125.3 d | 7.13 br d (7.5) | 125.3 d | 7.13 br d (7.8) |
| 10a | 130.0 s | — | 130.0 s | — |
| 10b | 60.7 s | — | 60.7 s | — |
| 11 | 38.4 t | Hα 2.45 dd (12.2, 5.5) Hβ 2.14 dd (12.2, 11.6) | 38.5 t | Hα 2.42 dd (12.3, 5.5) Hβ 2.089 dd (12.3, 11.5) |
| 11a | 58.6 d | 3.95 ddd (11.6, 5.5, 1.4) | 58.3 d | 3.92 ddd (11.5, 5.5, 1.3) |
| 12 | 37.5 t | Ha 3.37 dd (14.4, 3.3) Hb 2.90 dd (14.4, 9.3) | 36.7 t | Ha 3.20 dd (14.4, 3.4) Hb 2.86 dd (14.4, 8.7) |
| 13 | 135.4 s | — | 126.6 s | — |
| 14 | 129.2 d | 7.17 br d (7.2) | 130.5 d | 6.99 d (8.6) |
| 15 | 129.3 d | 7.31 br t (7.2) | 116.1 d | 6.76 d (8.6) |
| 16 | 127.6 d | 7.26 br t (7.2) | 155.5 d | — |
| 16-OH | — | — | — | 6.55 br s |
| 17 | 129.3 d | 7.31 br t (7.2) | 116.1 d | 6.76 d (8.6) |
| 18 | 129.2 d | 7.17 br d (7.2) | 130.5 d | 6.99 d (8.6) |
| 19 | 41.1 s | — | 41.1 s | — |
| 19a | 22.2 q | 1.03 s | 22.2 q | 1.02 s |
| 19b | 23.0 q | 0.96 s | 23.0 q | 0.94 s |
| 20 | 143.4 d | 5.90 dd (17.3, 10.9) | 143.4 d | 5.88 dd (17.4, 10.7) |
| 21 | 114.6 t | H cis 5.11 d (10.9)Htrans 5.06 d (17.3) | 114.6 t | H cis 5.10 d (10.7)Htrans 5.04 d (17.4) |
| 2′ | 89.9 d | 5.69 d (9.5) | 89.8 d | 5.67 d (9.0) |
| 3′ | 49.7 d | 5.55 br s | 49.5 d | 5.59 br s |
| 3′-NH | — | 6.13 br s | — | 6.21 br s |
| 4′ | 38.2 t | Hα 2.12 dd (13.5, 9.6)Hβ 2.76 dd (13.5, 8.8) | 38.1 t | Hα 2.096 dd (13.3, 9.7)Hβ 2.69 dd (13.3, 8.5) |
| 5′ | 74.7 s | — | 74.6 s | — |
| 6′ | 57.4 d | 3.40 dd (3.3, 2.7) | 57.4 d | 3.38 dd (3.3, 2.7) |
| 7′ | 58.3 d | 3.29 dd (3.4, 3.3) | 58.3 d | 3.28 dd (3.4, 3.3) |
| 8′ | 66.4 s | — | 66.4 s | — |
| 8′-OH | — | 4.63 s | — | 4.66 br s |
| 9′ | 57.9 d | 3.23 dd (3.4, 3.2) | 57.9 d | 3.22 dd (3.4, 3.2) |
| 10′ | 57.6 d | 3.50 dd (3.2, 2.7) | 57.6 d | 3.47 dd (3.2, 2.7) |
| 11′ | 47.1 t | 2H 3.07 s | 47.1 t | 2H 3.06 s |
| 12′ | 211.2 s | — | 211.1 s | — |
| 13′ | 31.7 q | 3H 2.27 s | 31.7 q | 3H 2.26 s |
| 1" | 166.2 s | — | 166.4 s | — |
| 2" | 121.2 d | 5.70 br d (15.3) | 121.1 d | 5.70 br d (15.2) |
| 3" | 151.4 d | 6.73 dd (15.3, 8.4) | 151.6 d | 6.73 dd (15.2, 8.2) |
| 4" | 34.1 d | 2.40‒2.31 m | 34.1 d | 2.40‒2.31 m |
| 5" | 44.0 t | Ha 1.34‒1.30 mHb 1.12‒1.06 m | 44.0 t | Ha 1.34‒1.29 mHb 1.12‒1.06 m |
| 6" | 30.3 d | 2H 1.42‒1.34 m | 30.4 d | 2H 1.41‒1.32 m |
| 7" | 37.4 t | Ha 1.26‒1.15 mHb 1.08‒1.03 m | 37.4 t | Ha 1.26‒1.15 mHb 1.08‒1.03 m |
| 8" | 26.8 t | 2H 1.26‒1.15 m | 26.8 t | 2H 1.26‒1.15 m |
| 9" | 29.7 t | 2H 1.26‒1.15 m | 29.7 t | 2H 1.26‒1.15 m |
| 10" | 31.9 t | 2H 1.26‒1.15 m | 31.9 t | 2H 1.26‒1.15 m |
| 11" | 22.6 t | 2H 1.30‒1.24 m | 22.6 t | 2H 1.30‒1.24 m |
| 12" | 14.1 q | 3H 0.87 t (7.1) | 14.1 q | 3H 0.87 t (7.0) |
| 13" | 20.4 q | 3H 0.99 d (6.7) | 20.4 q | 3H 0.98 d (6.7) |
| 14" | 19.4 q | 3H 0.81 d (6.5) | 19.4 q | 3H 0.81 d (6.4) |
 −112.0 (c 0.025, MeOH), was assigned the molecular formula C25H27N3O2 by HRESIMS. The UV spectrum gave an absorption curve the same as that of cyclo-(l-Trp-l-Phe) [47]. The IR spectrum gave absorptions due to NHCO and CH3/CH2 groups. The 1H and 13C-NMR spectra of 4 in DMSO-d6 resembled those of cyclo-(l-Trp-l-Phe) except for the appearance of additional signals from an isoprenyl group instead of the NH proton H-1 signal [51]. Analyses of the 1H–1H COSY, HMQC, and HMBC spectra (Table 6) confirmed the structural parts of the cyclo-(Trp-Phe) unit and the isoprenyl group in 4. The isoprenyl group was linked to N-1 by the HMBCs on H2-1′/C-2 and H2-1′/C-9. Then, the stereochemistry of 4, including absolute configurations, was established as follows. The NOEs on H-11/H-14 in the NOESY spectrum indicated the spatial proximity of the two protons. This indicated that the diketopiperazine ring was in a boat conformation with the boat-head carbons C-11/C-14 carrying pseudo-axial H-11/H-14. In this boat conformation, the dihedral angles between H-11 and H-16 and H-13 and H-14 were 110–120°, which matched the couplings of H-11/H-16 (3JHH = 2.5 Hz) and H-13/H-14 (3JHH = 2.4 Hz) [52]. The absolute configuration of 4 was determined by CD data. The CD spectrum of 4 in MeOH showed positive Cotton effects at 230–240 nm and negative Cotton effects at 240–300 nm. The signs of the Cotton effects coincided well with those reported for cyclo-(l-Trp-l-Phe) [51]. Thus, the absolute configuration at C-11 and C-14 in 4 was defined as S,S, the same as cyclo-(l-Trp-l-Phe) [51].
| Position | δCb,c | δH (J in Hz) b | COSY d | NOE e | HMBC f |
|---|---|---|---|---|---|
| 2 | 127.5 d | 6.98 s | H2-10, H-11,16, 5′ | C-3, 8, 9 | |
| 3 | 108.3 s | — | — | — | — |
| 4 | 119.2 d | 7.49 br d (7.8) | H-5 | H2-10, H-11, 16 | C-3, 6, 8, 9 |
| 5 | 118.6 d | 7.01 ddd (7.8, 7.0, 0.9) | H-4, H-6 | C-7, 8 | |
| 6 | 121.0 d | 7.12 ddd (8.2, 7.0, 1.0) | H-5, H-7 | C-4, 9 | |
| 7 | 109.8 d | 7.34 br d (8.2) | H-6 | H-5′ | C-5, 8 |
| 8 | 128.1 s | — | — | — | — |
| 9 | 135.7 s | — | — | — | — |
| 10 | 29.6 t | Ha 2.78 dd (14.6, 4.3) Hb 2.51 dd (14.6, 5.6) | Hb-10, H-11 Ha-10, H-11 | H-2, 4, 16 H-2, 4 | C-2, 3, 8, 11 C-2, 3, 8, 11 |
| 11 | 55.3 d | 3.96 m | H2-10, H-16 | H-2, 4, 14, 16, H2-10 | |
| 12 | 166.8 s | — | — | — | — |
| 13 (NH) | — | 7.74 d (2.5) | H-14 | H-19, 23 | C-11, 15 |
| 14 | 55.6 d | 3.82 m | H2-17, H-13 | H-11 | |
| 15 | 166.2 s | — | — | — | — |
| 16 (NH) | — | 7.97 d (2.4) | H-11 | H-2, 4, Ha-10 | C-12, 14 |
| 17 | 40.0 t | Ha 2.44 dd (13.5, 4.5) Hb 1.83 dd (13.5, 7.0) | H-14, Hb-17 H-14, Ha-17 | H-19,23 H-19,23 | C-14, 18, 19, 23 C-14, 18, 19, 23 |
| 18 | 136.6 s | — | — | — | — |
| 19 | 129.7 d | 6.66 dd (7.4, 2.0) | H-20, H-21 | H-14, H2-17 | C-21, 23 |
| 20 | 128.0 d | 7.19–7.13 m | C-18, 22 | ||
| 21 | 126.4 d | 7.19–7.13 m | C-19, 23 | ||
| 22 | 128.0 d | 7.19–7.13 m | C-18, 20 | ||
| 23 | 129.7 d | 6.66 dd (7.4, 2.0) | H-21, H-22 | H-14, H2-17 | C-19, 21 |
| 1′ | 43.4 t | 2H 4.69 d (6.9) | H-2′, H-4′,5′ | C-2, 9, 2′, 3′ | |
| 2′ | 120.6 d | 5.25 br t (6.9) | H2-1′, H-4′,5′ | H-4′ | |
| 3′ | 135.1 s | — | — | — | — |
| 4′ | 25.3 q | 1.63 s | H2-1′, H-2′ | H-2′, H-5′ | C-2′, 3′, 5′ |
| 5′ | 17.8 q | 1.78 s | H2-1′, H-2′ | H-2,7, 4′ | C-2′, 3′, 4′ |
2.8. Inhibitory Effect of 1–5 on Several Human Cancer Cell Lines
| Compound | K562 | HL-60 | HeLa | BGC-823 | MCF-7 |
|---|---|---|---|---|---|
| 1 | 17.4 | 4.2 | 10.9 | 12.6 | 8.6 |
| 2 | 11.4 | 5.4 | 9.5 | 8.0 | 5.4 |
| 3 | 19.9 | 12.1 | 17.7 | 16.6 | 8.0 |
3. Experimental Section
3.1. General Experimental
3.2. MTT Assay
3.3. Activating Silent Metabolites in Penicillium purpurogenum G59 by DES Mutagenesis
3.3.1. Initial Strain and Preparation of the Spore Suspension
3.3.2. DES Mutagenesis of Strain G59 and Mutant Selection
3.3.3. Fermentation and Preparation of EtOAc Extract for MTT Assay and Chemical Analysis
3.3.4. HPLC-PDAD-UV Analysis of EtOAc Extracts of the G59 Strain and 31 Mutants
3.3.5. HPLC-ESI-MS Analysis of EtOAc Extracts of the G59 Strain and four Mutants
3.4. Experiments for Investigation on Compounds 1–5 from Mutant BD-1-3
3.4.1. Mutant Information
3.4.2. Large-Scale Fermentation and EtOAc Extract Preparation
3.4.3. Isolation of Compounds 1–5
3.4.4. Physicochemical and Spectroscopic Data of 1–5
−11.9 (c 1.0, MeOH). Positive ESI-MS m/z: 480 [M + H]+, 502 [M + Na]+, 518 [M + K]+; negative ESI-MS m/z: 524 [M + HCO2]−. Positive HR-ESI-MS m/z: measured 480.2974 [M + H]+, calculated for C26H42NO7 [M + H]+ 480.2961; measured 502.2793 [M + Na]+, calculated for C26H41NO7Na [M + Na]+ 502.2781; measured 518.2530 [M + K]+, calculated for C26H41NO7K [M + K]+ 518.2520. UV λmax nm (log ε) in MeOH: 215 (4.21). IR νmax cm−1 (diamond ATR crystal): 3314, 2935, 2869, 1701, 1669, 1625, 1510, 1459, 1421, 1377, 1363, 1326, 1269, 1151, 1124, 1038, 986, 933, 859, 735. CD ∆ε (nm) in MeOH: 0 (190.6), −1.12 (192.5), −1.07 (194.0), −1.37 (196.5), −1.82 (204.5), −2.21 (208.5), −2.13 (215), −2.07 (217.5), −1.89 (220.5), −1.04 (227.5), −0.25 (239.5), 0 (241.7), 0 (272.1), +0.18 (282.5), +0.15 (285.0), +0.18 (297), +0.16 (300.5), +0.15 (306.5), +0.29 (319.0), +0.29 (320.0), +0.26 (328.5), +0.27 (330.5), +0.34 (339.5), +0.37 (343.0), +0.44 (351.0), +0.29 (359.5), +0.27 (369.0), +0.24 (371.5), +0.22 (375.5), +0.32 (387.0), 0 (399.8). 1H and 13C-NMR data: in Table 4; see also Tables S1 and S2 in the SI. −99.7 (c 0.5, MeOH). Positive ESI-MS m/z: 863 [M + H]+, 885 [M + Na]+, 901 [M + K]+; negative ESI-MS m/z: 861 [M − H]−, 897 [M + Cl]−, 907 [M + HCO2]−. Positive HR-ESI-MS m/z: measured 863.4969 [M + H]+, calculated for C51H67N4O8 [M+H]+ 863.4959; measured 885.4780 [M + Na]+, calculated for C51H66N4O8Na [M + Na]+ 885.4778; measured 901.4518 [M + K]+, calculated for C51H66N4O8K [M + K]+ 901.4518. UV λmax nm (log ε) in MeOH: 298 (3.47), 244 (4.10), 209(4.69). IR νmax cm−1 (diamond ATR crystal): 3292, 3080, 2933, 2873, 1667, 1607, 1528, 1489, 1454, 1380, 1365, 1335, 1304, 1273, 1200, 1106, 1077, 1058, 1032, 983, 931, 895, 862, 815, 748, 703. CD ∆ε (nm) in MeOH: −11.26 (195.5), 0 (205.2), +2.66 (208.5), 0 (210.2), −16.80 (215.5), 0 (225.6), +3.32 (232.0), 0 (237.0), −17.80 (249.5), 0 (315.1), +0.41 (319.0), +0.42 (320.0), +0.39 (321.5), +0.53 (328.5), +0.55 (330.0), +0.50 (331.5), +0.61 (340.0), +0.65 (344.0), +0.70 (351.0), +0.38 (358.0), +0.40 (359.0), +0.37 (361.5), +0.48 (367.5), +0.49 (369.0), +0.48 (371.5), +0.48 (374.5), +0.48 (375.5), +0.24 (381.5), +0.57 (387.5), 0 (390.9), +0.12 (394.0), +0.17 (398.0), 0 (399.9). 1H and 13C-NMR data: in Table 5; see also Tables S3 in the SI. −65.8 (c 0.2, MeOH). Positive ESI-MS m/z: 879 [M + H]+; negative ESI-MS m/z: 877 [M − H]−, 913 [M + Cl]−. Positive HR-ESI-MS m/z: measured 879.4902 [M + H]+, calculated for C51H67N4O9 [M + H]+ 879.4908; measured 901.4824 [M + Na]+, calculated for C51H66N4O9Na [M + Na]+ 901.4728; measured 917.4656 [M+K]+, calculated for C51H66N4O9K [M + K]+ 917.4467. UV λmax nm (log ε) in MeOH: 297 (3.42), 243sh, 209 (4.64). IR νmax cm−1 (diamond ATR crystal): 3291, 2937, 2874, 1667, 1519, 1489, 1450, 1379, 1367, 1335, 1304, 1272, 1242, 1204, 1177, 1112, 1058, 1033, 984, 933, 896, 862, 751. CD Δε (nm) in MeOH: −16.04 (196.5), 0 (202.3), +6.05 (207.0), 0 (211.3), −10.85 (216.0), 0 (232.6), +0.87 (235.5), 0 (238.1), −11.04 (251.5), 0 (273.7), +0.55 (282.5), +0.24 (290.0), +0.33 (297.5), 0 (301.6), +0.60 (318.5), +0.46 (322.0), +0.49 (324.5), +0.71 (328.5), +0.72 (329.5), +0.73 (330.5), +0.74 (331.5), +0.80 (339.5), +0.79 (344.0), +0.76 (346.5), +0.84 (351.0), +0.64 (360.5), +0.65 (361.5), +0.55 (366.5), +0.60 (368.5), +0.42 (376.5), +0.41 (377.5), +0.51 (387.5), +0.19 (394.0), +0.14 (396.5), 0 (399.1). 1H and 13C-NMR data: in Table 5; see also Table S4 in the SI. −112.0 (c 0.025, MeOH). Positive ESI-MS m/z: 402 [M + H]+, 424 [M + Na]+, 440 [M + K]+; negative ESI-MS m/z: 400 [M − H]−. Positive HR-ESI-MS m/z: measured 402.2208 [M + H]+, calculated for C25H28N3O2 [M + H]+ 402.2182; measured 424.2022 [M + Na]+, calculated for C25H27N3O2Na [M + Na]+ 424.2001; measured 440.1767 [M + K]+, calculated for C25H27N3O2K [M + K]+ 440.1740. UV (MeOH) λmax (log ε): 289 (3.65), 221 (4.39), 207 (4.41). IR νmax cm−1 (diamond ATR crystal): 3340, 3179, 3035, 2972, 2942, 2912, 2879, 1666, 1456, 1375, 1326, 1269, 1196, 1173, 1129, 848, 741, 702. CD ∆ε (nm) in MeOH: −24.26 (214.5), 0 (230.6), +3.00 (235.0), 0 (250.1), −0.20 (253.5), −0.22 (264.5), −0.44 (271.5), −0.47 (280.0), −0.75 (288.0), −0.75 (295.0), 0 (306.8). 1H and 13C-NMR data: in Table 6. −129.3 (c 0.30, MeOH). Positive ESI-MS m/z: 444 [M + H]+, 466 [M + Na]+, 482 [M + K]+; negative ESI-MS m/z: 442 [M − H]−. CD ∆ε (nm) in MeOH: −54.55 (216.5), 0 (234.0), +15.17 (251.0), 0 (270.6), −2.11 (283.5), 0 (301.8). 1H and 13C-NMR data: in Table 8. The 1H and 13C-NMR data of 5 are identical with those of fructigenine A in the literature [41], and the positive CD sign of 5 in the 245–255 nm region (∆ε251.0 +15.17) was consistent with that reported for 20,21-dihydrofructigenine A ([θ]247 +27400) [41].
| Position | δC | δH (J in Hz) | Position | δC | δH (J in Hz) |
|---|---|---|---|---|---|
| 1 | 164.8 | — | 11a | 59.1 | 3.79 br dd (11.4, 5.6) |
| 2 (NH) | — | 5.77 s | 12 | 36.1 | 3.54 dd (14.4, 2.5)/2.82 dd (14.4, 10.1) |
| 3 | 55.9 | 4.24 dd (10.1, 2.5) | 13 | 135.3 | — |
| 4 | 168.1 | — | 14 | 129.2 | 7.19 dd (6.7, 1.7) |
| 5 | — | — | 15 | 129.3 | 7.37–7.24 m |
| 5a | 79.4 | 6.04 br s | 16 | 127.7 | 7.37–7.24 m |
| 6 (N) | — | — | 17 | 129.3 | 7.37–7.24 m |
| 6a | 143.0 | 18 | 129.2 | 7.19 dd (6.7, 1.7) | |
| 7 | 124.5 | 8.01 br s | 19 | 40.3 | — |
| 8 | 129.1 | 7.37–7.24 m | 19a | 23.6 | 1.13 3H, s |
| 9 | 119.2 | 7.13 td (7.6, 0.8) | 19b | 23.2 | 0.97 3H, s |
| 10 | 129.1 | 7.37–7.24 m | 20 | 143.3 | 5.76 dd (17.3, 10.8) |
| 10a | 132.0 | — | 21 | 114.6 | 5.13 d (10.8)/5.11 d (17.3) |
| 10b | 60.9 | — | 22 | 170.1 | — |
| 11 | 36.9 | 2.56 dd (12.6, 5.6)/2.24 dd (12.6, 11.4) | 23 | 22.4 | 2.66 3H, s |
3.4.5. HPLC-PDAD-UV/HPLC-ESI-MS Analyses of G59 and BD-1-3 Extracts for Detecting 1–5
4. Conclusions
Acknowledgments
Author Contributions
Conflicts of Interest
References
- Newman, D.J.; Cragg, G.M. Natural products as sources of new drugs over the 30 years from 1981 to 2010. J. Nat. Prod. 2012, 75, 311–335. [Google Scholar] [CrossRef]
- Newman, D.J.; Giddings, L.-A. Natural products as leads to antitumor drugs. Phytochem. Rev. 2014, 13, 123–137. [Google Scholar] [CrossRef]
- Bauer, A.; Brönstrup, M. Industrial natural product chemistry for drug discovery and development. Nat. Prod. Rep. 2014, 31, 35–60. [Google Scholar] [CrossRef]
- Newman, D.J.; Cragg, G.M. Marine-sourced anti-cancer and cancer pain control agents in clinical and late preclinical development. Mar. Drugs 2014, 12, 255–278. [Google Scholar] [CrossRef]
- Pejin, B.; Jovanović, K.K.; Mojović, M.; Savić, A.G. New and highly potent antitumor natural products from marine-derived fungi: Covering the period from 2003 to 2012. Curr. Top. Med. Chem. 2013, 13, 2745–2766. [Google Scholar] [CrossRef]
- Rateb, M.E.; Ebel, R. Secondary metabolites of fungi from marine habitats. Nat. Prod. Rep. 2011, 28, 290–344. [Google Scholar] [CrossRef]
- Schneider, P.; Misiek, M.; Hoffmeister, D. In vivo and in vitro production options for fungal secondary metabolites. Mol. Pharm. 2008, 5, 234–242. [Google Scholar] [CrossRef]
- Hertweck, C. Hidden biosynthetic treasures brought to light. Nat. Chem. Biol. 2009, 5, 450–452. [Google Scholar] [CrossRef]
- Cichewicz, R.H.; Henrikson, J.C.; Wang, X.; Branscum, K.M. Strategies for Accessing Microbial Secondary Metabolites from Silent Biosynthetic Pathways. In Manual of Industrial Microbiology and Biotechnology, 3rd ed.; Baltz, R.H., Davies, J.E., Demain, A.L., Bull, A.T., Junker, B., Katz, L., Lynd, L.R., Masurekar, P.C., Reeves, D., Zhao, H., Eds.; ASM Press: Washington, DC, USA, 2010; pp. 78–95. [Google Scholar]
- Brakhage, A.A.; Schroeckh, V. Fungal secondary metabolites—Strategies to activate silent gene clusters. Fungal Genet. Biol. 2011, 48, 15–22. [Google Scholar] [CrossRef]
- Bergmann, S.; Schümann, J.; Scherlach, K.; Lange, C.; Brakhage, A.A.; Hertweck, C. Genomics-driven discovery of PKS-NRPS hybrid metabolites from Aspergillus nidulans. Nat. Chem. Biol. 2007, 3, 213–217. [Google Scholar] [CrossRef]
- Scherlach, K.; Nützmann, H.-W.; Schroeckh, V.; Dahse, H.-M.; Brakhage, A.A.; Hertweck, C. Cytotoxic pheofungins from an engineered fungus impaired in posttranslational protein modification. Angew. Chem. Int. Ed. 2011, 50, 9843–9847. [Google Scholar] [CrossRef]
- Bode, H.B.; Bethe, B.; Höfs, R.; Zeeck, A. Big effects from small changes: Possible ways to explore nature’s chemical diversity. ChemBioChem 2002, 3, 619–627. [Google Scholar] [CrossRef]
- Henrikson, J.C.; Hoover, A.R.; Joyner, P.M.; Cichewicz, R.H. A chemical epigenetics approach for engineering the in situ biosynthesis of a cryptic natural product from Aspergillus niger. Org. Biomol. Chem. 2009, 7, 435–438. [Google Scholar] [CrossRef]
- Cichewicz, R.H. Epigenome manipulation as a pathway to new natural product scaffolds and their congeners. Nat. Prod. Rep. 2010, 27, 11–22. [Google Scholar] [CrossRef]
- Takahashi, J.A.; Teles, A.P.C.; Bracarense, A.A.P.; Gomes, D.C. Classical and epigenetic approaches to metabolite diversification in filamentous fungi. Phytochem. Rev. 2013, 12, 773–789. [Google Scholar] [CrossRef]
- Ochi, K. From microbial differentiation to ribosome engineering. Biosci. Biothenol. Biochem. 2007, 71, 1373–1386. [Google Scholar] [CrossRef]
- Hosaka, T.; Ohnishi-Kameyama, M.; Muramatsu, H.; Murakami, K.; Tsurumi, Y.; Kodani, S.; Yoshida, M.; Fujie, A.; Ochi, K. Antibacterial discovery in actinomycetes strains with mutations in RNA polymerase or ribosomal protein S12. Nat. Biotechnol. 2009, 27, 462–464. [Google Scholar] [CrossRef]
- Ochi, K.; Hosaka, T. New strategies for drug discovery: Activation of silent or weakly expressed microbial gene clusters. Appl. Microbiol. Biotechnol. 2013, 97, 87–98. [Google Scholar] [CrossRef]
- Chai, Y.-J.; Cui, C.-B.; Li, C.-W.; Wu, C.-J.; Tian, C.-K.; Hua, W. Activation of the dormant secondary metabolite production by introducing gentamicin-resistance in a marine-derived Penicillium purpurogenum G59. Mar. Drugs 2012, 10, 559–582. [Google Scholar] [CrossRef]
- Bhagwat, B.; Duncan, E.J. Mutation breeding of banana cv. Highgate (Musa spp., AAA group) for tolerance to Fusarium oxysporum f. sp. cubense using chemical mutagens. Sci. Hortic. 1998, 73, 11–22. [Google Scholar] [CrossRef]
- Bai, D.-M.; Zhao, X.-M.; Li, X.-G.; Xu, S.-M. Strain improvement of Rhizopus oryzae for over-production of l(+)-lactic acid and metabolic flux analysis of mutants. Biochem. Eng. J. 2004, 18, 41–48. [Google Scholar] [CrossRef]
- Liu, Z.; Zhang, K.; Lin, J.-F.; Guo, L.-Q. Breeding cold tolerance strain by chemical mutagenesis in Volvariella volvacea. Sci. Hortic. 2011, 130, 18–24. [Google Scholar] [CrossRef]
- Fang, S.-M.; Cui, C.-B.; Li, C.-W.; Wu, C.-J.; Zhang, Z.-J.; Li, L.; Huang, X.-J.; Ye, W.-C. Purpurogemutantin and purpurogemutantidin, new drimenyl cyclohexenone derivatives produced by a mutant obtained by diethyl sulfate mutagenesis of a marine-derived Penicillium purpurogenum G59. Mar. Drugs 2012, 10, 1266–1287. [Google Scholar] [CrossRef]
- Queener, S.W.; Sebek, O.K.; Vézina, C. Mutants blocked in antibiotic synthesis. Annu. Rev. Microbiol. 1978, 32, 593–636. [Google Scholar] [CrossRef]
- Kitamura, S.; Kase, H.; Odakura, Y.; Iida, T.; Shirahata, K.; Nakayama, K. 2-Hydroxysagamicin: A new antibiotic produced by mutational biothynthesis of Micromonospora sagamiensis. J. Antibiot. 1982, 35, 94–97. [Google Scholar] [CrossRef]
- Bormann, C.; Huhn, W.; Zähner, H.; Rathmann, R.; Hahn, H.; König, W.A. Metabolic products of microorgansms. 228: New nikkomycins produced by mutants of Streptomyces tendae. J. Antibiot. 1985, 38, 9–16. [Google Scholar] [CrossRef]
- Srikrai, S.; Robbers, J.E. Methods for mutation and selection of the ergot fungus. Appl. Environ. Microbiol. 1983, 45, 1165–1169. [Google Scholar]
- Malina, H.; Tempete, C.; Robert-Gero, M. Enhanced sinefungin production by medium improvement, mutagenesis, and protoplast regeneration of Streptomyces incarnatus NRRL 8089. J. Antibiot. 1985, 38, 1204–1210. [Google Scholar] [CrossRef]
- Kakinuma, S.; Ikeda, H.; Ōmura, S.; Hopwood, D.A. Biosynthesis of kalafungin in Streptomyces tanashiensis. J. Antibiot. 1990, 43, 391–396. [Google Scholar] [CrossRef]
- Adamidis, T.; Riggle, P.; Chapness, W. Mutations in a new Streptomyces coelicolor locus which globally block antibiotic biosynthesis but not sporulation. J. Bacteriol. 1990, 172, 2962–2969. [Google Scholar]
- Roberts, J.C.; Thompson, D.J. Studies in mycological chemistry. Part XXVII. Reinvestigation of the structure of purpurogenone, a metabolite of Penicillium purpurogenum Stoll. J. Chem. Soc. C 1971, 3488–3492. [Google Scholar] [CrossRef]
- Roberts, J.C.; Thompson, D.J. Studies in mycological chemistry. Part XXVIII. Isolation and structure of deoxypurpurogenone, a minor pigment of Penicillium purpurogenum Stoll. J. Chem. Soc. C 1971, 3493–3495. [Google Scholar] [CrossRef]
- King, T.J.; Roberts, J.C.; Thompson, D.J. Studies in mycological chemistry. Part XXX and last. Isolation and structure of purpuride, a metabolite of Penicillium purpurogenum Stoll. J. Chem. Soc. Perkin Trans. 1 1973, 78–80. [Google Scholar] [CrossRef]
- Nishida, H.; Tomoda, H.; Cao, J.; Okuda, S.; Ōmura, S. Purpactins, new inhibitors of acyl-CoA:cholesterol acyltransferase produced by Penicillium purpurogenum II. Structure elucidation of purpactins A, B and C. J. Antibiot. 1991, 44, 144–151. [Google Scholar]
- Wang, T.; Zhang, Y.; Wang, Y.; Pei, Y.-H. Anti-tumor effects of rubratoxin B on cell toxicity, inhibition of cell proliferation, cytotoxic activity and matrix metalloproteinase-2,9. Toxicol. In Vitro 2007, 21, 646–650. [Google Scholar] [CrossRef]
- De Silva, E.D.; Williams, D.E.; Jayanetti, D.R.; Centko, R.M.; Patrick, B.O.; Wijesundera, R.L.C.; Andersen, R.J. Dhilirolides A–D, meroterpenoids produced in culture by the fruit-infecting fungus Penicillium purpurogenum collected in Sri Lanka. Org. Lett. 2011, 13, 1174–1177. [Google Scholar] [CrossRef]
- Tian, C.-K.; Cui, C.-B.; Han, X.-X. Isolation of fungal strains in unusual environment and screening for their antitumor activity. J. Int. Pharm. Res. 2008, 35, 401–405. [Google Scholar]
- Hoffmann, G.R. Genetic effects of dimethyl sulfate, diethyl sulfate, and related compounds. Mutat. Res. 1980, 75, 63–129. [Google Scholar] [CrossRef]
- Van Zeeland, A.A.; Mohn, G.R.; Neuhäuser-Klaus, A.; Ehling, U.H. Quantitative comparison of genetic effects of ethylating agents on the basis of DNA adduct formation. Use of O6-ethylguanine as molecular dosimeter for extrapolation from cells in culture to the mouse. Environ. Health Perspect. 1985, 62, 163–169. [Google Scholar]
- Arai, K.; Kimura, K.; Mushiroda, T.; Yamamoto, Y. Structure of fructigenines A and B, new alkaloids isolated from Penicillium fructigenum Takeuchi. Chem. Pharm. Bull. 1989, 37, 2937–2939. [Google Scholar] [CrossRef]
- Fehlhaber, H.W.; Kogler, H.; Mukhopadhyay, T.; Vijayakumar, E.K.S.; Ganguli, B.N. Structure of aranorosin, a new antibiotic of a novel skeletal type. J. Am. Chem. Soc. 1988, 110, 8242–8244. [Google Scholar] [CrossRef]
- Fehlhaber, H.W.; Kogler, H.; Mukhopadhyay, T.; Vijayakumar, E.K.S.; Roy, K.; Rupp, R.H.; Ganguli, B.N. Aranorosin, a novel antibiotic from Pseudoarachniotus roseus II. Structure elucidation. J. Antibiot. 1988, 41, 1785–1794. [Google Scholar] [CrossRef]
- Roy, K.; Vijayakumar, E.K.S.; Mukhopadhyay, T.; Chatterjee, S.; Bhat, R.G.; Blumbach, J.; Ganguli, B.N. Aranorosinol A and aranorosinol B, two new metabolites from Pseudoarachniotus roseus: Production, isolation, structure elucidation and biological properties. J. Antibiot. 1992, 45, 1592–1598. [Google Scholar] [CrossRef]
- Koizumi, F.; Agatsuma, T.; Ando, K.; Kondo, H.; Saitoh, Y.; Matsuda, Y.; Nakanishi, S. EI-2128-1, a novel interleukin-1β converting enzyme inhibitor produced by Penicillium sp. E-2128. J. Antibiot. 2003, 56, 891–898. [Google Scholar]
- Barrow, C.J.; Cai, P.; Snyder, J.K.; Sedlock, D.M.; Sun, H.H.; Cooper, R. WIN 64821, a new competitive antagonist to substance P, isolated from an Aspergillus species: Structure determination and solution conformation. J. Org. Chem. 1993, 58, 6016–6021. [Google Scholar] [CrossRef]
- Sedlock, D.M.; Barrow, C.J.; Barrownell, E.; Hong, A.; Gillum, A.M.; Houck, D.R. WIN 64821, a novel neurokinin antagonist produced by an Aspergillus sp. I. Fermentation and isolation. J. Antibiot. 1994, 47, 391–398. [Google Scholar]
- Popp, J.L.; Musza, L.L.; Barrow, C.J.; Rudewicz, P.J.; Houck, D.R. WIN 64821, a novel neurokinin antagonist produced by an Aspergillus sp. III. Biosynthetic analogs. J. Antibiot. 1994, 47, 411–419. [Google Scholar]
- Varoglu, M.; Corbett, T.H.; Valeriote, F.A.; Crews, P. Asperazine, a selective cytotoxic alkaloid from a sponge-derived culture of Aspergillus niger. J. Org. Chem. 1997, 62, 7078–7079. [Google Scholar] [CrossRef]
- Gomes, N.M.; Dethoup, T.; Singburaudom, N.; Gales, L.; Silva, A.M.S.; Kijjoa, A. Eurocristatine, a new diketopiperazine dimer from the marine sponge-associated fungus Eurotium cristatum. Phytochem. Lett. 2012, 5, 717–720. [Google Scholar] [CrossRef]
- Kimura, Y.; Tani, K.; Kojima, A.; Sotoma, G.; Okada, K.; Shimada, A. Cyclo-(l-tryptophyl-l-phenylalanyl), a plant growth regulator produced by the fungus Penicillium sp. Phytochemistry 1996, 41, 665–669. [Google Scholar] [CrossRef]
- Pretsch, E.; Seibl, J.; Simon, W.; Clerc, T. Vicinal Coupling. In Tables of Spectral Data for Structure Determination of Organic Compounds, 2nd ed.; Fresenius, W., Huber, J.F.K., Pungor, E., Rechnitz, G.A., Simon, W., West, T.S., Eds.; Springer-Verlag: Berlin, Germany, 1989; pp. H20–H25. [Google Scholar]
- Wang, L.; Yin, W.-B.; Li, S.-M.; Liu, X.-Q. Chemoenzymatic synthesis of prenylated indole alkaloids. Chin. J. Biochem. Mol. Biol. 2009, 25, 580–584. [Google Scholar]
- Yin, S.; Yu, X.; Wang, Q.; Li, S.-M. Identification of a brevianamide F reverse prenyltransferase BrePT from Aspergillus versicolor with a broad substrate specificity towards tryptophan-containing cyclic dipeptides. Appl. Microbiol. Biotechnol. 2013, 97, 1649–1660. [Google Scholar] [CrossRef]
- Sanz-Cervera, J.F.; Stocking, E.M.; Usui, T.; Osada, H.; Williams, R.M. Synthesis and evaluation of microtubule assembly inhibition and cytotoxicity of prenylated derivatives of cyclo-l-Trp-l-Pro. Bioorg. Med. Chem. 2000, 8, 2407–2415. [Google Scholar] [CrossRef]
© 2014 by the authors; licensee MDPI, Basel, Switzerland. This article is an open access article distributed under the terms and conditions of the Creative Commons Attribution license (http://creativecommons.org/licenses/by/3.0/).
Share and Cite
Fang, S.-M.; Wu, C.-J.; Li, C.-W.; Cui, C.-B. A Practical Strategy to Discover New Antitumor Compounds by Activating Silent Metabolite Production in Fungi by Diethyl Sulphate Mutagenesis. Mar. Drugs 2014, 12, 1788-1814. https://doi.org/10.3390/md12041788
Fang S-M, Wu C-J, Li C-W, Cui C-B. A Practical Strategy to Discover New Antitumor Compounds by Activating Silent Metabolite Production in Fungi by Diethyl Sulphate Mutagenesis. Marine Drugs. 2014; 12(4):1788-1814. https://doi.org/10.3390/md12041788
Chicago/Turabian StyleFang, Shi-Ming, Chang-Jing Wu, Chang-Wei Li, and Cheng-Bin Cui. 2014. "A Practical Strategy to Discover New Antitumor Compounds by Activating Silent Metabolite Production in Fungi by Diethyl Sulphate Mutagenesis" Marine Drugs 12, no. 4: 1788-1814. https://doi.org/10.3390/md12041788