Confirmation of Pinnatoxins and Spirolides in Shellfish and Passive Samplers from Catalonia (Spain) by Liquid Chromatography Coupled with Triple Quadrupole and High-Resolution Hybrid Tandem Mass Spectrometry


Abstract
:1. Introduction

| Toxin | RT (min) | [M + H]+ | Fragments | ||
|---|---|---|---|---|---|
| Exact Mass (m/z) | Formula | Exact Mass (m/z) | Formula | ||
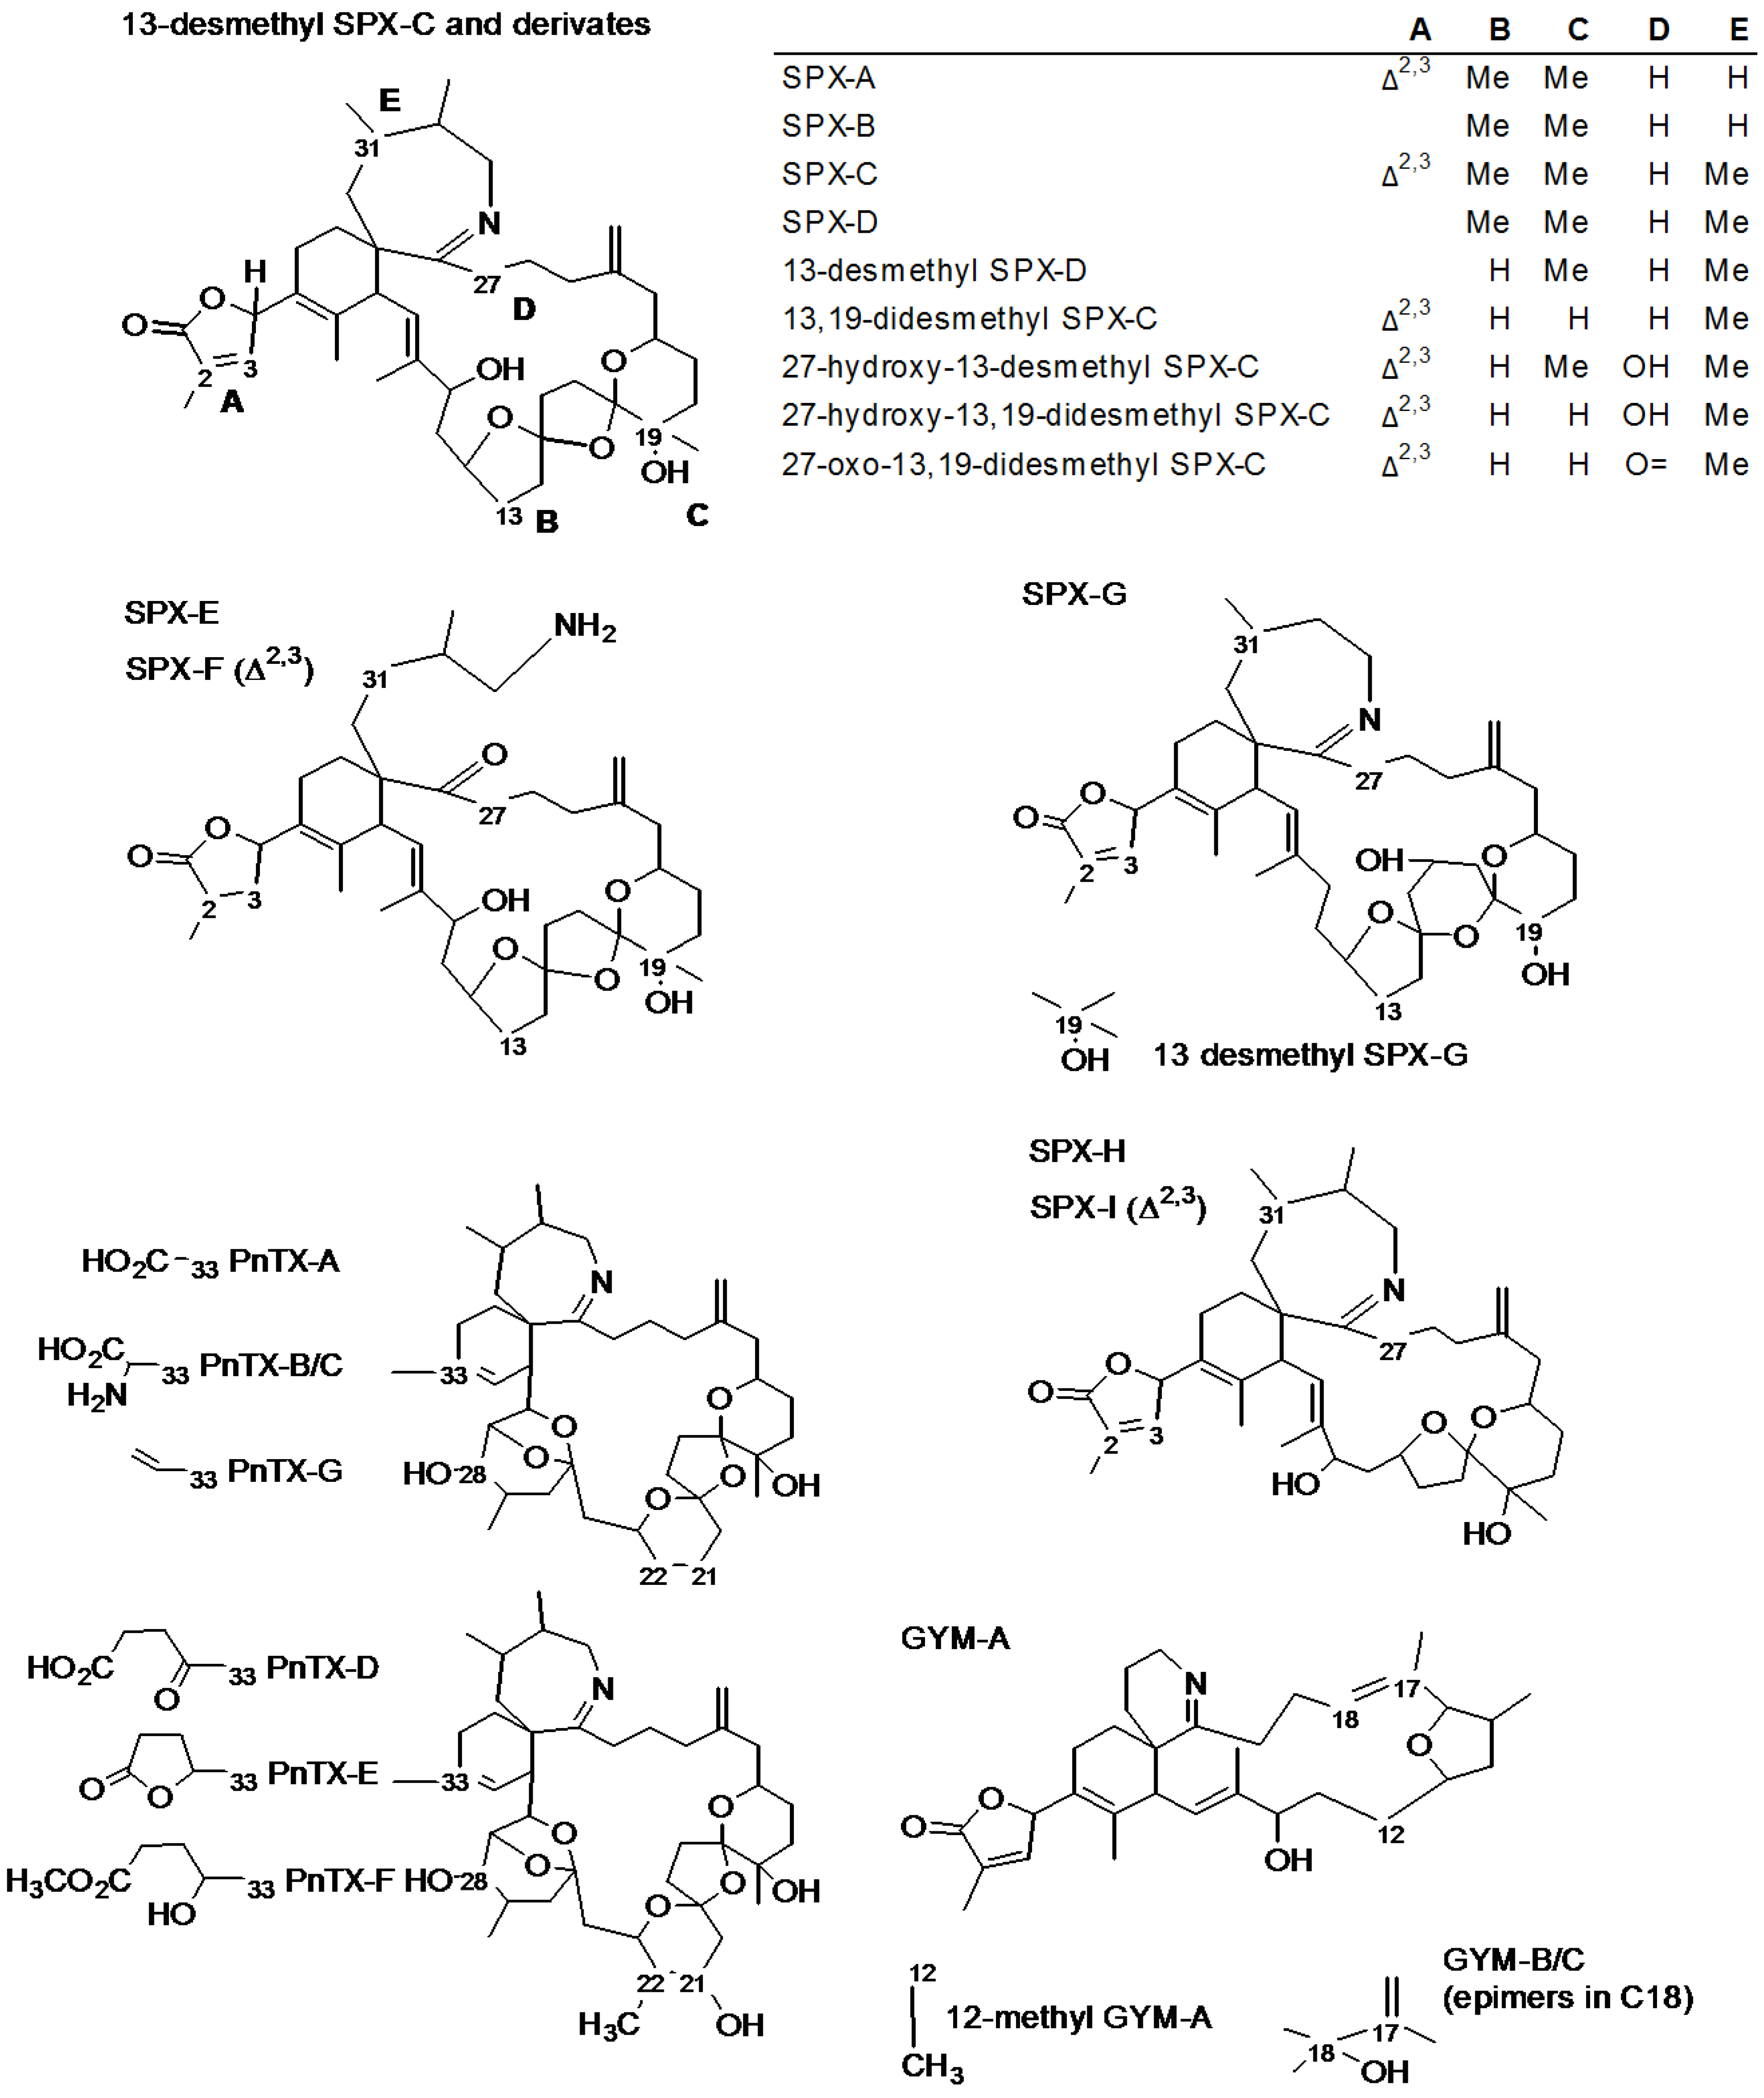
| 13-desmethyl Spirolide C [7,8] (SPX-1) | 1.00 | 692.4521 | C42H62NO7 | 674.4415 | C42H60NO6 |
| 444.3108 | C27H42NO4 | ||||
| 164.1434 | C11H18N | ||||
| Spirolide A [7] | (0.90) a | 692.4521 | C42H62NO7 | 150.1277 | C10H16N |
| Spirolide B [6,7] | (1.00) a | 694.4677 | C42H64NO7 | 150.1278 | C10H16N |
| Spirolide C [7] | (1.05) a | 706.4677 | C43H64NO7 | 458.3265 | C28H44NO4 |
| 164.1434 | C11H18N | ||||
| Spirolide D [6] | (1.10) a | 708.4834 | C43H66NO7 | 608.4310 | C38H58NO5 |
| 458.3265 | C28H44NO4 | ||||
| 164.1434 | C11H18N | ||||
| Spirolide E [9] | (1.30) a | 710.4637 | C42H64NO8 | 444.3108 | C27H42NO4 |
| Spirolide F [9] | 712.4794 | C42H66NO8 | 444.3108 | C27H42NO4 | |
| Spirolide G [10] | (1.60) a | 692.4521 | C42H62NO7 | 378.2639 | C22H36NO4 |
| 164.1434 | C11H18N | ||||
| Spirolide H [11] | Not reported | 650.4415 | C40H60NO6 | 402.3003 | C25H40NO3 |
| 164.1422 | C11H18N | ||||
| Spirolide I [11] | Not reported | 652.4572 | C40H62NO6 | 402.3003 | C25H40NO3 |
| 164.1434 | C11H18N | ||||
| 13-desmethyl Spirolide D [12,13] | (1.06) a | 694.4677 | C42H64NO7 | 676.4572 | C42H62NO6 |
| 444.3108 | C27H42NO4 | ||||
| 164.1434 | C11H18N | ||||
| 13,19-didesmethyl Spirolide C [10,12] | (0.94) b | 678.4364 | C41H60NO7 | 430.2952 | C26H40NO4 |
| 164.1434 | C11H18N | ||||
| 27-hydroxy-13,19-didesmethyl Spirolide C [12,14] | (0.91) b | 694.4313 | C41H60NO8 | 464.3007 | C26H42NO6 |
| 180.1383 | C11H18NO | ||||
| 27-hydroxy-13-desmethyl Spirolide C [14] | (0.92) b | 708.4470 | C42H62NO8 | 478.3163 | C27H44NO6 |
| 180.1383 | C11H18NO | ||||
| 27-oxo-13,19-didesmethyl Spirolide C [14] | (0.99) b | 692.4157 | C41H58NO8 | 444.2745 | C26H38NO5 |
| 178.1226 | C11H16NO | ||||
| 20-methyl Spirolide G [15,16] | (1.06) b | 706.4677 | C43H64NO7 | 392.2795 | C23H38NO4 |
| 164.1434 | C11H18N | ||||
| Pinnatoxin G [17] | 1.00 | 694.4677 | C42H64NO7 | 676.4572 | C42H62NO6 |
| 458.3265 | C28H44NO4 | ||||
| 164.1434 | C11H18N | ||||
| Pinnatoxin A [17,18,19] | (0.77) a | 712.4419 | C41H62NO9 | 458.3265 | C28H44NO4 |
| 164.1434 | C11H18N | ||||
| Pinnatoxin B/C (epimers) [19,20] | Not reported | 741.4685 | C42H65N2O9 | 458.3265 | C28H44NO4 |
| 164.1434 | C11H18N | ||||
| Pinnatoxin D [17] | Not reported | 782.4838 | C45H68NO10 | 446.3265 | C27H44NO4 |
| 164.1434 | C11H18N | ||||
| Pinnatoxin E [17] | (0.83) a | 784.4994 | C45H70NO10 | 446.3265 | C27H44NO4 |
| 164.1434 | C11H18N | ||||
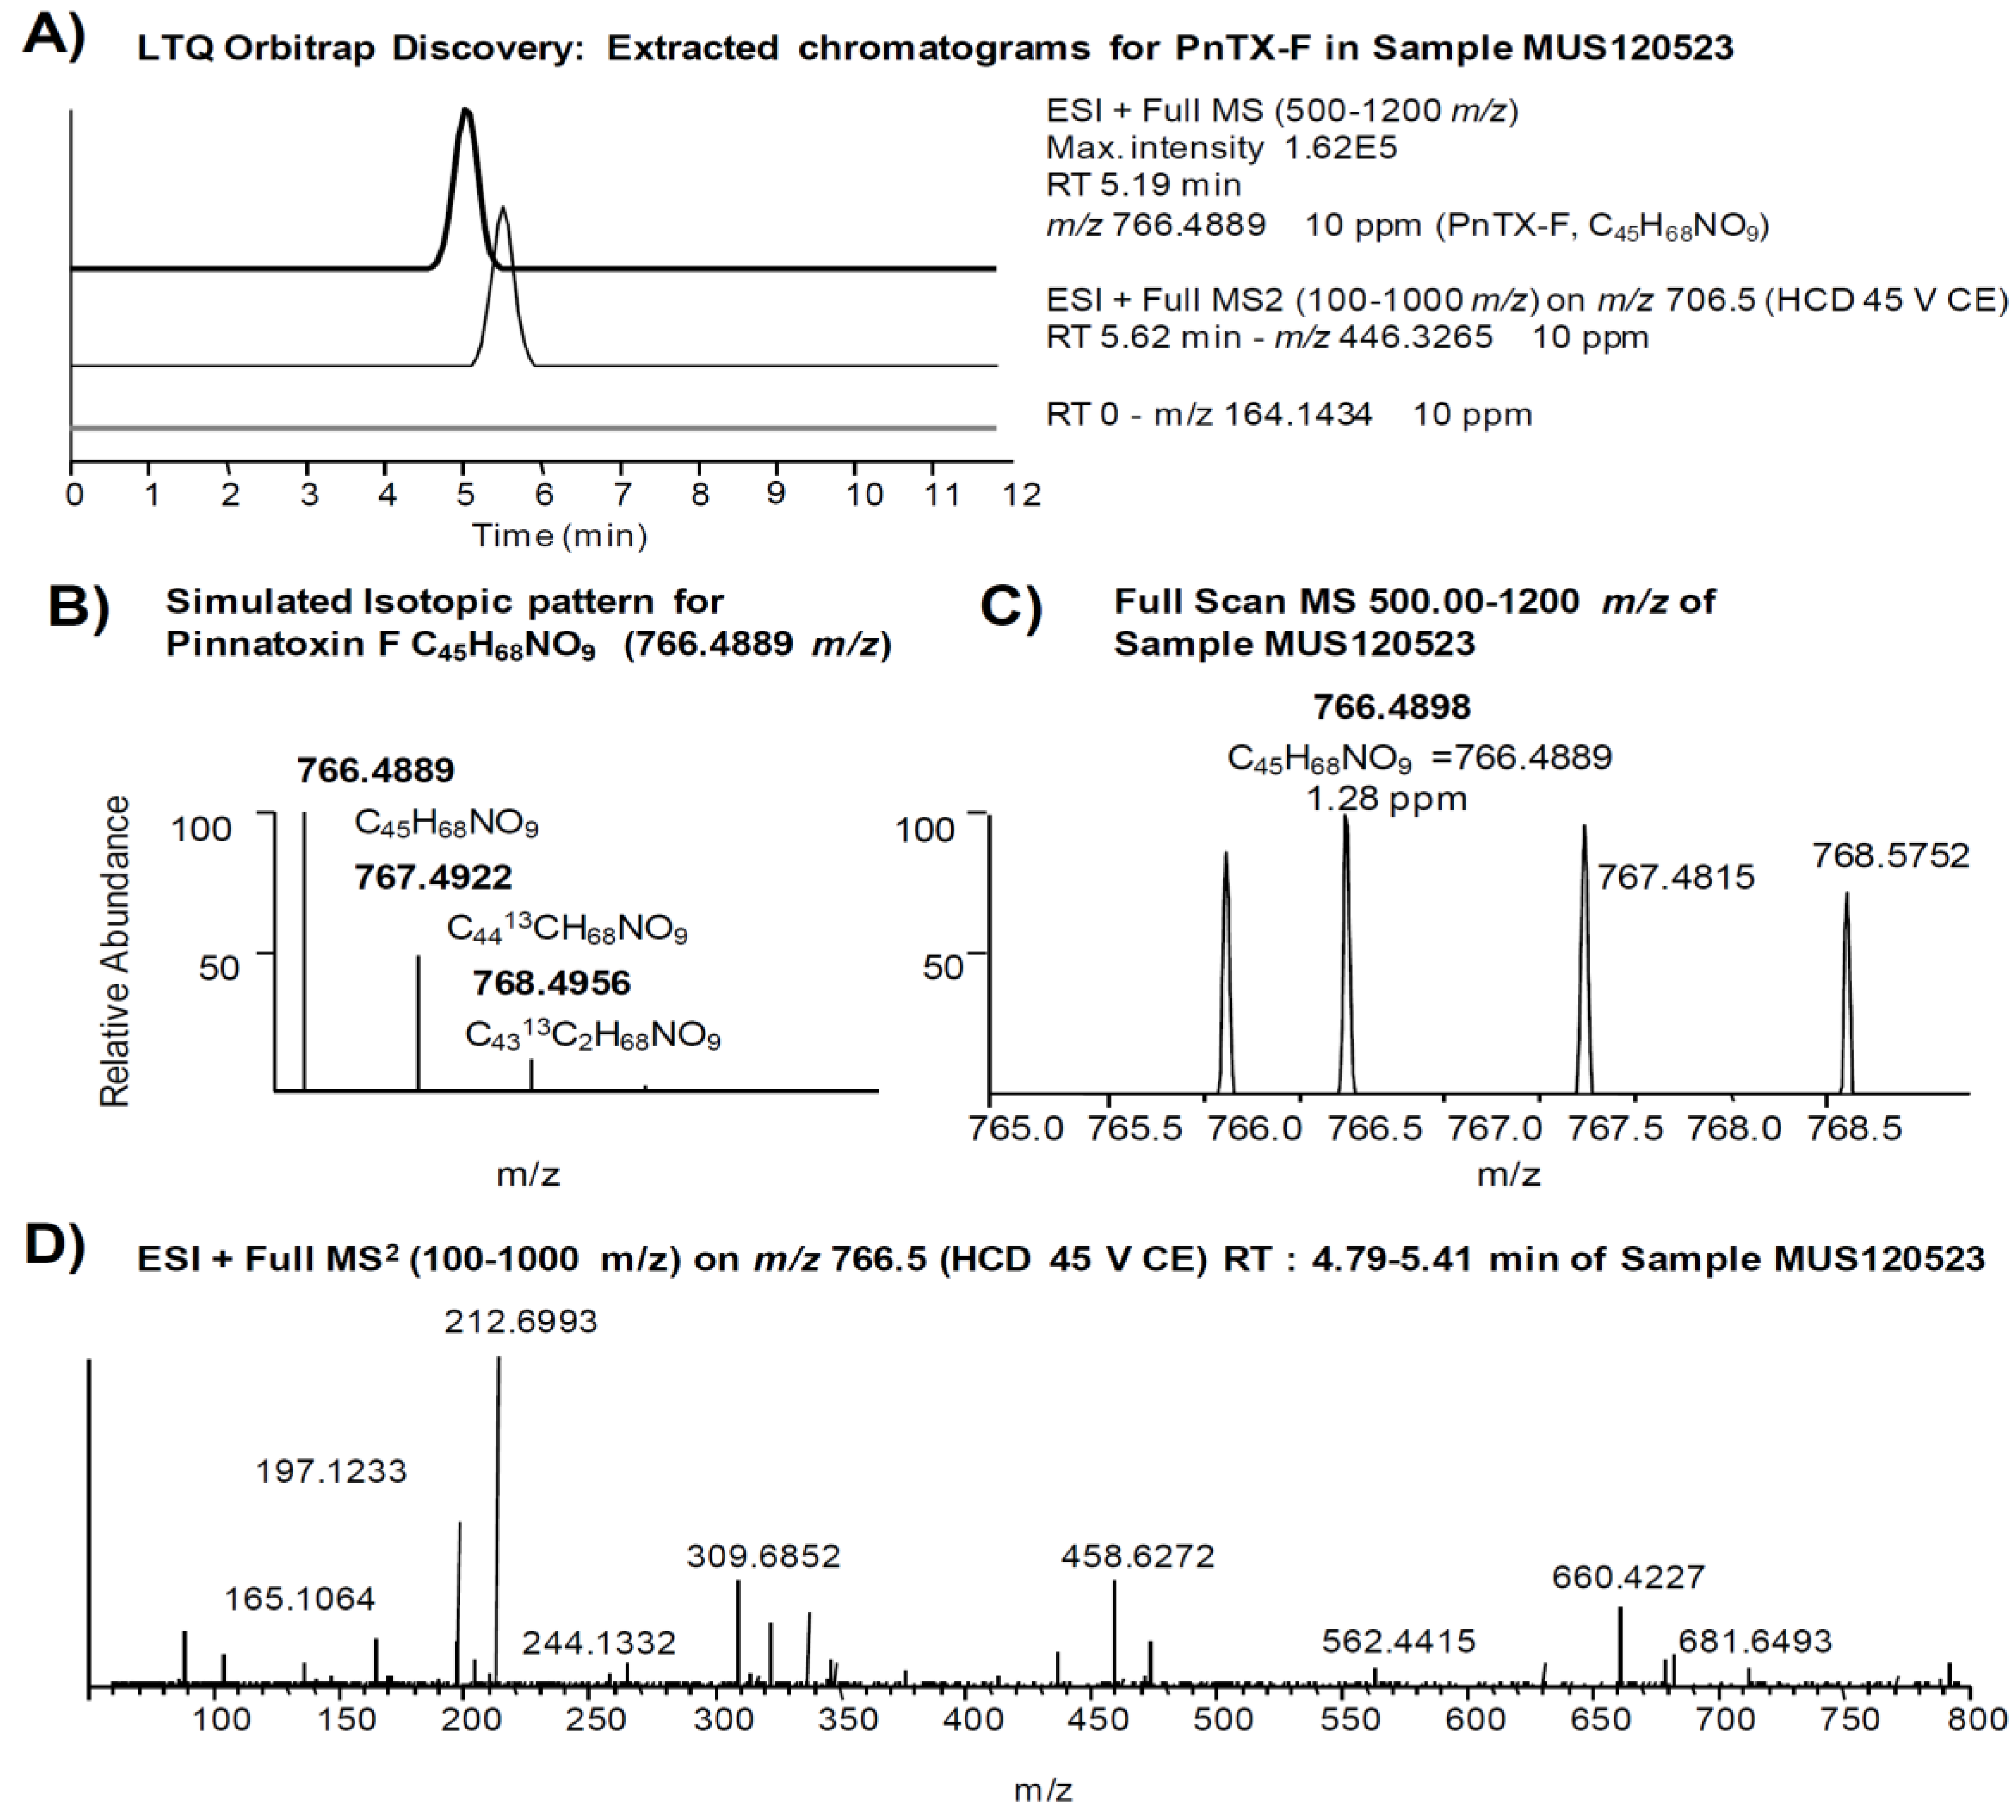
| Pinnatoxin F [17] | (0.97) a | 766.4889 | C45H68NO9 | 446.3265 | C27H44NO4 |
| 164.1434 | C11H18N | ||||

2. Results and Discussion
| Sample Details | SPX-1 (Δ ppm) | SPX-1 (μg/kg) | PnTX-G (Δ ppm) | PnTX-G (μg/kg) | ||
|---|---|---|---|---|---|---|
| OYS110102 | [M + H]+ | 1.0 | [M + H]+ | Δppm > 5 ppm | ||
| Oyster | Frag 1 | −0.2 | 3.6 ± 0.1 | Frag 1 | Δppm > 5 ppm | ND |
| January 2011 | Frag 2 | 1.2 | Frag 2 | Δppm > 5 ppm | ||
| Fangar Bay | Frag 3 | −2.3 | Frag 3 | Δppm > 5 ppm | ||
| OYS110103 | [M + H]+ | −0.2 | [M + H]+ | Δppm > 5 ppm | ||
| Oyster | Frag 1 | 0.2 | 3.5 ± 0.8 | Frag 1 | Δppm > 5 ppm | ND |
| January 2011 | Frag 2 | −0.9 | Frag 2 | Δppm > 5 ppm | ||
| Fangar Bay | Frag 3 | −3.5 | Frag 3 | Δppm > 5 ppm | ||
| OYS110105 | [M + H]+ | 5.0 | [M + H]+ | 40.6 | ||
| Mussel | Frag 1 | −0.2 | 2.2 ± 0.6 | Frag 1 | −0.2 | 3.8 ± 0.6 |
| January 2011 | Frag 2 | 0.5 | Frag 2 | −2.6 | ||
| Fangar Bay | Frag 3 | 0.4 | Frag 3 | −0.7 | ||
| OYS110115 | [M + H]+ | 0.4 | [M + H]+ | Δppm > 5 ppm | ||
| Oyster | Frag 1 | −0.2 | 5 ± 1 | Frag 1 | Δppm > 5 ppm | ND |
| January 2011 | Frag 2 | 0.3 | Frag 2 | Δppm > 5 ppm | ||
| Fangar Bay | Frag 3 | 2.3 | Frag 3 | Δppm > 5 ppm | ||
| MUS110116 | [M + H]+ | 1.6 | [M + H]+ | 1.3 | ||
| Mussel | Frag 1 | 0.1 | 3.6 ± 0.18 | Frag 1 | 0.5 | 3 ± 1 |
| January 2011 | Frag 2 | −0.1 | Frag 2 | −0.2 | ||
| Fangar Bay | Frag 3 | 0.9 | Frag 3 | −0.1 | ||
| OYS110117 | [M + H]+ | −0.1 | [M + H]+ | Δppm > 5 ppm | ||
| Oyster | Frag 1 | 0.1 | 6.6 ± 0.7 | Frag 1 | Δppm > 5 ppm | ND |
| January 2011 | Frag 2 | −0.1 | Frag 2 | Δppm > 5 ppm | ||
| Fangar Bay | Frag 3 | −0.9 | Frag 3 | Δppm > 5 ppm | ||
| OYS110205 | [M + H]+ | 0.4 | [M + H]+ | Δppm > 5 ppm | ||
| Oyster | Frag 1 | −0.1 | 5.8 ± 0.5 | Frag 1 | Δppm > 5 ppm | ND |
| February 2011 | Frag 2 | 0.1 | Frag 2 | Δppm > 5 ppm | ||
| Fangar | Frag 3 | 1.6 | Frag 3 | Δppm > 5 ppm | ||
| MUS110205 | [M + H]+ | −0.2 | [M + H]+ | 2.2 | ||
| Mussel | Frag 1 | 0.3 | NQ | Frag 1 | 0.5 | 4.1 ± 0.1 |
| February 2011 | Frag 2 | −0.2 | Frag 2 | −1.8 | ||
| Fangar Bay | Frag 3 | 0.9 | Frag 3 | 0.4 | ||
| MUS1027 | [M + H]+ | 0.2 | [M + H]+ | 42.6 | ||
| Mussel | Frag 1 | −0.6 | 3 ± 2 | Frag 1 | −0.5 | 2.2 ± 0.1 |
| February 2011 | Frag 2 | −1.0 | Frag 2 | −1.9 | ||
| Fangar Bay | Frag 3 | 0.3 | Frag 3 | −2.00 | ||
| OYS110208 | [M + H]+ | 0.5 | [M + H]+ | Δppm > 5 ppm | ||
| Oyster | Frag 1 | −0.2 | 4 ± 1 | Frag 1 | Δppm > 5 ppm | ND |
| February 2011 | Frag 2 | 0.1 | Frag 2 | Δppm > 5 ppm | ||
| Fangar | Frag 3 | −1.0 | Frag 3 | Δppm > 5 ppm | ||
| MUS120520 | [M + H]+ | 1.0 | [M + H]+ | −1.1 | ||
| Mussel | Frag 1 | −0.5 | NC | Frag 1 | −0.5 | 39 ± 6 |
| May 2012 | Frag 2 | Δppm > 5 ppm | Frag 2 | −0.7 | ||
| Fangar Bay | Frag 3 | Δppm > 5 ppm | Frag 3 | −0.9 | ||
| MUS120523 | [M + H]+ | −2.1 | [M + H]+ | 0.2 | ||
| Mussel | Frag 1 | −0.1 | 16 ± 1 | Frag 1 | −0.1 | 59 ± 5 |
| May 2012 | Frag 2 | 0.4 | Frag 2 | −0.1 | ||
| Retail market | Frag 3 | −0.1 | Frag 3 | −0.1 | ||
| MUS120524 | [M + H]+ | Δppm > 5 ppm | [M + H]+ | −1.1 | ||
| Mussel | Frag 1 | −1.1 | NC | Frag 1 | −0.5 | 58 ± 2 |
| May 2012 | Frag 2 | Δppm > 5 ppm | Frag 2 | −0.9 | ||
| Fangar Bay | Frag 3 | Δppm > 5 ppm | Frag 3 | −0.9 | ||
| Sample Name and Date | PnTX-G (Δppm) | PnTX-G (μg/kg) | |
|---|---|---|---|
| TB_1028 February 2007 | [M + H]+ | 0.9 | |
| Frag 1 | 0.3 | 0.47 ± 0.01 | |
| Frag 2 | −0.8 | ||
| Frag 3 | −0.1 | ||
| TB_1029 February 2007 | [M + H]+ | 1.3 | |
| Frag 1 | 0.6 | 0.65 ± 0.09 | |
| Frag 2 | −0.8 | ||
| Frag 3 | −0.1 | ||
| TB_1036 February 2007 | [M + H]+ | −1.1 | |
| Frag 1 | 0.9 | 0.70 ± 0.05 | |
| Frag 2 | −0.1 | ||
| Frag 3 | 0.4 | ||
| TB_1037 February 2007 | [M + H]+ | 2.0 | |
| Frag 1 | −3.3 | 0.75 ± 0.03 | |
| Frag 2 | 2.6 | ||
| Frag 3 | 3.5 | ||
| TB_1359 January 2008 | [M + H]+ | 1.9 | |
| Frag 1 | −2.6 | 0.48 ± 0.03 | |
| Frag 2 | −3.8 | ||
| Frag 3 | −3.1 | ||
| TB_1360 January 2008 | [M + H]+ | 3.8 | |
| Frag 1 | −2.5 | 0.28 ± 0.02 | |
| Frag 2 | −3.7 | ||
| Frag 3 | −2.9 | ||
| TB_1363 January 2008 | [M + H]+ | 1.9 | |
| Frag 1 | −2.7 | 0.93 ± 0.02 | |
| Frag 2 | −3.9 | ||
| Frag 3 | −3.2 | ||
| TB_1367 January 2008 | [M + H]+ | 4.1 | |
| Frag 1 | −3.4 | 0.65 ± 0.06 | |
| Frag 2 | −4.7 | ||
| Frag 3 | −4.0 | ||
| TB_1374 July 2008 | [M + H]+ | −0.1 | |
| Frag 1 | −3.4 | 0.55 ± 0.01 | |
| Frag 2 | −4.3 | ||
| Frag 3 | −3.4 | ||
| TB_1378 July 2008 | [M + H]+ | −2.8 | |
| Frag 1 | −3.3 | 0.47 ± 0.07 | |
| Frag 2 | −4.1 | ||
| Frag 3 | −3.4 | ||
| TB_1379 July 2008 | [M + H]+ | −1.1 | |
| Frag 1 | −3.1 | 0.34 ± 0.02 | |
| Frag 2 | −4.8 | ||
| Frag 3 | −2.5 | ||
| TB_1381 July 2008 | [M + H]+ | 8.7 | |
| Frag 1 | −3.3 | 0.33 ± 0.02 | |
| Frag 2 | −5.0 | ||
| Frag 3 | −4.0 | ||
| TB_1614 Juny 2009 | [M + H]+ | −0.8 | |
| Frag 1 | −2.9 | 0.58 ± 0.06 | |
| Frag 2 | −5.1 | ||
| Frag 3 | −1.0 | ||
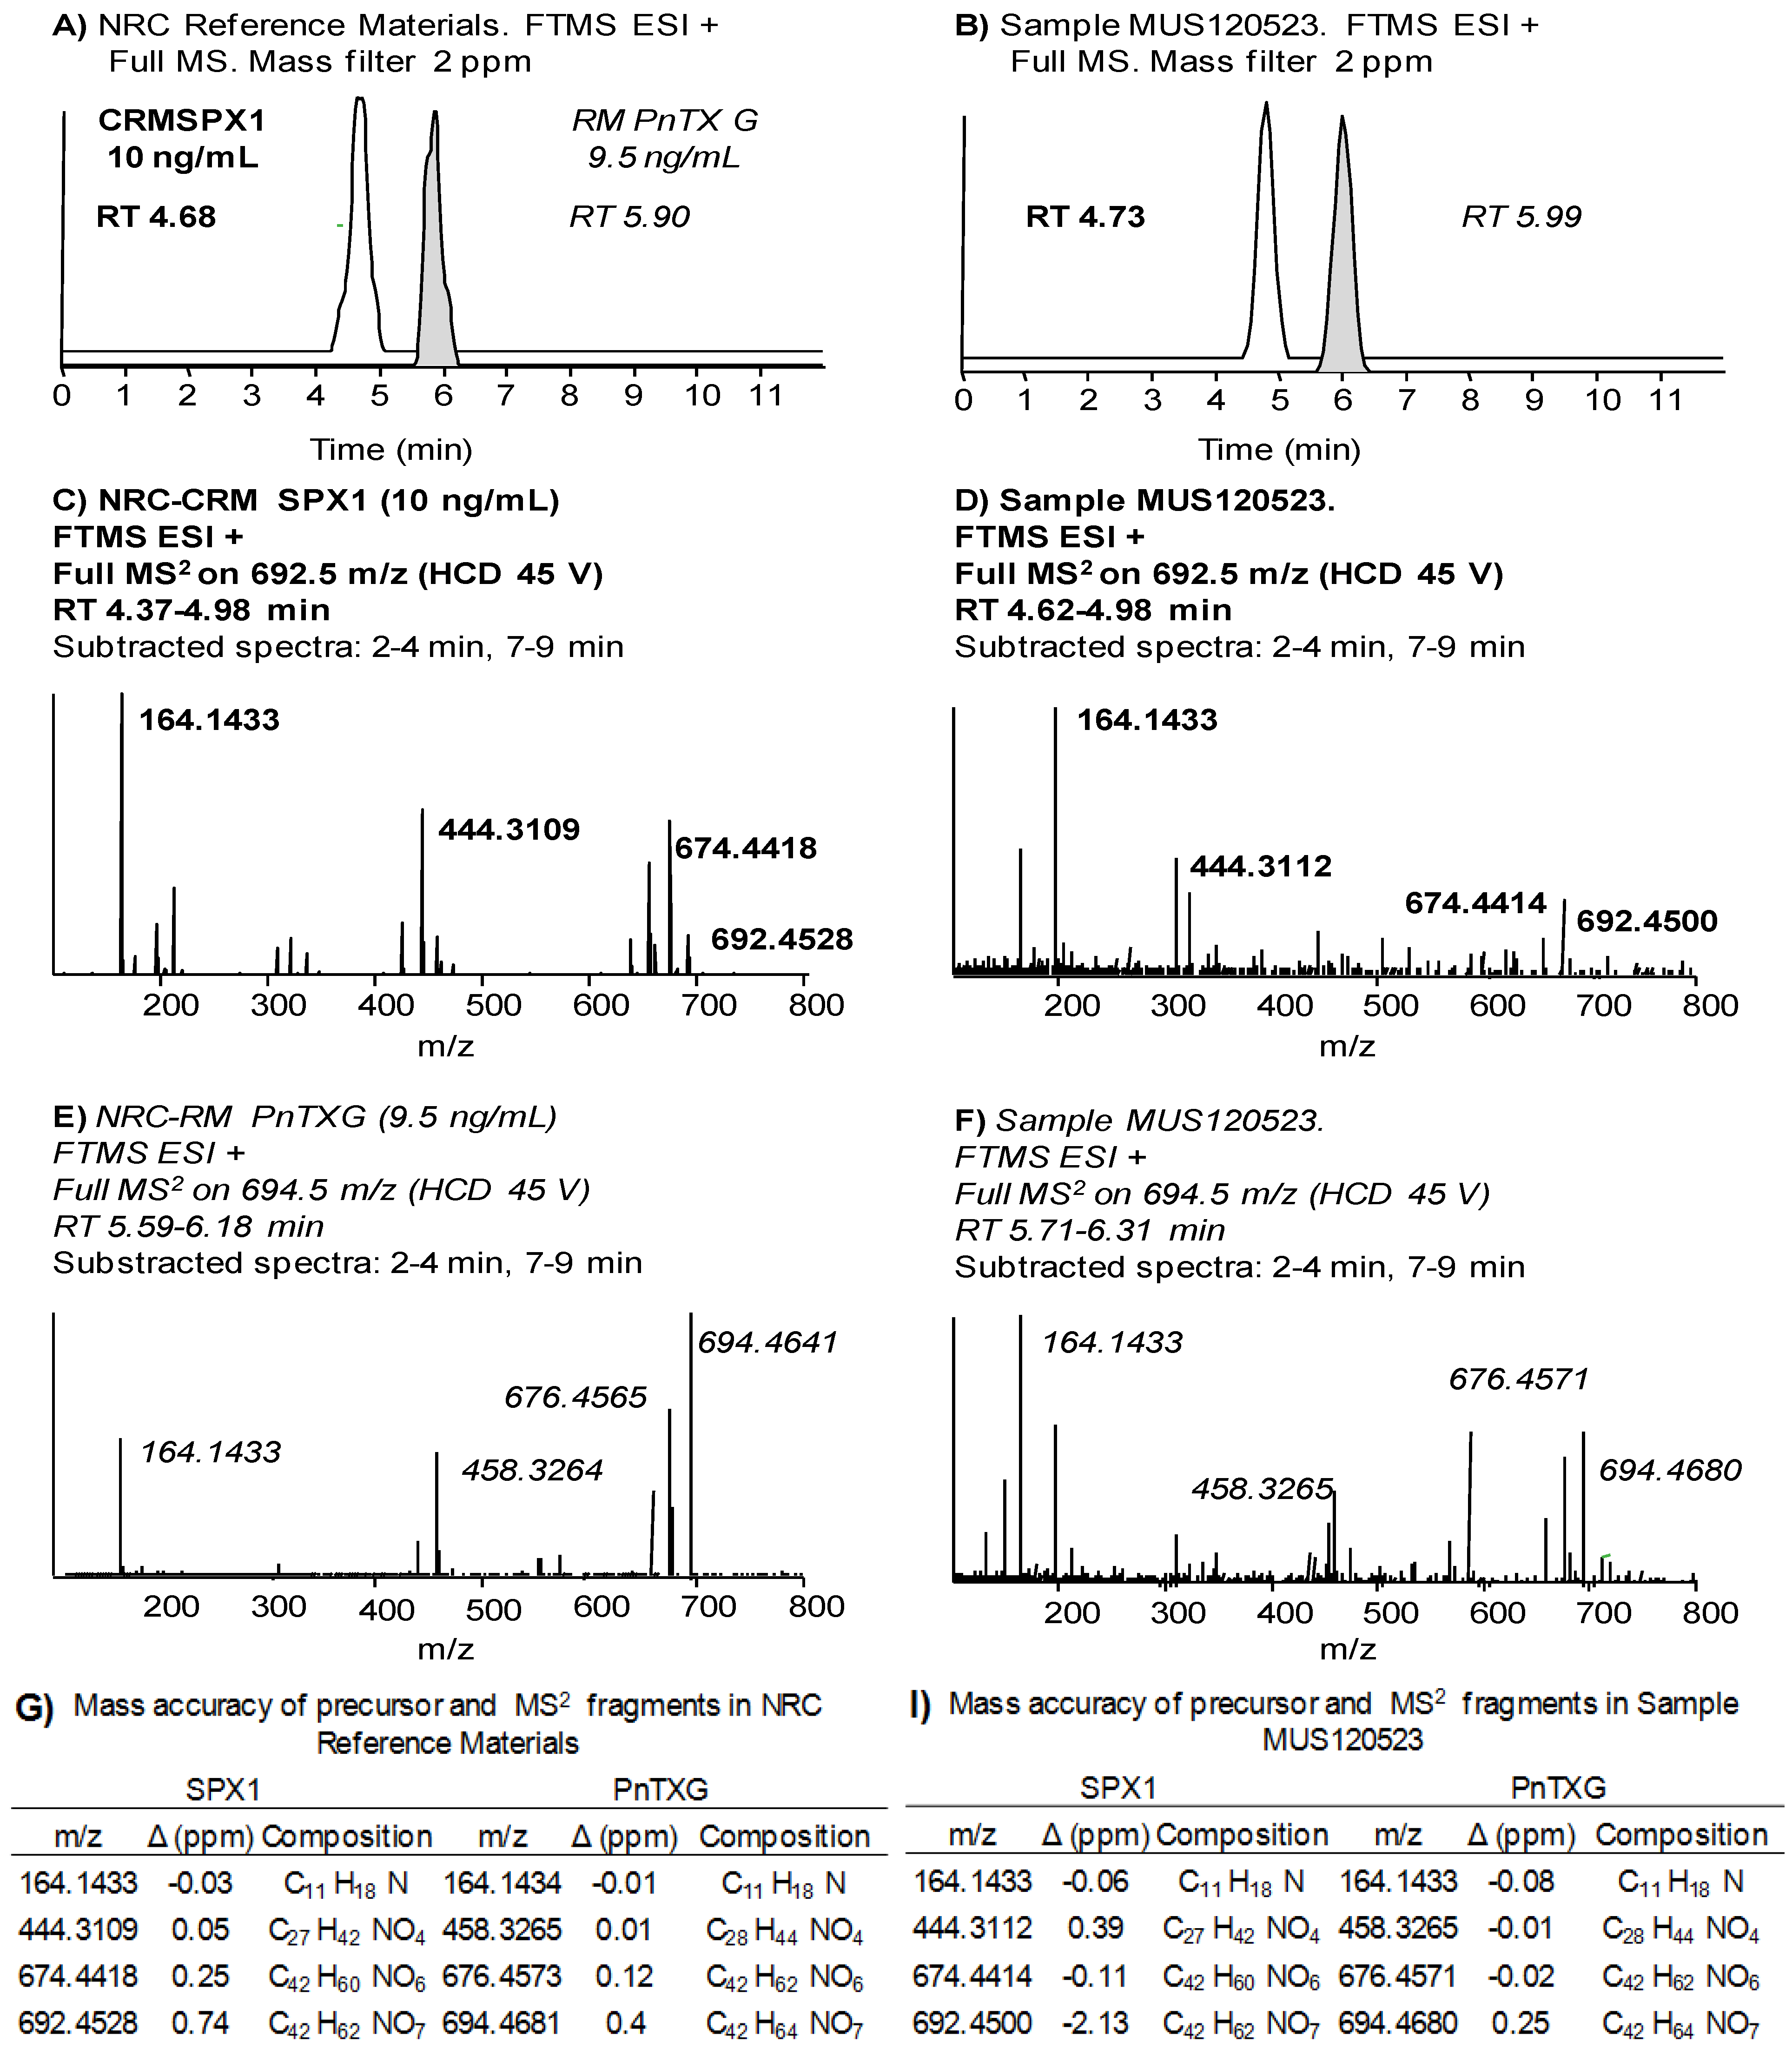
2.1. Unambiguous Confirmation and Quantification of PnTX-G and SPX-1

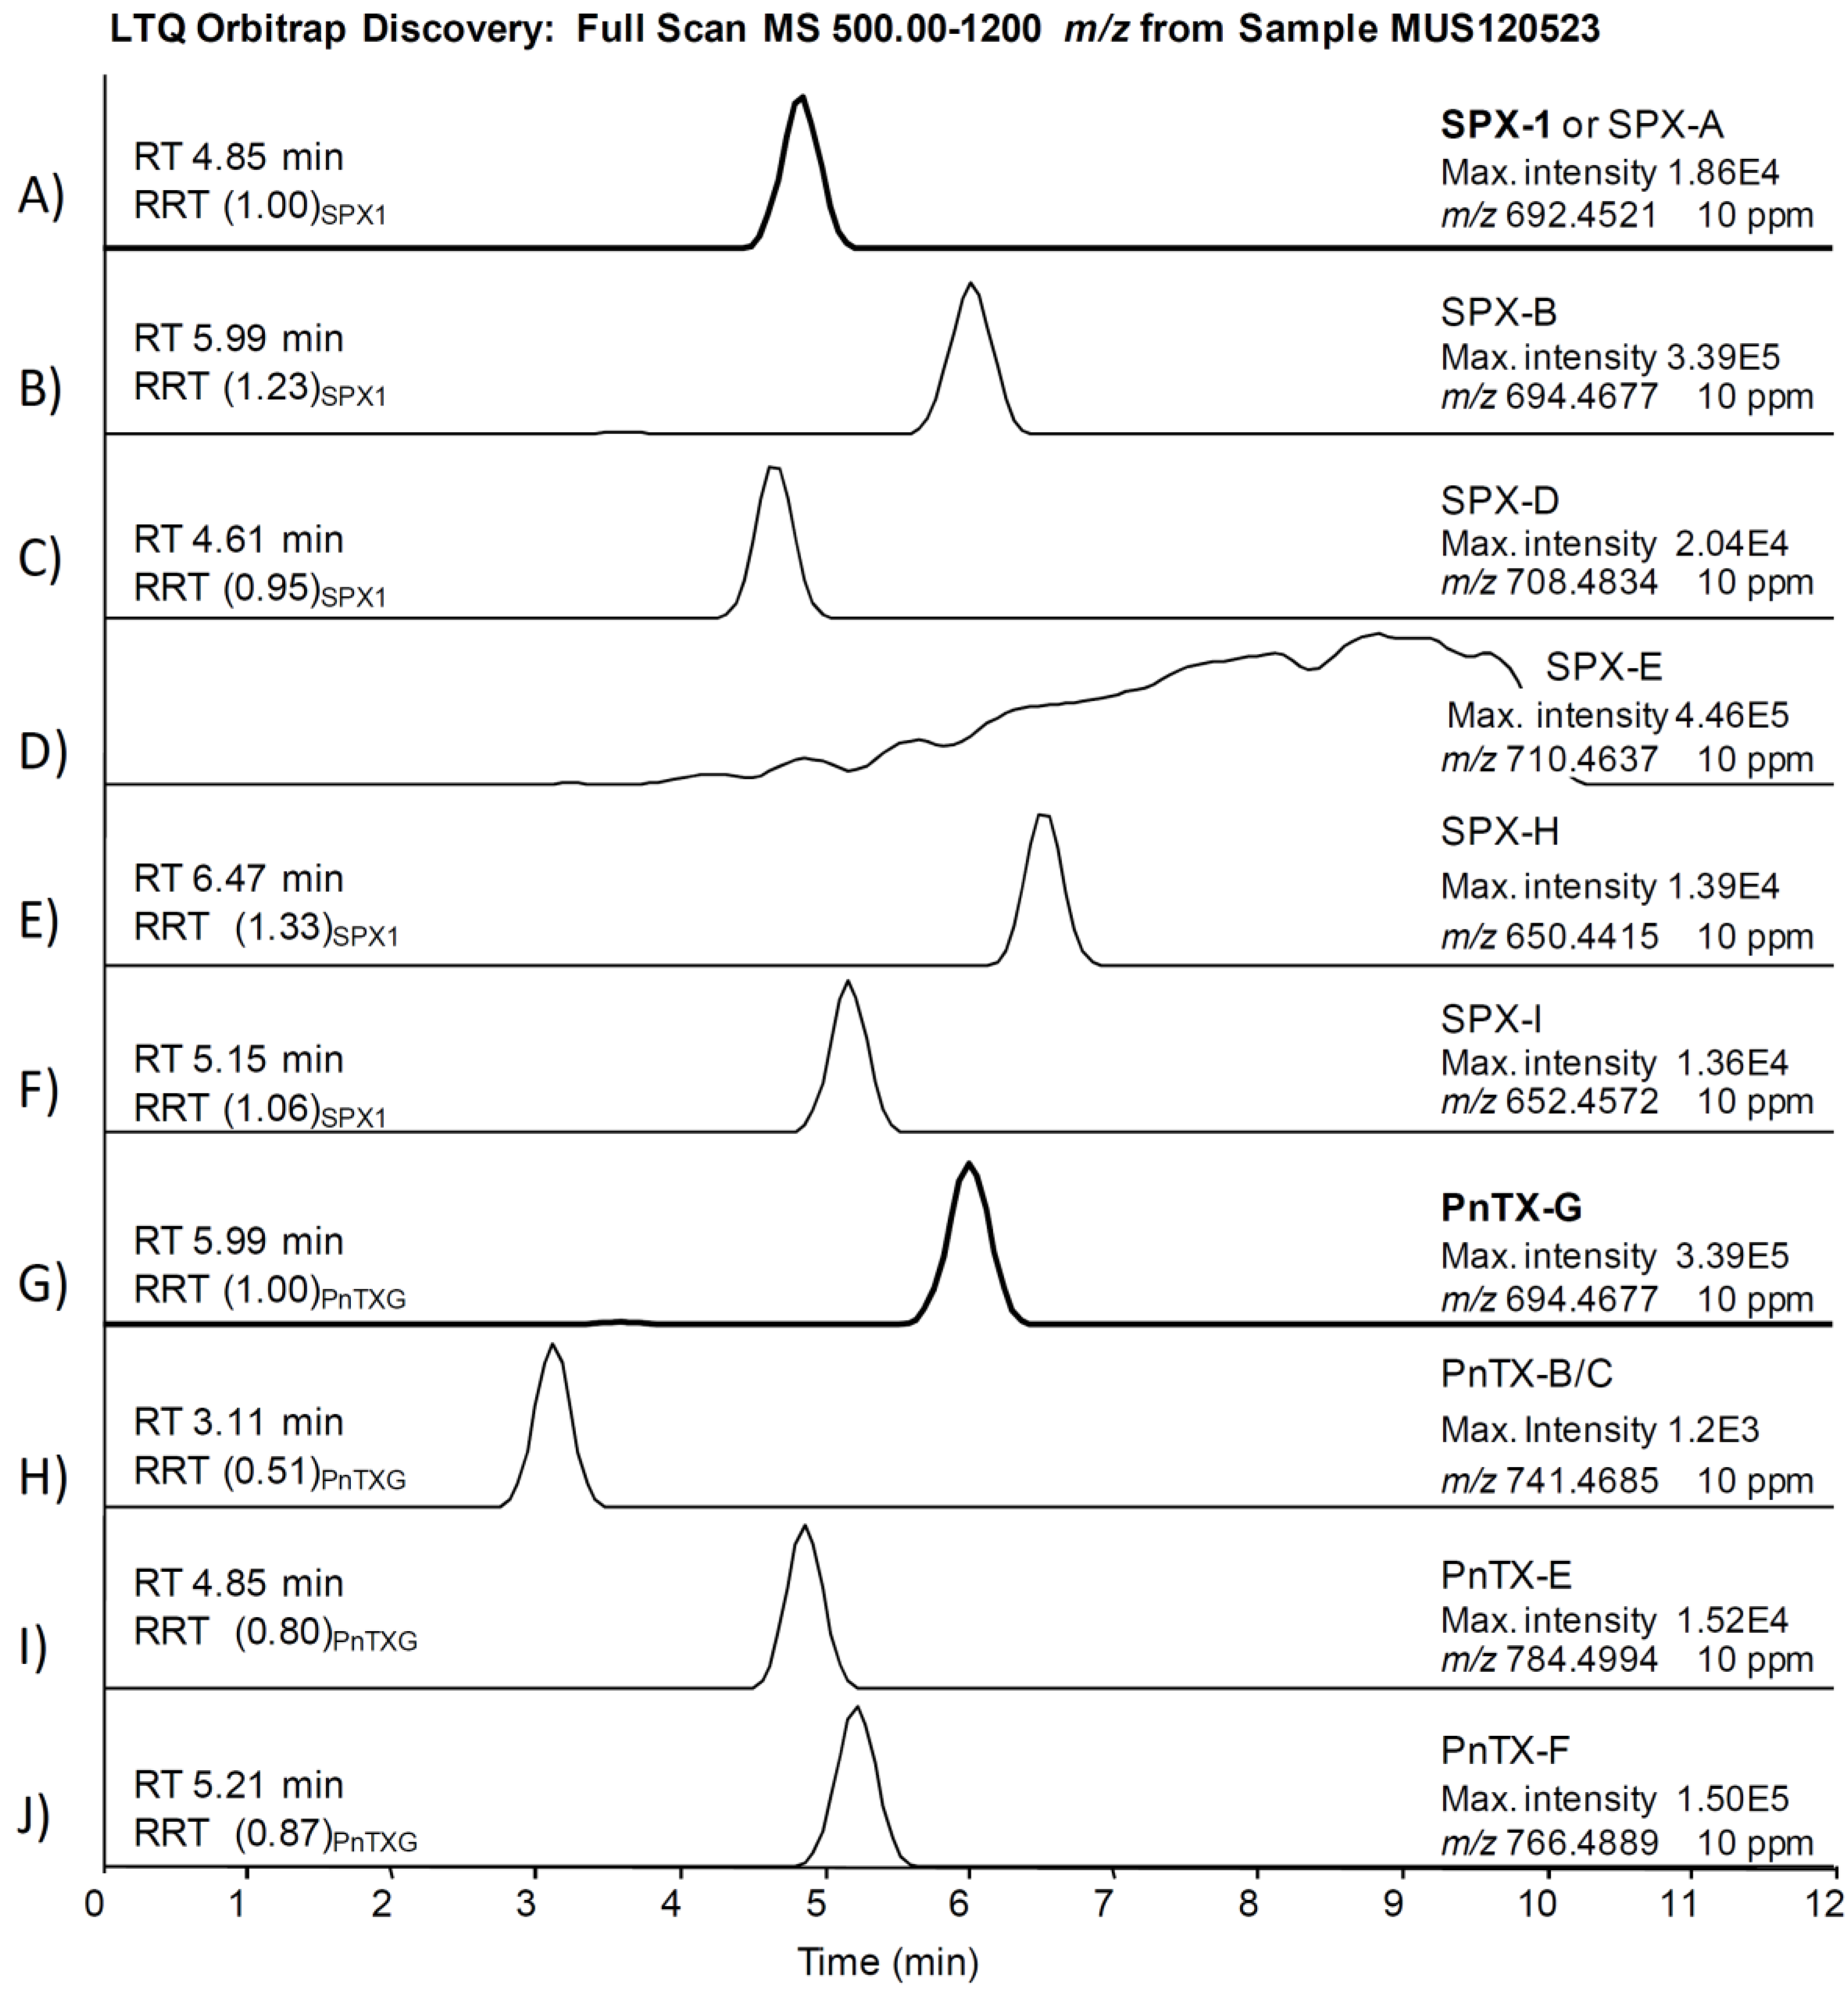
2.2. Study of PnTX-G and SPX-1 Analogs without Reference Standard Materials


2.3. Search for Acyl Ester Derivatives of Pinnatoxins and Spirolides
2.4. Quality Assessment of the Methods
2.4.1. Low Resolution MS with the Triple Quadrupole 3200QTrap®
| SPX-1 | PnTX-G | ||
|---|---|---|---|
| Linearity range (ng/mL) (n = 15) | 2.5–50 | 2.5–50 | |
| RT (average, n = 75) | 6.33 | 7.36 | |
| % drift | 0.3 | 0.2 | |
| Product ion ratios (%) (n = 30) | Area MRM2/Area MRM1 | 40.7 | 77.1 |
| % variation in mussels | −1.0% | 0.3% | |
| % variation in oysters | −4.9% | 0.1% | |
| Recovery (%) (n = 9) | Mussel | 91.6 | 77.6 |
| Oyster | 81.0 | 66.6 | |
| Intra-day precision (RSDr) (%) (n = 9) | Mussel | 2.6 | 2.9 |
| Oyster | 3.1 | 2.5 | |
| Inter-day precision (RSDR) (%) (n = 9) | Mussel | 7.0 | 6.8 |
| Oyster | 7.1 | 6.2 | |
| LOQ (μg/kg) (n = 3) | Mussel | 19.6 | 56.1 |
| Oyster | 0.7 | 0.9 | |
| LOD (μg/kg) (n = 3) | Mussel | 5.5 | 10.8 |
| Oyster | 1.1 | 0.5 | |
2.4.2. High resolution MS with the LTQ Orbitrap Discovery®
| NRC CRM SPX-1 | NRC CRM PnTX-G | |||||||
|---|---|---|---|---|---|---|---|---|
| RT (min) | ||||||||
| Average % drift | 4.75 2 | 5.92 1 | ||||||
| Fragment 1 | Fragment 2 | Fragment 3 | Precursor | Fragment 1 | Fragment 2 | Fragment 3 | Precursor | |
| Exact mass | 164.1434 | 444.3108 | 674.4415 | 692.4521 | 164.1434 | 458.3265 | 676.4572 | 694.4677 |
| Mass Accuracy (Δ ppm) | ||||||||
| Average | −0.3 | 0.1 | 0.4 | 0.5 | −0.4 | −0.5 | −0.1 | 0.1 |
| Max. | −2.0 | −1.6 | −0.9 | 0.7 | −1.7 | −1.8 | −1.4 | −1.6 |
| Ion Ratios | ||||||||
| % of Frag 1 intensity | 100 | 53 | 50 | 94 | 69 | 100 | ||
| % difference | 19 | 23 | 22 | 15 | ||||
3. Experimental Section
3.1. Standards and Chemicals
3.2. Preparation of Extracts
3.3. Chromatographic Separation
3.4. Mass Spectrometry
3.5. Method Performance and Quality Control

3.6. Identification and Assessment of Identification Criteria
4. Conclusions
- (1)
- Fast and sensitive screening in low resolution MS with a 3200QTrap® triple quadrupole using diagnostic transitions for all PnTXs and SPXs described up to date.
- (2)
- Confirmation analysis in high resolution MS with an LTQ Orbitrap Discovery® that included the inspection of isotopic patterns and MS2 spectra, and the look for the precursor ion and three diagnostic product ions with a mass tolerance window selected accordingly to the method performance.
Supplementary Files
Acknowledgments
Author Contributions
Conflicts of Interest
References
- Guéret, S.; Brimble, M. Spiroimine shellfish poisoning (SSP) and the spirolide family of shellfish toxins: Isolation, structure, biological activity and synthesis. Nat. Prod. Rep. 2010, 27, 1350–1366. [Google Scholar] [CrossRef]
- Otero, A.; Chapela, M.-J.; Atanassova, M.; Vieites, J.M.; Cabado, A.G. Cyclic imines: Chemistry and mechanism of action: A review. Chem. Res. Toxicol. 2011, 24, 1817–1829. [Google Scholar]
- Kita, M.; Ohishi, N.; Washida, K.; Kondo, M.; Koyama, T.; Yamada, K.; Uemura, D. Symbioimine and neosymbioimine, amphoteric iminium metabolites from the symbiotic marine dinoflagellate Symbiodinium sp. Bioorg. Med. Chem. 2005, 13, 5253–5258. [Google Scholar] [CrossRef]
- Selwood, A.I.; Wilkins, A.L.; Munday, R.; Shi, F.; Rhodes, L.L.; Holland, P.T. Portimine: A bioactive metabolite from the benthic dinoflagellate Vulcanodinium rugosum. Tetrahedron Lett. 2013, 54, 4705–4707. [Google Scholar]
- Duroure, L.; Jousseaume, T.; Aráoz, R.; Barré, E.; Retailleau, P.; Chabaud, L.; Molgó, J.; Guillou, C. 6,6-Spiroimine analogs of (−)-gymnodimine A: Synthesis and biological evaluation on nicotinic acetylcholine receptors. Org. Biomol. Chem. 2011, 9, 8112–8118. [Google Scholar] [CrossRef]
- Hu, T.; Curtis, J.M.; Oshima, Y.; Quilliam, M.A.; Walter, J.A.; Watson-Wright, W.M.; Wright, J.L.C. Spirolides B and D, two novel macrocycles isolated from the digestive glands of shellfish. J. Chem. Soc. Chem. Commun. 1995. [Google Scholar] [CrossRef]
- Hu, T.; Burton, I.; Cembella, A.; Curtis, J.; Quilliam, M.; Walter, J.; Wright, J.; Walker, J. Characterization of spirolides a, c, and 13-desmethyl c, new marine toxins isolated from toxic plankton and contaminated shellfish. J. Nat. Prod. 2001, 64, 308–312. [Google Scholar]
- Sleno, L.; Windust, A.J.; Volmer, D.A. Structural study of spirolide marine toxins by mass spectrometry: Part I. Fragmentation pathways of 13-desmethyl spirolide C by collision-induced dissociation and infrared multiphoton dissociation mass spectrometry. Anal. Bioanal. Chem. 2004, 378, 969–976. [Google Scholar] [CrossRef]
- Hu, T.; Curtis, J.; Walter, J.; Wright, J.; Walker, J. Characterization of biologically inactive spirolides E and F: Identification of the spirolide pharmacophore. Tetrahedron Lett. 1996, 37, 7671–7674. [Google Scholar]
- MacKinnon, S.; Walter, J.; Quilliam, M.; Cembella, A.; LeBlanc, P.; Burton, I.; Hardstaff, W.; Lewis, N. Spirolides Isolated from Danish Strains of the Toxigenic Dinoflagellate Alexandrium ostenfeldii. J. Nat. Prod. 2006, 69, 8–12. [Google Scholar]
- Roach, J.S.; LeBlanc, P.; Lewis, N.I.; Munday, R.; Quilliam, M.A.; MacKinnon, S.L. Characterization of a dispiroketal spirolide subclass from Alexandrium ostenfeldii. J. Nat. Prod. 2009, 72, 1237–1240. [Google Scholar] [CrossRef]
- Ciminiello, P.; Dell’Aversano, C.; Fattorusso, E.; Forino, M.; Grauso, L.; Tartaglione, L.; Guerrini, F.; Pistocchi, R. Spirolide toxin profile of adriatic Alexandrium ostenfeldii cultures and structure elucidation of 27-hydroxy-13,19-didesmethyl spirolide C. J. Nat. Prod. 2007, 70, 1878–1883. [Google Scholar] [CrossRef]
- Sleno, L.; Chalmers, M.; Chamorro, M.; Windust, A. Structural study of spirolide marine toxins by mass spectrometry. Part II. Mass spectrometric characterization of unknown spirolides and related compounds in a cultured phytoplankton extract. Anal. Bioanal. Chem. 2004, 378, 977–986. [Google Scholar] [CrossRef]
- Ciminiello, P.; Dell’aversano, C.; Iacovo, E.D.; Fattorusso, E.; Forino, M.; Grauso, L.; Tartaglione, L.; Guerrini, F.; Pezzolesi, L.; Pistocchi, R. Characterization of 27-hydroxy-13-desmethyl spirolide C and 27-oxo-13,19-didesmethyl spirolide C. Further insights into the complex Adriatic Alexandrium ostenfeldii toxin profile. Toxicon 2010, 56, 1327–1333. [Google Scholar] [CrossRef]
- Aasen, J.; Hardstaff, W.; Aune, T.; Quilliam, M.A. Discovery of fatty acid ester metabolites of spirolide toxins in mussels from Norway using liquid chromatography/tandem mass spectrometry. Rapid Commun. Mass Spectrom. 2006, 20, 1531–1537. [Google Scholar] [CrossRef]
- Rundberget, T.; Aasen, J.; Selwood, A.; Miles, C. Pinnatoxins and spirolides in Norwegian blue mussels and seawater. Toxicon 2011, 58, 700–711. [Google Scholar] [CrossRef]
- Selwood, A.; Miles, C.; Wilkins, A.; van Ginkel, R.; Munday, R.; Rise, F.; McNabb, P. Isolation, structural determination and acute toxicity of pinnatoxins E, F and G. J. Agric. Food Chem. 2010, 58, 6532–6542. [Google Scholar]
- McCarron, P.; Rourke, W.; Hardstaff, W.; Pooley, B.; Quilliam, M. Identification of pinnatoxins and discovery of their fatty acid ester metabolites in mussels (Mytilus edulis) from eastern Canada. J. Agric. Food Chem. 2012, 60, 1437–1446. [Google Scholar] [CrossRef]
- Uemura, D.; Chou, T.; Haino, T.; Nagatsu, A.; Fukuzawa, S.; Zheng, S.-Z.; Chen, H.-S. Pinnatoxin A: A toxic amphoteric macrocycle from the Okinawan bivalve Pinna muricata. J. Chem. Soc. 1995, 117, 1155–1156. [Google Scholar]
- Takada, N.; Umemura, N.; Suenaga, K.; Chou, T.; Nagatsu, A.; Haino, T.; Yamada, K.; Uemura, D. Pinnatoxins B and C, the most toxic components in the pinnatoxin series from the Okinawan bivalve Pinna muricata. Tetrahedron Lett. 2001, 42, 3491–3494. [Google Scholar]
- Hellyer, S.; Selwood, A.; Rhodes, L.; Kerr, S. Marine algal pinnatoxins E and F cause neuromuscular block in an in vitro hemidiaphragm preparation. Toxicon 2011, 58, 693–699. [Google Scholar]
- Bourne, Y.; Radic, Z.; Aráoz, R.; Talley, T.T.; Benoit, E.; Servent, D.; Taylor, P.; Molgó, J.; Marchot, P.; Radić, Z. Structural determinants in phycotoxins and AChBP conferring high affinity binding and nicotinic AChR antagonism. Proc. Natl. Acad. Sci. USA 2010, 107, 6076–6081. [Google Scholar] [CrossRef]
- Hauser, T.A.; Hepler, C.D.; Kombo, D.C.; Grinevich, V.P.; Kiser, M.N.; Hooker, D.N.; Zhang, J.; Mountfort, D.; Selwood, A.; Akireddy, S.R.; et al. Comparison of acetylcholine receptor interactions of the marine toxins, 13-desmethylspirolide C and gymnodimine. Neuropharmacology 2012, 62, 2238–2249. [Google Scholar]
- Marrouchi, R.; Rome, G.; Kharrat, R.; Molgò, J.; Benoit, E. Analysis of the action of gymnodimine-A and 13-desmethyl spirolide C on the mouse neuromuscular system in vivo. Toxicon 2013, 75, 27–34. [Google Scholar] [CrossRef]
- Rhodes, L.; Smith, K.; Selwood, A.; McNabb, P.; Munday, R.; Molenaar, S. Dinoflagellate Vulcanodinium rugosum identified as the causative organism of pinnatoxins in Australia, New Zealand and Japan. Phycologia 2011, 50, 624–628. [Google Scholar] [CrossRef]
- Haywood, A.; Steidinger, K.A.; Truby, E.W.; Bergquist, P.R.; Bergquist, P.L.; Adamson, J.; MacKenzie, L. Comparative morphology and molecular phylogenetic analysis of three new species of the genus Karenia (Dinophyceae) from New Zealand. J. Phycol. 2004, 40, 165–179. [Google Scholar] [CrossRef]
- Kremp, A.; Tahvanainen, P.; Litaker, W.; Krock, B.; Suikkanen, S.; Leaw, C.P.; Tomas, C. Phylogenetic relationships, morphological variation, and toxin patterns in the Alexandrium ostenfeldii (Dinophyceae) complex: Implications for species boundaries and identities. J. Phycol. 2014, 50, 81–100. [Google Scholar] [CrossRef]
- Cembella, A.; Lewis, N.; Quilliam, M. The marine dinoflagellate Alexandrium ostenfeldii (Dinophyceae) as the causative organism of spirolide shellfish toxins. Phycologia 2000, 39, 67–74. [Google Scholar] [CrossRef]
- Touzet, N.; Franco, J.M.; Raine, R. Morphogenetic diversity and biotoxin composition of Alexandrium (Dinophyceae) in Irish coastal waters. Harmful Algae 2008, 7, 782–797. [Google Scholar] [CrossRef]
- Tomas, C.; van Wagoner, R.; Tatters, A.; White, K.; Hall, S.; Wright, J. Alexandrium peruvianum (Balech and Mendiola) Balech and Tangen a new toxic species for coastal North Carolina. Harmful Algae 2012, 17, 54–63. [Google Scholar] [CrossRef]
- Van Wagoner, R.M.; Misner, I.; Tomas, C.R.; Wright, J.L.C. Occurrence of 12-methylgymnodimine in a spirolide-producing dinoflagellate Alexandrium peruvianum and the biogenetic implications. Tetrahedron Lett. 2011, 52, 4243–4246. [Google Scholar] [CrossRef]
- Zheng, S.; Huang, F.; Chen, S.; Tan, X.; Zuo, J.; Peng, J.; Xie, R. The isolation and bioactivities of pinnatoxin. Chin. J. Mar. Drugs 1990, 33, 33–35. [Google Scholar]
- Rhodes, L.; Smith, K.; Selwood, A.; McNabb, P.; Molenaar, S.; Munday, R.R.; Wilkinson, C.; Hallegraeff, G. Production of pinnatoxins E, F and G by scrippsielloid dinoflagellates isolated from Franklin Harbour, South Australia. N. Z. J. Mar. Freshw. Res. 2011, 45, 703–709. [Google Scholar] [CrossRef]
- Hess, P.; Abadie, E.; Hervè, F.; Berteaux, T.; Séchet, V.; Aráoz, R.; Molgó, J.; Zakarian, A.; Sibat, M.; Rundberget, T.; et al. Pinnatoxin G is responsible for atypical toxicity in mussels (Mytilus galloprovincialis) and clams (Venerupis decussata) from Ingril, a French Mediterranean lagoon. Toxicon 2013, 75, 16–26. [Google Scholar]
- Álvarez, G.; Uribe, E.; Ávalos, P.; Mariño, C.; Blanco, J.; Alvarez, G.; Avalos, P. First identification of azaspiracid and spirolides in Mesodesma donacium and Mulinia edulis from Northern Chile. Toxicon 2010, 55, 638–641. [Google Scholar] [CrossRef]
- Amzil, Z.; Sibat, M.; Royer, F.; Masson, N.; Abadie, E. Report on the first detection of pectenotoxin-2, spirolide-a and their derivatives in French shellfish. Mar. Drugs 2007, 5, 168–179. [Google Scholar]
- Ciminiello, P.; Dell’Aversano, C.; Fattorusso, E.; Magno, S.; Tartaglione, L.; Cangini, M.; Pompei, M.; Guerrini, F.; Boni, L.; Pistocchi, R. Toxin profile of Alexandrium ostenfeldii (Dinophyceae) from the Northern Adriatic Sea revealed by liquid chromatography-mass spectrometry. Toxicon 2006, 47, 597–604. [Google Scholar] [CrossRef]
- Gribble, K.; Keafer, B.; Quilliam, M.; Cembella, A.; Kulis, D.; Manahan, A.; Anderson, D. Distribution and toxicity of Alexandrium ostenfeldii (Dinophyceae) in the Gulf of Maine, USA. DeepSea Res. Part II 2005, 52, 2745–2763. [Google Scholar] [CrossRef]
- MacKinnon, S.; Cembella, A.; Burton, I.; Lewis, N.; LeBlanc, P.; Walter, J. Biosynthesis of 13-desmethyl spirolide C by the dinoflagellate Alexandrium ostenfeldii. J. Org. Chem. 2006, 71, 8724–8731. [Google Scholar] [CrossRef]
- Villar-González, A.; Rodríguez-Velasco, M.L.; Ben-Gigirey, B.; Botana, L.M.; González, A.V.; Villar González, A. First evidence of spirolides in Spanish shellfish. Toxicon 2006, 48, 1068–1074. [Google Scholar] [CrossRef]
- Biré, R.; Krys, S.; Frémy, J.-M.; Dragacci, S.; Stirling, D.; Kharrat, R. First evidence on occurrence of gymnodimine in clams from Tunisia. J. Nat. Toxins 2002, 11, 269–275. [Google Scholar]
- Ciminiello, P.; Dell’Aversano, C.; Fattorusso, E.; Forino, M.; Tartaglione, L.; Boschetti, L.; Rubini, S.; Cangini, M.; Pigozzi, S.; Poletti, R. Complex toxin profile of Mytilus galloprovincialis from the Adriatic sea revealed by LC-MS. Toxicon 2010, 55, 280–288. [Google Scholar] [CrossRef]
- Satta, C.T.; Anglès, S.; Lugliè, A.; Guillén, J.; Sechi, N.; Camp, J.; Garcés, E. Studies on dinoflagellate cyst assemblages in two estuarine Mediterranean bays: A useful tool for the discovery and mapping of harmful algal species. Harmful Algae 2013, 24, 65–79. [Google Scholar] [CrossRef]
- European Food Safety Authority (EFSA), Panel on Contaminants in the Food Chain (CONTAM). Scientific Opinion on marine biotoxins in shellfish—Cyclic imines (spirolides, gymnodimines, pinnatoxins and pteriatoxins). EFSA J. 2010, 8, 1628–1667. [Google Scholar]
- Perry, R.H.; Cooks, R.G.; Noll, R.J. Orbitrap Mass Spectrometry: Instrumentation, ion motion and applications. Mass Spectrom. Rev. 2008, 27, 661–699. [Google Scholar] [CrossRef]
- Makarov, A.; Denisov, E.; Lange, O. Dynamic Range of Mass Accuracy in LTQ Orbitrap Hybrid Mass Spectrometer. J. Am. Soc. Mass Spectrom. 2006, 17, 3–8. [Google Scholar]
- Gerssen, A.; Mulder, P.P.J.; de Boer, J. Screening of lipophilic marine toxins in shellfish and algae: Development of a library using liquid chromatography coupled to Orbitrap mass spectrometry. Anal. Chim. Acta 2011, 685, 176–185. [Google Scholar] [CrossRef]
- Blay, P.; Hui, J.P.M.; Chang, J.; Melanson, J.E. Screening for multiple classes of marine biotoxins by liquid chromatography-high-resolution mass spectrometry. Anal. Bioanal. Chem. 2011, 400, 577–585. [Google Scholar] [CrossRef]
- Domènech, A.; Cortés-Francisco, N.; Palacios, O.; Franco, J.M.; Riobó, P.; Llerena, J.J.; Vichi, S.; Caixach, J. Determination of lipophilic marine toxins in mussels. Quantification and confirmation criteria using high resolution mass spectrometry. J. Chromatogr. A 2014, 1328, 16–25. [Google Scholar]
- Kaufmann, A.; Walker, S. Evaluation of the interrelationship between mass resolving power and mass error tolerances for targeted bioanalysis using liquid chromatography coupled to high-resolution mass spectrometry. Rapid Commun. Mass Spectrom. 2012, 27, 347–356. [Google Scholar] [CrossRef]
- Van der Heeft, E.; Bolck, Y.J.C.; Beumer, B.; Nijrolder, A.W.J.M.; Stolker, A.A.M.; Nielen, M.W.F. Full-Scan Accurate Mass Selectivity of Ultra-Performance Liquid Chromatography Combined with Time-of-Flight and Orbitrap Mass Spectrometry in Hormone and Veterinary Drug Residue Analysis. J. Am. Soc. Mass Spectrom. 2009, 20, 451–463. [Google Scholar]
- Kaufmann, A.; Walker, S. Post-run target screening strategy for ultra high performance liquid chromatography coupled to Orbitrap based veterinary drug residue analysis in animal urine. J. Chromatogr. A 2013, 1292, 104–110. [Google Scholar]
- Kaufmann, A.; Walker, S. Accuracy of relative isotopic abundance and mass measurements in a single-stage orbitrap mass spectrometer. Rapid Commun. Mass Spectrom. 2012, 26, 1081–1090. [Google Scholar] [CrossRef]
- Xu, Y.; Heilier, J.F.; Madalinski, G.; Genin, E.; Ezan, E.; Tabet, J.C.; Junot, C. Evaluation of accurate mass and relative isotopic abundance measurements in the LTQ-Orbitrap mass spectrometer for further metabolomics database building. Anal. Chem. 2010, 82, 5490–5501. [Google Scholar] [CrossRef]
- De la Iglesia, P.; McCarron, P.; Diogène, J.; Quilliam, M.A. Discovery of gymnodimine fatty acid ester metabolites in shellfish using liquid chromatography/mass spectrometry. Rapid Commun. Mass Spectrom. 2013, 27, 643–653. [Google Scholar]
- European Commission. 2002/657/EC: Commission Decision of 12 August 2002 implementing Council Directive 96/23/EC concerning the performance of analytical methods and the interpretation of results. Off. J. Eur. Union. 2002, L221, 8–36. [Google Scholar]
- Stolker, A.A.M.; Linders, S.H.M.A.; van Ginkel, L.A.; Brinkman, U.A.T. Application of the revised EU criteria for the confirmation of anabolic steroids in meat using GC-MS. Anal. Bioanal. Chem. 2004, 378, 1313–1321. [Google Scholar] [CrossRef]
- García-Altares, M.; Diogène, J.; de la Iglesia, P. The implementation of liquid chromatography tandem mass spectrometry for the official control of lipophilic toxins in seafood: Single-laboratory validation under four chromatographic conditions. J. Chromatogr. A 2013, 1275, 48–60. [Google Scholar]
- De Zeeuw, R. Substance identification: The weak link in analytical toxicology. J. Chromatogr. B 2004, 811, 3–12. [Google Scholar]
- Lehotay, S.; Mastovska, K.; Amirav, A.; Fialkov, A.; Martos, P.; Kok, A.; Fernández-Alba, A. Identification and confirmation of chemical residues in food by chromatography-mass spectrometry and other techniques. TrAC Trends Anal. Chem. 2008, 27, 1070–1090. [Google Scholar] [CrossRef]
- Mol, H.; Zomer, P.; De Koning, M. Qualitative aspects and validation of a screening method for pesticides in vegetables and fruits based on liquid chromatography coupled to full scan high resolution (Orbitrap) mass spectrometry. Anal. Bioanal. Chem. 2012, 403, 2891–2908. [Google Scholar] [CrossRef]
- Nielen, M.W.F.; van Engelen, M.C.; Zuiderent, R.; Ramaker, R. Screening and confirmation criteria for hormone residue analysis using liquid chromatography accurate mass time-of-flight, Fourier transform ion cyclotron resonance and orbitrap mass spectrometry techniques. Anal. Chim. Acta 2007, 586, 122–129. [Google Scholar] [CrossRef]
- Gerssen, A.; Mulder, P.; McElhinney, M.A.; de Boer, J. Liquid chromatography-tandem mass spectrometry method for the detection of marine lipophilic toxins under alkaline conditions. J. Chromatogr. A 2009, 1216, 1421–1430. [Google Scholar]
- Community Reference Laboratory on Marine Biotoxins. In Interlaboratory Validation Study of the EU-Harmonised SOP-LIPO-LC-MS/MS; EURLMB: Vigo, Spain, 2011; Version 4.
- Mountfort, D.O.; Suzuki, T.; Truman, P. Protein phosphatase inhibition assay adapted for determination of total DSP in contaminated mussels. Toxicon 2000, 39, 383–390. [Google Scholar] [CrossRef]
- MacKenzie, L.A. In situ passive solid-phase adsorption of micro-algal biotoxins as a monitoring tool. Curr. Opin. Biotechnol. 2002, 21, 326–331. [Google Scholar] [CrossRef]
- Caillaud, A.; de la Iglesia, P.; Barber, E.; Eixarch, H.; Mohammad-Noor, N.; Yasumoto, T.; Diogène, J. Monitoring of dissolved ciguatoxin and maitotoxin using solid-phase adsorption toxin tracking devices: Application to Gambierdiscus pacificus in culture. Harmful Algae 2011, 10, 433–446. [Google Scholar] [CrossRef]
- Gerssen, A.; van Olst, E.; Mulder, P.; de Boer, J. In-house validation of a liquid chromatography tandem mass spectrometry method for the analysis of lipophilic marine toxins in shellfish using matrix-matched calibration. Anal. Bioanal. Chem. 2010, 397, 3079–3088. [Google Scholar] [CrossRef]
- Tran, J.C.; Doucette, A.A. Cyclic Polyamide Oligomers Extracted from Nylon 66 Membrane Filter Disks as a Source of Contamination in Liquid Chromatography/Mass Spectrometry. J. Am. Soc. Mass Spectrom. 2006, 17, 652–656. [Google Scholar] [CrossRef]
- Keller, B.O.; Sui, J.; Young, A.B.; Whittal, R.M. Interferences and contaminants encountered in modern mass spectrometry. Anal. Chim. Acta 2008, 627, 71–81. [Google Scholar] [CrossRef]
- Taverniers, I.; de Loose, M.; van Bockstaele, E. Trends in quality in the analytical laboratory. II. Analytical method validation and quality assurance. TrAC Trends Anal. Chem. 2004, 23, 535–552. [Google Scholar] [CrossRef]
- IUPAC Compendium of Chemical Terminology. In The Gold Book, 2nd ed.; McNaught, A.D.; Wilkinson, A. (Eds.) Blackwell Scientific Publications: Oxford, UK, 1997.
- Fassel, V.A.; International Union of Pure and Applied Chemistry. Analytical Chemistry Division. Commission on Spectrochemical and Other Optical Procedures for Analysis. Nomenclature, symbols, units and their usage in spectrochemical analysis. II. Data interpretation. (Rules approved 1975). Anal. Chem. 1976, 48, 2294. [Google Scholar] [CrossRef]
- Corley, J. Best practices in establishing detection and quantification limits for pesticide residues in foods. In Handbook of Residue Analytical Methods for Agrochemicals; Lee, P.W., Aizawa, H., Barefoot, A.C., Murphy, J.J., Eds.; Wiley & Sons: New York, NY, USA, 2003. [Google Scholar]
© 2014 by the authors; licensee MDPI, Basel, Switzerland. This article is an open access article distributed under the terms and conditions of the Creative Commons Attribution license (http://creativecommons.org/licenses/by/3.0/).
Share and Cite
García-Altares, M.; Casanova, A.; Bane, V.; Diogène, J.; Furey, A.; De la Iglesia, P. Confirmation of Pinnatoxins and Spirolides in Shellfish and Passive Samplers from Catalonia (Spain) by Liquid Chromatography Coupled with Triple Quadrupole and High-Resolution Hybrid Tandem Mass Spectrometry. Mar. Drugs 2014, 12, 3706-3732. https://doi.org/10.3390/md12063706
García-Altares M, Casanova A, Bane V, Diogène J, Furey A, De la Iglesia P. Confirmation of Pinnatoxins and Spirolides in Shellfish and Passive Samplers from Catalonia (Spain) by Liquid Chromatography Coupled with Triple Quadrupole and High-Resolution Hybrid Tandem Mass Spectrometry. Marine Drugs. 2014; 12(6):3706-3732. https://doi.org/10.3390/md12063706
Chicago/Turabian StyleGarcía-Altares, María, Alexis Casanova, Vaishali Bane, Jorge Diogène, Ambrose Furey, and Pablo De la Iglesia. 2014. "Confirmation of Pinnatoxins and Spirolides in Shellfish and Passive Samplers from Catalonia (Spain) by Liquid Chromatography Coupled with Triple Quadrupole and High-Resolution Hybrid Tandem Mass Spectrometry" Marine Drugs 12, no. 6: 3706-3732. https://doi.org/10.3390/md12063706